 |
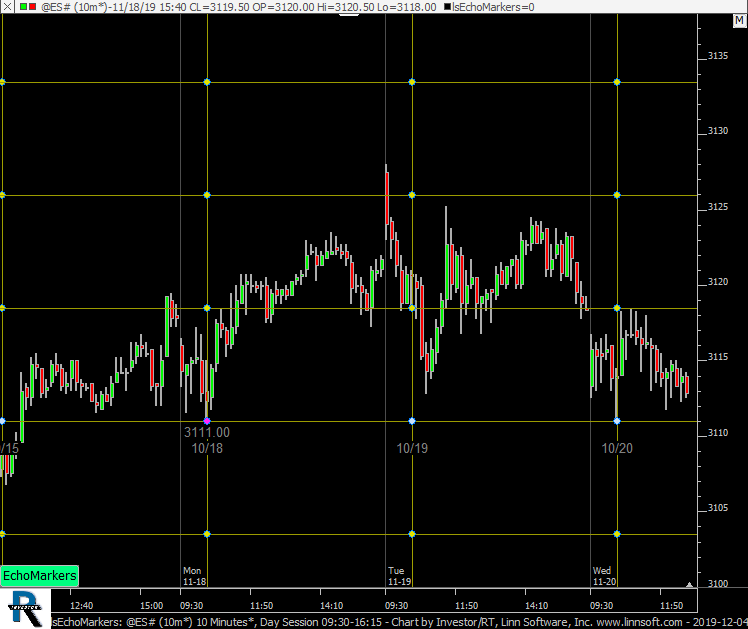
lsEchoMarkers (@ES#) cpayne [totalcount]
6 years 7 months ago
EchoMarkers (RTX). This chart was uploaded by Investor/RT 14.1.5 showing symbol: @ES#. |
View |
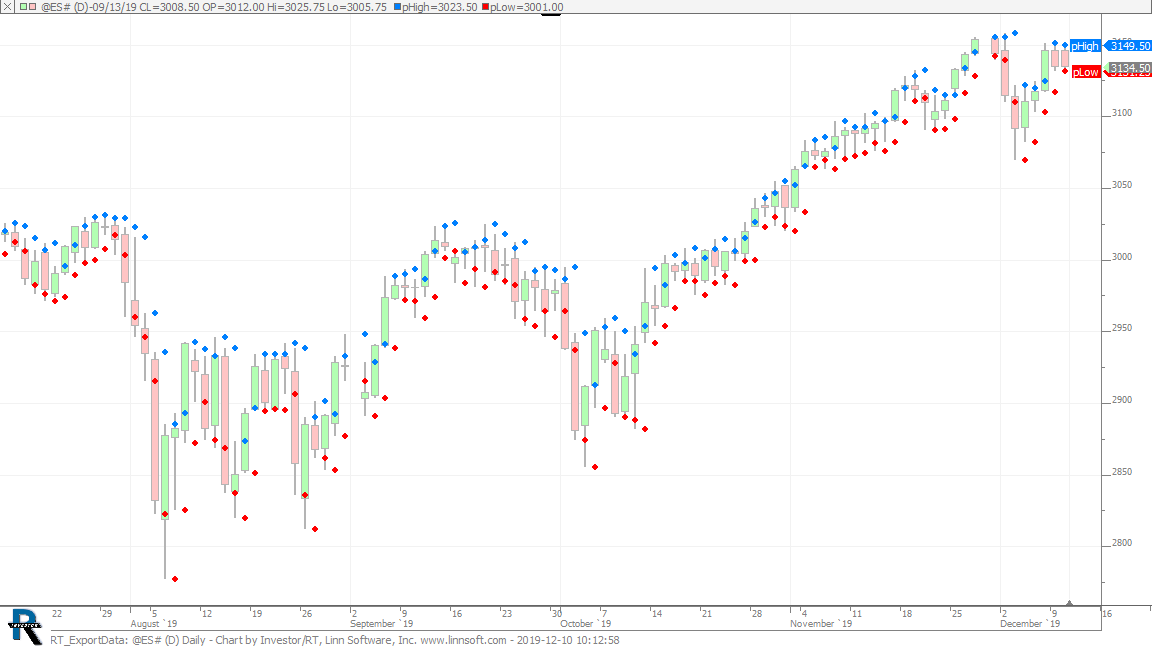 |
RT ExportData (@ES#) cpayne [totalcount]
6 years 7 months ago
Export Chart Data - Prev High and Low. This chart was uploaded by Investor/RT 14.1.5 showing symbol: @ES#. |
View |
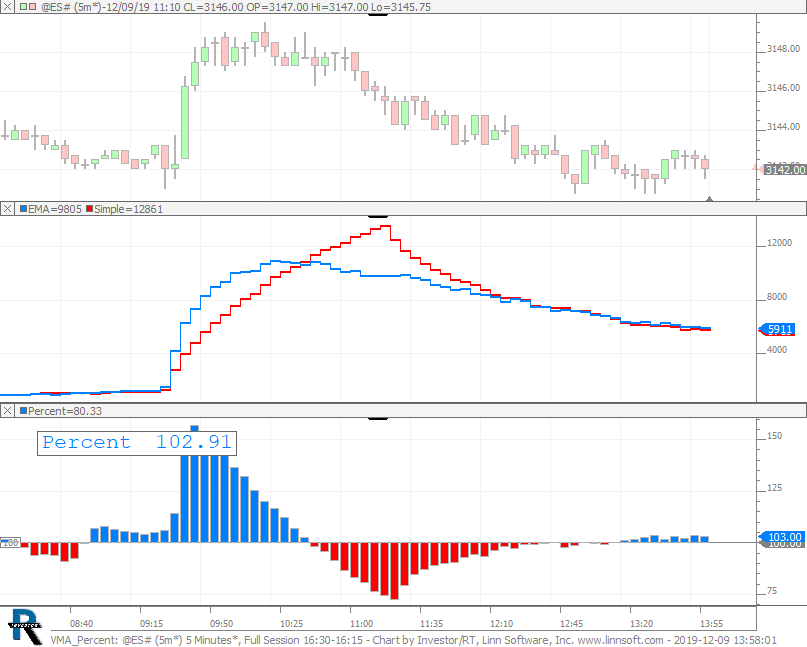 |
VMA Percent (@ES#) cpayne [totalcount]
6 years 7 months ago
Percent of Exp VMA vs Simple VMA. This chart was uploaded by Investor/RT 14.1.5 showing symbol: @ES#. |
View |
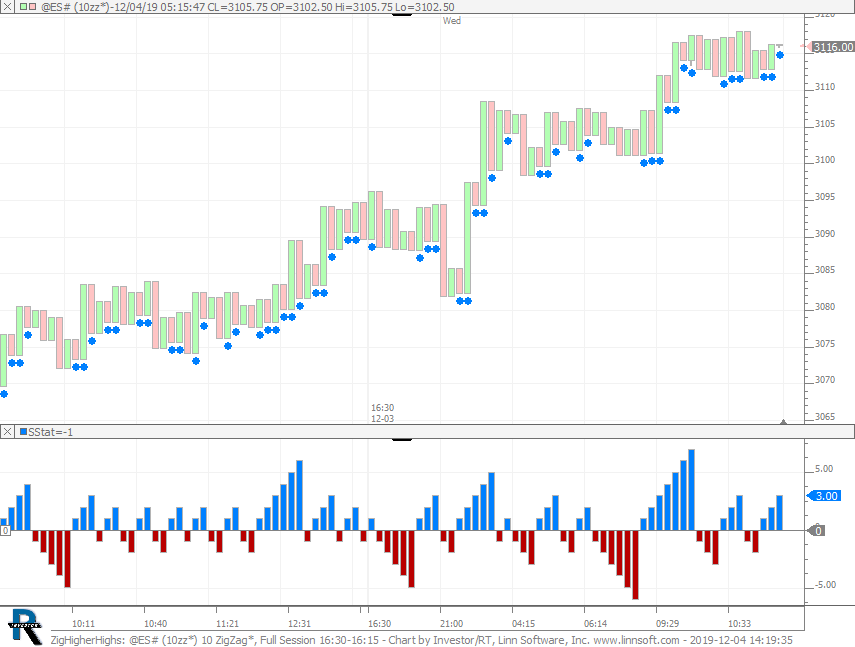 |
ZigHigherHighs (@ES#) cpayne [totalcount]
6 years 7 months ago
This chart was uploaded by Investor/RT 14.1.5 showing symbol: @ES#. |
View |
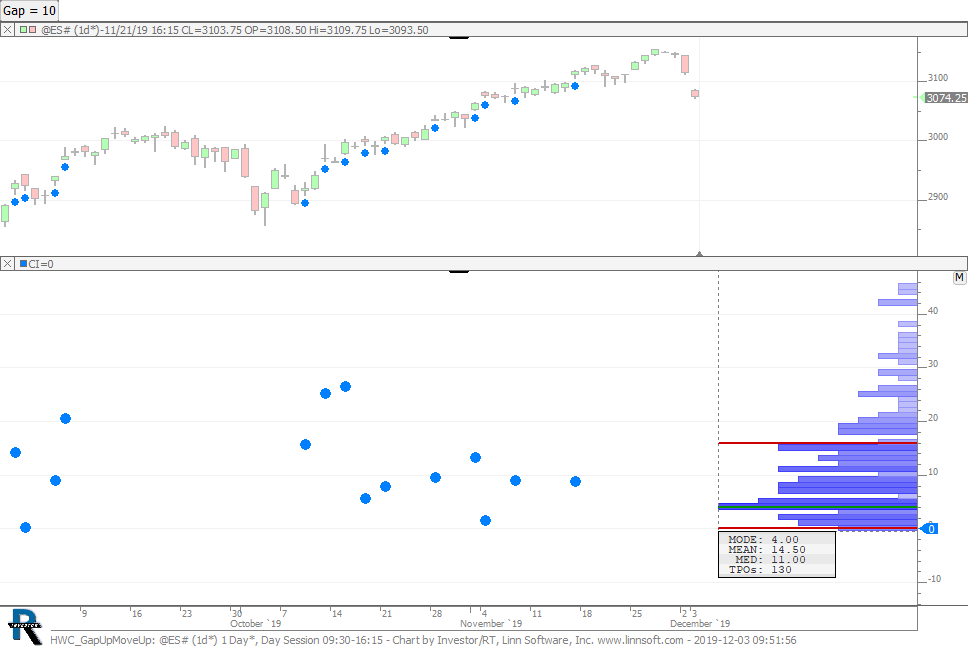 |
HWC GapUpMoveUp (@ES#) cpayne [totalcount]
6 years 7 months ago
Identifies 10 point gaps up (adjust with button) and then plots the max move made durign the following session on days where there was a gap up. |
View |
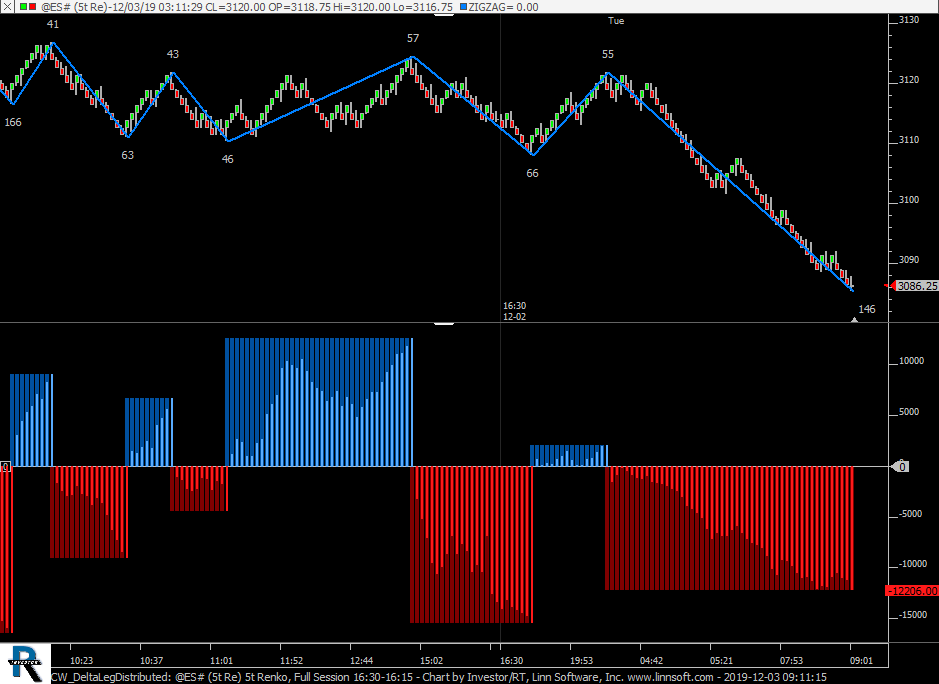 |
CW DeltaLegDistributed (@ES#) cpayne [totalcount]
6 years 7 months ago
Delta of each leg is spread out over all the bars of the leg (in addition to showing the developing delta of the leg). |
View |
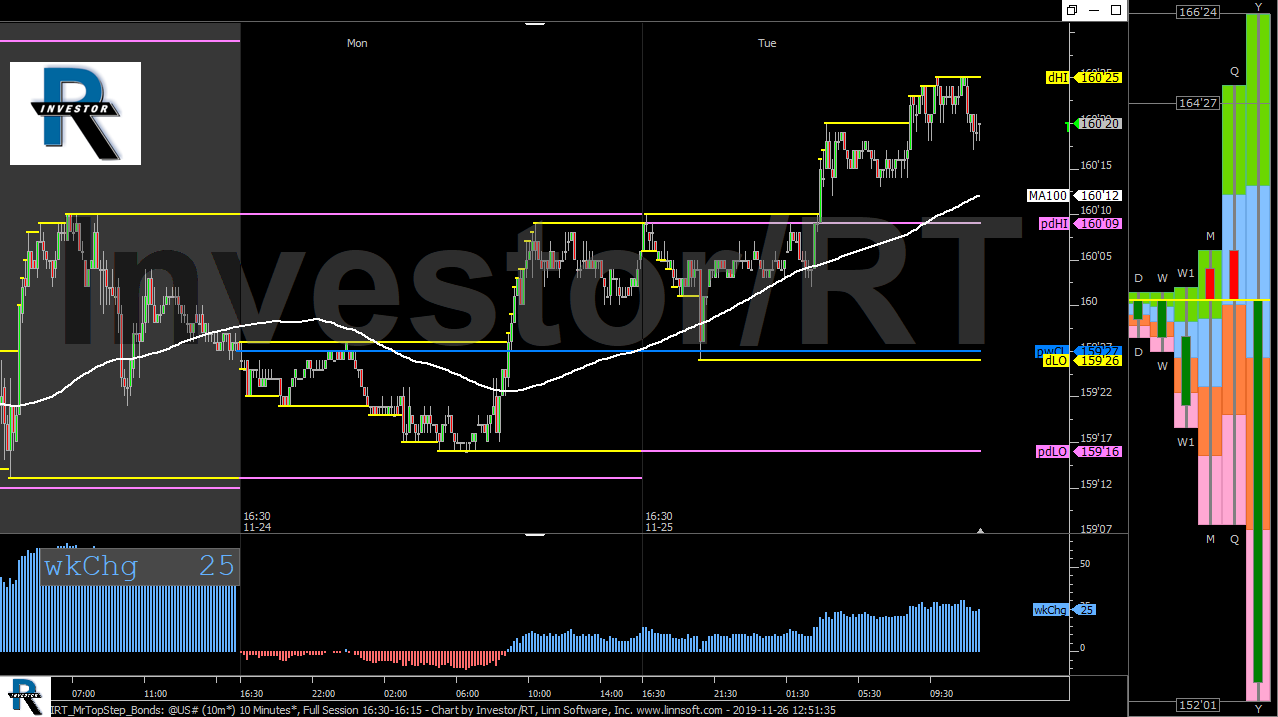 |
IRT MrTopStep Bonds (@US#) cpayne [totalcount]
6 years 7 months ago
This Investor/RT chart of the Bonds is a 10 minute chart showing with previous Friday highlighted in gray. |
View |
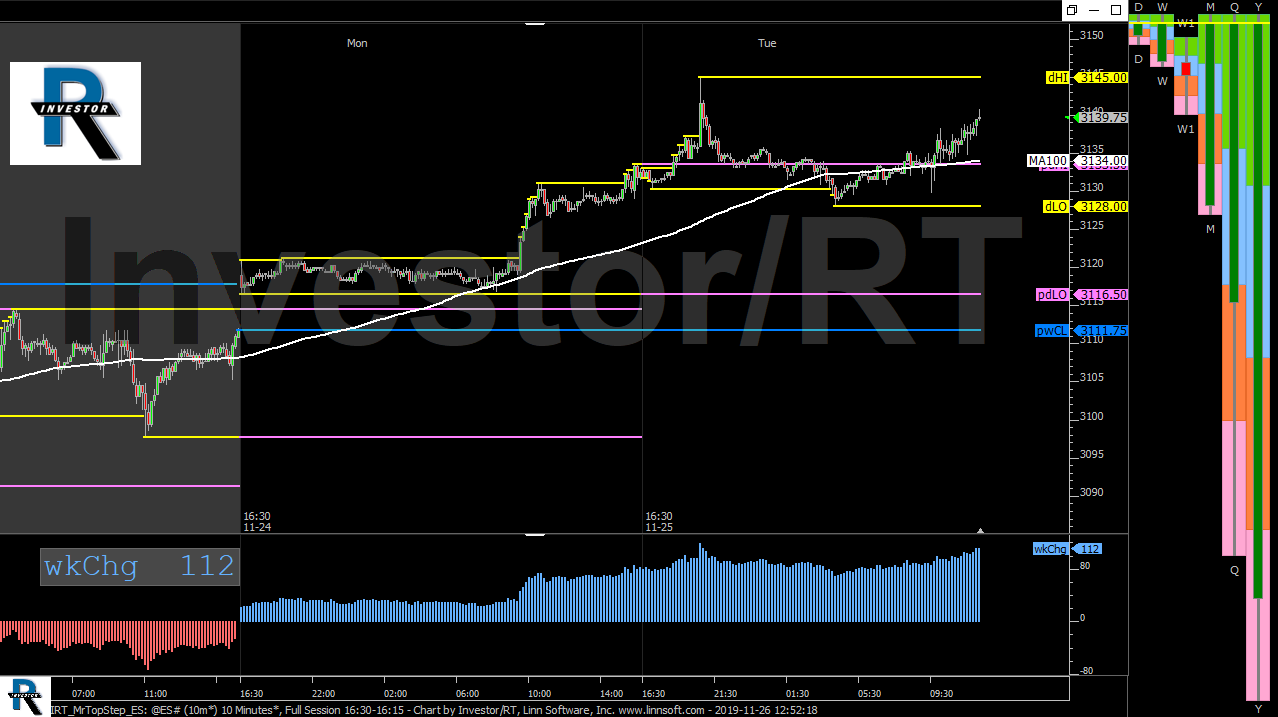 |
IRT MrTopStep ES (@ES#) cpayne [totalcount]
6 years 7 months ago
This Investor/RT chart of the ES is a 10 minute chart showing with previous Friday highlighted in gray. |
View |
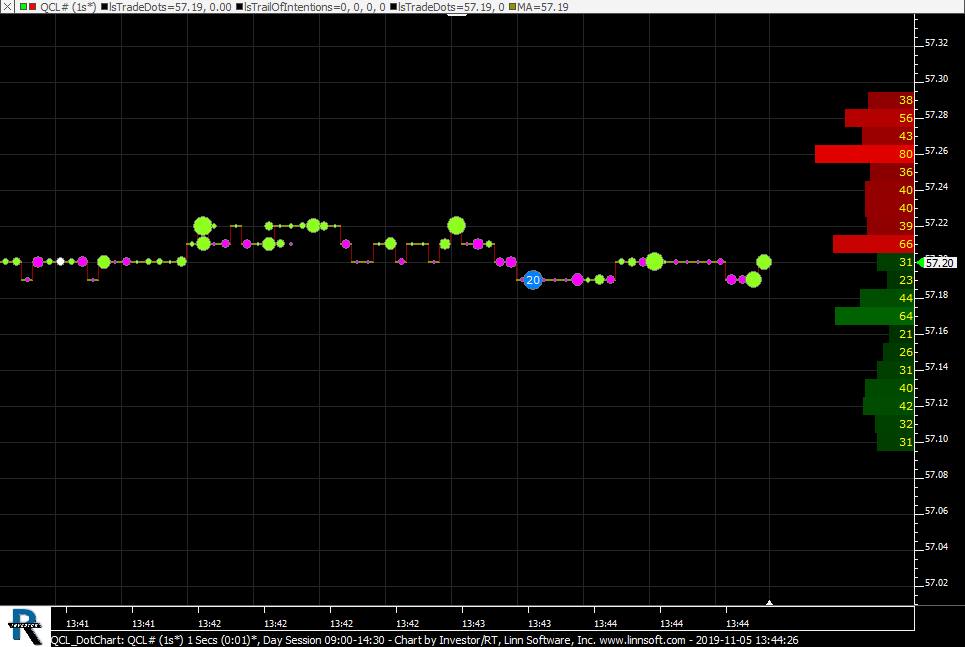 |
QCL DotChart (QCL#) cpayne [totalcount]
6 years 8 months ago
This chart was uploaded by Investor/RT 13.6.5 showing symbol: QCL#. |
View |
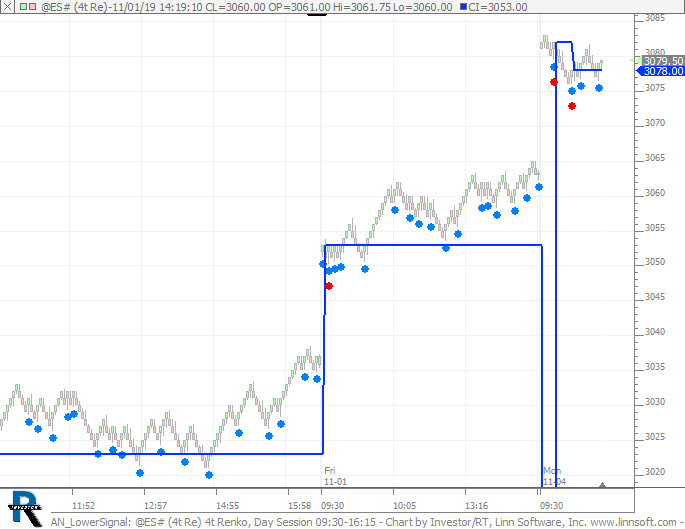 |
AN LowerSignal (@ES#) cpayne [totalcount]
6 years 8 months ago
This chart was uploaded by Investor/RT 13.6.5 showing symbol: @ES#. |
View |
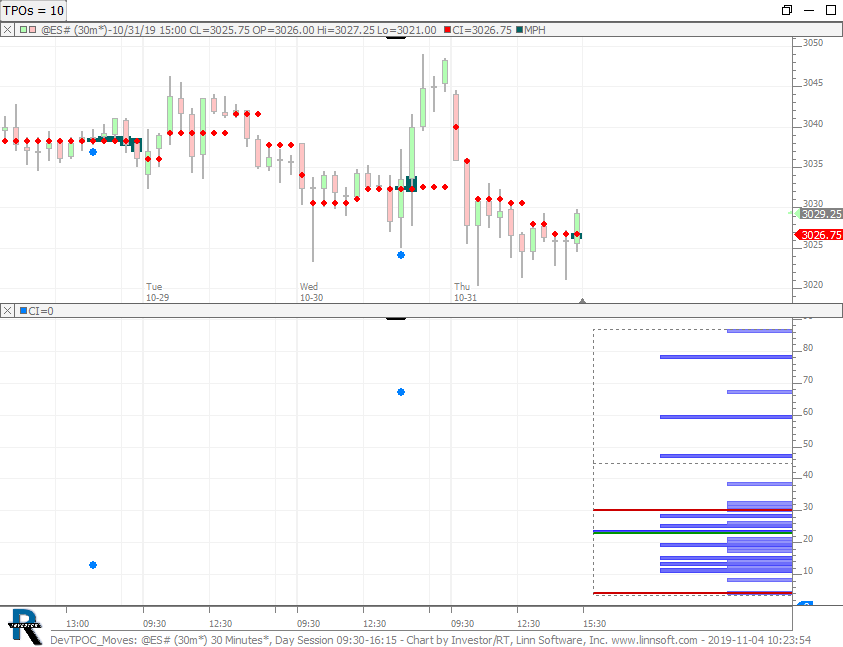 |
DevTPOC Moves (@ES#) cpayne [totalcount]
6 years 8 months ago
This chart was uploaded by Investor/RT 13.6.5 showing symbol: @ES#. |
View |
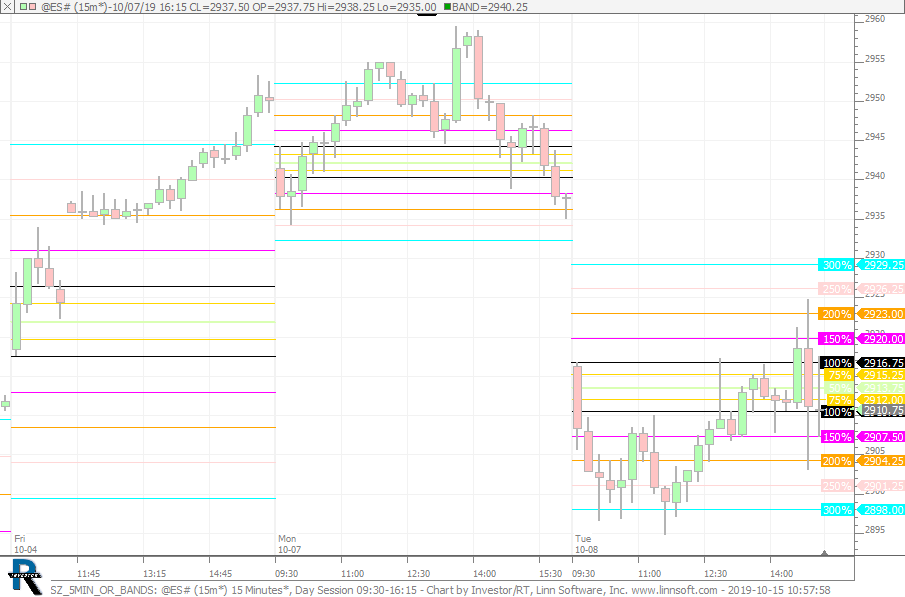 |
SZ 5MIN OR BANDS (@ES#) cpayne [totalcount]
6 years 9 months ago
Bands off 1st 5min of session. This chart was uploaded by Investor/RT 13.6.5 showing symbol: @ES#. |
View |
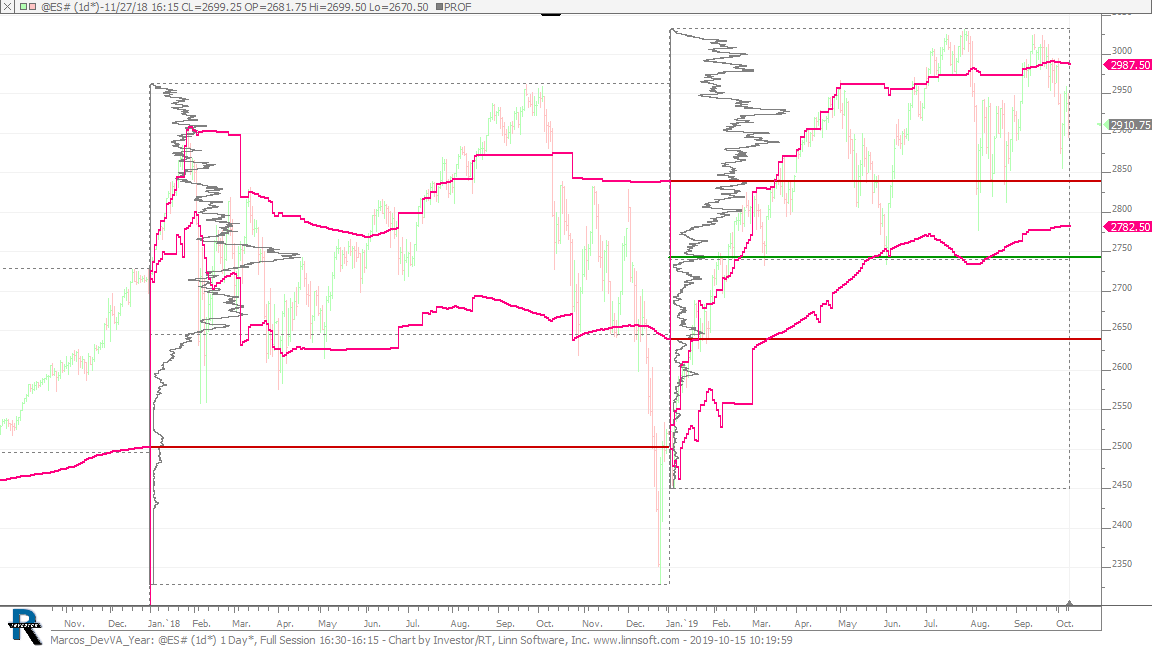 |
Marcos DevVA Year (@ES#) cpayne [totalcount]
6 years 9 months ago
Yearly Developing Value Area. This chart was uploaded by Investor/RT 13.6.5 showing symbol: @ES#. |
View |
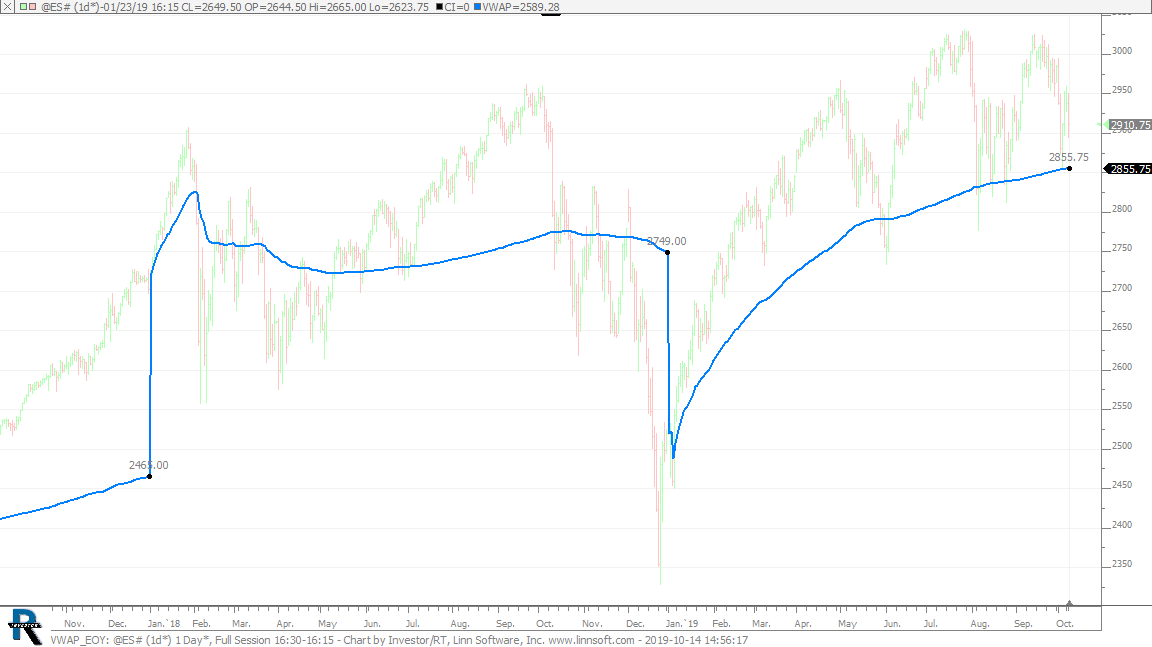 |
VWAP EOY (@ES#) cpayne [totalcount]
6 years 9 months ago
End of Year VWAP. This chart was uploaded by Investor/RT 13.6.5 showing symbol: @ES#. |
View |
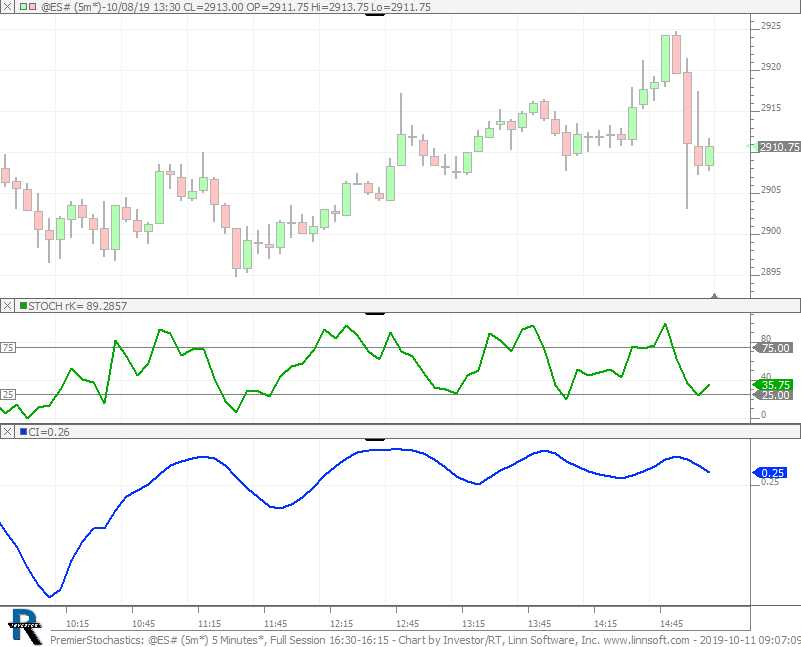 |
PremierStochastics (@ES#) cpayne [totalcount]
6 years 9 months ago
Premier Stochastics. This chart was uploaded by Investor/RT 13.6.4 showing symbol: @ES#. |
View |
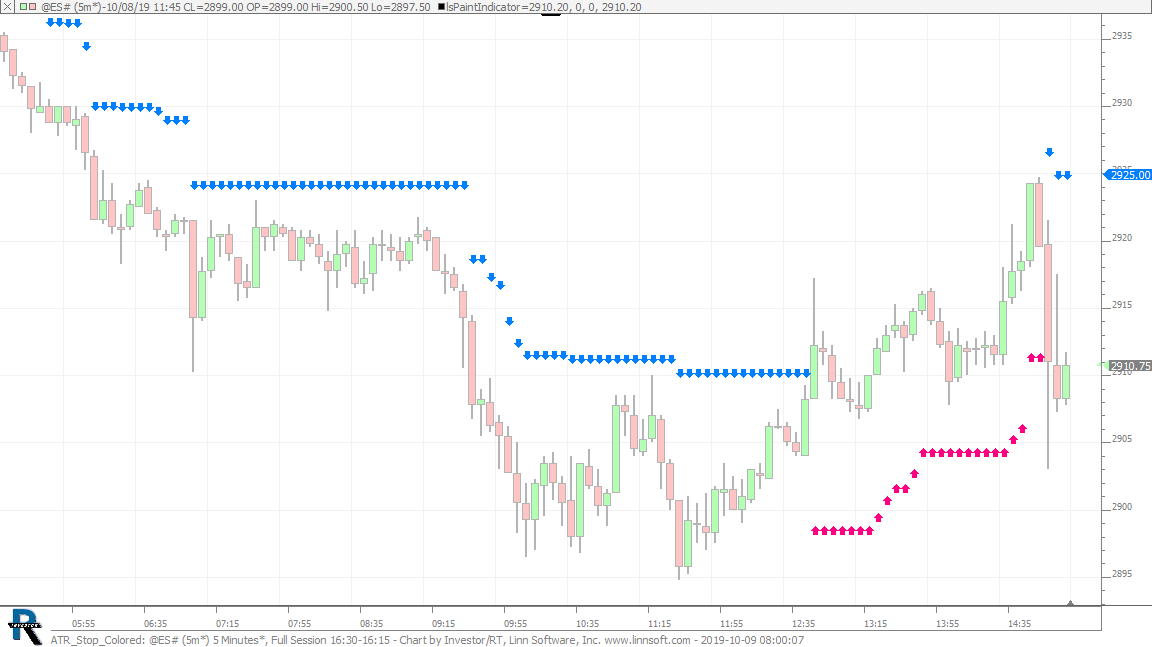 |
ATR Stop Colored (@ES#) cpayne [totalcount]
6 years 9 months ago
This chart was uploaded by Investor/RT 13.6.1 showing symbol: @ES#. |
View |
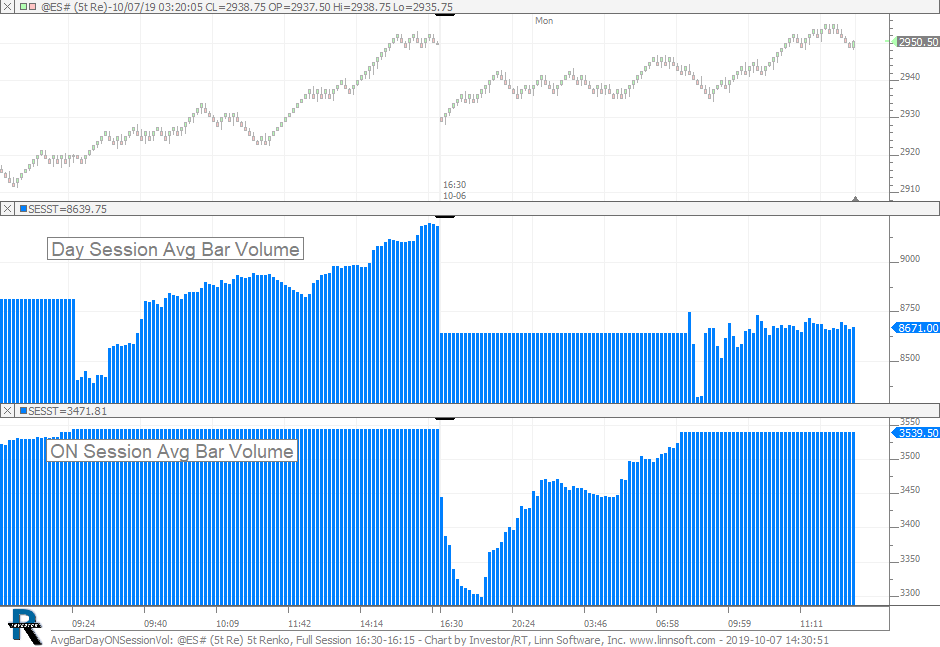 |
AvgBarDayONSessionVol (@ES#) cpayne [totalcount]
6 years 9 months ago
This chart was uploaded by Investor/RT 13.6.1 showing symbol: @ES#. |
View |
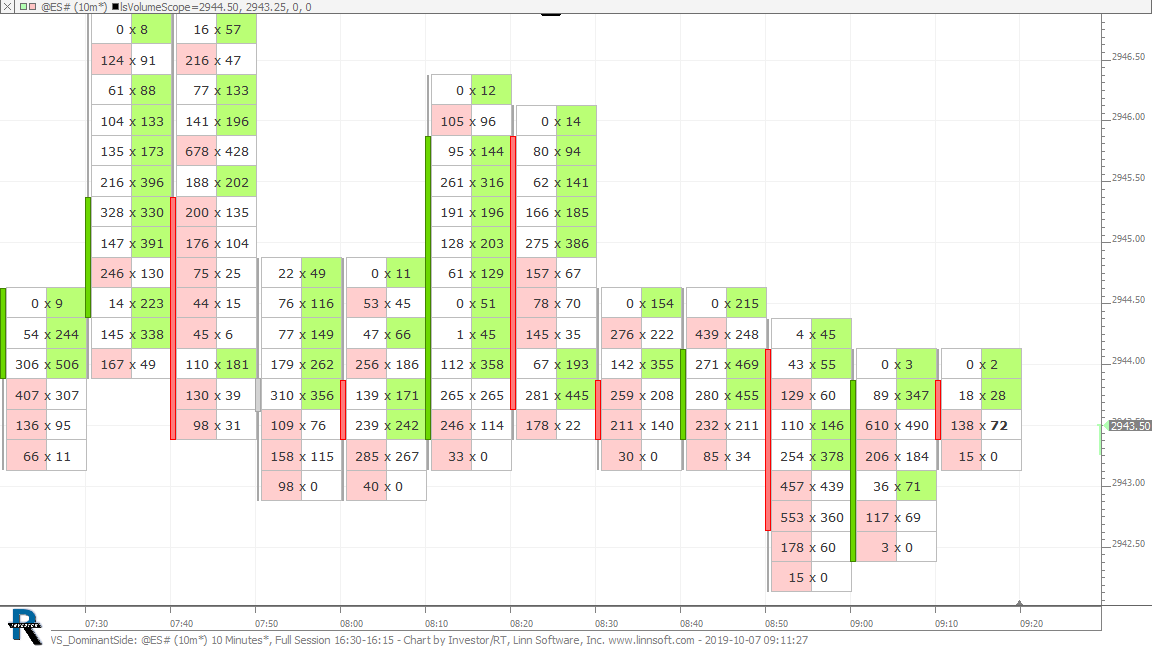 |
VS DominantSide (@ES#) cpayne [totalcount]
6 years 9 months ago
This chart was uploaded by Investor/RT 13.6.1 showing symbol: @ES#. |
View |
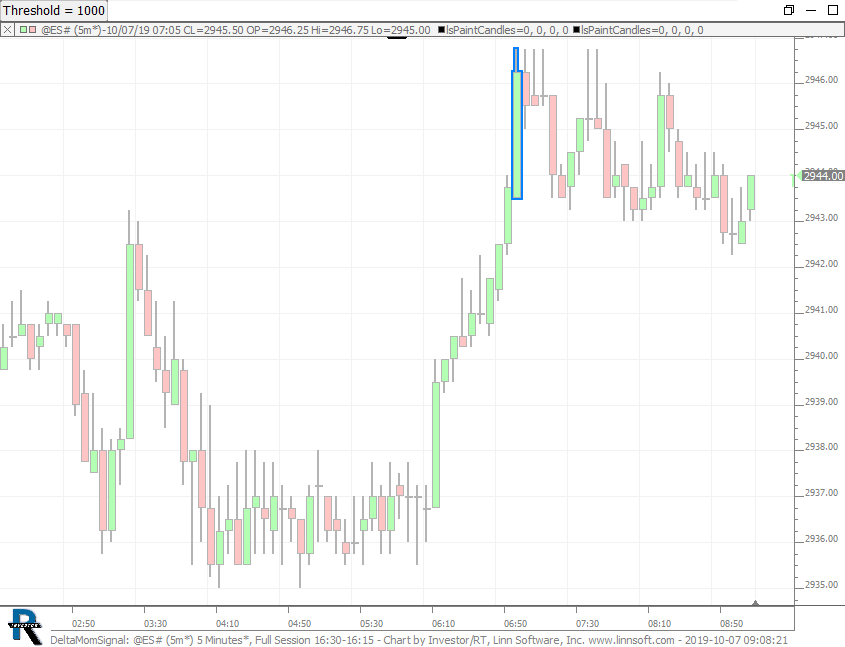 |
DeltaMomSignal (@ES#) cpayne [totalcount]
6 years 9 months ago
Delta Momentum Signals. This chart was uploaded by Investor/RT 13.6.1 showing symbol: @ES#. |
View |
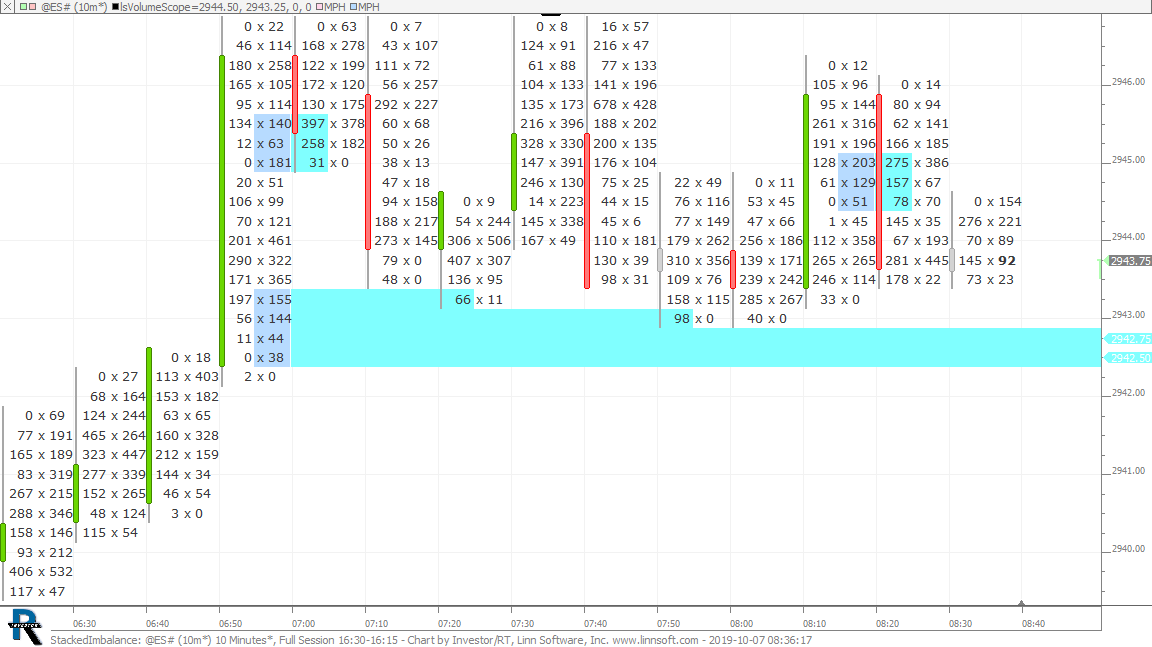 |
StackedImbalance (@ES#) cpayne [totalcount]
6 years 9 months ago
Stacked Imbalance. This chart was uploaded by Investor/RT 13.6.1 showing symbol: @ES#. |
View |
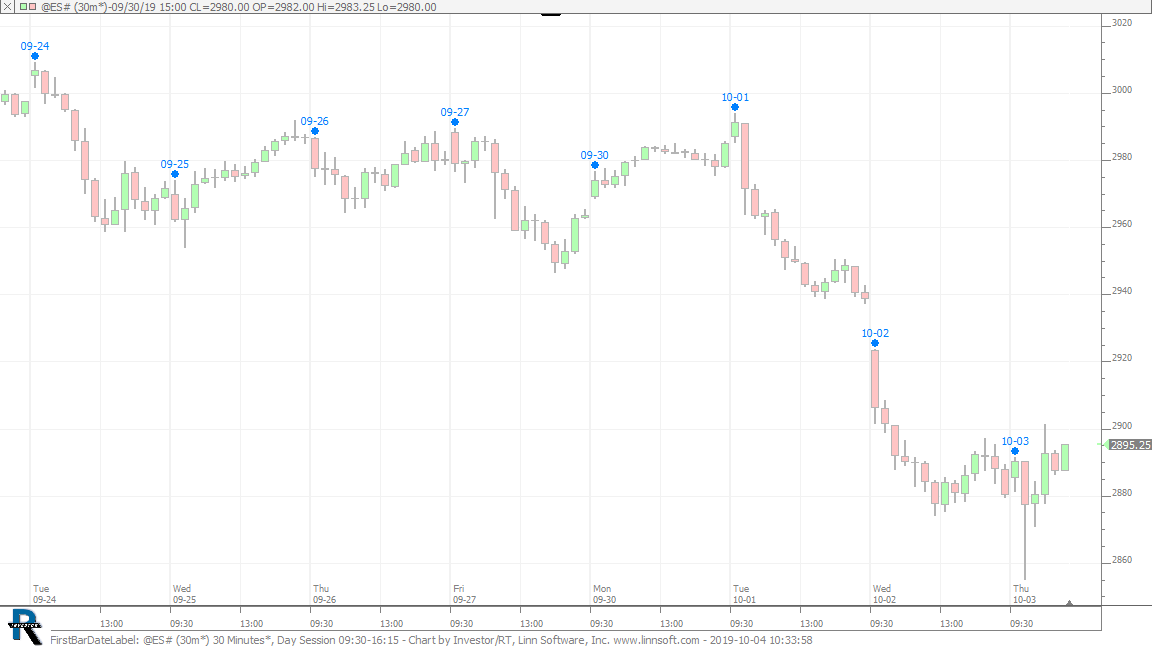 |
FirstBarDateLabel (@ES#) cpayne [totalcount]
6 years 9 months ago
1st Bar Labelled with Date. This chart was uploaded by Investor/RT 13.6.1 showing symbol: @ES#. |
View |
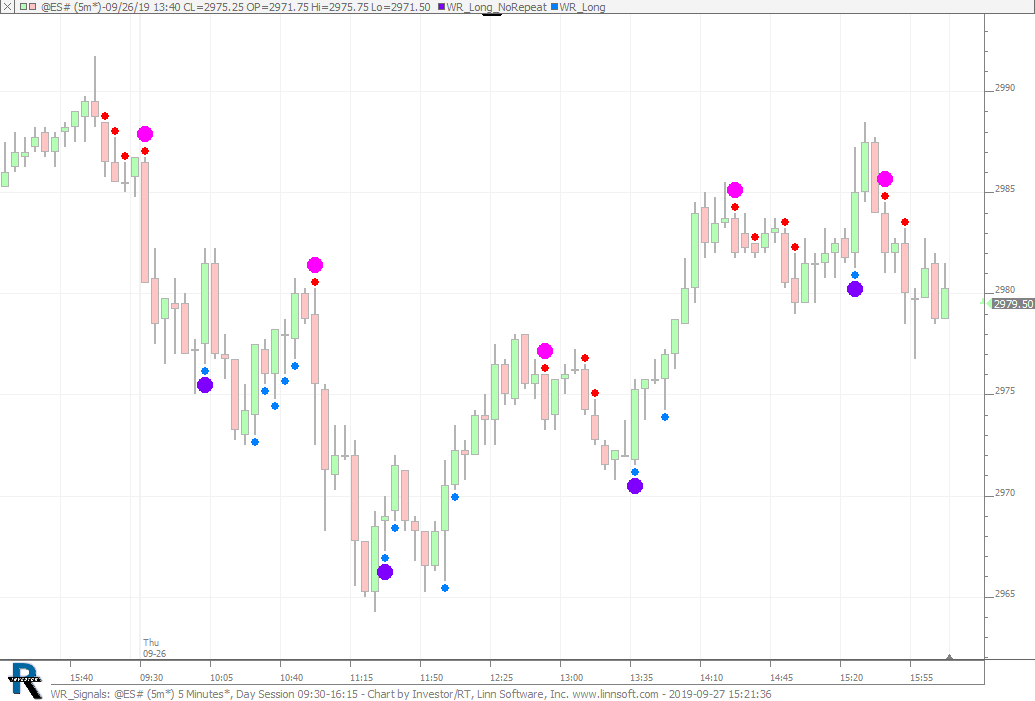 |
WR Signals (@ES#) cpayne [totalcount]
6 years 9 months ago
Wade Romine - How to alternate signals... This chart was uploaded by Investor/RT 13.6.1 showing symbol: @ES#. |
View |
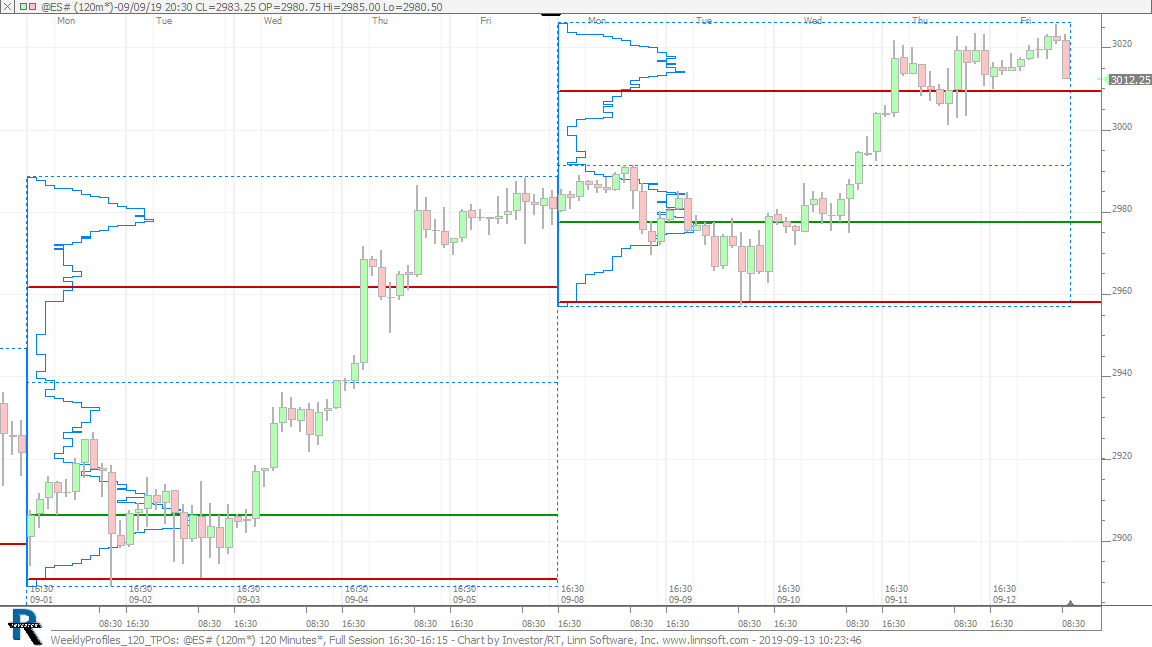 |
WeeklyProfiles 120 TPOs (@ES#) cpayne [totalcount]
6 years 10 months ago
Weekly Time-Based Profiles with 120 Minute TPOs. This chart was uploaded by Investor/RT 13.6.1 showing symbol: @ES#. |
View |
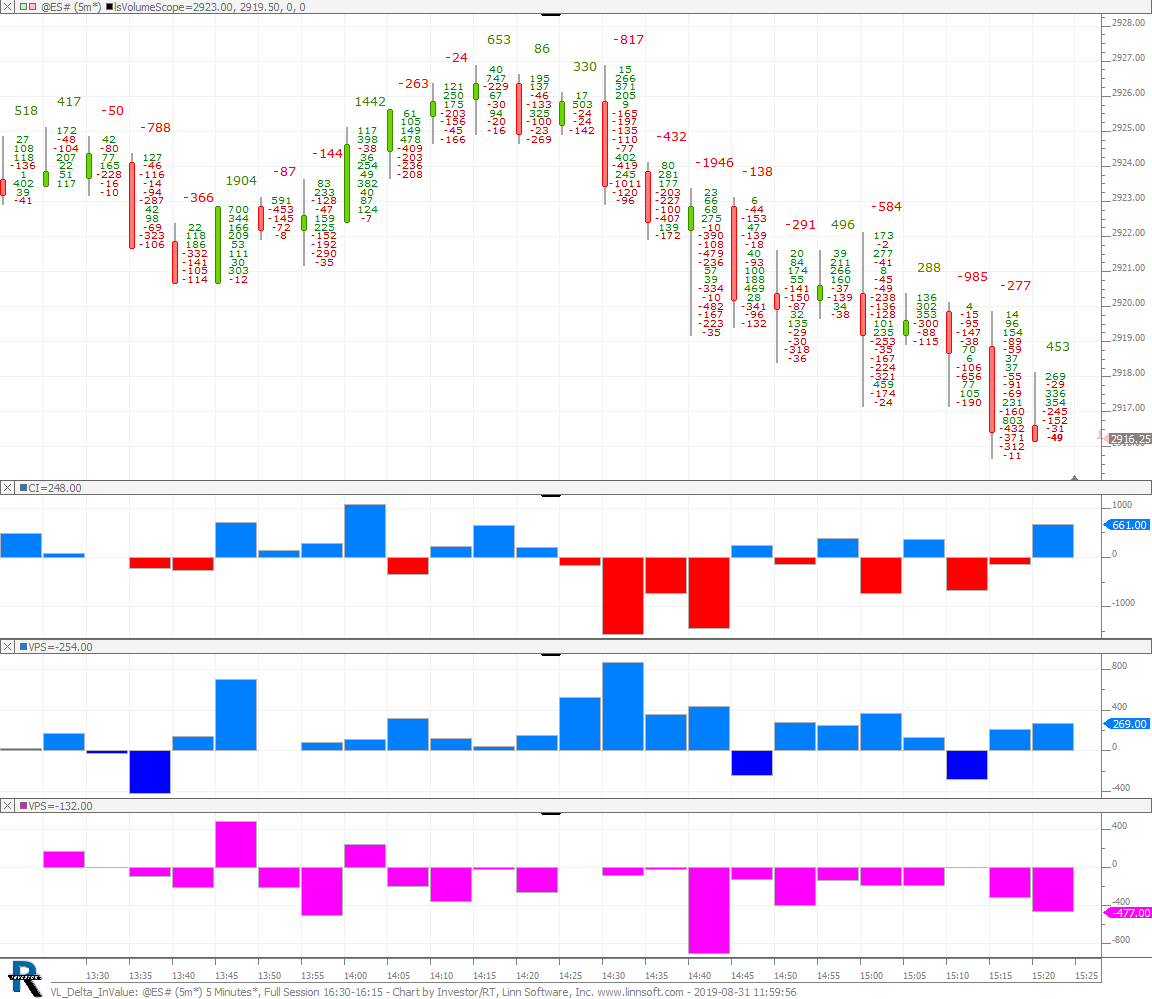 |
VL Delta InValue (@ES#) cpayne [totalcount]
6 years 10 months ago
Delta In Value Area of each Bar. This chart was uploaded by Investor/RT 13.6.1 showing symbol: @ES#. |
View |
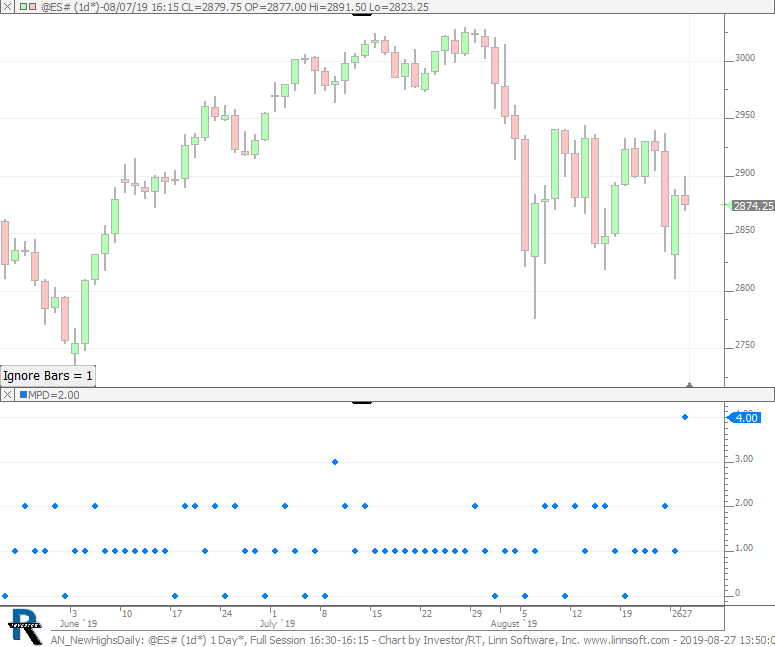 |
AN NewHighsDaily (@ES#) cpayne [totalcount]
6 years 10 months ago
This chart was uploaded by Investor/RT 14.1.1 showing symbol: @ES#. |
View |