 |
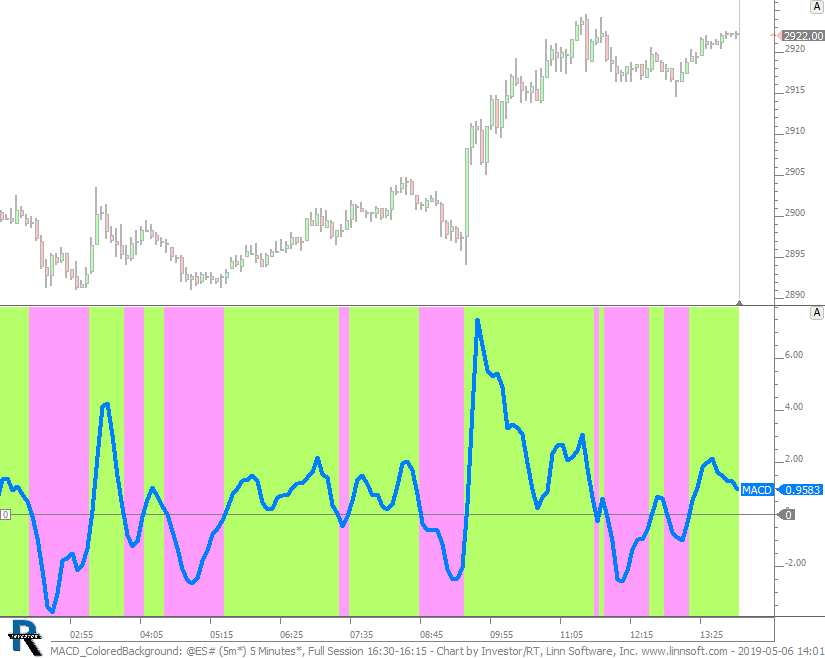
MACD ColoredBackground (@ES#) cpayne [totalcount]
7 years 2 months ago
This chart was uploaded by Investor/RT 13.5.24 showing symbol: @ES#. |
View |
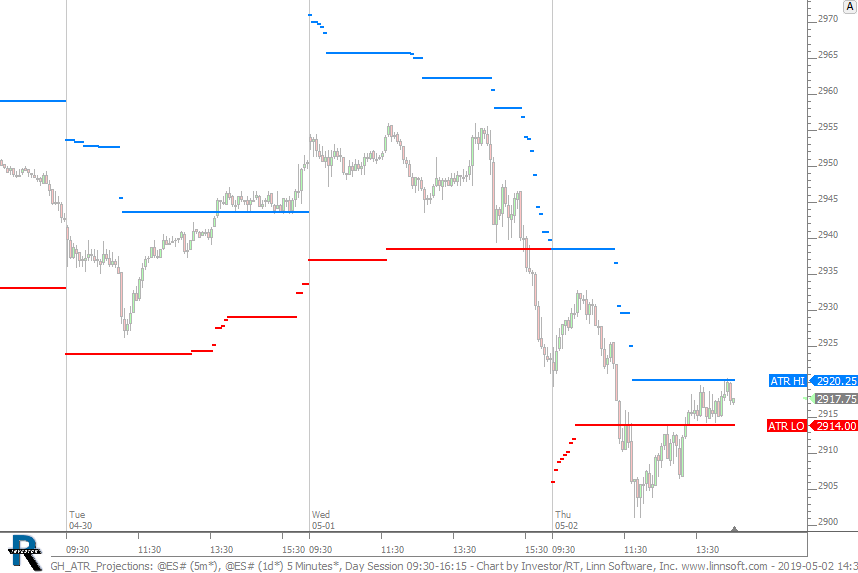 |
GH ATR Projections (@ES#) cpayne [totalcount]
7 years 2 months ago
Projected ATR High and Low. This chart was uploaded by Investor/RT 13.5.24 showing symbol: @ES#. |
View |
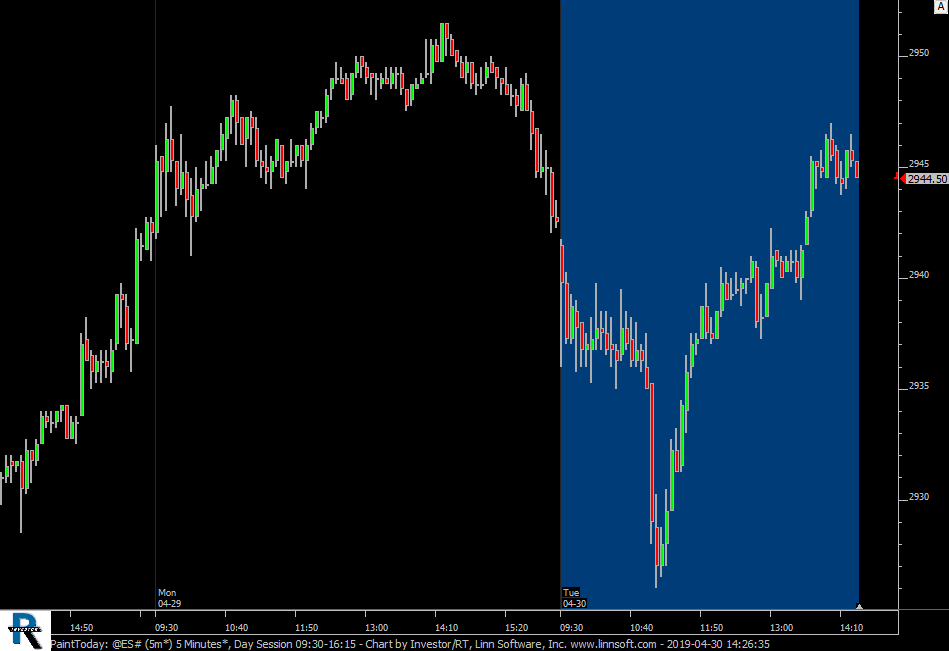 |
PaintToday (@ES#) cpayne [totalcount]
7 years 2 months ago
Paint Today Only. This chart was uploaded by Investor/RT 13.5.24 showing symbol: @ES#. |
View |
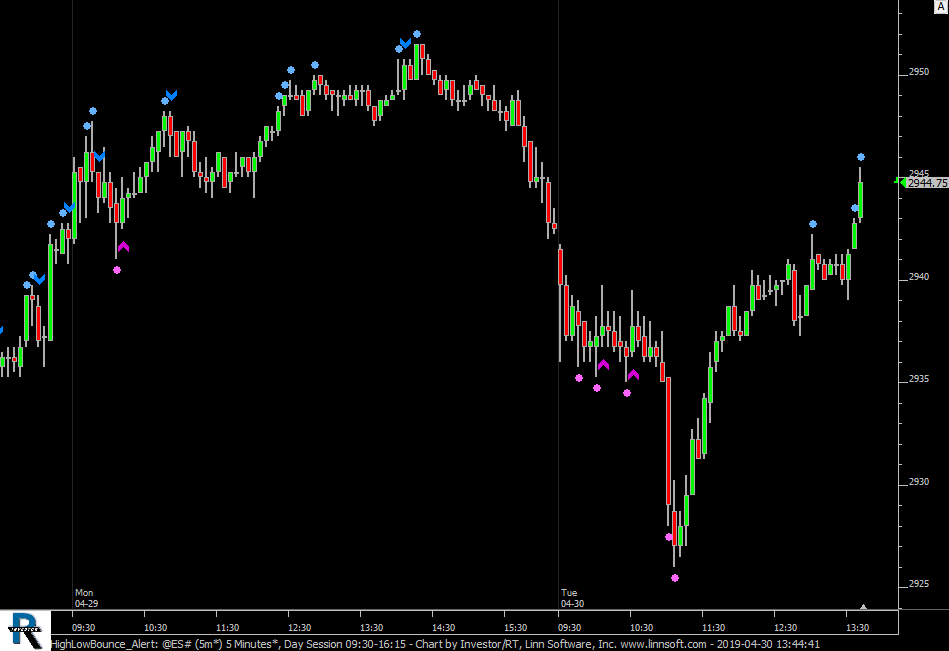 |
HighLowBounce Alert (@ES#) cpayne [totalcount]
7 years 2 months ago
New High and Low and Bounce Alerts. This chart was uploaded by Investor/RT 13.5.24 showing symbol: @ES#. |
View |
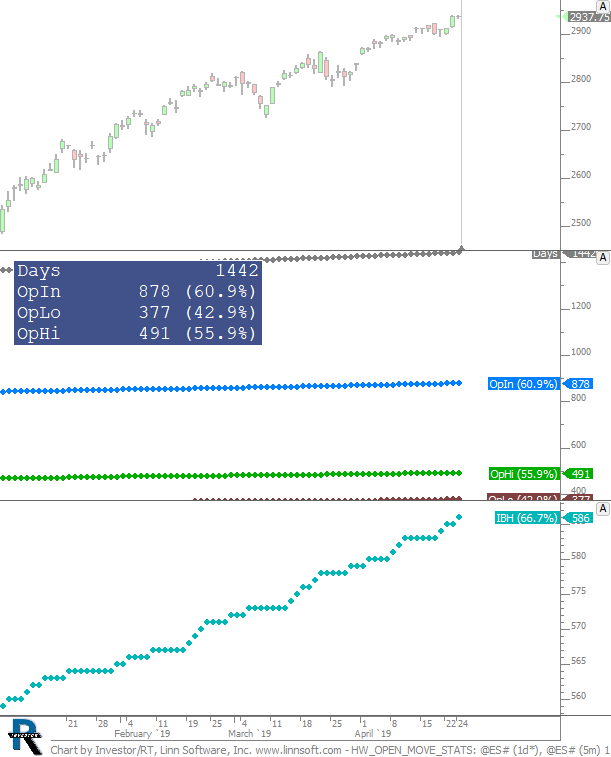 |
HW OPEN MOVE STATS (@ES#) cpayne [totalcount]
7 years 2 months ago
This chart was uploaded by Investor/RT 13.5.24 showing symbol: @ES#. |
View |
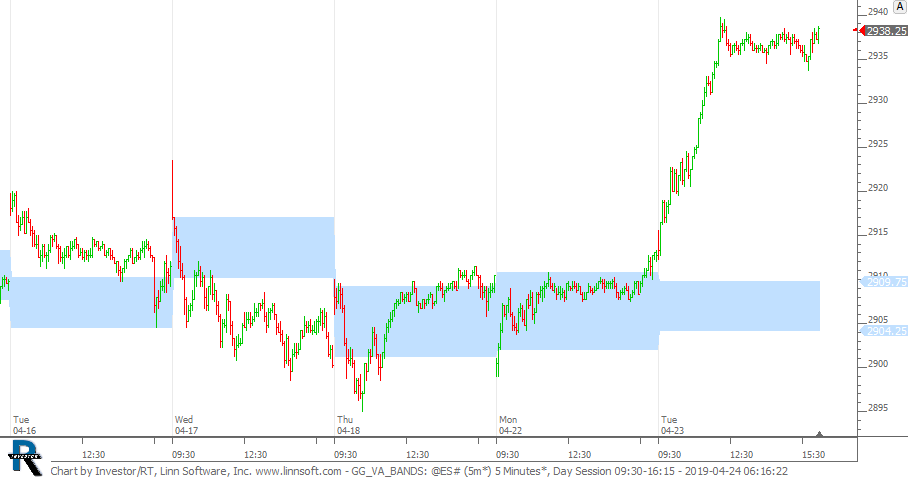 |
GG VA BANDS (@ES#) cpayne [totalcount]
7 years 2 months ago
Value Area Bands. This chart was uploaded by Investor/RT 13.5.24 showing symbol: @ES#. |
View |
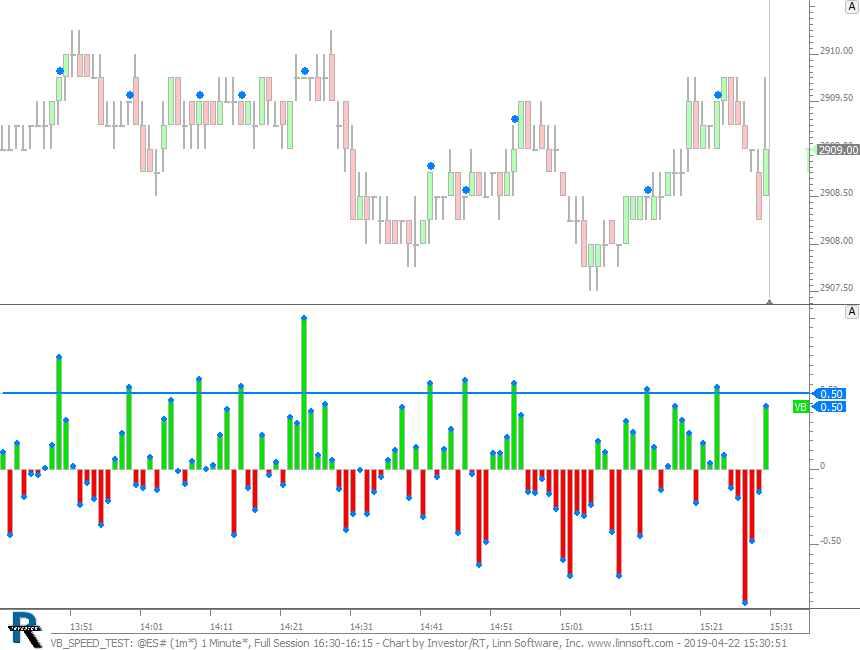 |
VB Speed Test (@ES#) cpayne [totalcount]
7 years 2 months ago
This chart was uploaded by Investor/RT 13.5.23 showing symbol: @ES#. |
View |
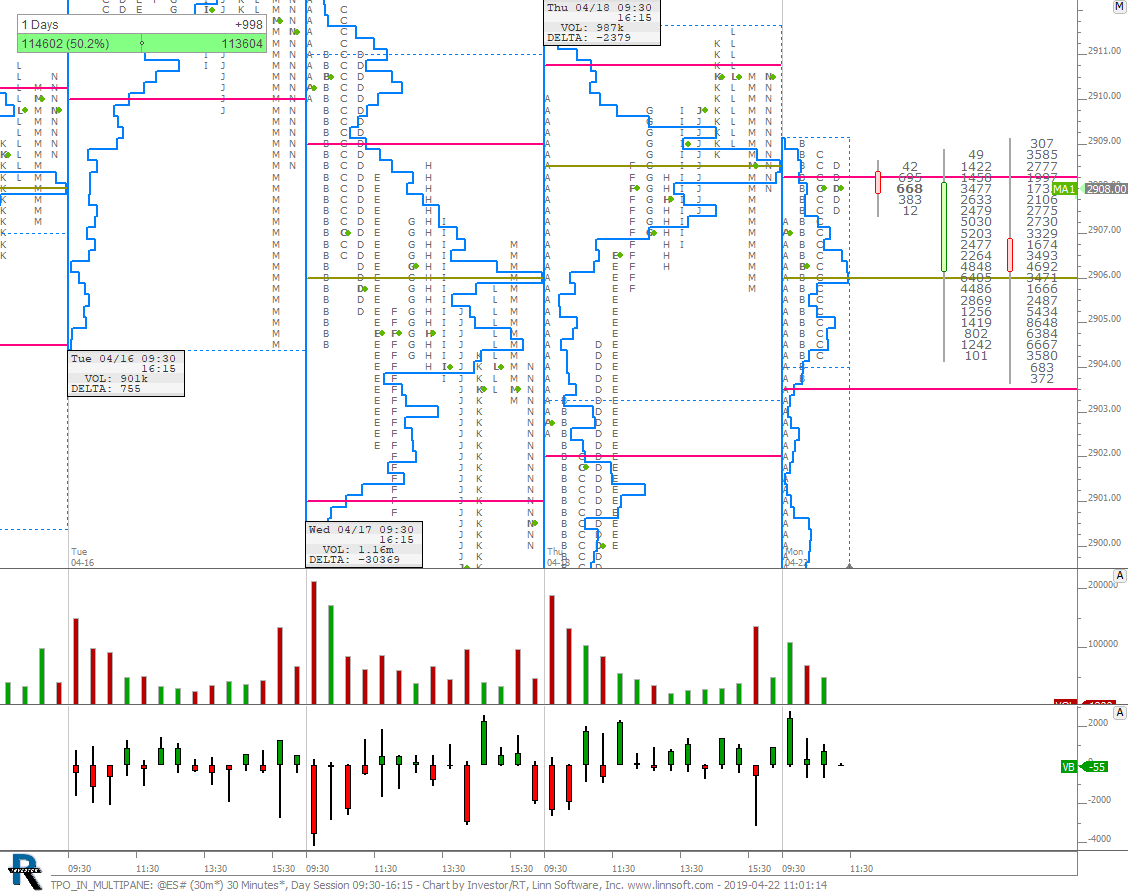 |
TPO IN MULTIPANE (@ES#) cpayne [totalcount]
7 years 2 months ago
This chart below gives you a small sample of some of the functionality this opens up to you when you use the Profile Indicator in Multi-Pane charts. |
View |
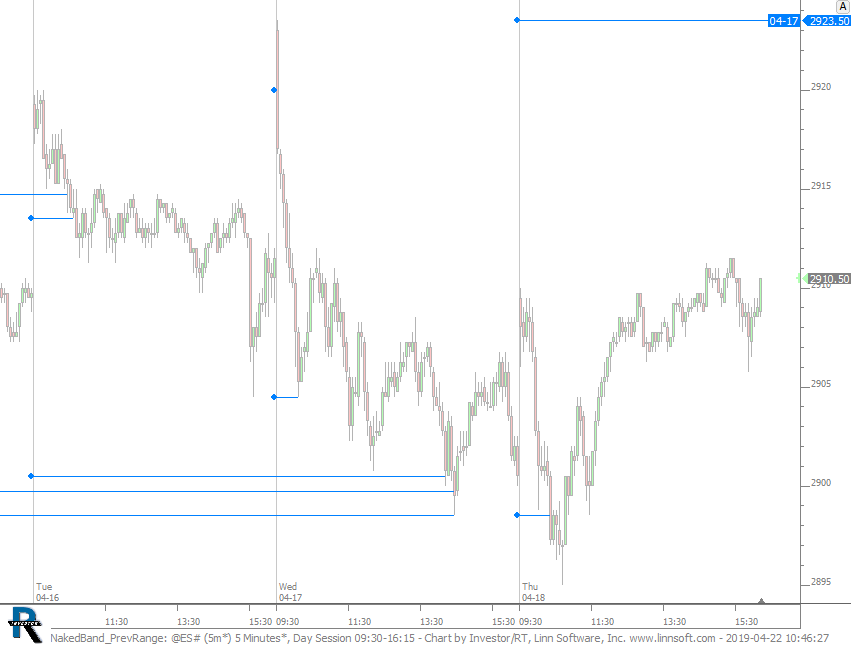 |
NakedBand PrevRange (@ES#) cpayne [totalcount]
7 years 2 months ago
Previous Days High and Low extended while naked. This chart was uploaded by Investor/RT 13.5.24 showing symbol: @ES#. |
View |
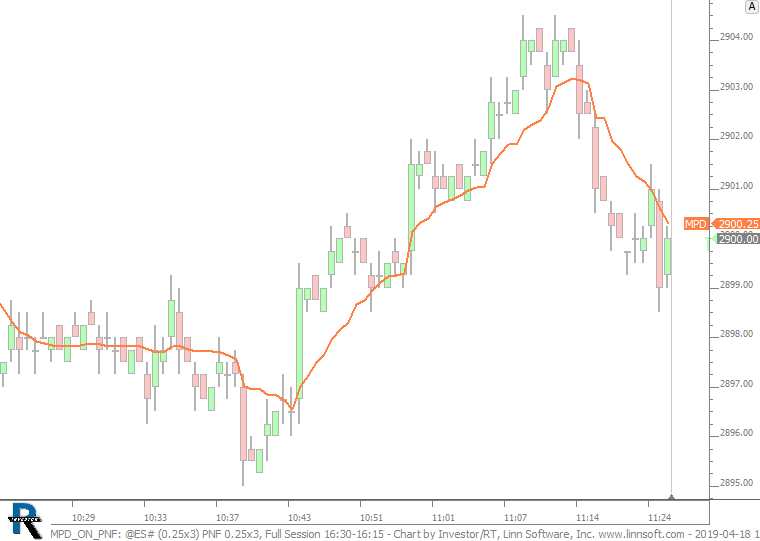 |
MPD ON PNF (@ES#) cpayne [totalcount]
7 years 2 months ago
This chart was uploaded by Investor/RT 13.5.24 showing symbol: @ES#. |
View |
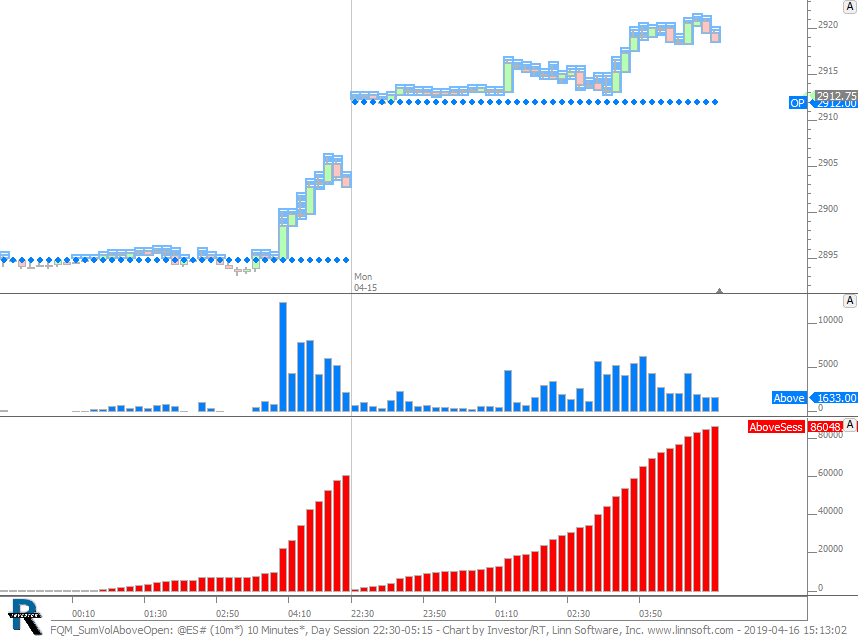 |
FQM SumVolAboveOpen (@ES#) cpayne [totalcount]
7 years 3 months ago
This chart was uploaded by Investor/RT 13.5.24 showing symbol: @ES#. |
View |
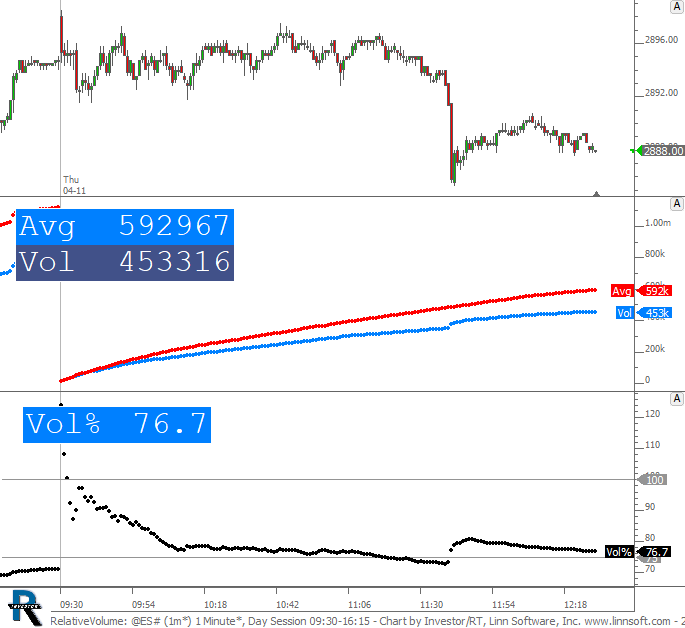 |
RelativeVolume (@ES#) cpayne [totalcount]
7 years 3 months ago
Relative Volume - Lower pane shows what percent of average volume we've achieved at each minute of the session. |
View |
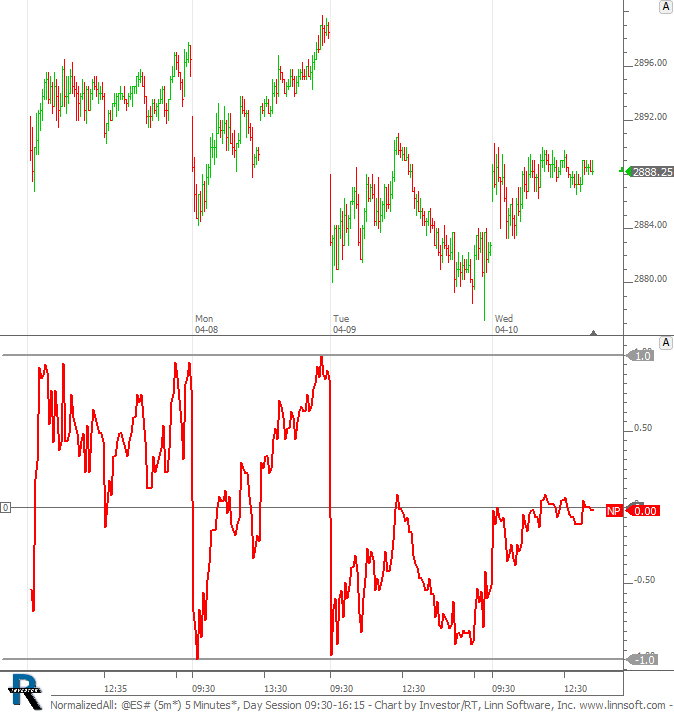 |
NormalizedAll (@ES#) cpayne [totalcount]
7 years 3 months ago
Normalized Price - Full Chart Range. This chart was uploaded by Investor/RT 13.5.24 showing symbol: @ES#. |
View |
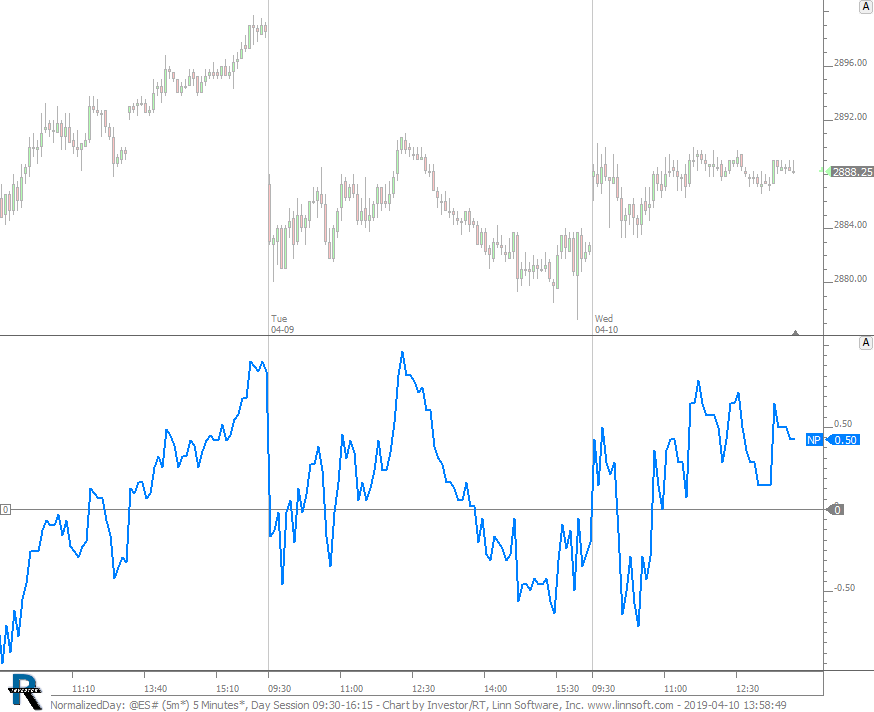 |
NormalizedDay (@ES#) cpayne [totalcount]
7 years 3 months ago
Normalized Price - Reset Each Day. This chart was uploaded by Investor/RT 13.5.24 showing symbol: @ES#. |
View |
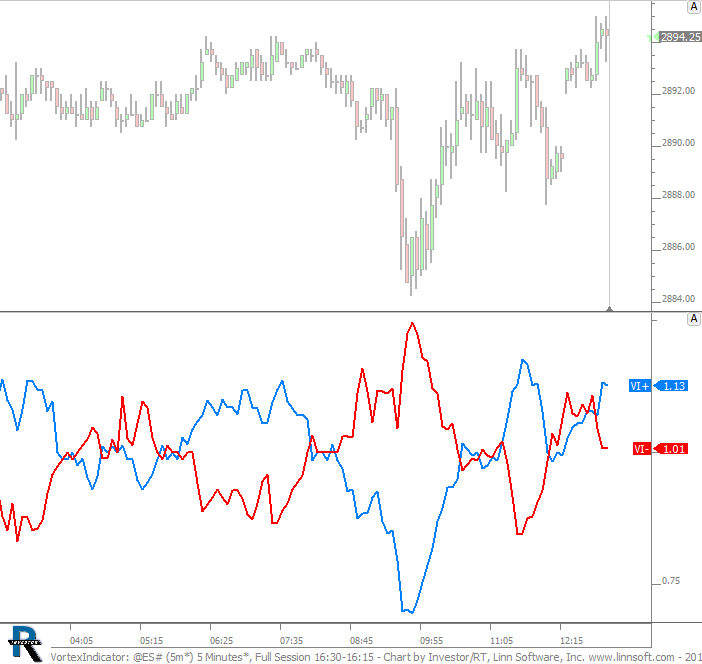 |
VortexIndicator (@ES#) cpayne [totalcount]
7 years 3 months ago
Vortex Indicator. This chart was uploaded by Investor/RT 13.5.24 showing symbol: @ES#. |
View |
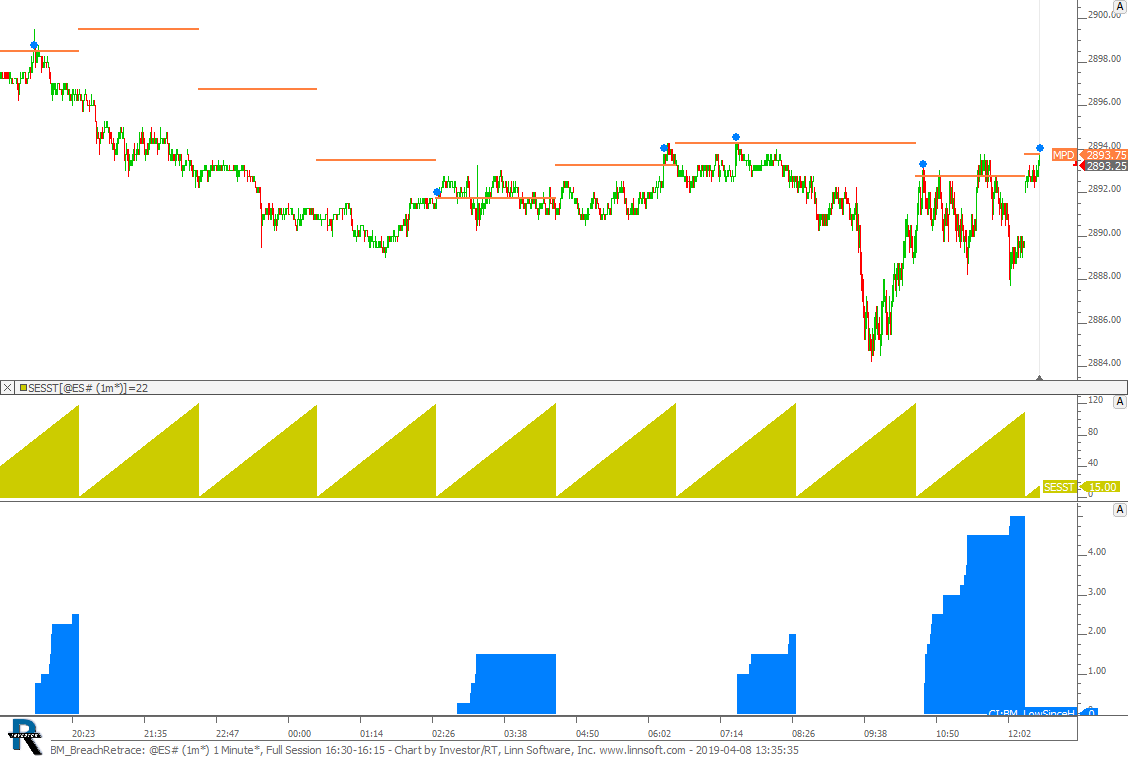 |
BM BreachRetrace (@ES#) cpayne [totalcount]
7 years 3 months ago
This chart was uploaded by Investor/RT 13.5.24 showing symbol: @ES#. |
View |
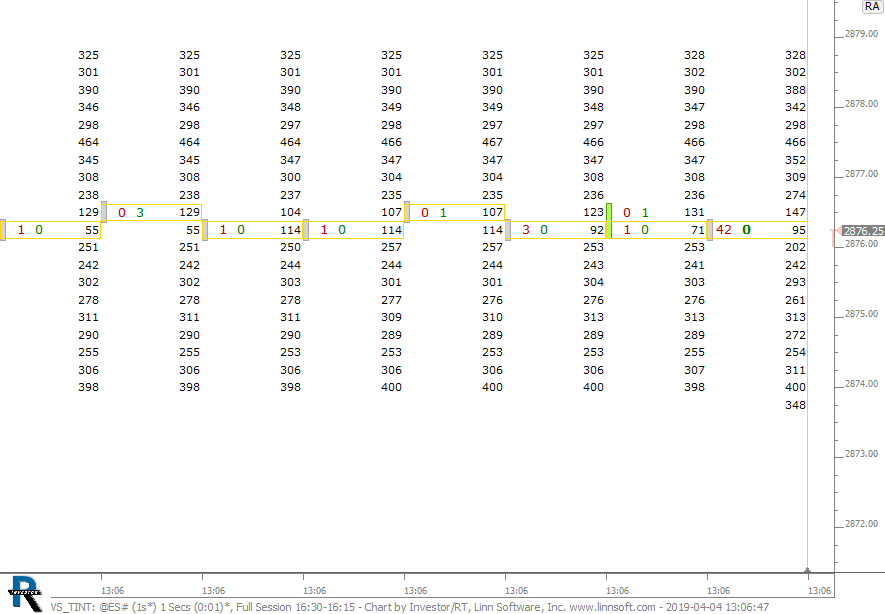 |
VS TINT (@ES#) cpayne [totalcount]
7 years 3 months ago
This chart was uploaded by Investor/RT 13.5.24 showing symbol: @ES#. |
View |
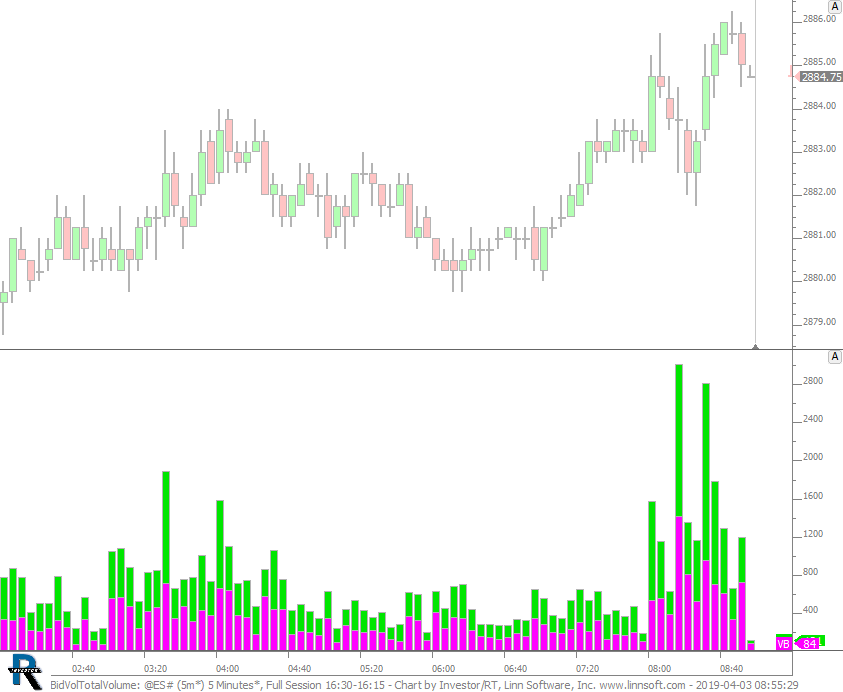 |
BidVolTotalVolume (@ES#) cpayne [totalcount]
7 years 3 months ago
This chart was uploaded by Investor/RT 13.5.24 showing symbol: @ES#. |
View |
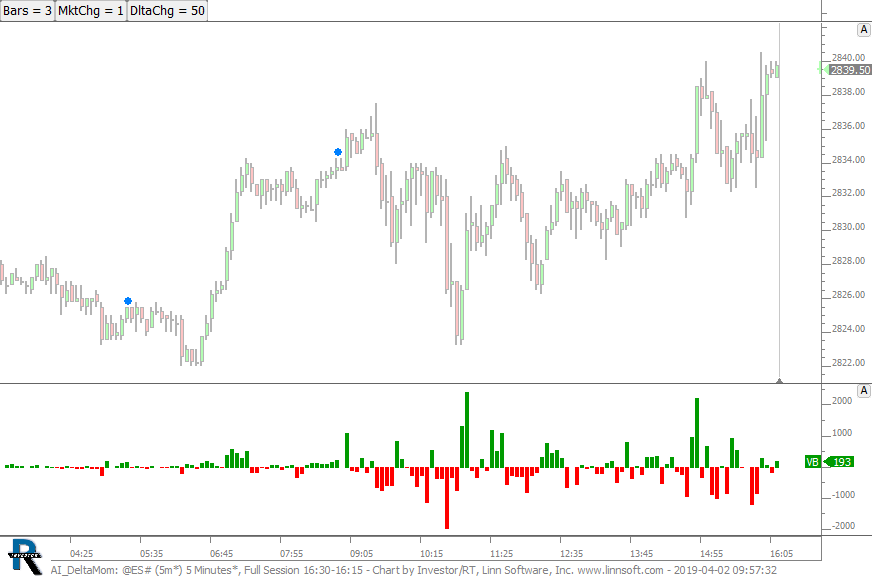 |
AI DeltaMom (@ES#) cpayne [totalcount]
7 years 3 months ago
This chart was uploaded by Investor/RT 13.5.24 showing symbol: @ES#. |
View |
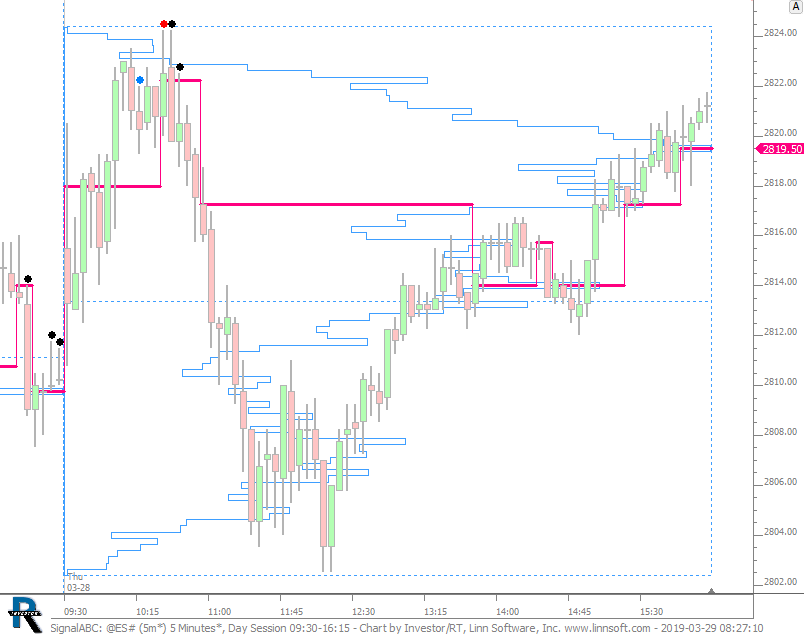 |
SignalABC (@ES#) cpayne [totalcount]
7 years 3 months ago
This chart was uploaded by Investor/RT 13.5.24 showing symbol: @ES#. |
View |
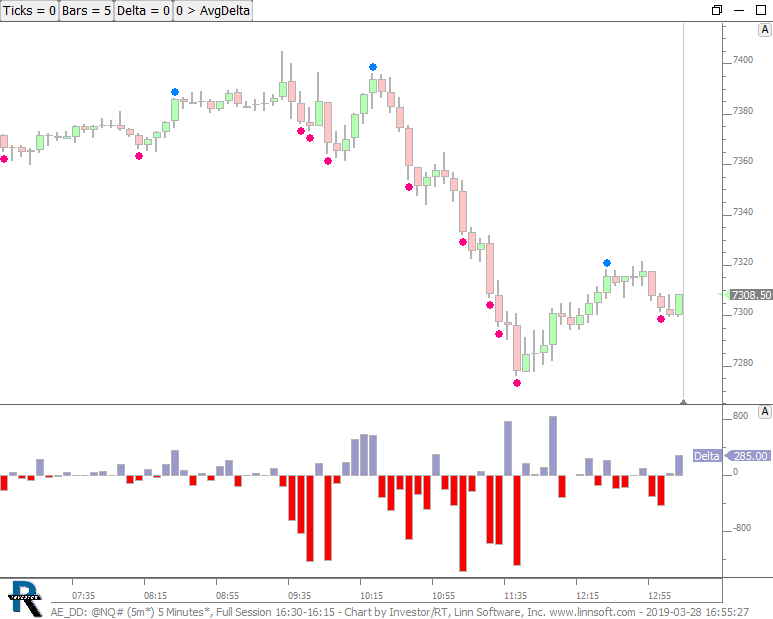 |
AE DD (@NQ#) cpayne [totalcount]
7 years 3 months ago
This chart was uploaded by Investor/RT 13.5.24 showing symbol: @NQ#. |
View |
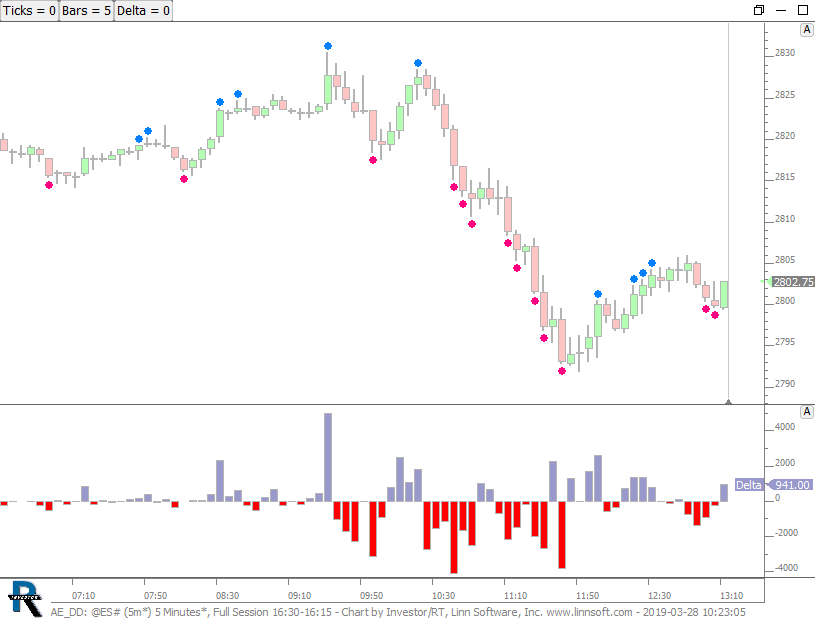 |
AE DD (@ES#) cpayne [totalcount]
7 years 3 months ago
AE Chart. This chart was uploaded by Investor/RT 13.5.23 showing symbol: @ES#. |
View |
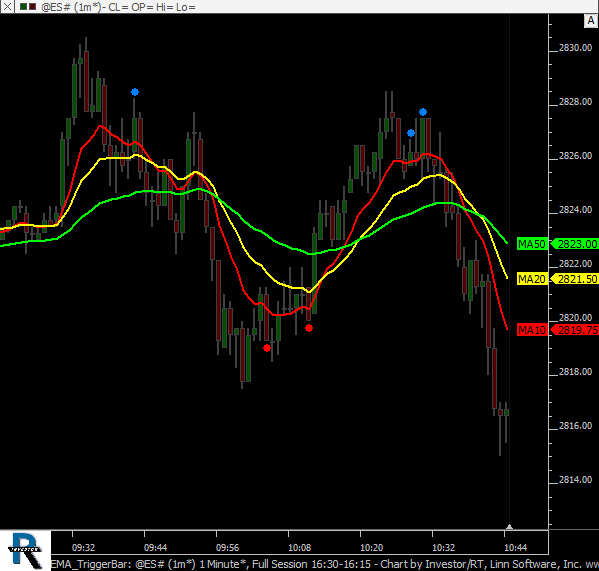 |
EMA TriggerBar (@ES#) cpayne [totalcount]
7 years 3 months ago
Stacked EMA Trigger Bar. This chart was uploaded by Investor/RT 13.5.23 showing symbol: @ES#. |
View |
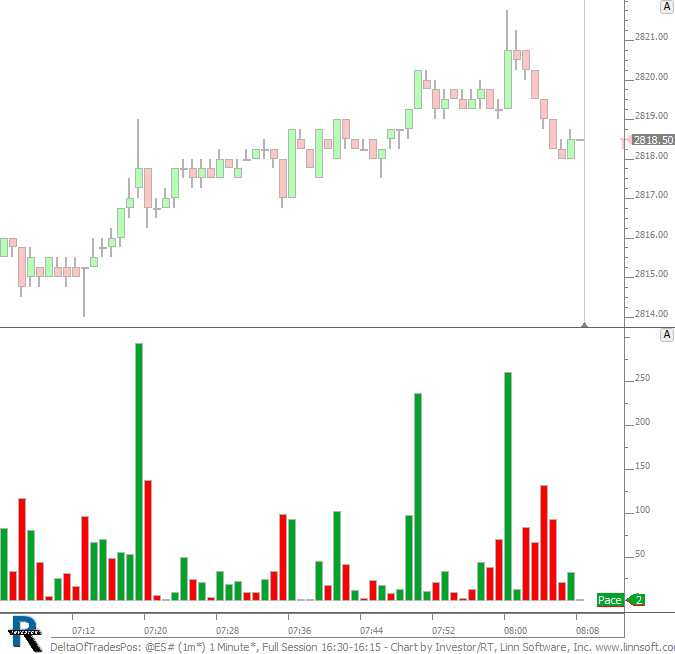 |
DeltaOfTradesPos (@ES#) cpayne [totalcount]
7 years 3 months ago
Buy Trades minus Sell Trades with both presented positive using different colors thru 2 custom indicators. This chart was uploaded by Investor/RT 13.5.23 showing symbol: @ES#. |
View |
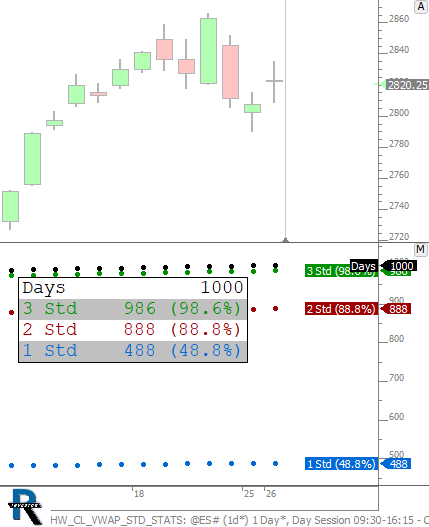 |
HW CL VWAP STD STATS (@ES#) cpayne [totalcount]
7 years 3 months ago
How often does price close within 1, 2, and 3 standard deviations of the VWAP. This chart was uploaded by Investor/RT 13.5.23 showing symbol: @ES#. |
View |