 |
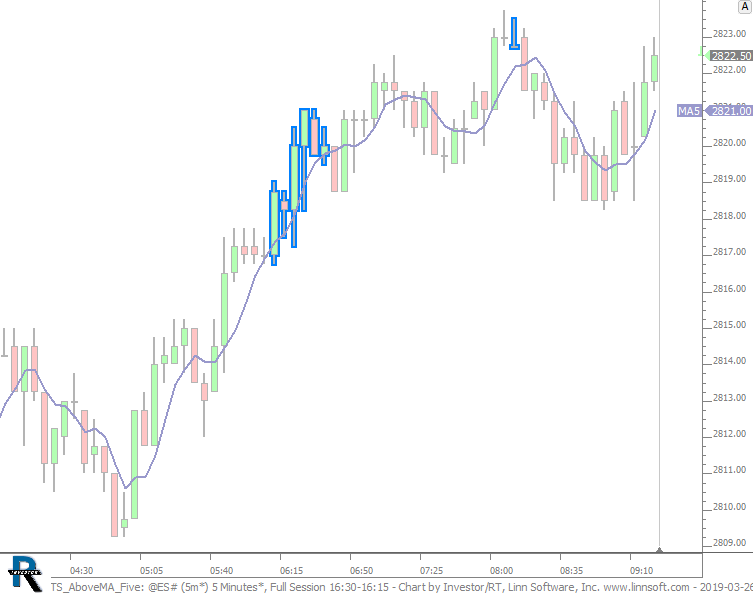
TS AboveMA Five (@ES#) cpayne [totalcount]
7 years 3 months ago
Close above MA5 for 7 or more consecutive bars. This chart was uploaded by Investor/RT 13.5.23 showing symbol: @ES#. |
View |
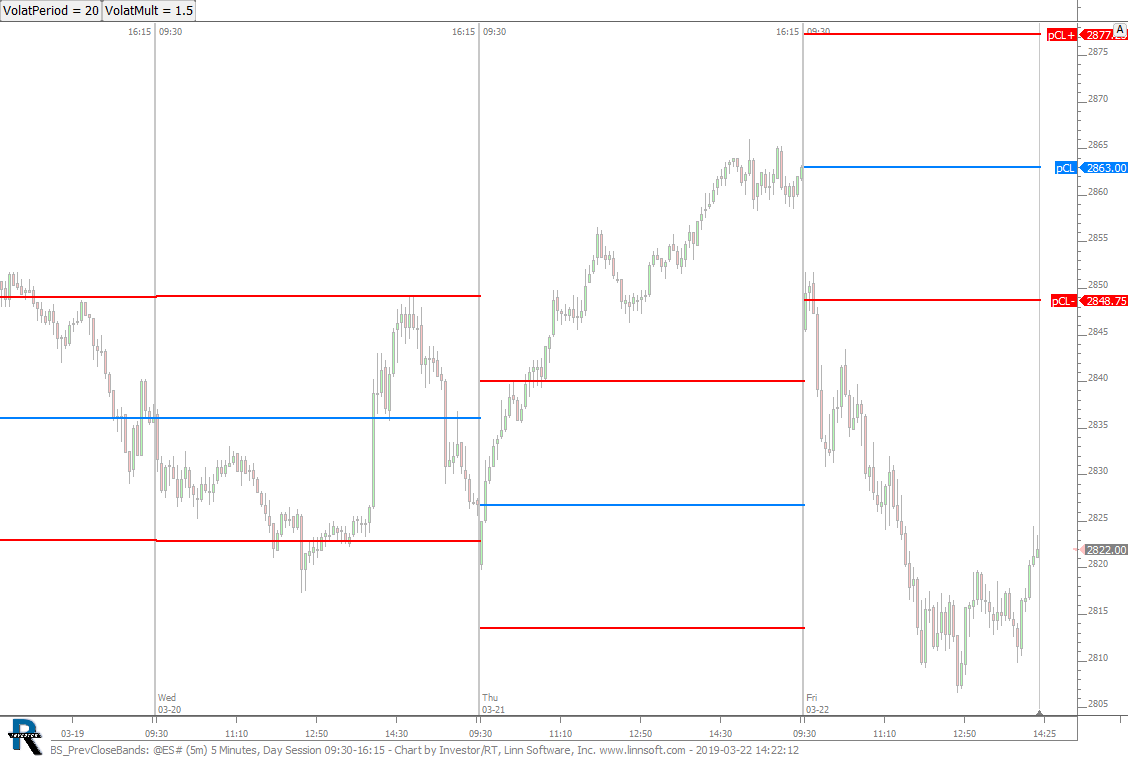 |
BS PrevCloseBands (@ES#) cpayne [totalcount]
7 years 3 months ago
Previous Close Bands. This chart was uploaded by Investor/RT 13.5.23 showing symbol: @ES#. |
View |
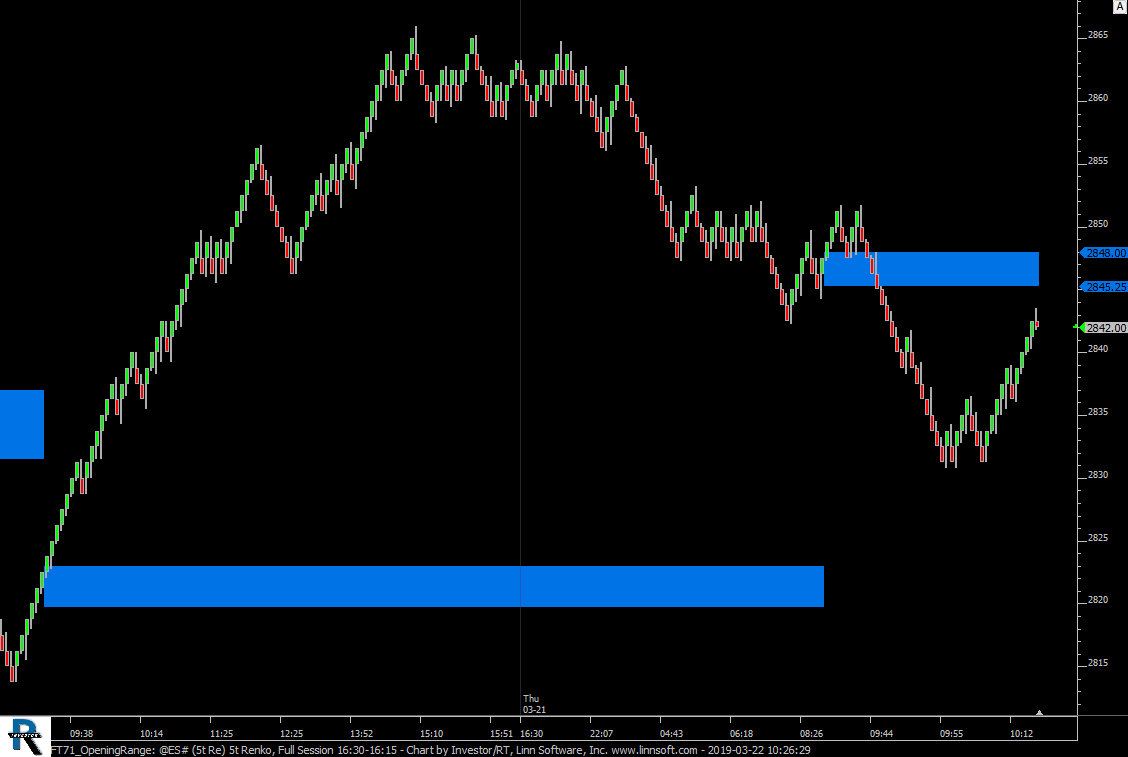 |
FT71 OpeningRange (@ES#) cpayne [totalcount]
7 years 3 months ago
Opening Range - 1 Minute Band. This chart was uploaded by Investor/RT 13.5.23 showing symbol: @ES#. |
View |
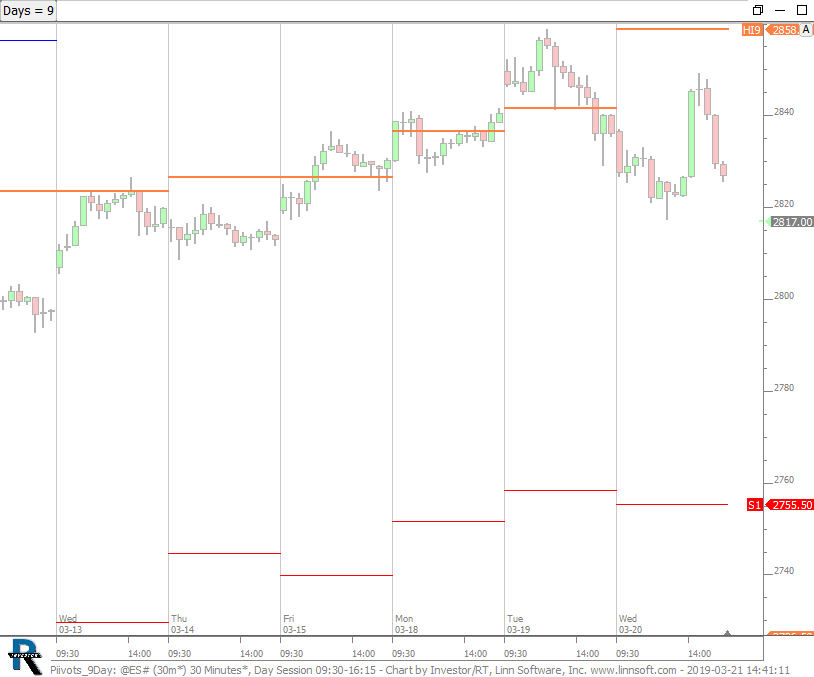 |
Piivots 9Day (@ES#) cpayne [totalcount]
7 years 3 months ago
Pivot - 9 Day. This chart was uploaded by Investor/RT 13.5.23 showing symbol: @ES#. |
View |
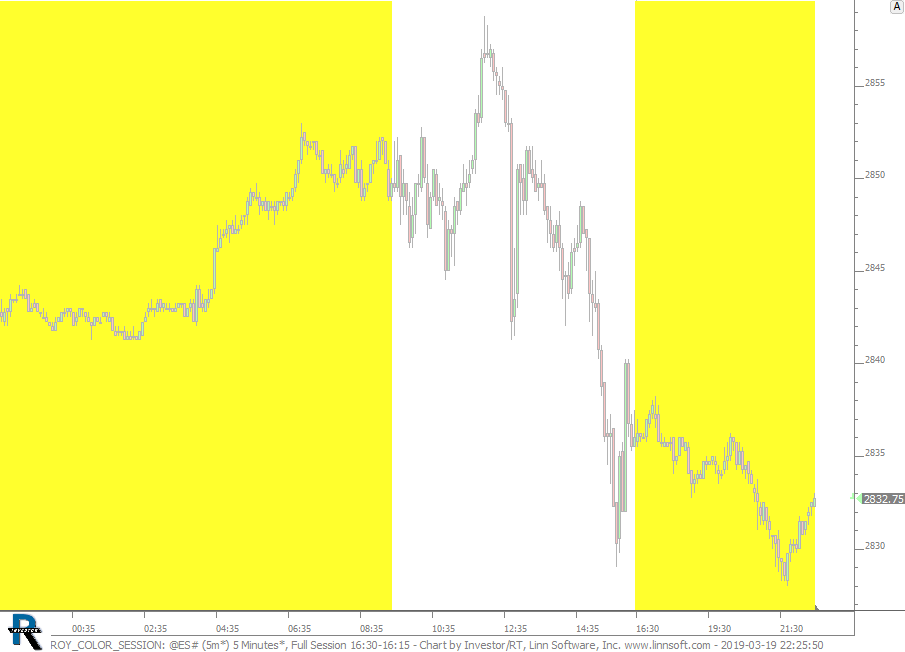 |
ROY COLOR SESSION (@ES#) cpayne [totalcount]
7 years 3 months ago
This chart was uploaded by Investor/RT 13.5.23 showing symbol: @ES#. |
View |
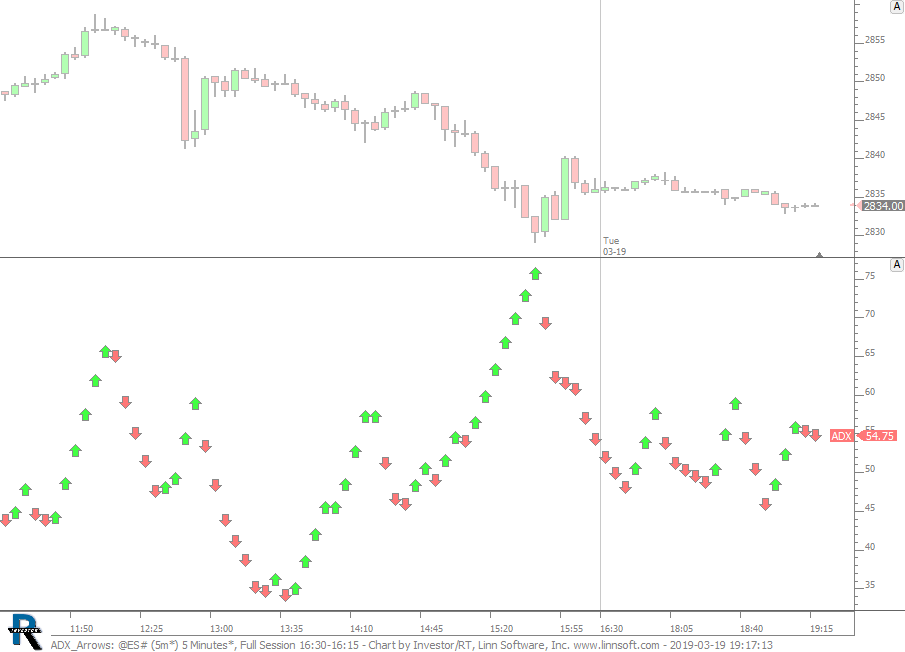 |
ADX Arrows (@ES#) cpayne [totalcount]
7 years 3 months ago
ADX Arrows. This chart was uploaded by Investor/RT 13.5.23 showing symbol: @ES#. |
View |
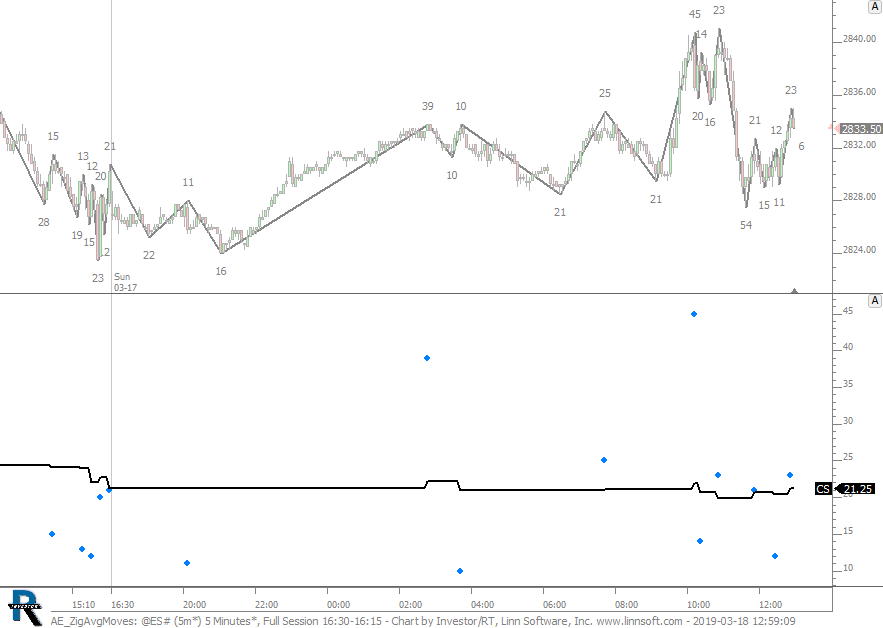 |
AE ZigAvgMoves (@ES#) cpayne [totalcount]
7 years 3 months ago
This chart was uploaded by Investor/RT 13.5.23 showing symbol: @ES#. |
View |
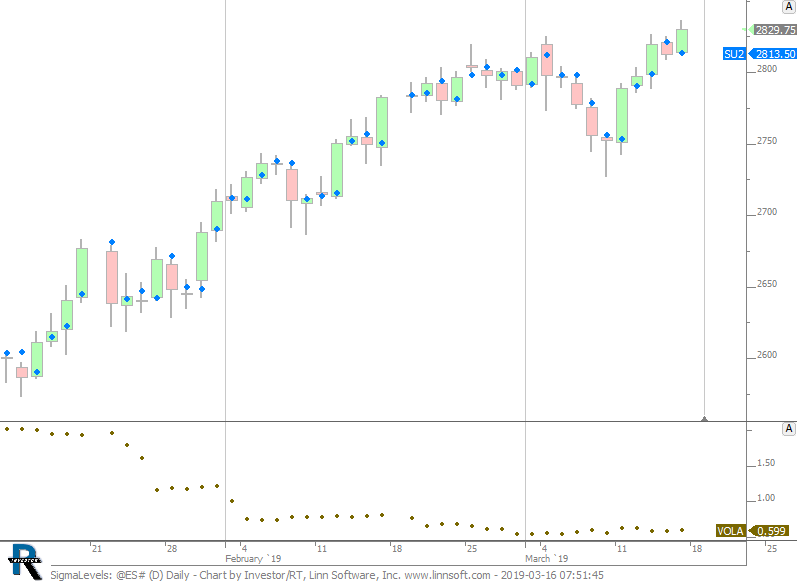 |
SigmaLevels (@ES#) cpayne [totalcount]
7 years 4 months ago
This chart was uploaded by Investor/RT 13.5.23 showing symbol: @ES#. |
View |
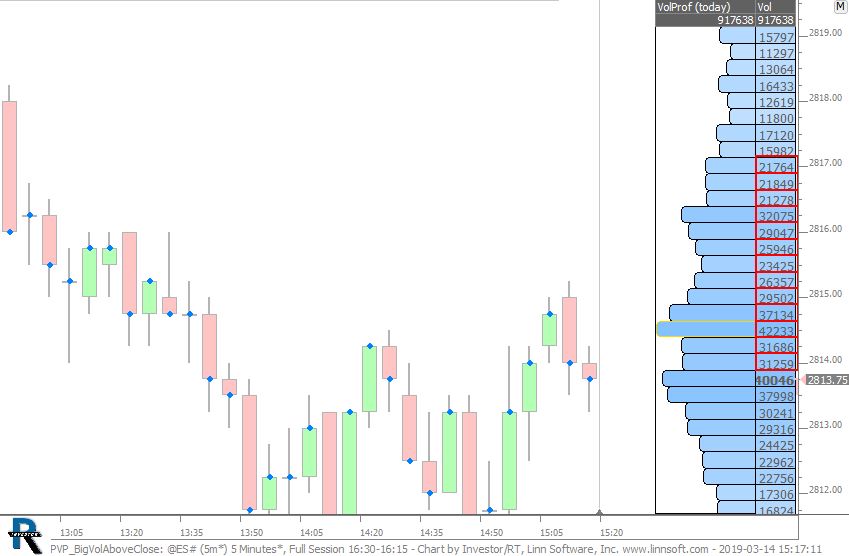 |
PVP BigVolAboveClose (@ES#) cpayne [totalcount]
7 years 4 months ago
This chart was uploaded by Investor/RT 13.5.23 showing symbol: @ES#. |
View |
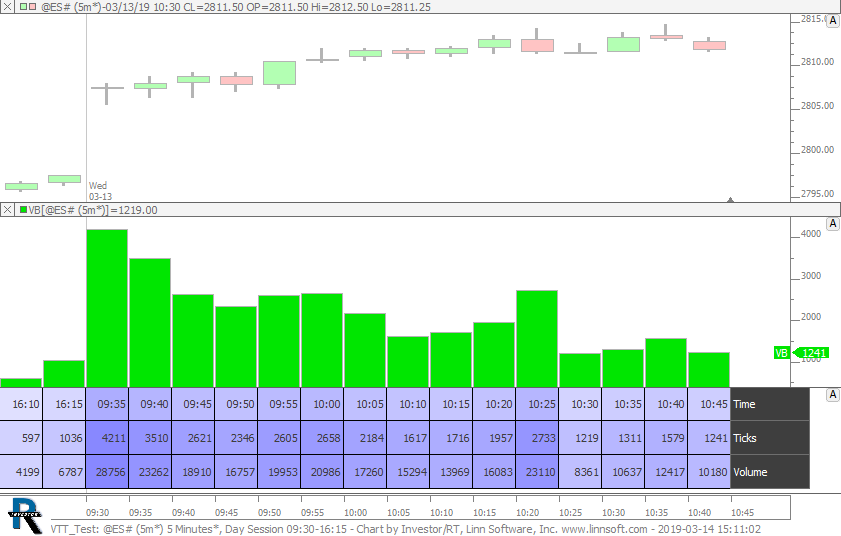 |
VTT Test (@ES#) cpayne [totalcount]
7 years 4 months ago
This chart was uploaded by Investor/RT 13.5.23 showing symbol: @ES#. |
View |
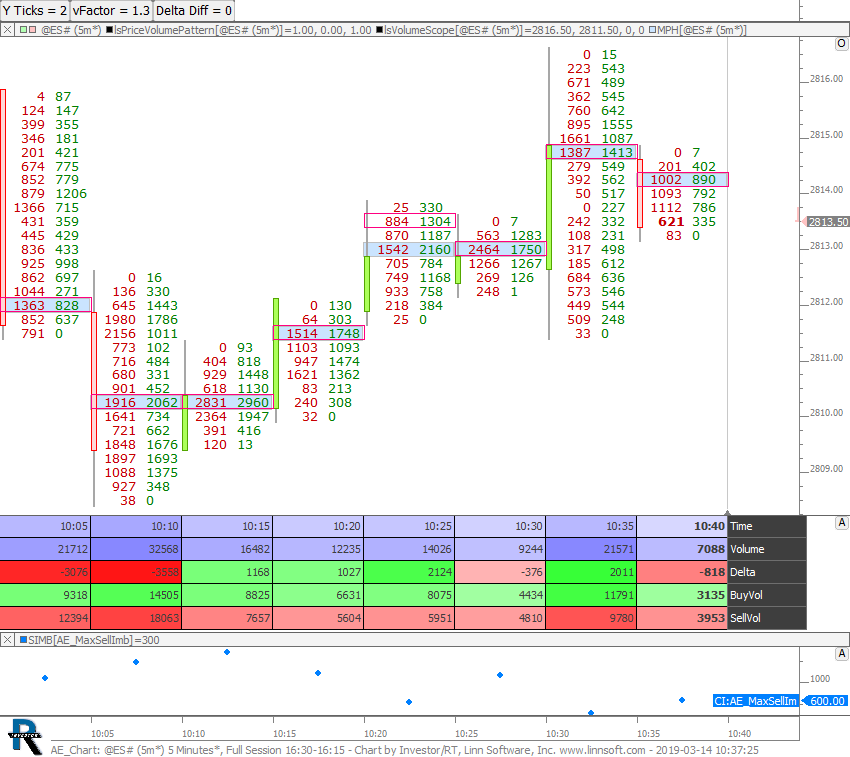 |
AE Chart (@ES#) cpayne [totalcount]
7 years 4 months ago
Identifies bars where the highest volume price is also the highest sell imbalance price and also in bottom Y Ticks of bar (controlled by button) and that bar closes above the high volume price and... |
View |
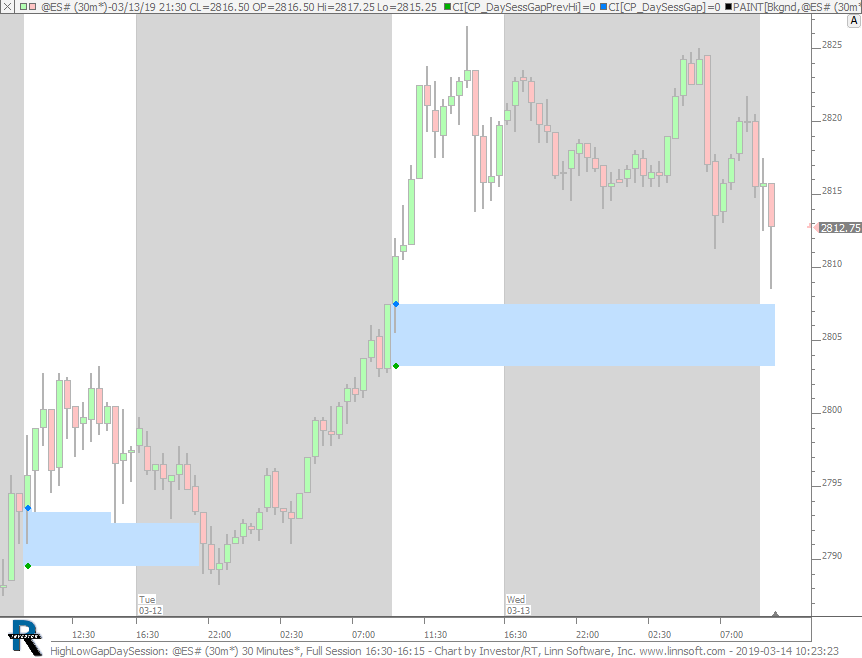 |
HighLowGapDaySession (@ES#) cpayne [totalcount]
7 years 4 months ago
Extended Gap Bands - Chart shows full session but gaps only consider day session data. This chart was uploaded by Investor/RT 13.5.23 showing symbol: @ES#. |
View |
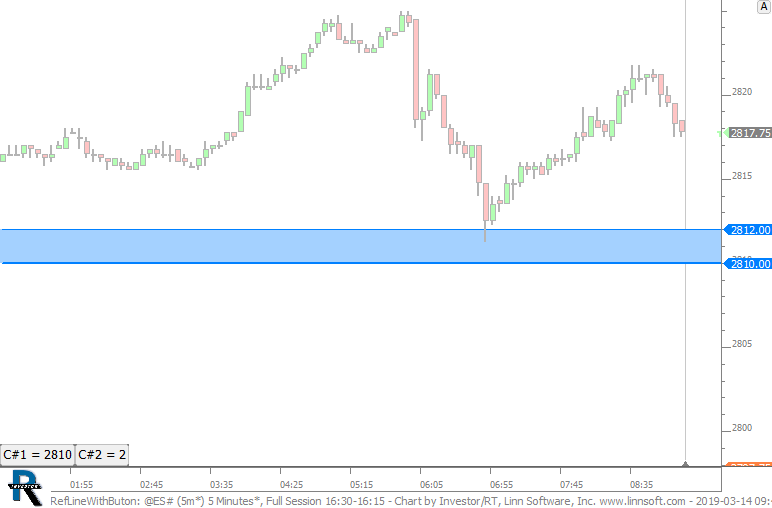 |
RefLineWithButon (@ES#) cpayne [totalcount]
7 years 4 months ago
This chart was uploaded by Investor/RT 13.5.23 showing symbol: @ES#. |
View |
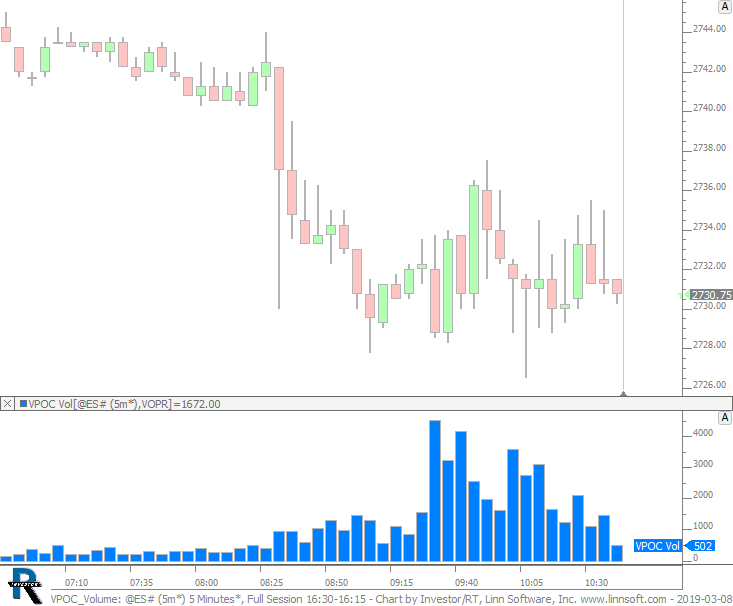 |
VPOC Volume (@ES#) cpayne [totalcount]
7 years 4 months ago
VPOC Volume. This chart was uploaded by Investor/RT 13.5.20 showing symbol: @ES#. |
View |
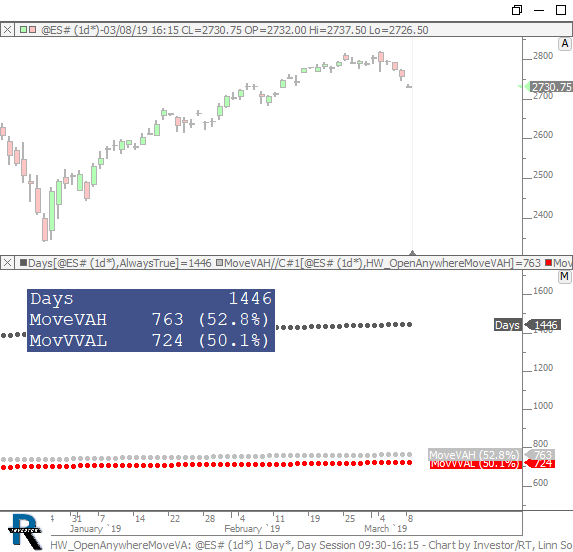 |
HW OpenAnywhereMoveVA (@ES#) cpayne [totalcount]
7 years 4 months ago
How often do we hit the previous day VAH or VAL. This chart was uploaded by Investor/RT 13.5.20 showing symbol: @ES#. |
View |
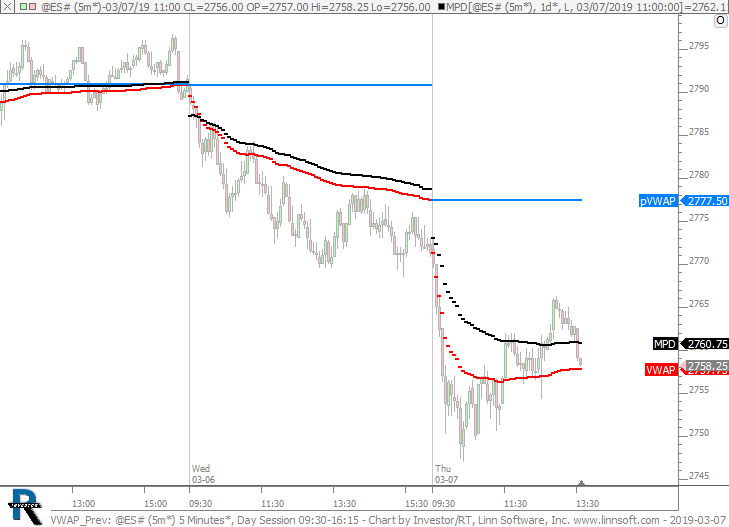 |
VWAP Prev (@ES#) cpayne [totalcount]
7 years 4 months ago
VWAP of Previous Day (Blue Line). This chart was uploaded by Investor/RT 13.5.19 showing symbol: @ES#. |
View |
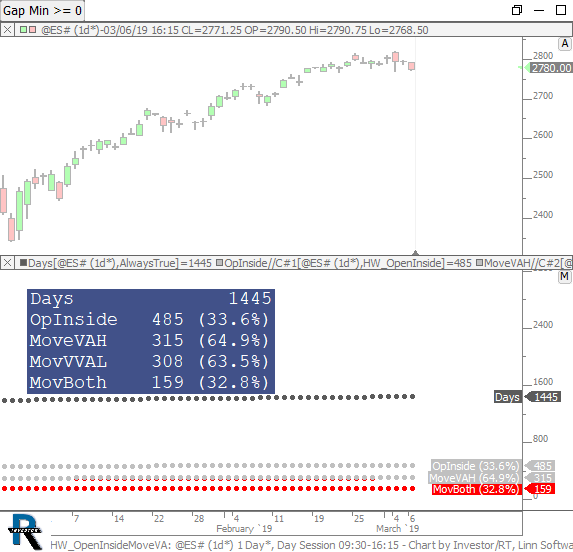 |
HW OpenInsideMoveVA (@ES#) cpayne [totalcount]
7 years 4 months ago
Chart counts how many days we opened inside prev VA. And of those days, how often we moved to VAH, how often to VAL, and how often we moved to both. |
View |
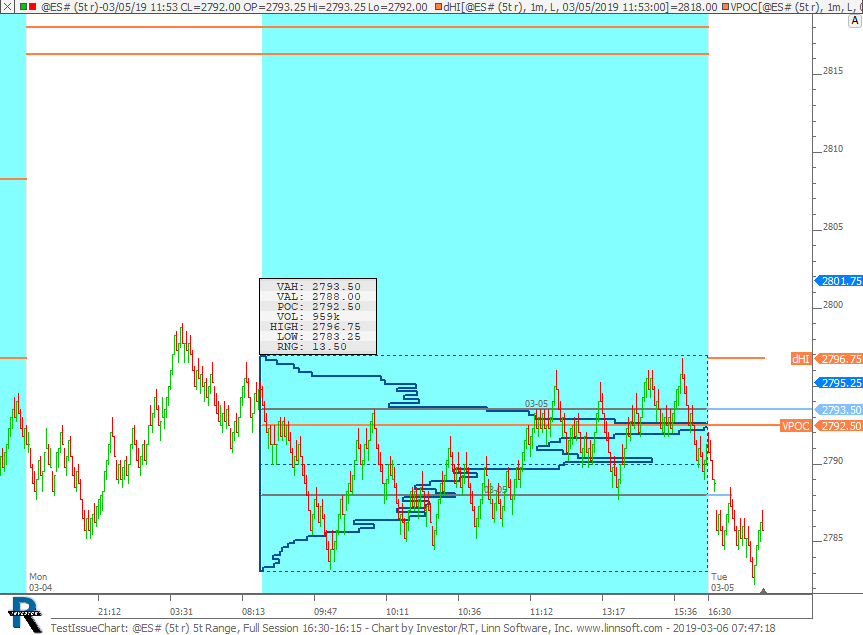 |
TestIssueChart (@ES#) cpayne [totalcount]
7 years 4 months ago
This chart was uploaded by Investor/RT 13.5.20 showing symbol: @ES#. |
View |
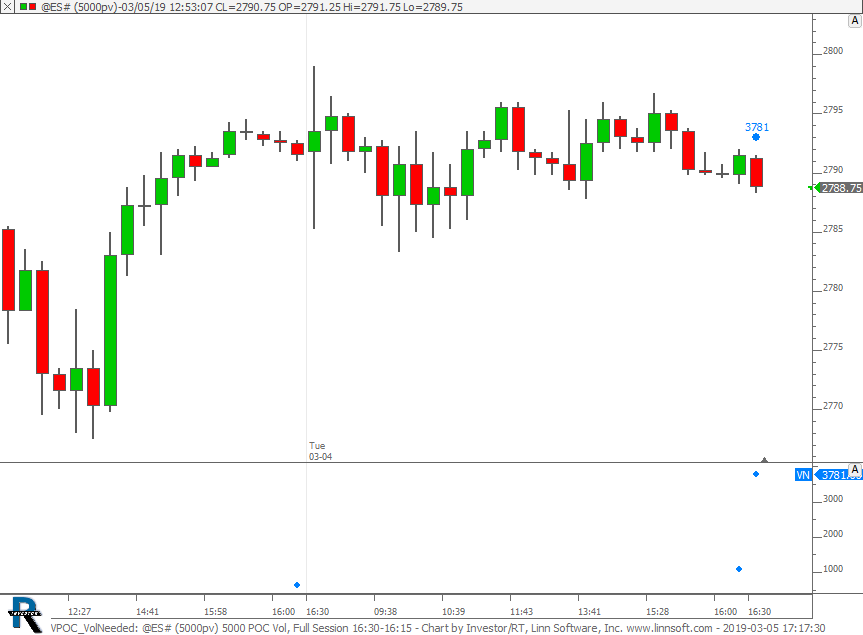 |
VPOC VolNeeded (@ES#) cpayne [totalcount]
7 years 4 months ago
This chart was uploaded by Investor/RT 13.5.20 showing symbol: @ES#. |
View |
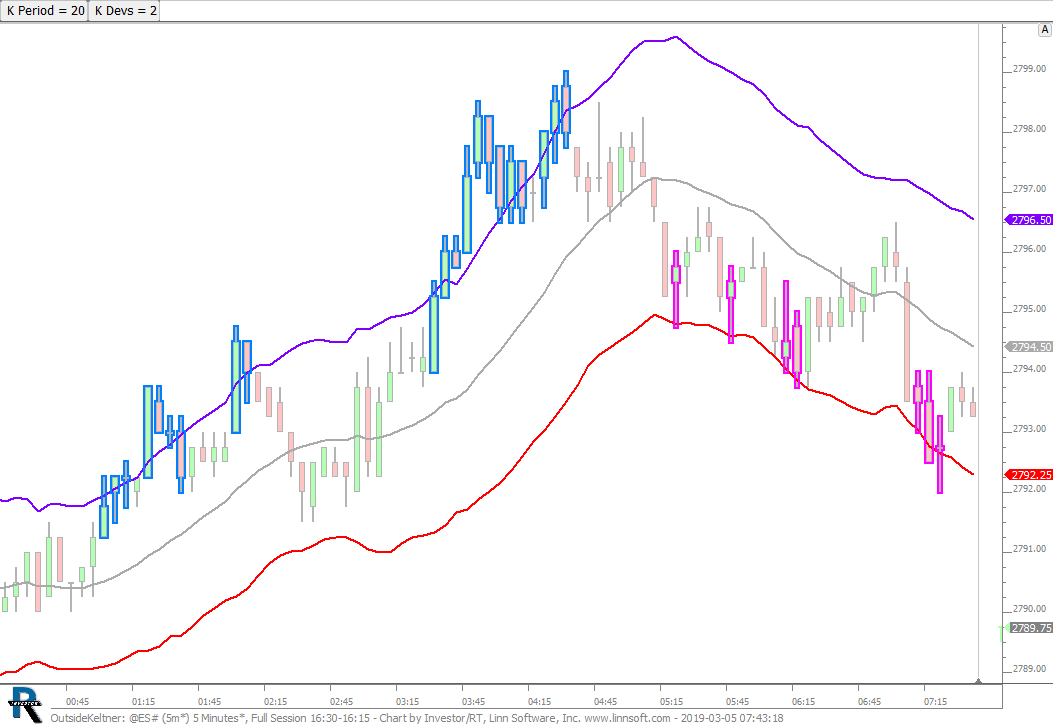 |
OutsideKeltner (@ES#) cpayne [totalcount]
7 years 4 months ago
PaintCandles that get outside the Keltner Channels. This chart was uploaded by Investor/RT 13.5.20 showing symbol: @ES#. |
View |
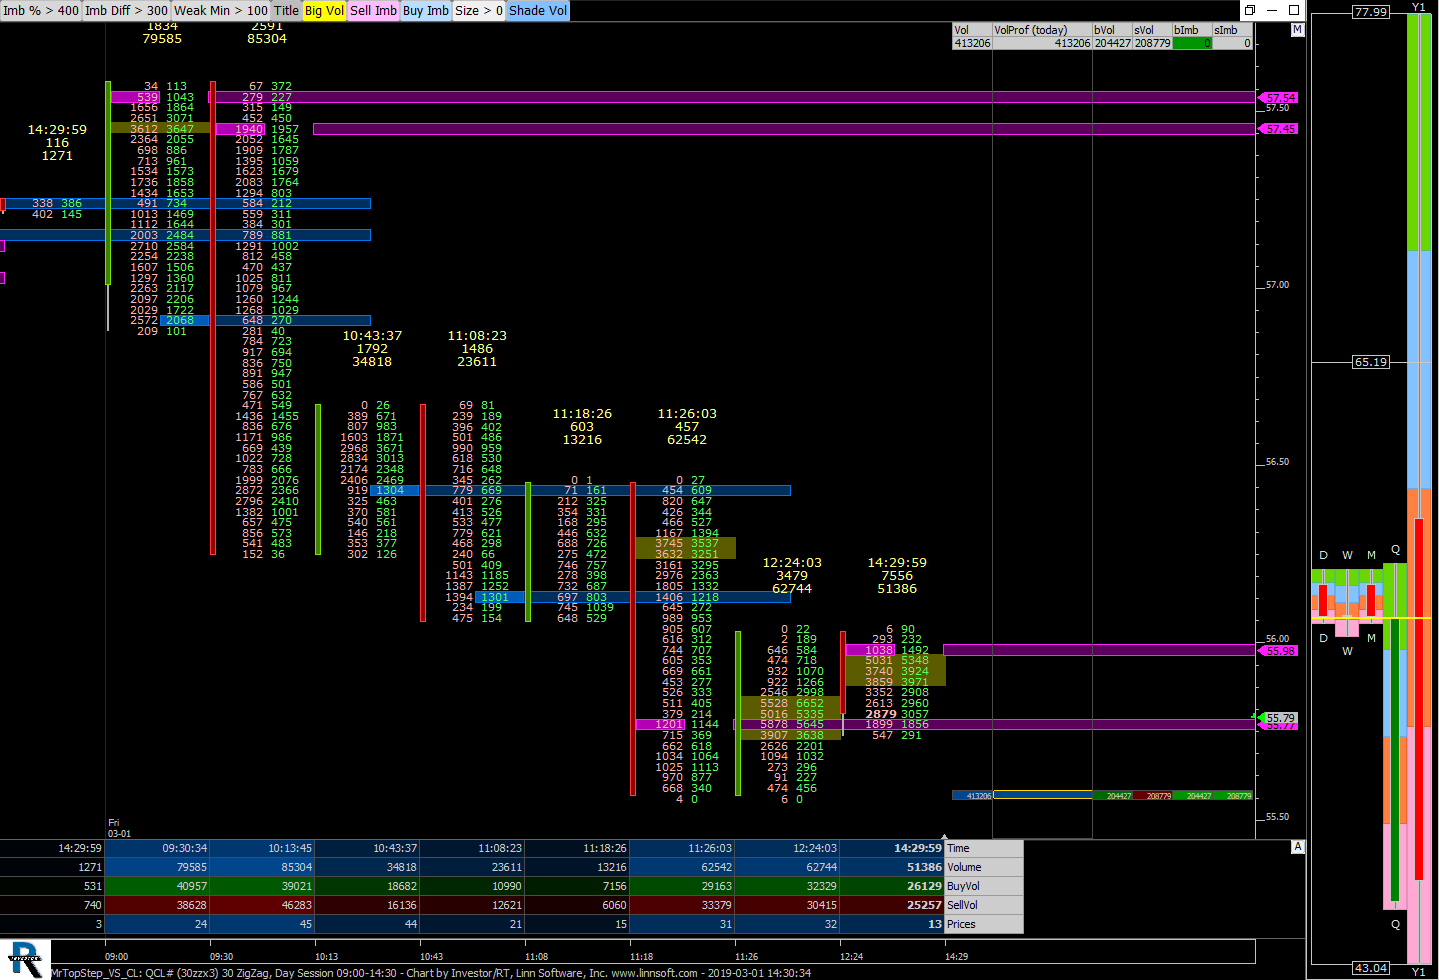 |
MrTopStep VS CL (QCL#) cpayne [totalcount]
7 years 4 months ago
This chart was uploaded by Investor/RT 13.5.20 showing symbol: QCL#. |
View |
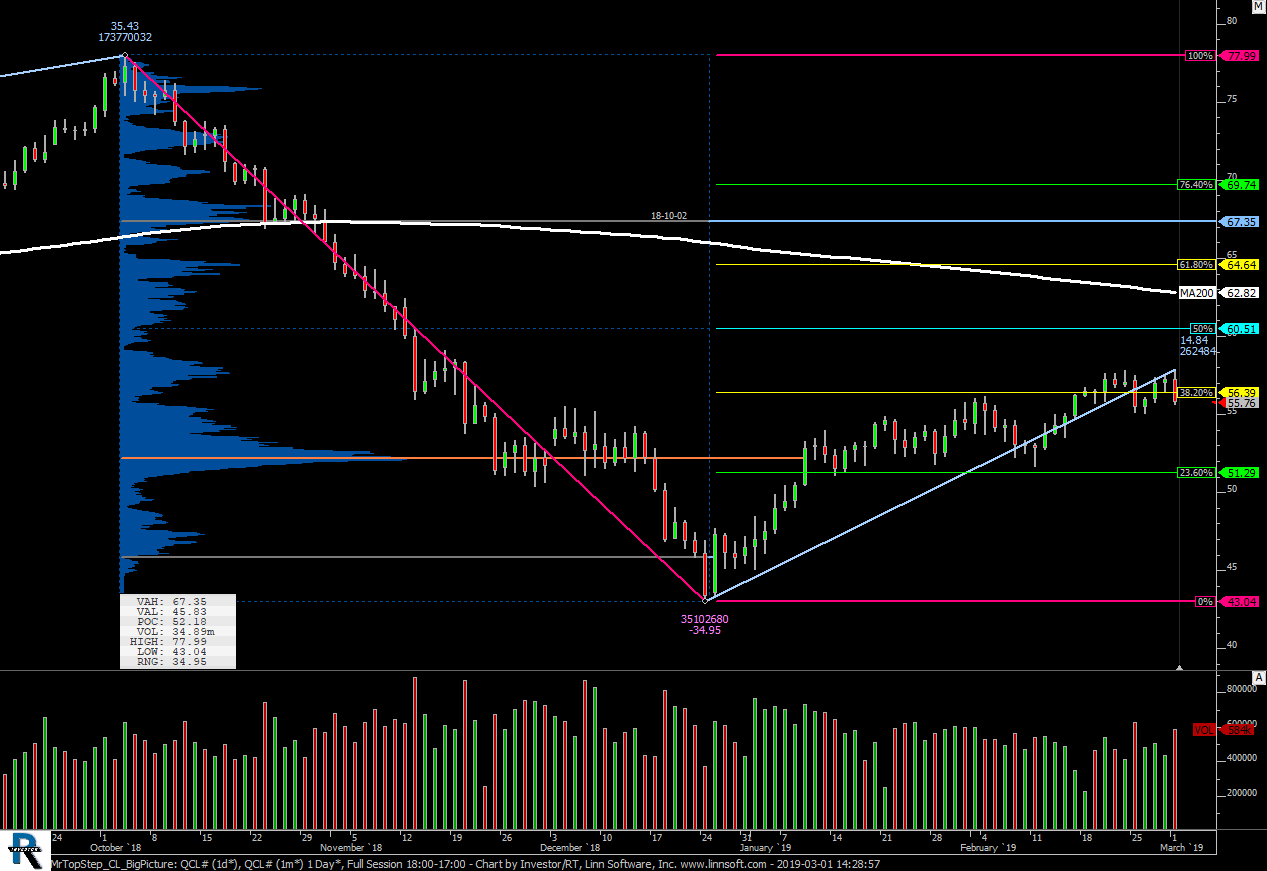 |
MrTopStep CL BigPicture (QCL#) cpayne [totalcount]
7 years 4 months ago
This chart was uploaded by Investor/RT 13.5.20 showing symbol: QCL#. |
View |
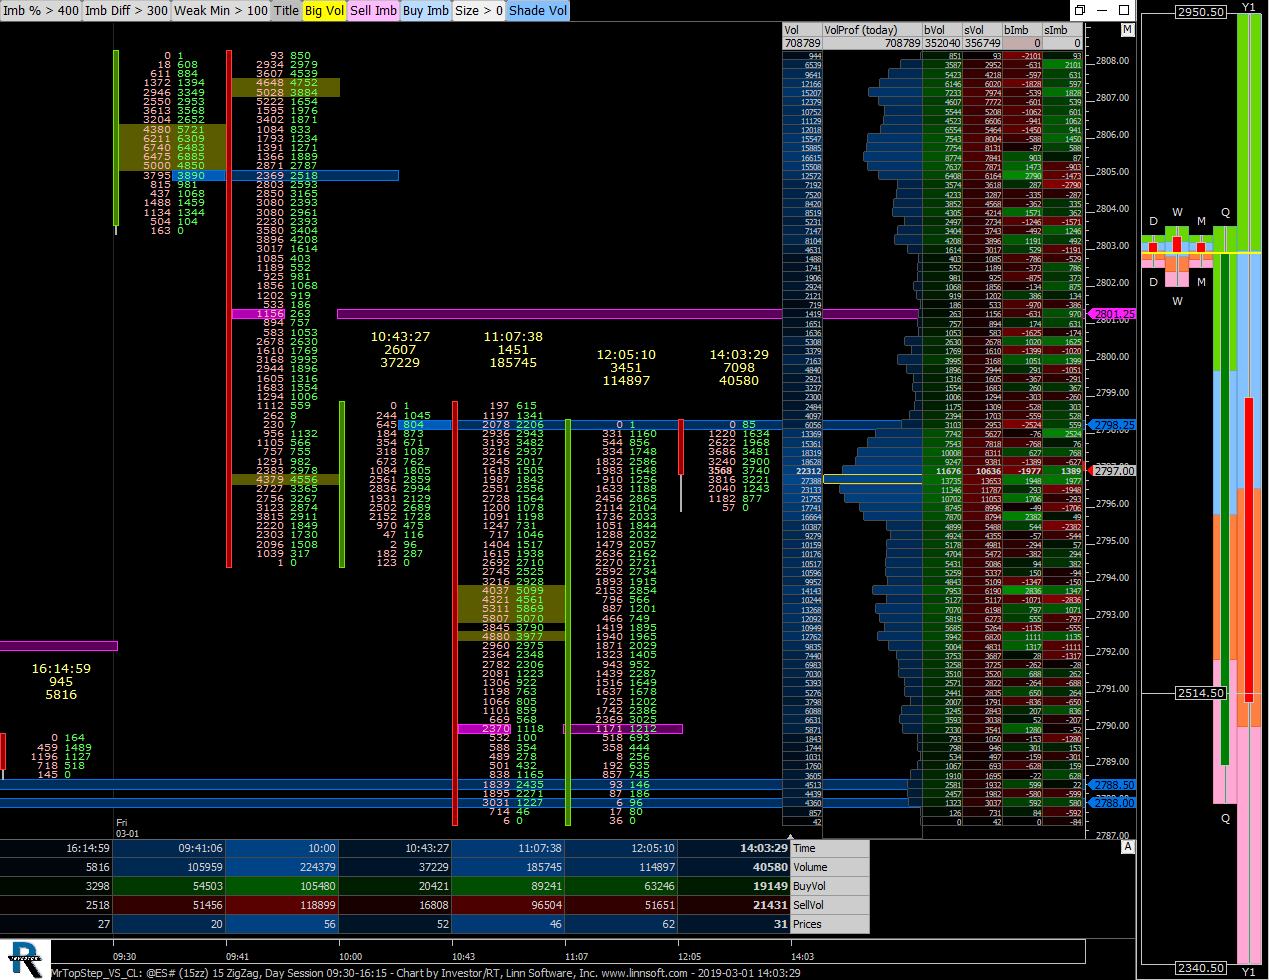 |
MrTopStep VS CL (@ES#) cpayne [totalcount]
7 years 4 months ago
MrTopStep - Zoomed in on 3/1/2019 showing the 6 significant moves made during day session as of 2pm ET. VolumeScope with Bar Stats and Price Stats. MPH identifies imbalance. |
View |
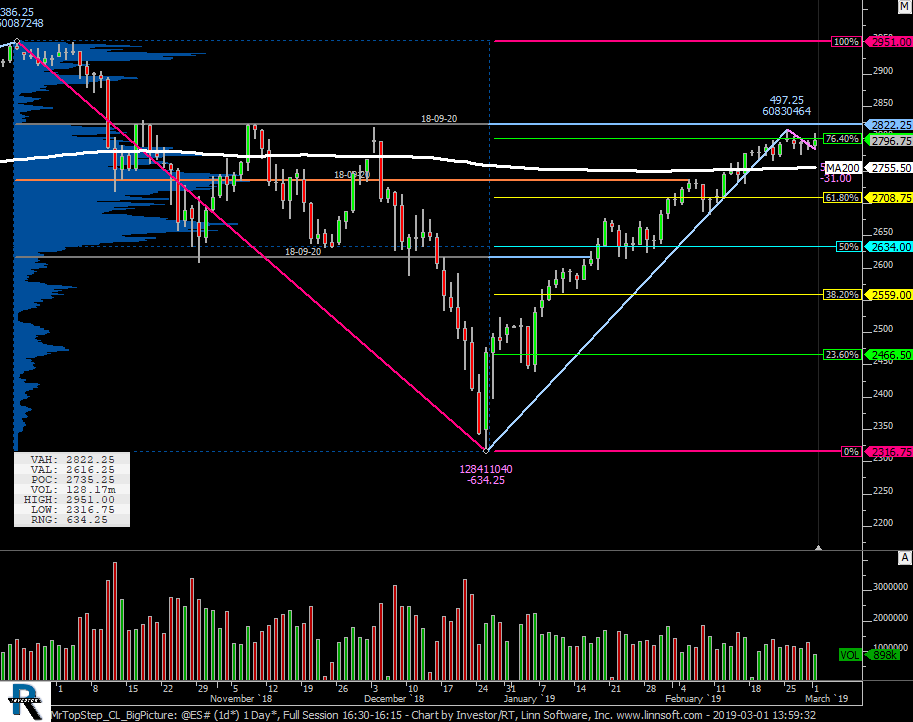 |
MrTopStep CL BigPicture (@ES#) cpayne [totalcount]
7 years 4 months ago
MrTopStep - Big Picture of Oil showing early 2019 recover of the downward move in late 2018. This chart was uploaded by Investor/RT 13.5.20 showing symbol: @ES#. |
View |
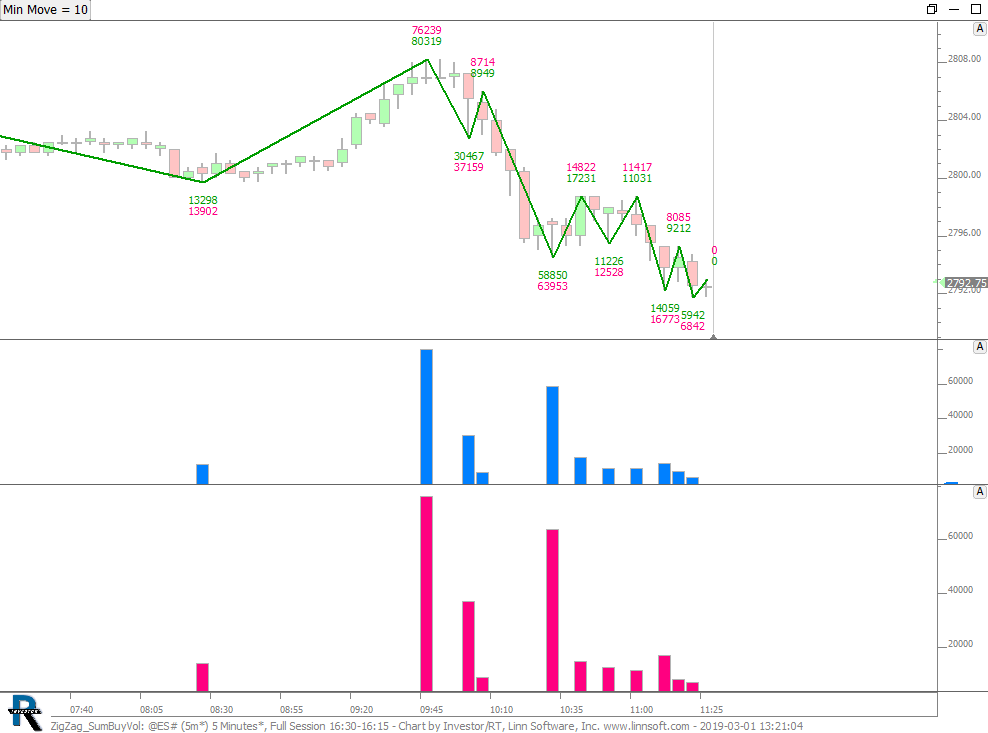 |
ZigZag SumBuyVol (@ES#) cpayne [totalcount]
7 years 4 months ago
Labeling Zig Zag with Buy and Sell Volume thru Custom Indictors. This chart was uploaded by Investor/RT 13.5.20 showing symbol: @ES#. |
View |