 |
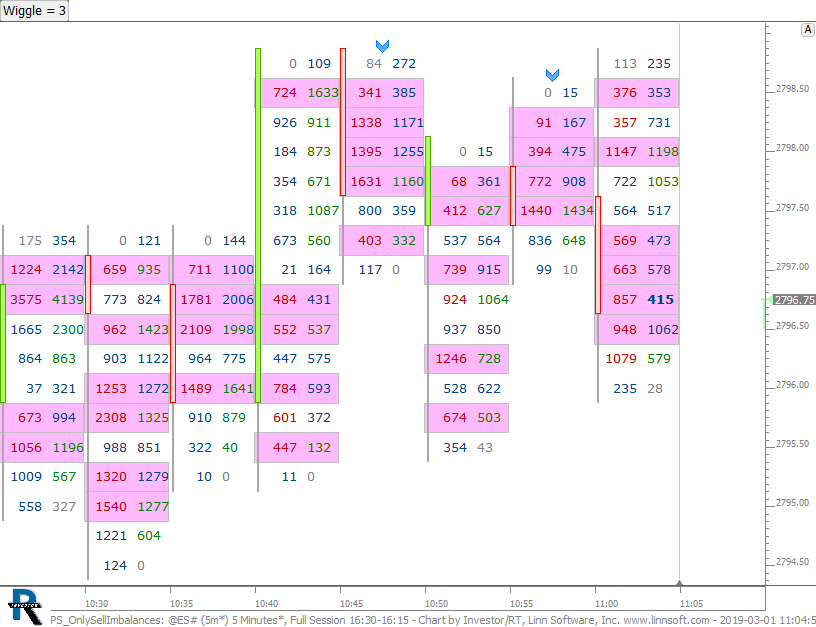
PS OnlySellImbalances (@ES#) cpayne [totalcount]
7 years 4 months ago
Bars with Only Sell Imbalances. This chart was uploaded by Investor/RT 13.5.20 showing symbol: @ES#. |
View |
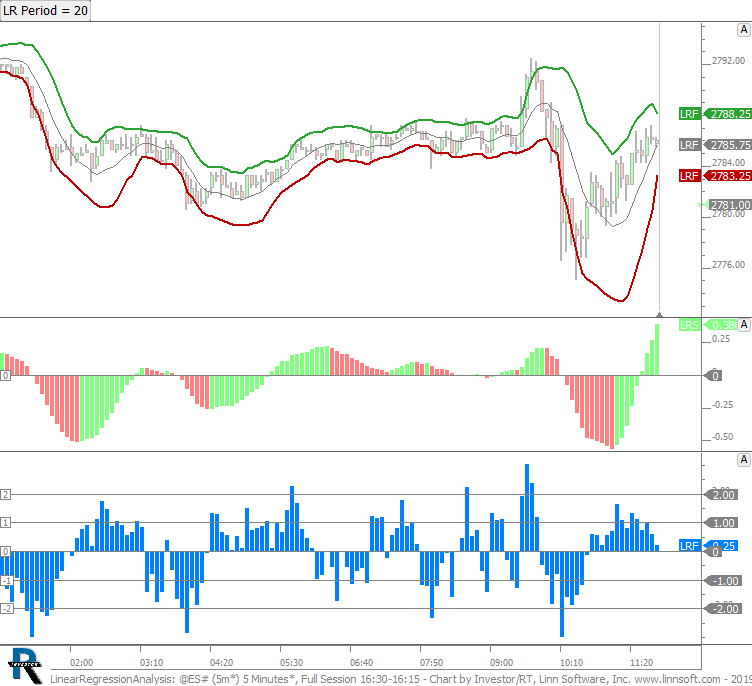 |
LinearRegressionAnalysis (@ES#) cpayne [totalcount]
7 years 4 months ago
Linear Regression Analysis. This chart was uploaded by Investor/RT 13.5.20 showing symbol: @ES#. |
View |
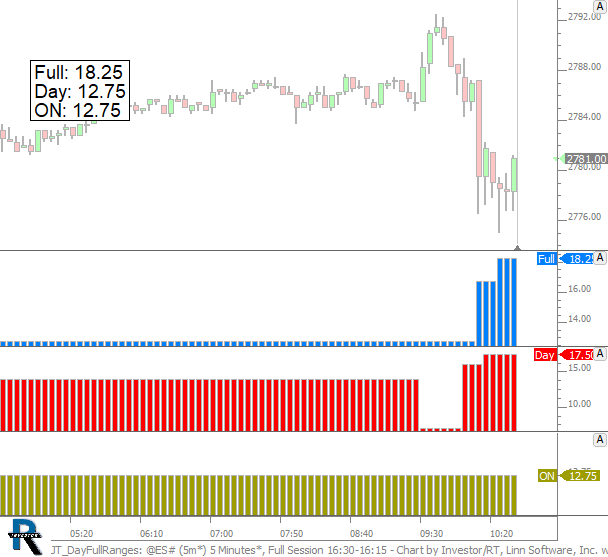 |
JT DayFullRanges (@ES#) cpayne [totalcount]
7 years 4 months ago
Full, Day,and Overnight session ranges as custom indicators and in annotation (through C variables). This chart was uploaded by Investor/RT 13.5.20 showing symbol: @ES#. |
View |
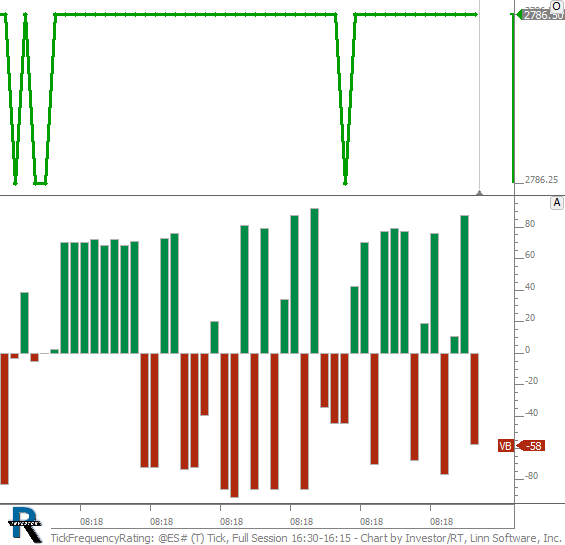 |
TickFrequencyRating (@ES#) cpayne [totalcount]
7 years 4 months ago
This chart was uploaded by Investor/RT 13.5.20 showing symbol: @ES#. |
View |
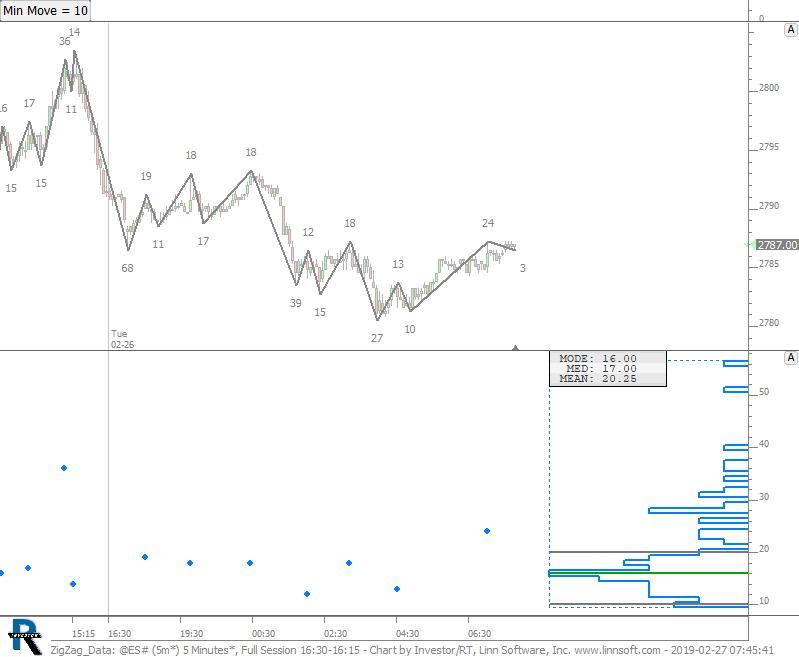 |
ZigZag Data (@ES#) cpayne [totalcount]
7 years 4 months ago
Data on Upper Zigs. This chart was uploaded by Investor/RT 13.5.20 showing symbol: @ES#. |
View |
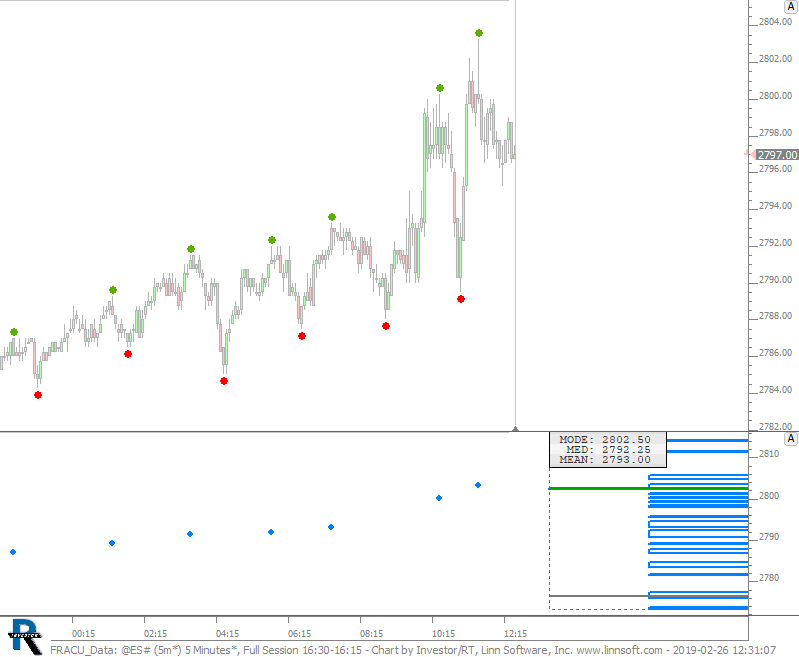 |
FRACU Data (@ES#) cpayne [totalcount]
7 years 4 months ago
Data on Upper Fractals. This chart was uploaded by Investor/RT 13.5.20 showing symbol: @ES#. |
View |
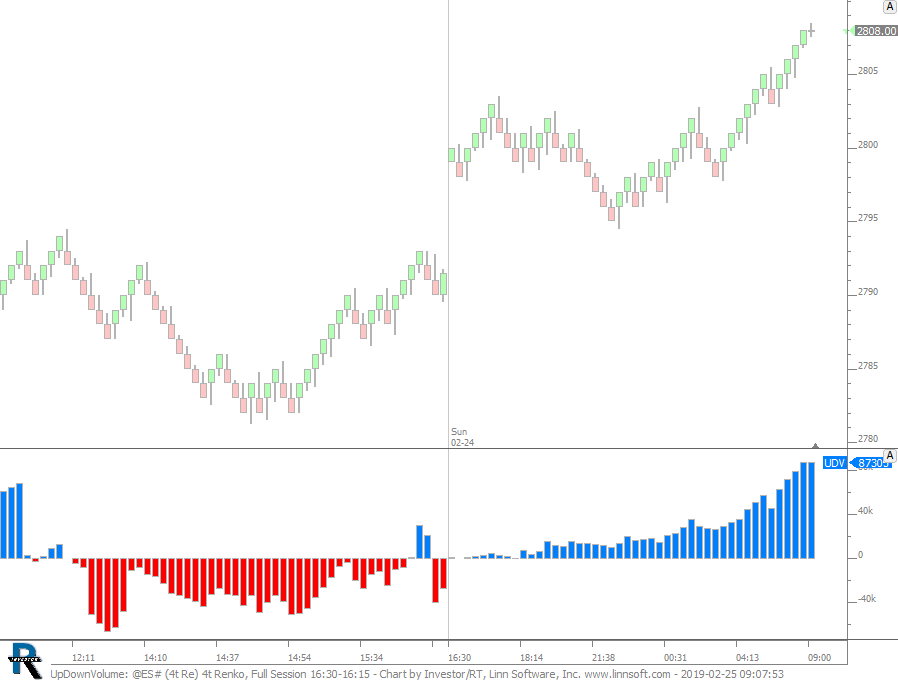 |
UpDownVolume (@ES#) cpayne [totalcount]
7 years 4 months ago
Up/Down Volume. This chart was uploaded by Investor/RT 13.5.19 showing symbol: @ES#. |
View |
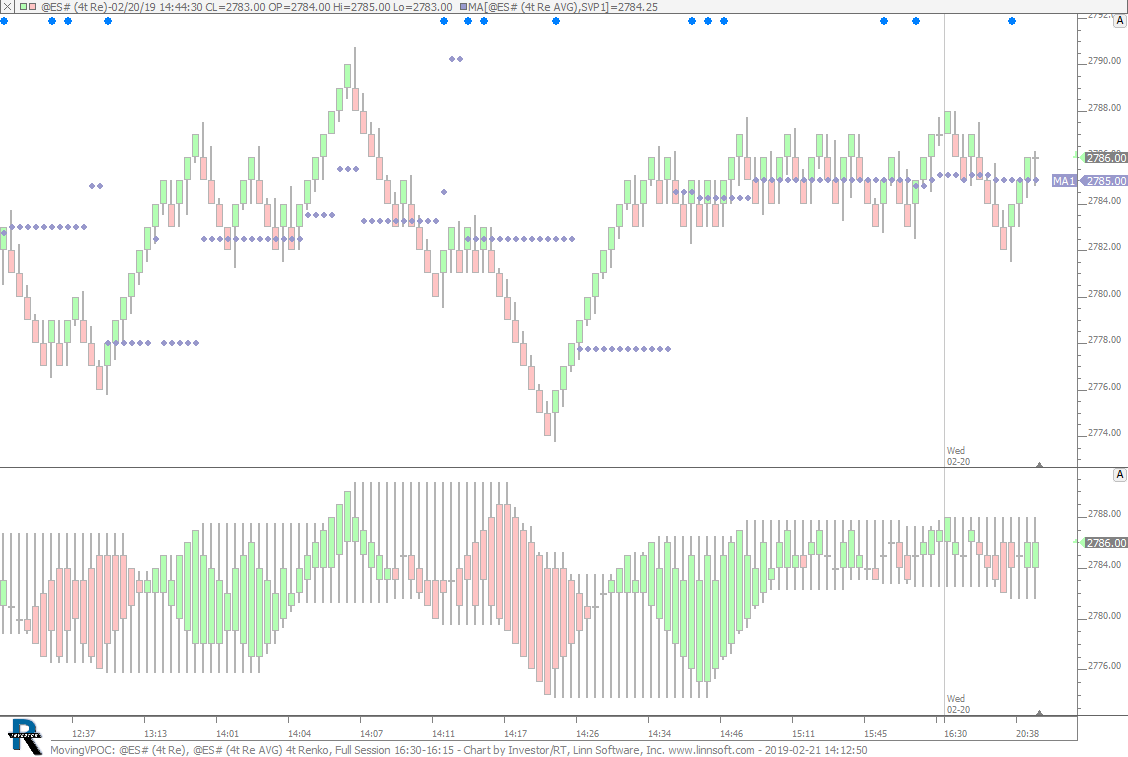 |
MovingVPOC (@ES#) cpayne [totalcount]
7 years 4 months ago
This chart was uploaded by Investor/RT 13.5.19 showing symbol: @ES#. |
View |
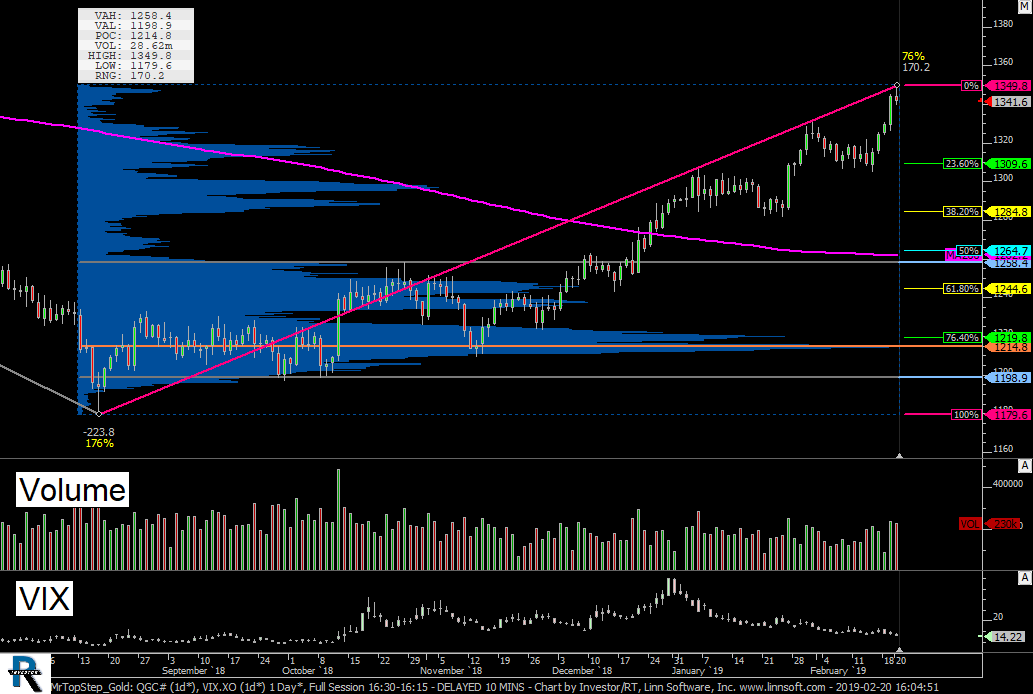 |
MrTopStep Gold (QGC#) cpayne [totalcount]
7 years 4 months ago
This chart was uploaded by Investor/RT 13.5.19 showing symbol: QGC#. |
View |
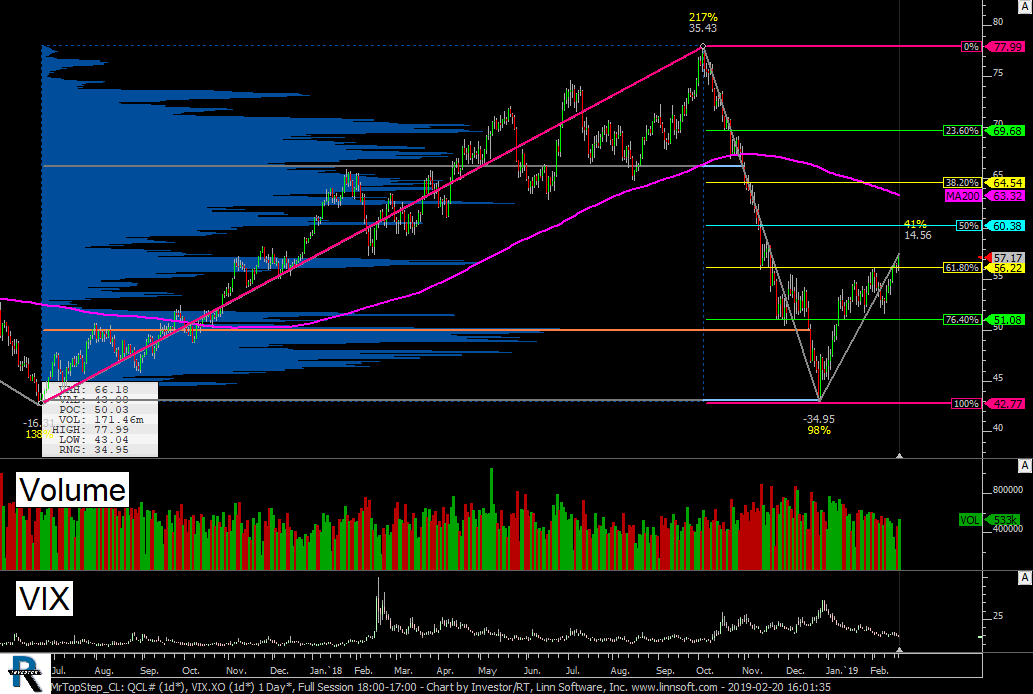 |
MrTopStep CL (QCL#) cpayne [totalcount]
7 years 4 months ago
This chart was uploaded by Investor/RT 13.5.19 showing symbol: QCL#. |
View |
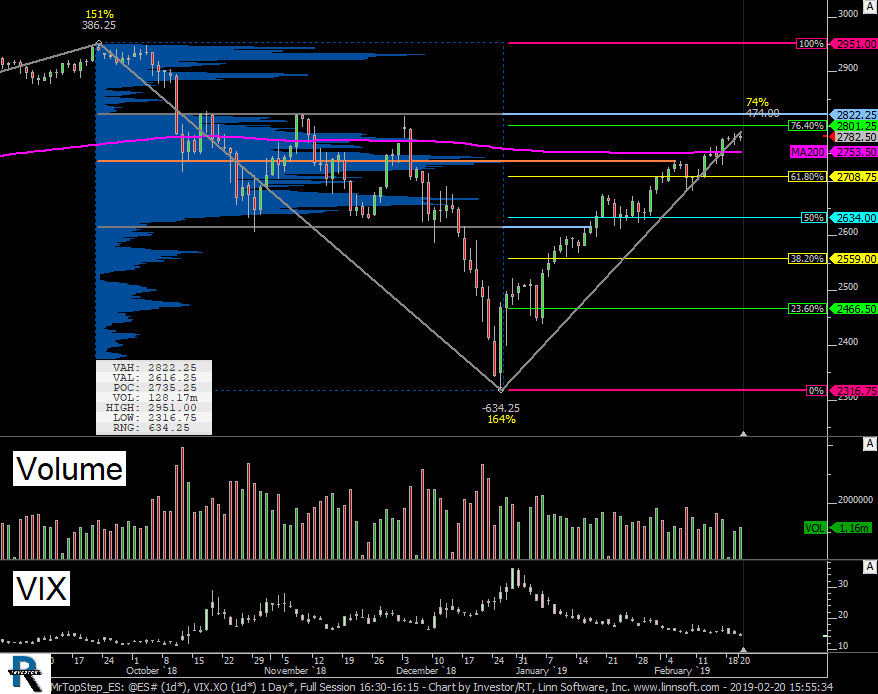 |
MrTopStep ES (@ES#) cpayne [totalcount]
7 years 4 months ago
This chart was uploaded by Investor/RT 13.5.19 showing symbol: @ES#. |
View |
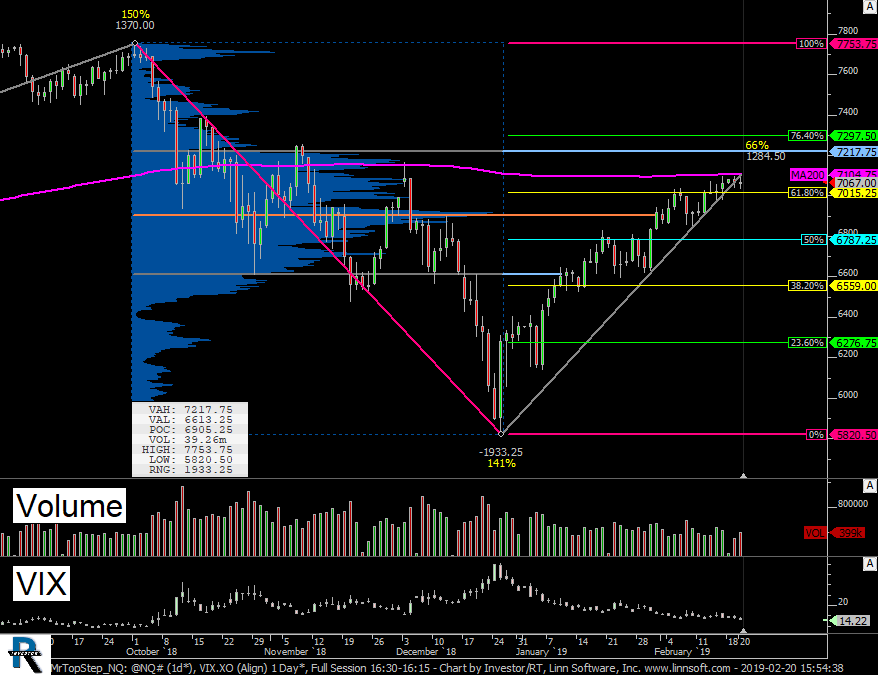 |
MrTopStep NQ (@NQ#) cpayne [totalcount]
7 years 4 months ago
MrTopStep - NQ Move Down Sept - Dec 2018. This chart was uploaded by Investor/RT 13.5.19 showing symbol: @NQ#. |
View |
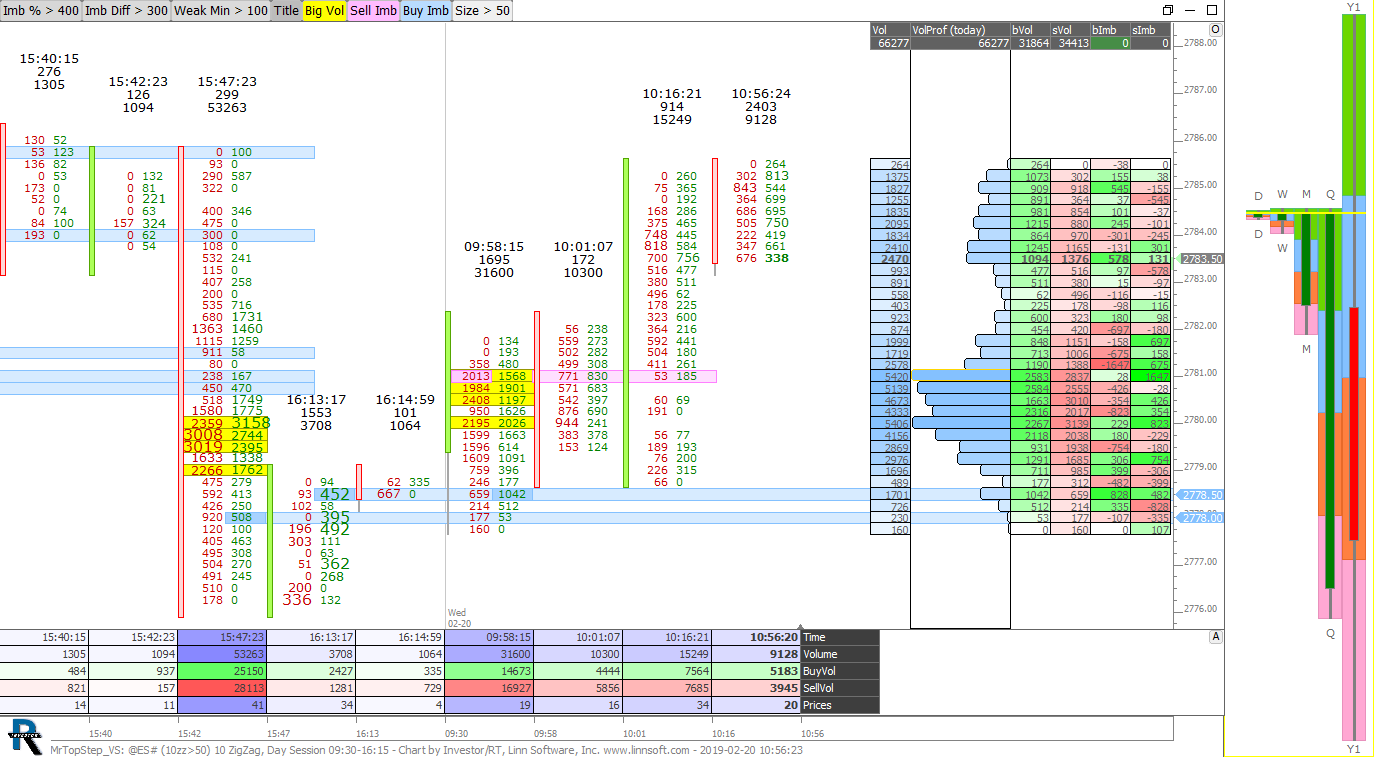 |
MrTopStep VS (@ES#) cpayne [totalcount]
7 years 4 months ago
Chart used in Feb 13, 2019 presentation to Mr. TopStep room. This chart was uploaded by Investor/RT 13.5.19 showing symbol: @ES#. |
View |
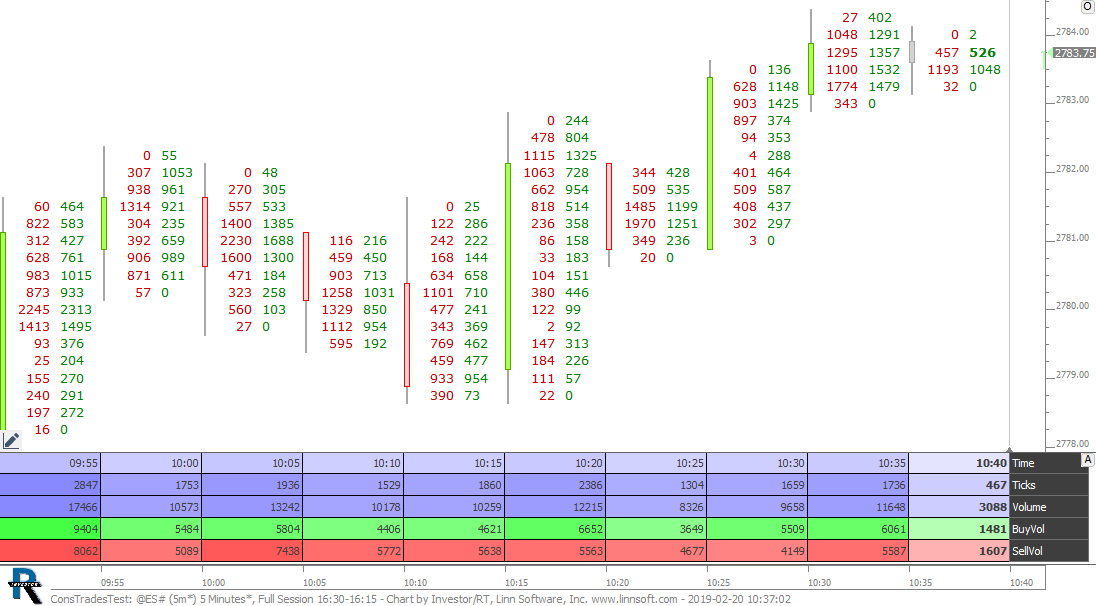 |
ConsTradesTest (@ES#) cpayne [totalcount]
7 years 4 months ago
This chart was uploaded by Investor/RT 13.5.19 showing symbol: @ES#. |
View |
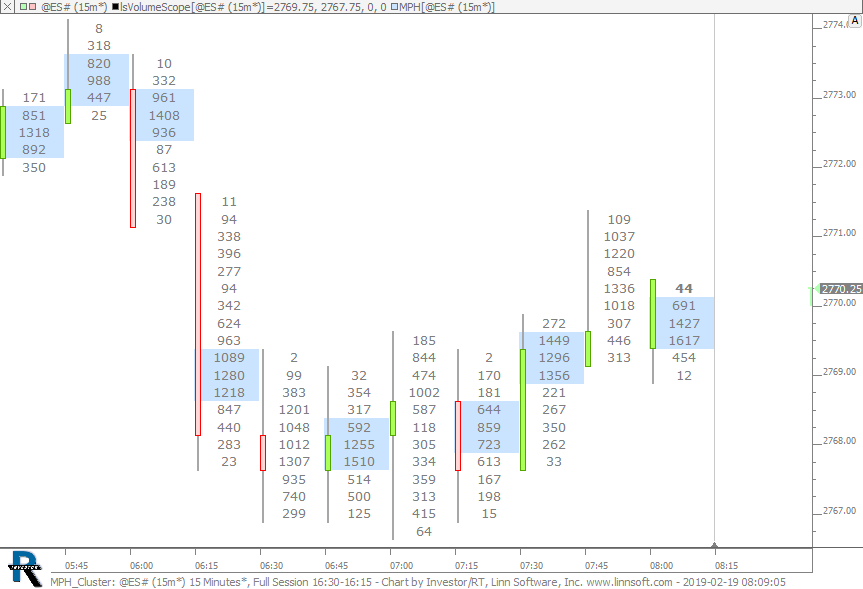 |
MPH Cluster (@ES#) cpayne [totalcount]
7 years 4 months ago
This chart was uploaded by Investor/RT 13.5.19 showing symbol: @ES#. |
View |
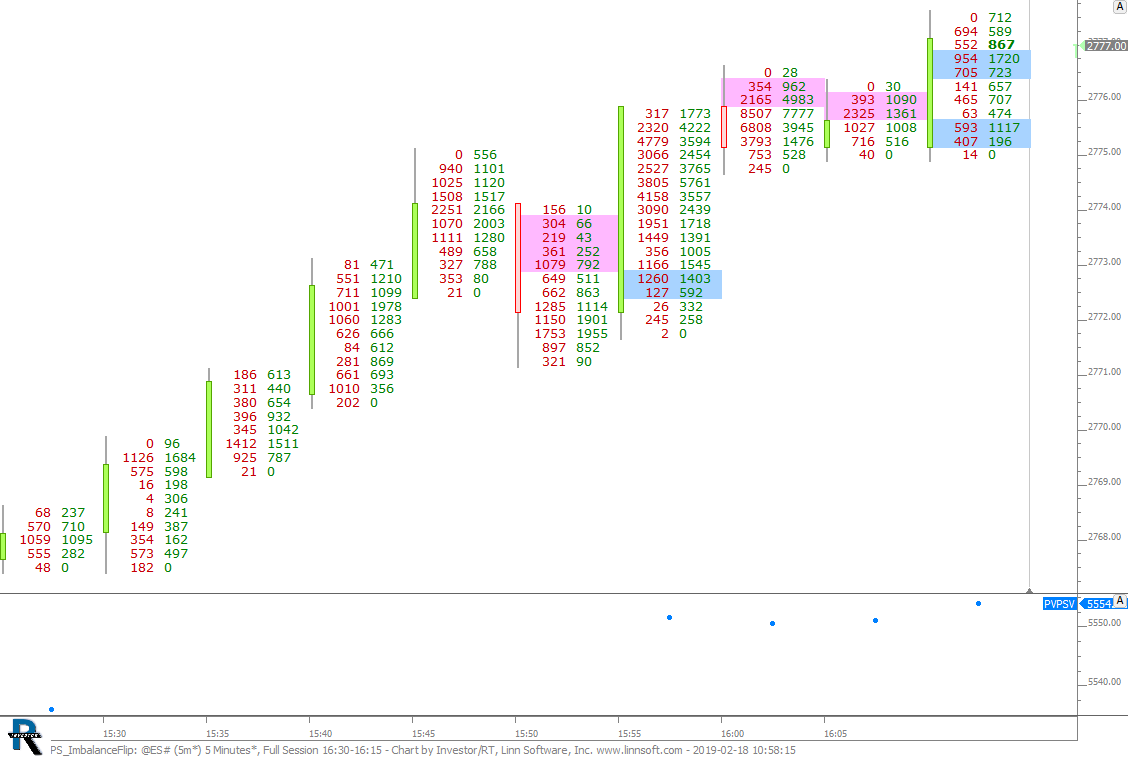 |
PS ImbalanceFlip (@ES#) cpayne [totalcount]
7 years 4 months ago
This chart was uploaded by Investor/RT 13.5.19 showing symbol: @ES#. |
View |
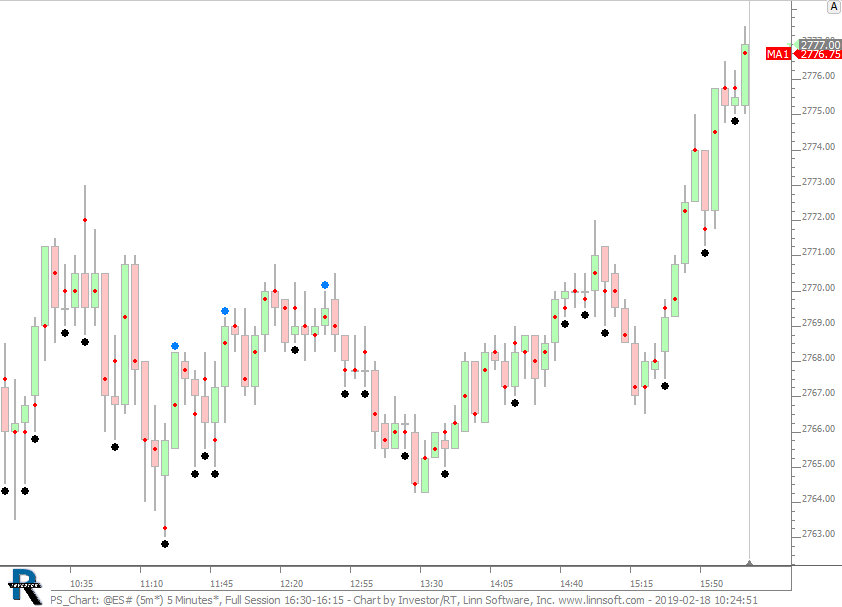 |
PS Chart (@ES#) cpayne [totalcount]
7 years 4 months ago
This chart was uploaded by Investor/RT 13.5.19 showing symbol: @ES#. |
View |
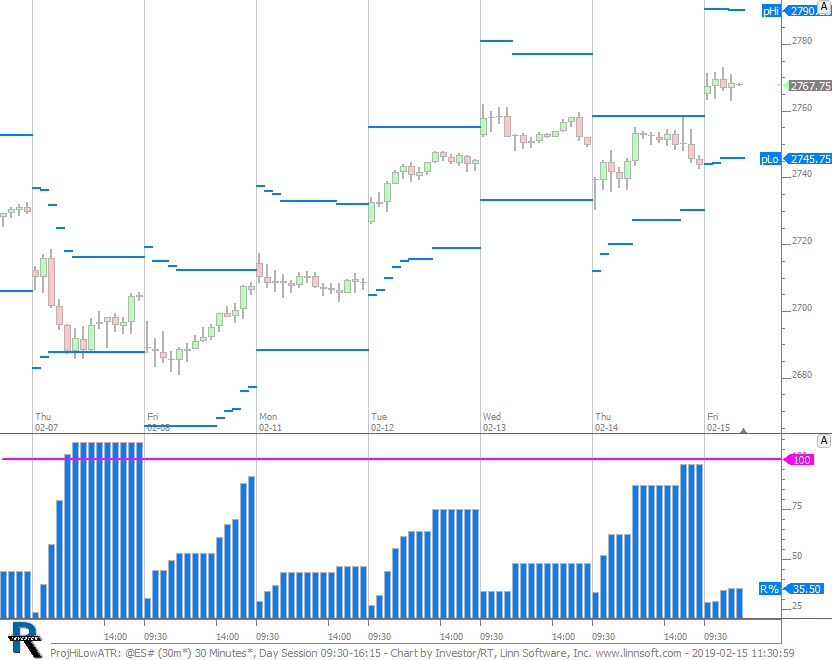 |
ProjHiLowATR (@ES#) cpayne [totalcount]
7 years 5 months ago
Projected High and Low - ATR Based. This chart was uploaded by Investor/RT 13.5.19 showing symbol: @ES#. |
View |
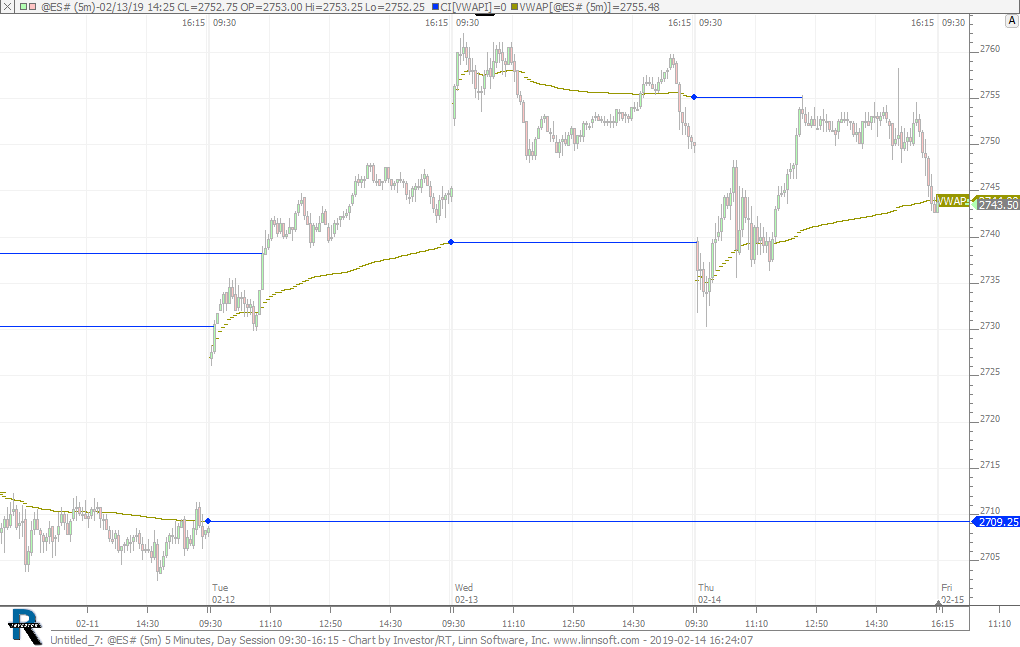 |
Untitled 7 (@ES#) 2 cpayne [totalcount]
7 years 5 months ago
This chart was uploaded by Investor/RT 13.5.19 showing symbol: @ES#. |
View |
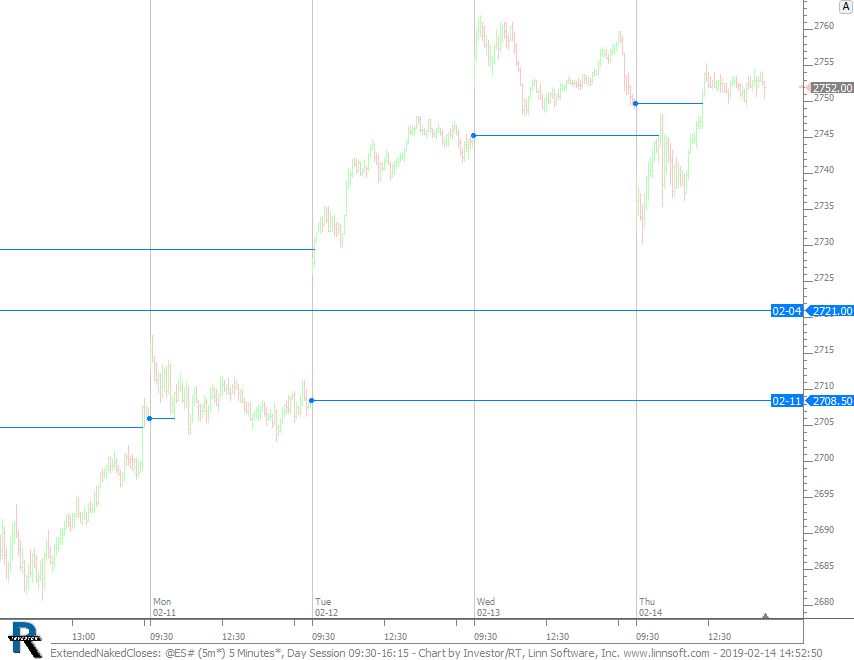 |
ExtendedNakedCloses (@ES#) cpayne [totalcount]
7 years 5 months ago
Extended Naked Closes using Custom Indicator. This chart was uploaded by Investor/RT 13.5.19 showing symbol: @ES#. |
View |
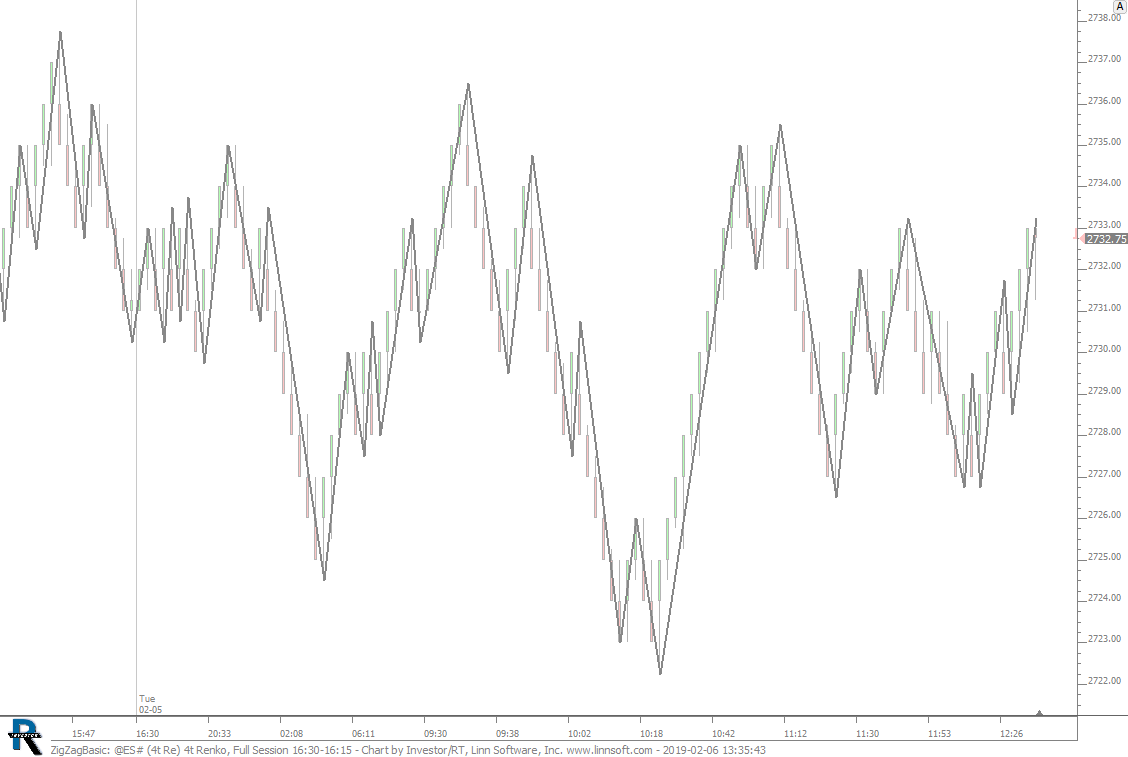 |
ZigZagBasic (@ES#) cpayne [totalcount]
7 years 5 months ago
This chart was uploaded by Investor/RT 13.5.17 showing symbol: @ES#. |
View |
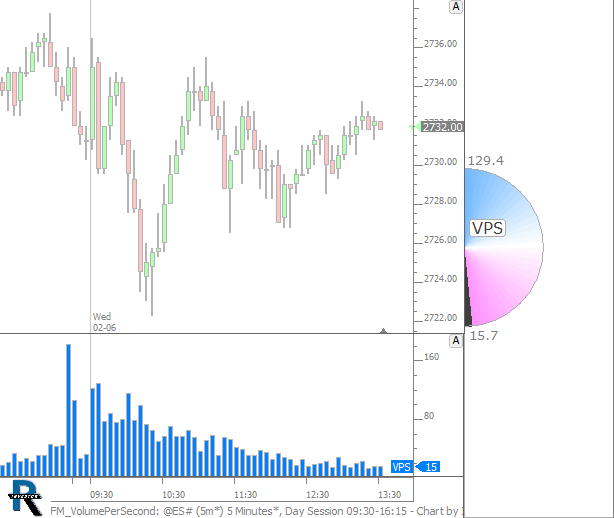 |
FM VolumePerSecond (@ES#) cpayne [totalcount]
7 years 5 months ago
FlexMeters - Volume Per Second. This chart was uploaded by Investor/RT 13.5.17 showing symbol: @ES#. |
View |
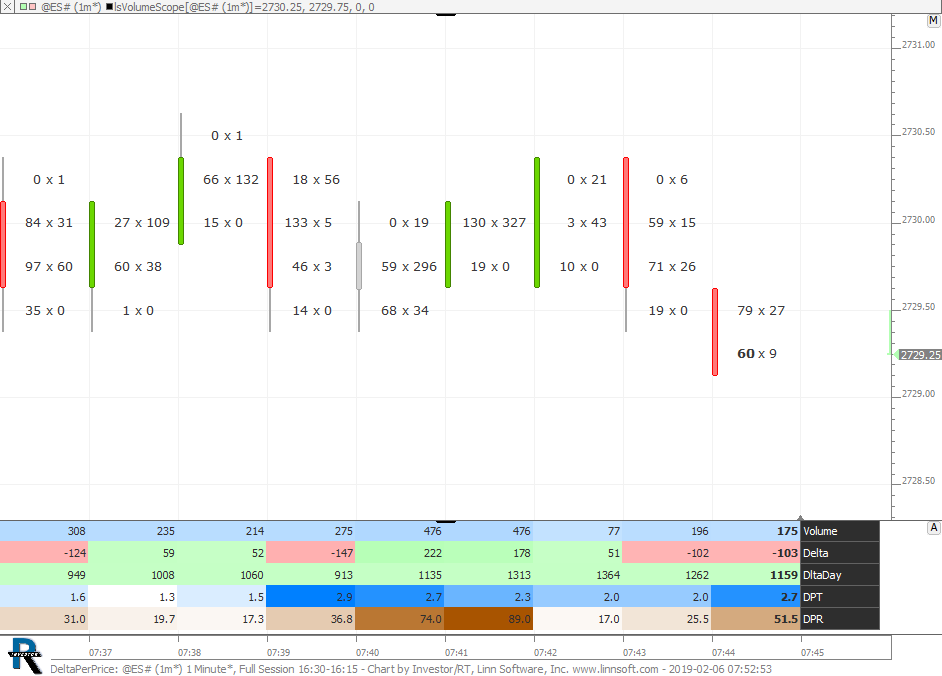 |
DeltaPerPrice (@ES#) cpayne [totalcount]
7 years 5 months ago
Delta Per Price (ABS). This chart was uploaded by Investor/RT 13.5.17 showing symbol: @ES#. |
View |
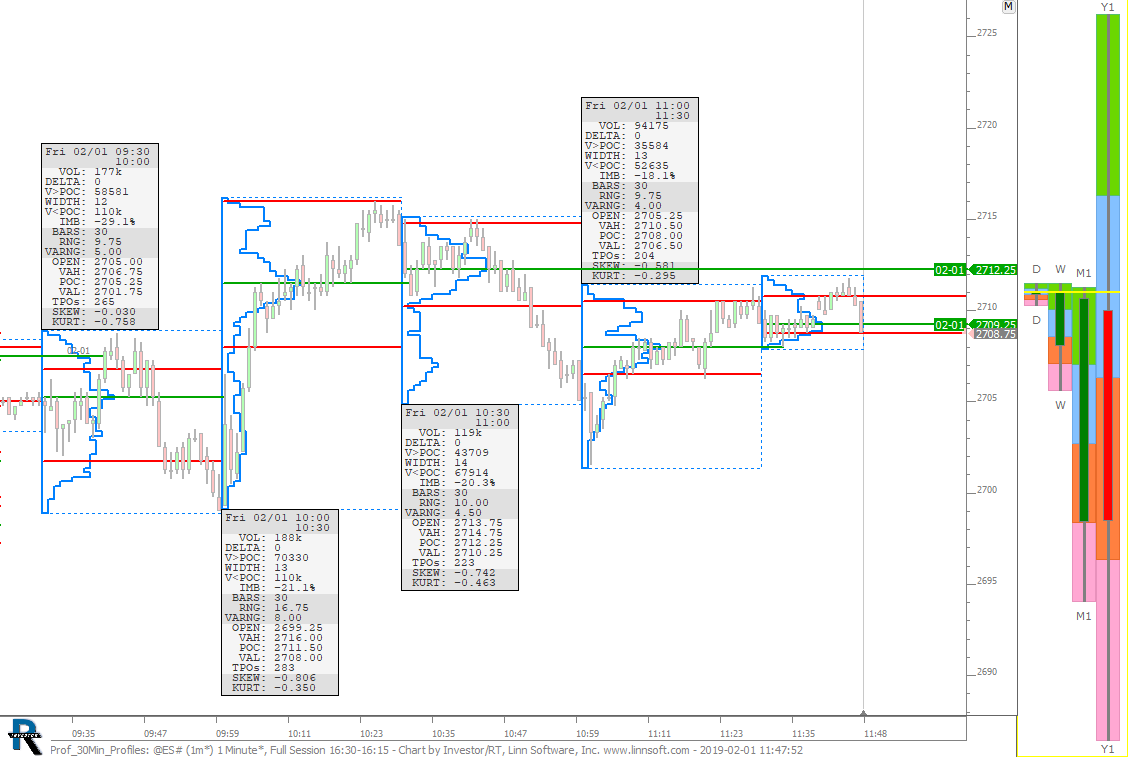 |
Prof 30Min Profiles (@ES#) cpayne [totalcount]
7 years 5 months ago
Profile Indicator - 30 Minute Profiles - 1 Minute TPOs. This chart was uploaded by Investor/RT 13.5.17 showing symbol: @ES#. |
View |
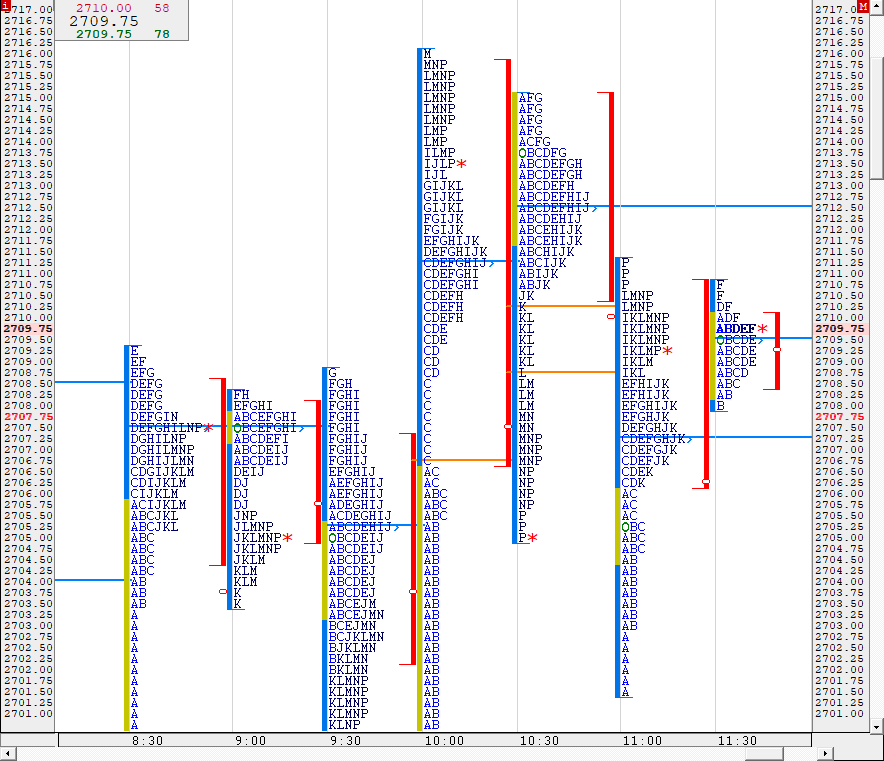 |
TPO 30Min ES (@ES#) cpayne [totalcount]
7 years 5 months ago
30 Minute Profiles - 2 Minute TPOs. This chart was uploaded by Investor/RT 13.5.17 showing symbol: @ES#. |
View |