 |
DeltaDivergence (@ES#) cpayne [totalcount]
7 years 6 months ago
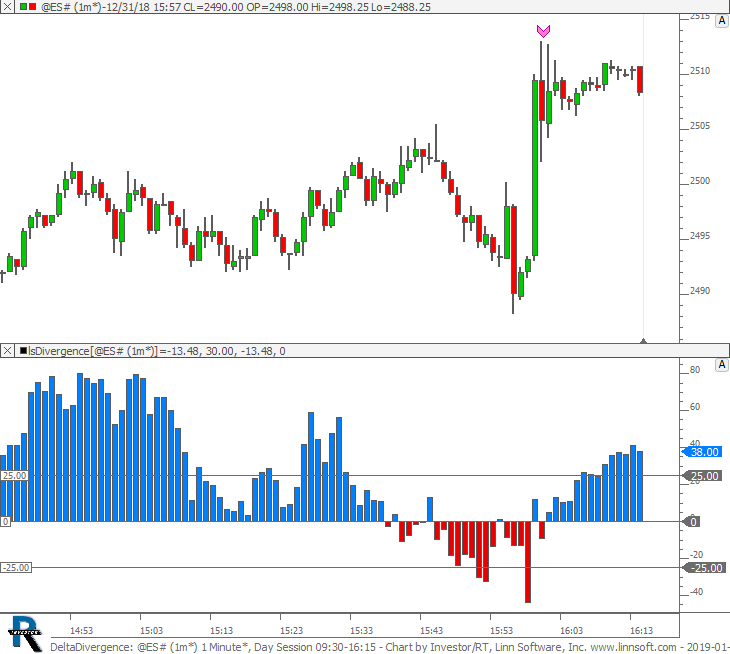
Delta Divergence. This chart was uploaded by Investor/RT 12.5.9 showing symbol: @ES#. |
View |
 |
RevEngCloseMeetsMovAvg (@ES#) cpayne [totalcount]
7 years 6 months ago
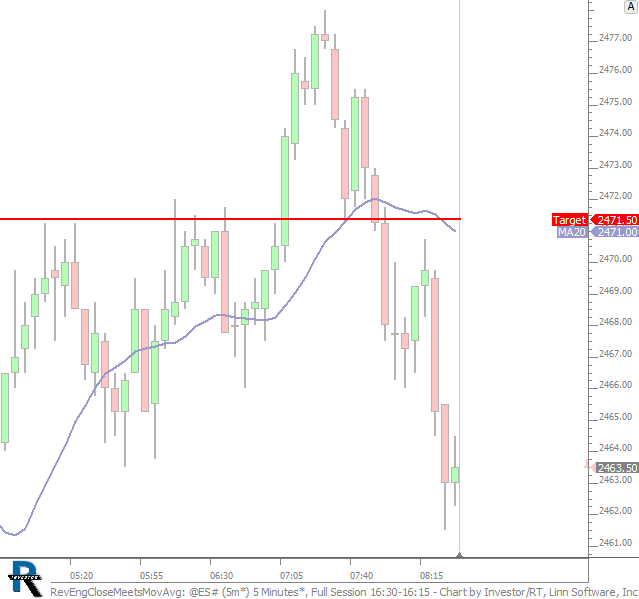
Reverse Enginner Indicator projects where close must move withn current bar to meet the moving average. This chart was uploaded by Investor/RT 13.5.13 showing symbol: @ES#. |
View |
 |
PrevDayHighLow (@ES#) cpayne [totalcount]
7 years 6 months ago
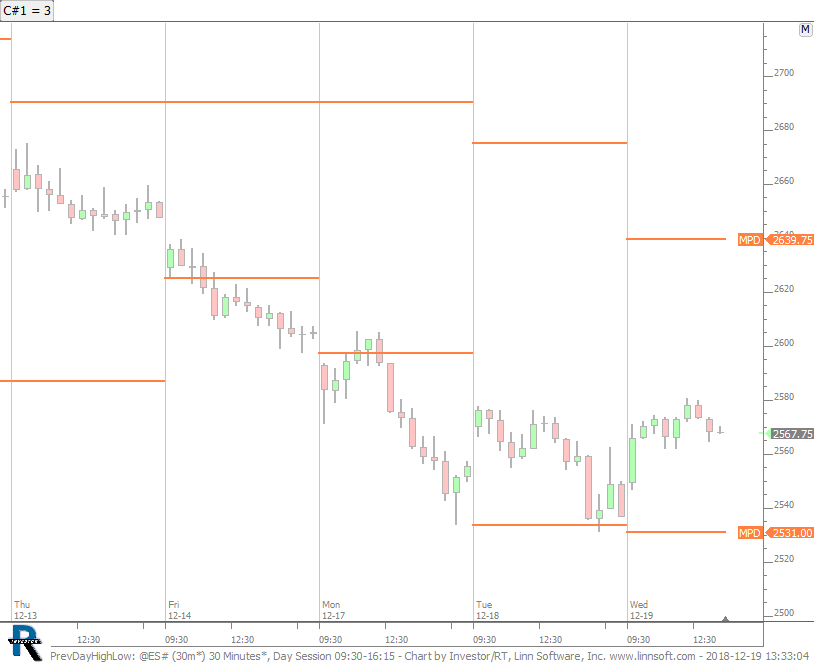
Previous X Day High / Low controlled by button. This chart was uploaded by Investor/RT 13.5.12 showing symbol: @ES#. |
View |
 |
TradersDynamicIndex (@ES#) cpayne [totalcount]
7 years 7 months ago
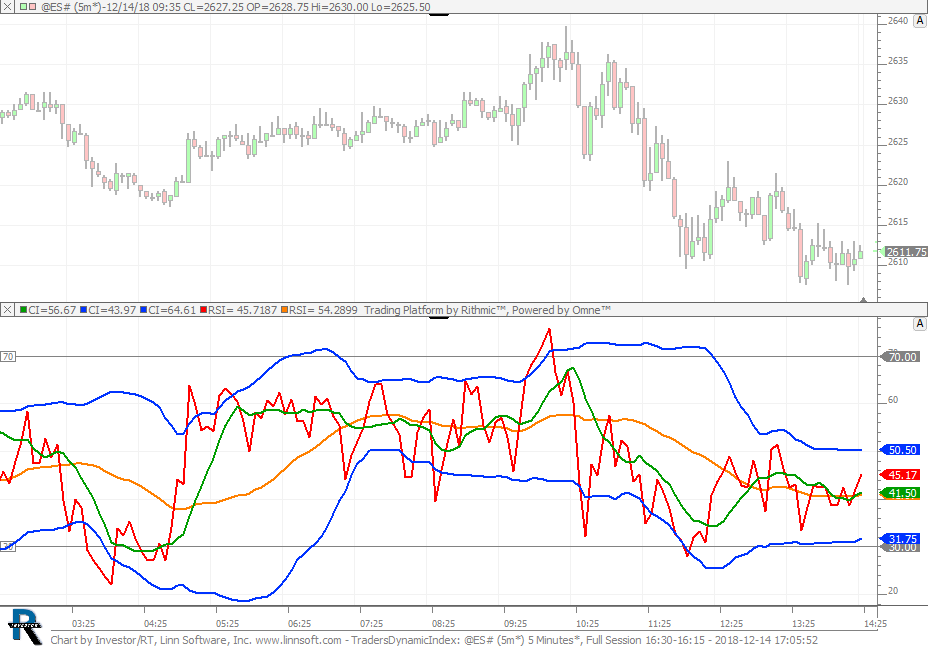
Traders Dynamic Index. This chart was uploaded by Investor/RT 13.5.12 showing symbol: @ES#. |
View |
 |
MBoxChart (@ES#) cpayne [totalcount]
7 years 7 months ago
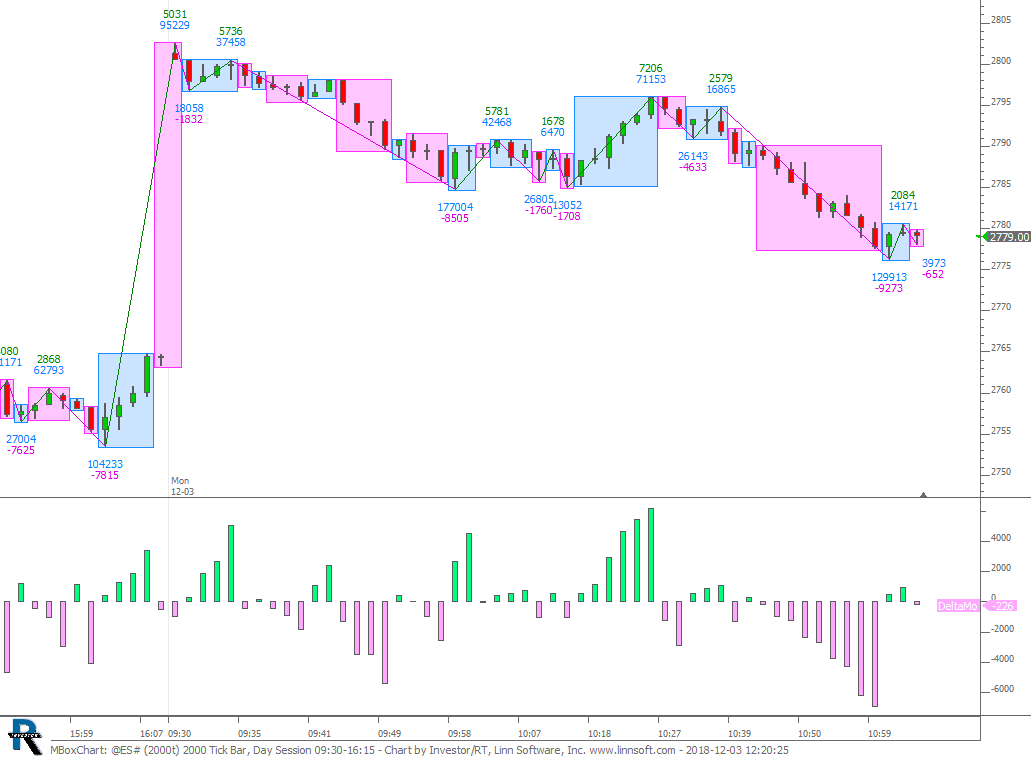
MBox Chart. This chart was uploaded by Investor/RT 13.5.11 showing symbol: @ES#. |
View |
 |
ON VPOC DaySessChart (@ES#) cpayne [totalcount]
7 years 7 months ago
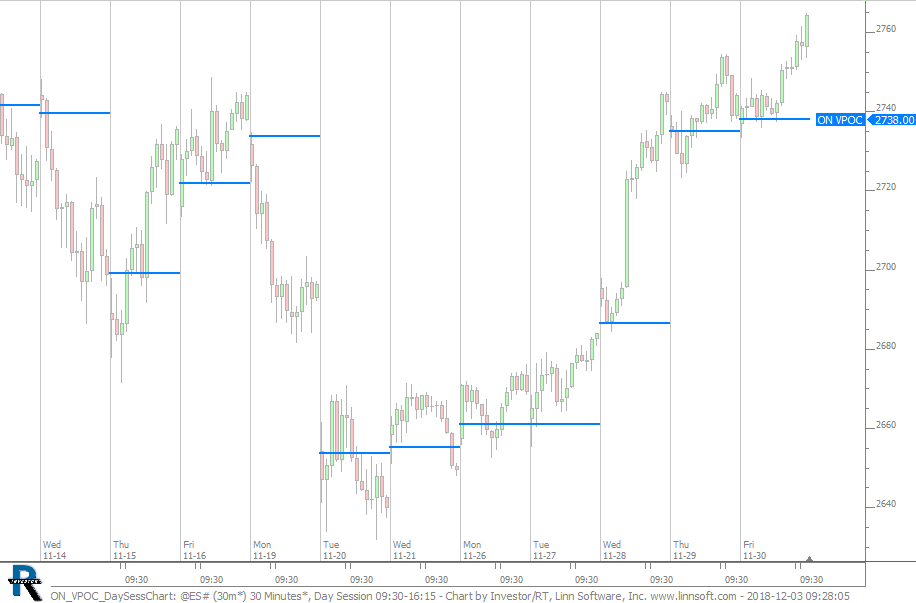
Overnight VPOC on Day Session Chart - Goes back beyond tick data. This chart was uploaded by Investor/RT 13.5.10 showing symbol: @ES#. |
View |
 |
ZZO ChangeOnPivots (@ES#) cpayne [totalcount]
7 years 7 months ago
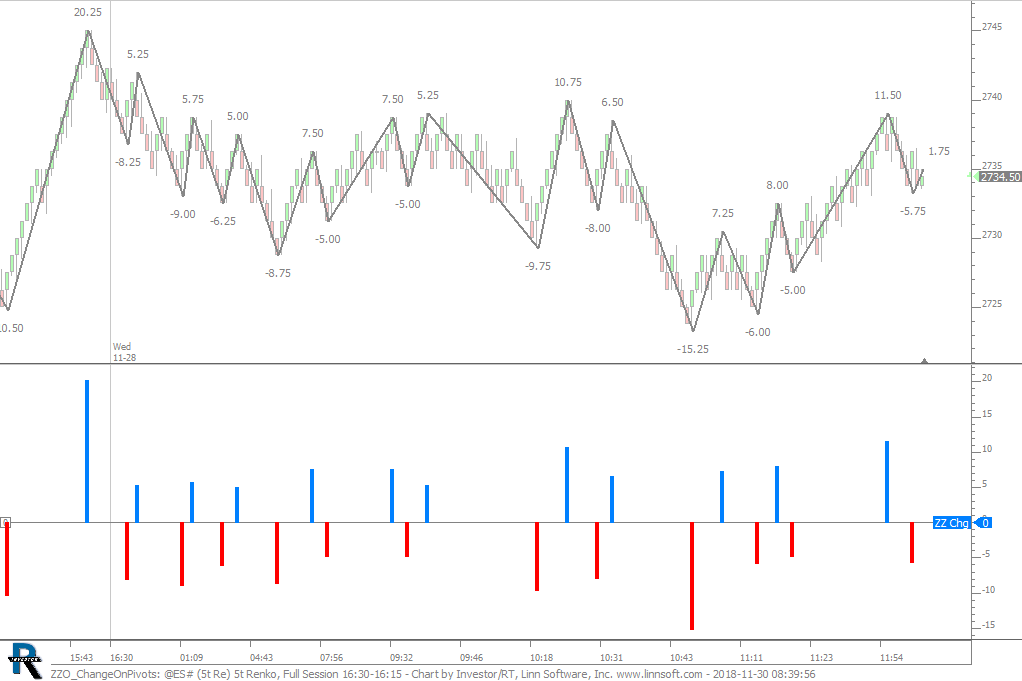
Price Change on Pivot Bars. This chart was uploaded by Investor/RT 13.5.11 showing symbol: @ES#. |
View |
 |
Scope HideLowVolume (BD#) cpayne [totalcount]
7 years 7 months ago
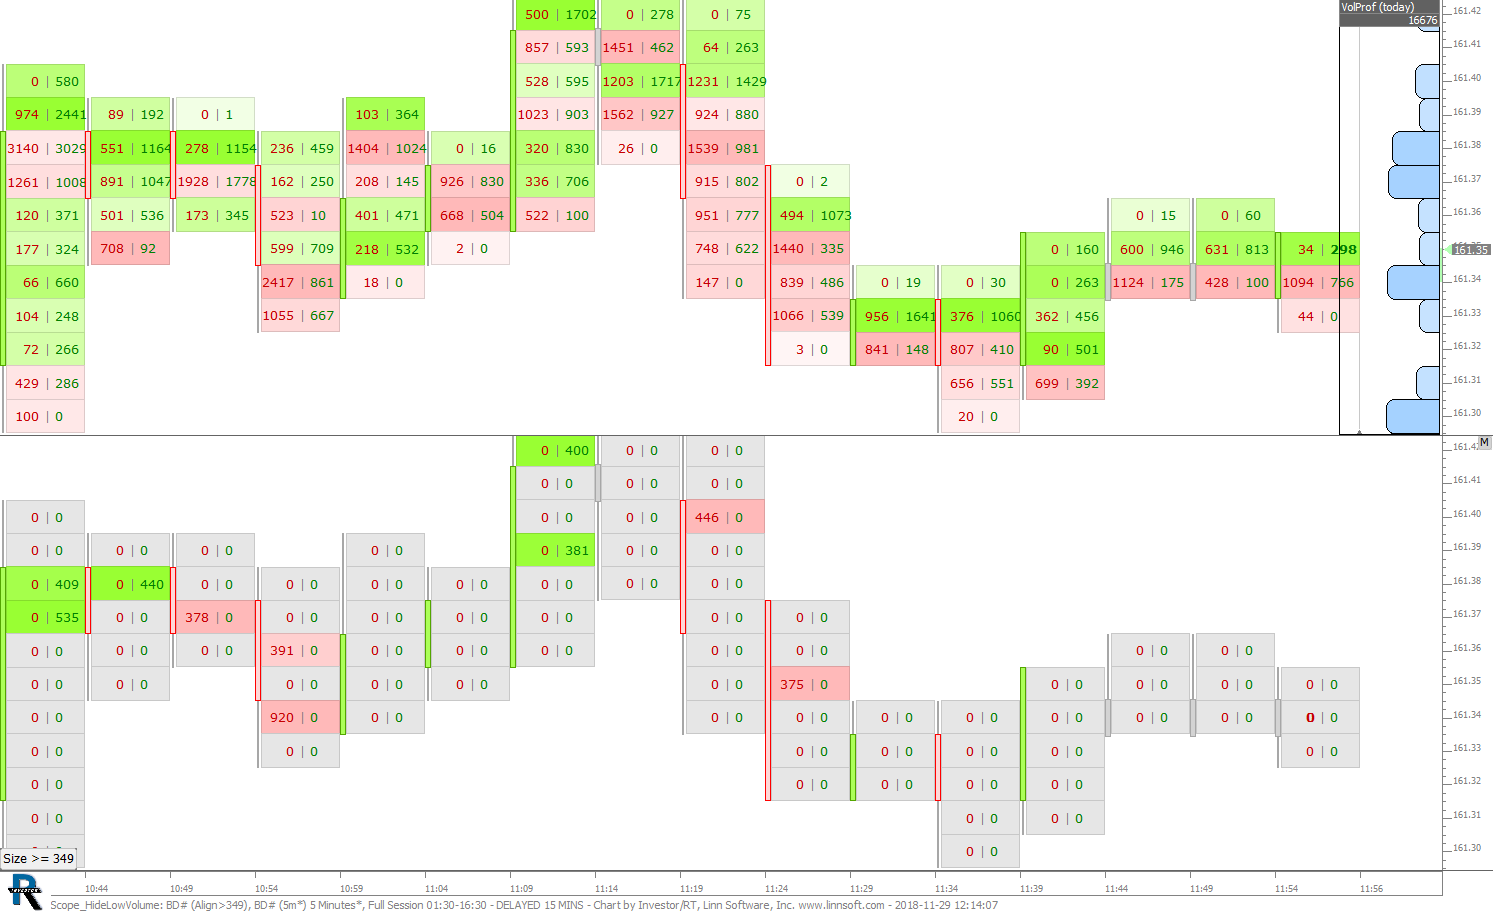
This chart was uploaded by Investor/RT 13.5.10 showing symbol: BD#. |
View |
 |
VAP Extreme Ratios (@ES#) cpayne [totalcount]
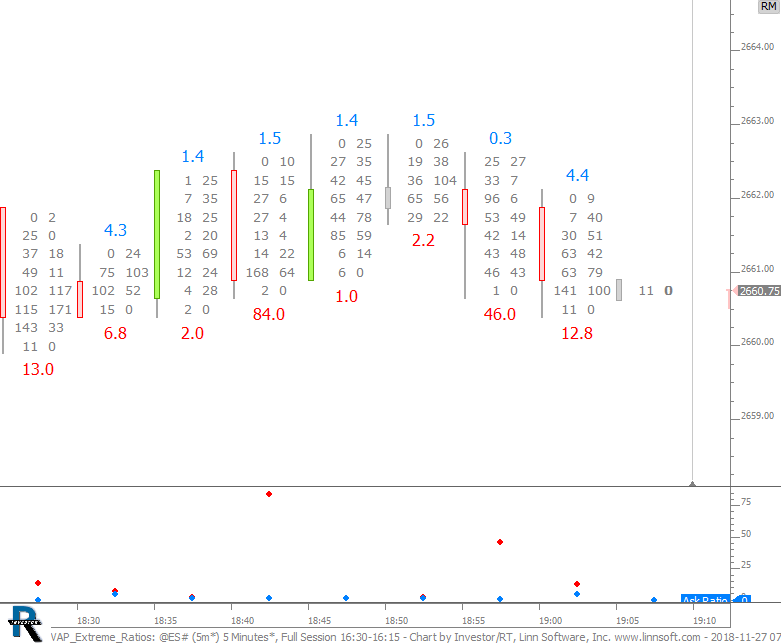
7 years 7 months ago
Ratio of Extreme Bid and Ask Volumes as Text. This chart was uploaded by Investor/RT 13.5.10 showing symbol: @ES#. |
View |
 |
SessionCheck (@ES#) cpayne [totalcount]
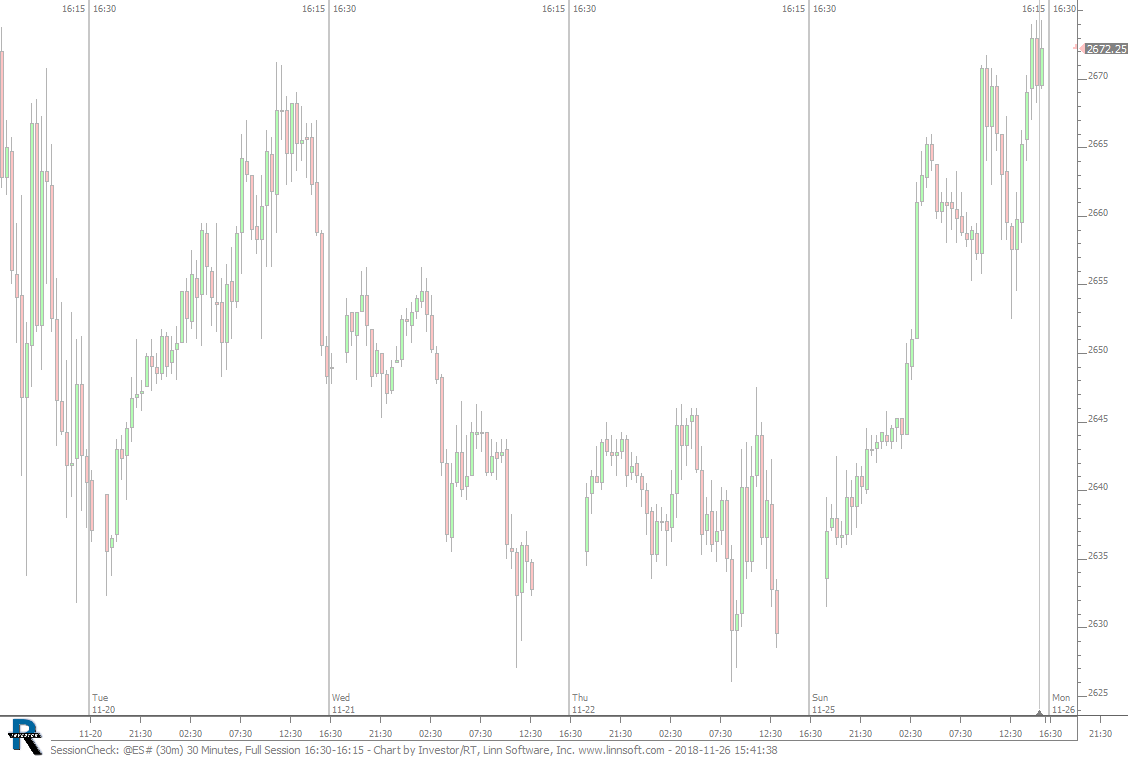
7 years 7 months ago
This chart was uploaded by Investor/RT 13.5.10 showing symbol: @ES#. |
View |
 |
HigherVolDownBar (AAPL) cpayne [totalcount]
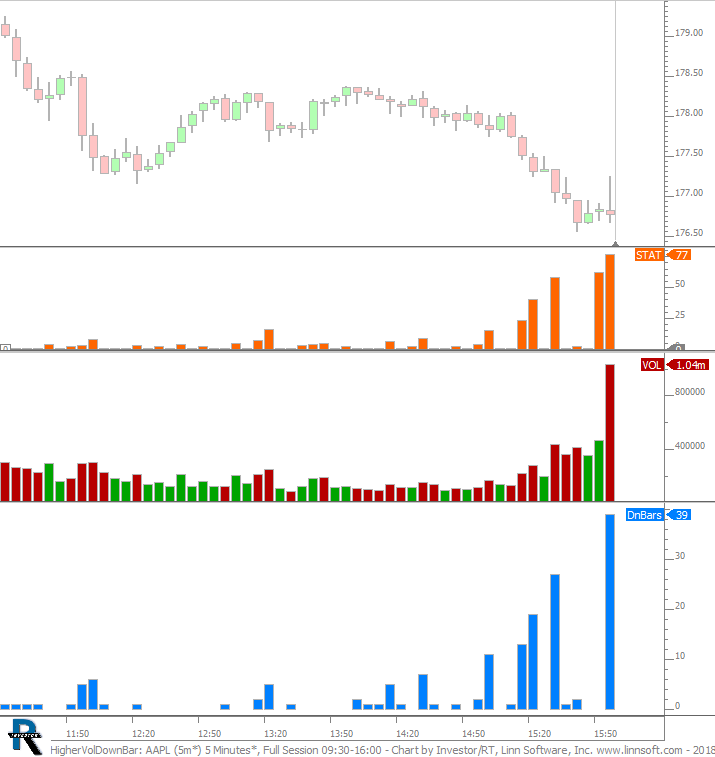
7 years 7 months ago
This chart was uploaded by Investor/RT 13.5.10 showing symbol: AAPL. |
View |
 |
DeltaDivergenceAtHighsLows (@ES#) cpayne [totalcount]
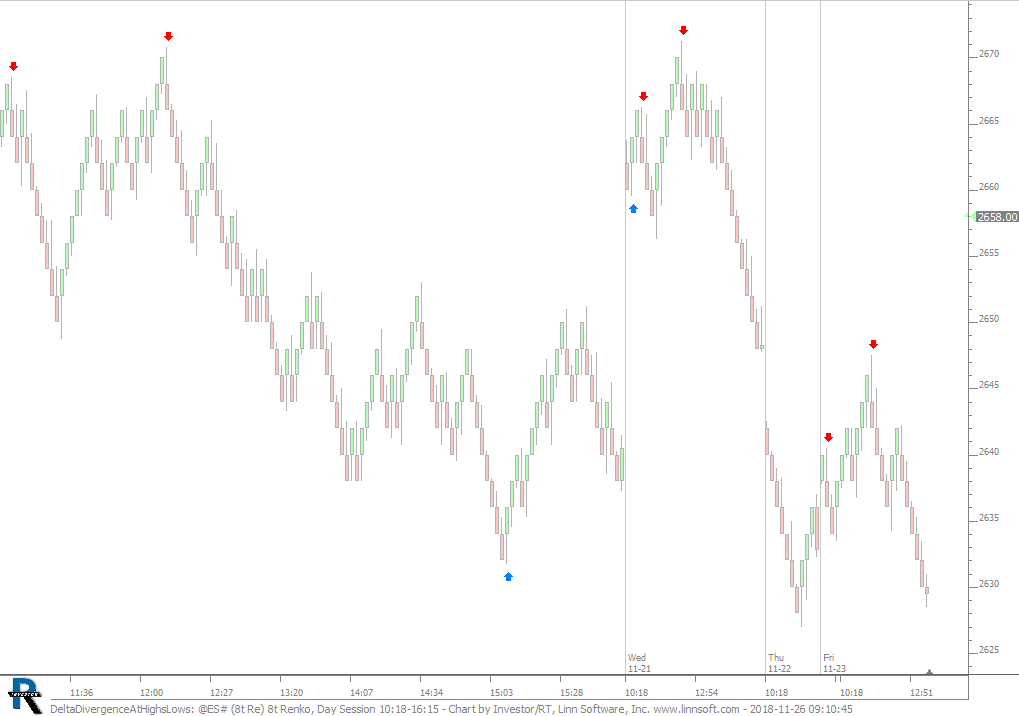
7 years 7 months ago
This chart was uploaded by Investor/RT 13.5.10 showing symbol: @ES#. |
View |
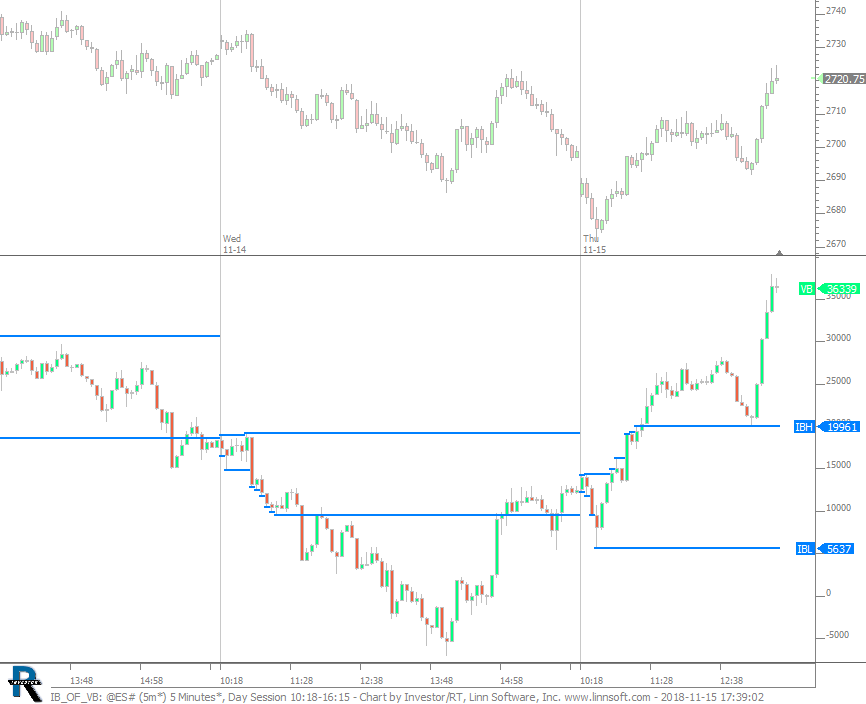 |
IB OF VB (@ES#) cpayne [totalcount]
7 years 8 months ago
IB of Cum Delta. This chart was uploaded by Investor/RT 13.5.10 showing symbol: @ES#. |
View |
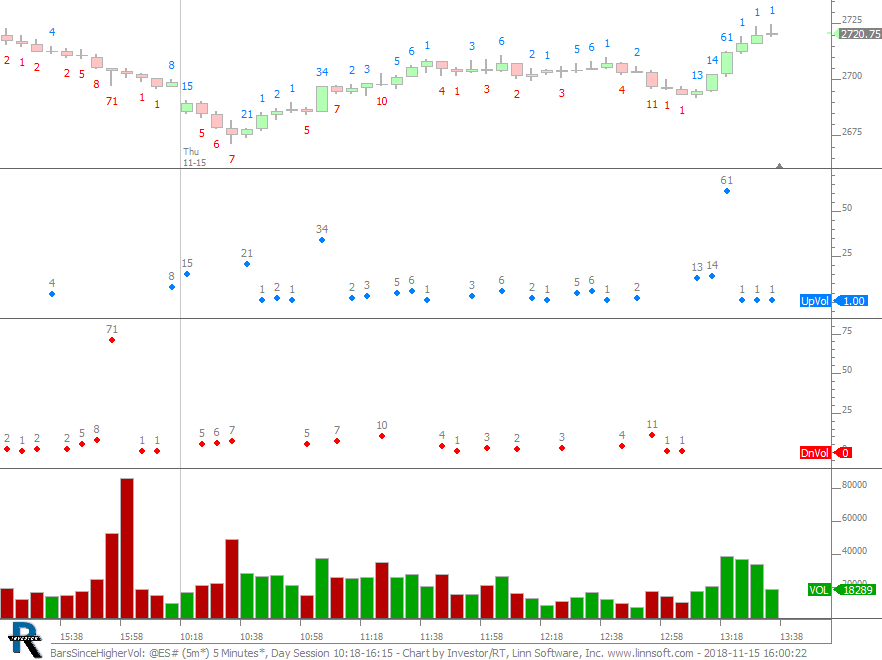 |
BarsSinceHigherVol (@ES#) cpayne [totalcount]
7 years 8 months ago
This chart was uploaded by Investor/RT 13.5.10 showing symbol: @ES#. |
View |
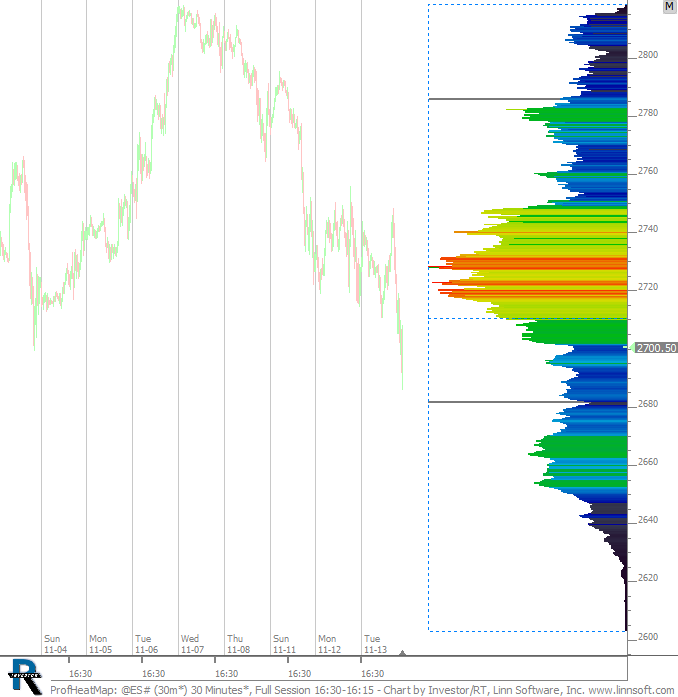 |
ProfHeatMap (@ES#) cpayne [totalcount]
7 years 8 months ago
Heat Map Profile. This chart was uploaded by Investor/RT 13.5.10 showing symbol: @ES#. |
View |
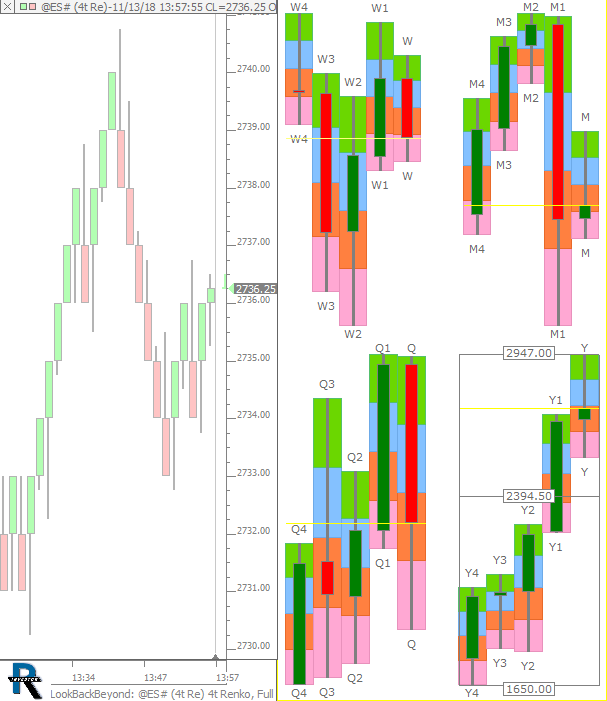 |
LookBackBeyond (@ES#) cpayne [totalcount]
7 years 8 months ago
LookBackCandles and Beyond. This chart was uploaded by Investor/RT 13.5.10 showing symbol: @ES#. |
View |
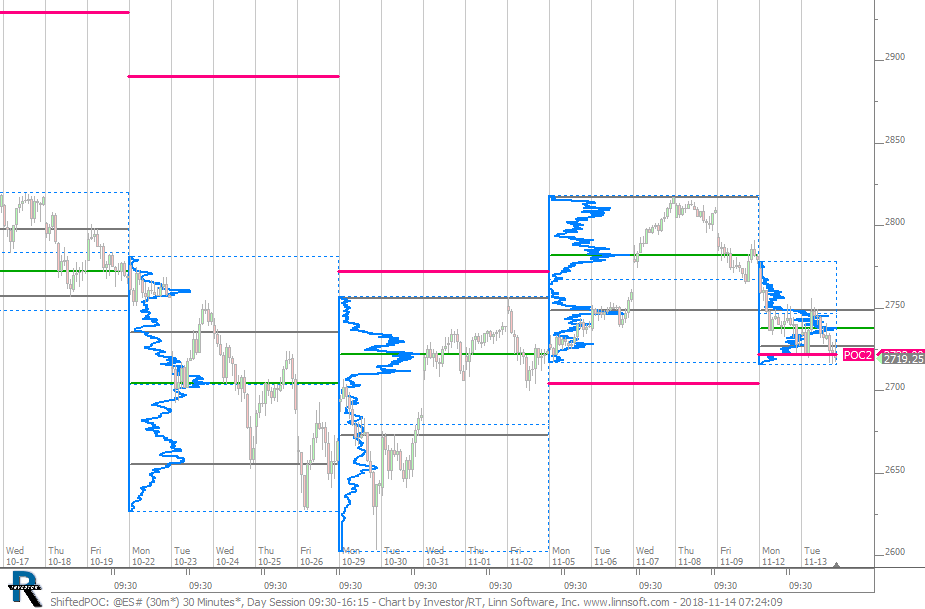 |
ShiftedPOC (@ES#) cpayne [totalcount]
7 years 8 months ago
POC 2 Weeks Back. This chart was uploaded by Investor/RT 13.5.10 showing symbol: @ES#. |
View |
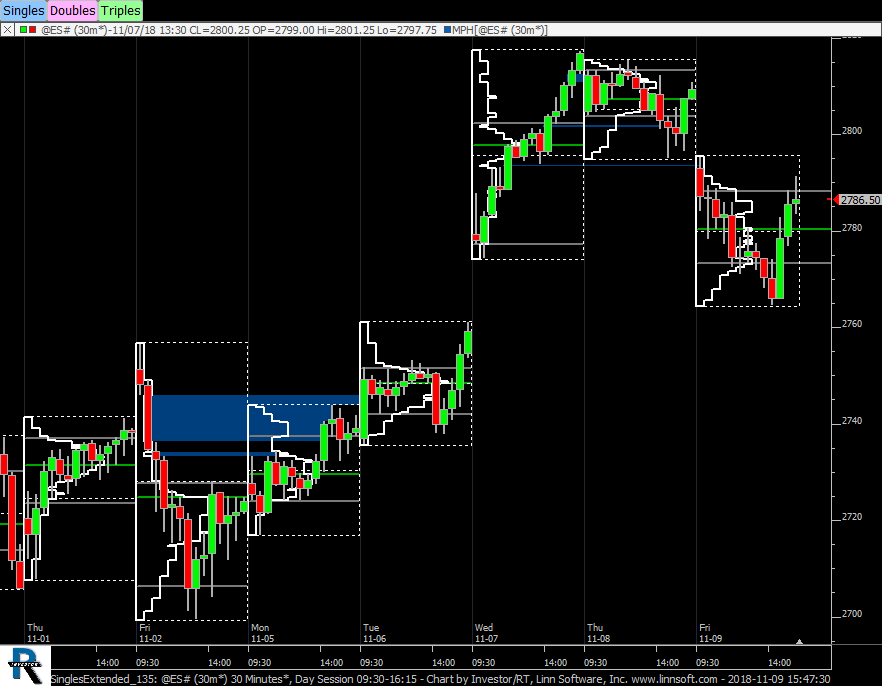 |
SinglesExtended 135 (@ES#) cpayne [totalcount]
7 years 8 months ago
MPH SinglesExtended - Investor/RT 13.5 Webinar. This chart was uploaded by Investor/RT 13.5.9 showing symbol: @ES#. |
View |
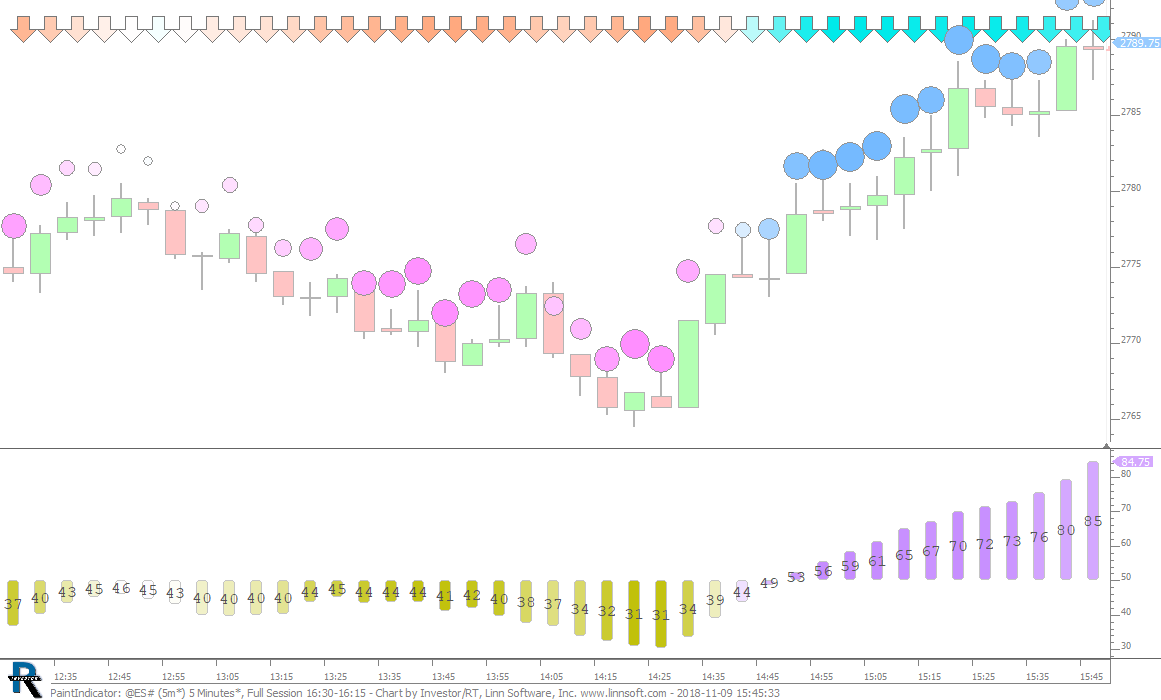 |
PaintIndicator (@ES#) cpayne [totalcount]
7 years 8 months ago
PaintIndicator - Investor/RT 13.5 Webinar. This chart was uploaded by Investor/RT 13.5.9 showing symbol: @ES#. |
View |
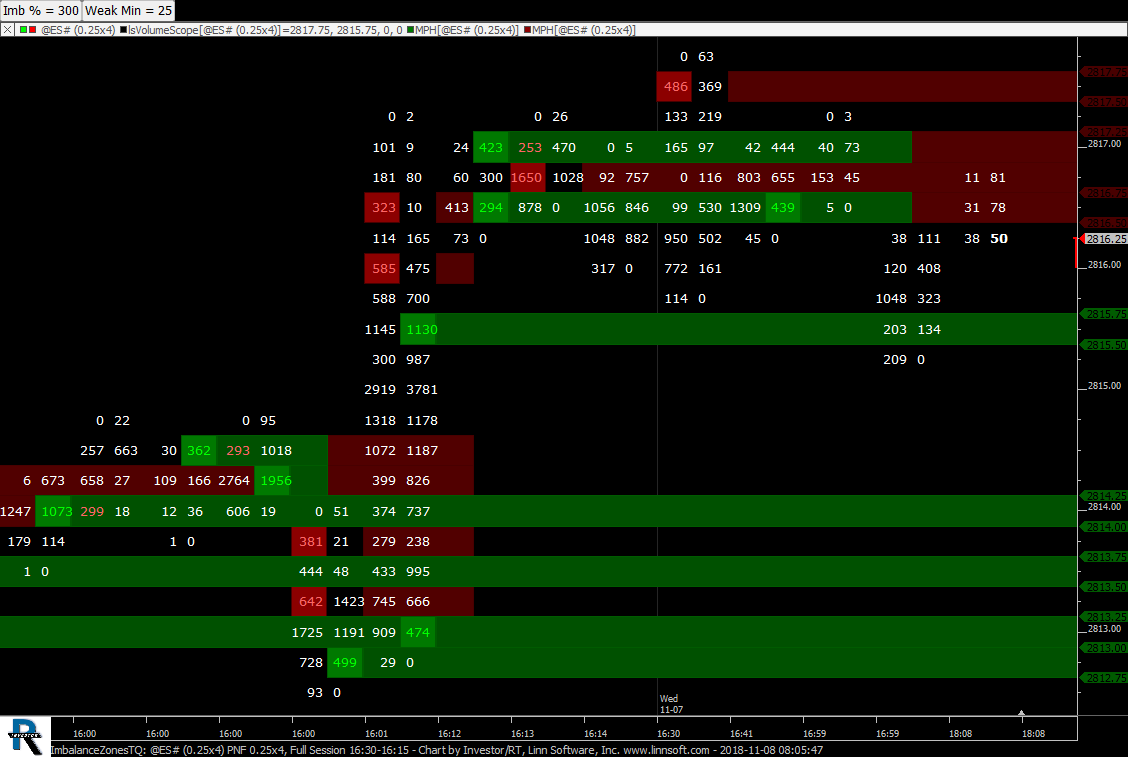 |
ImbalanceZonesTQ (@ES#) cpayne [totalcount]
7 years 8 months ago
This chart was uploaded by Investor/RT 13.5.9 showing symbol: @ES#. |
View |
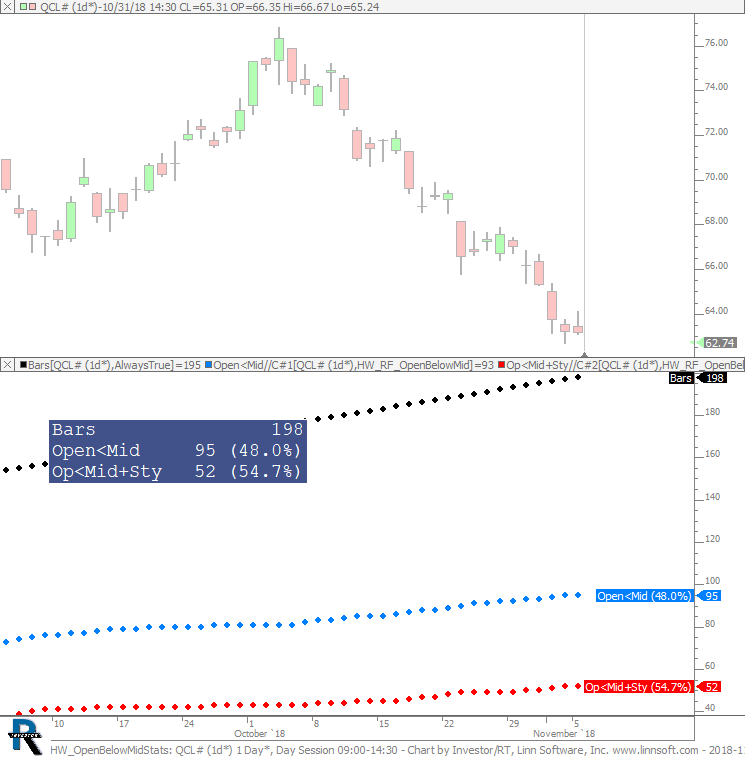 |
HW OpenBelowMidStats (QCL#) cpayne [totalcount]
7 years 8 months ago
Open Below Mid Stats. This chart was uploaded by Investor/RT 13.5.9 showing symbol: QCL#. |
View |
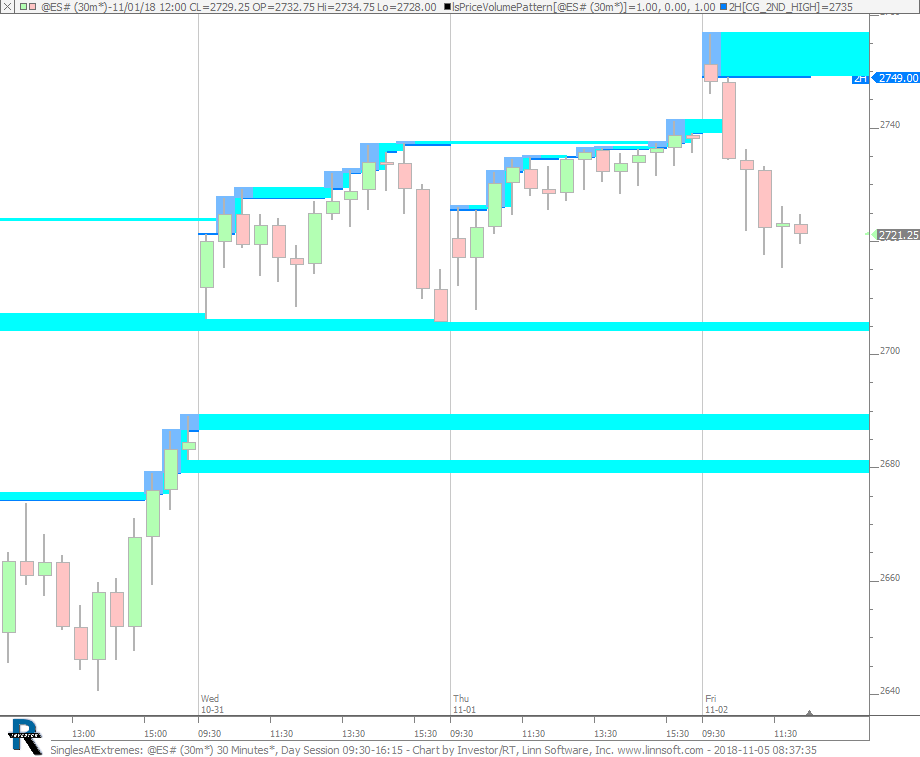 |
SinglesAtExtremes (@ES#) cpayne [totalcount]
7 years 8 months ago
Singles At Extremes. This chart was uploaded by Investor/RT 13.5.9 showing symbol: @ES#. |
View |
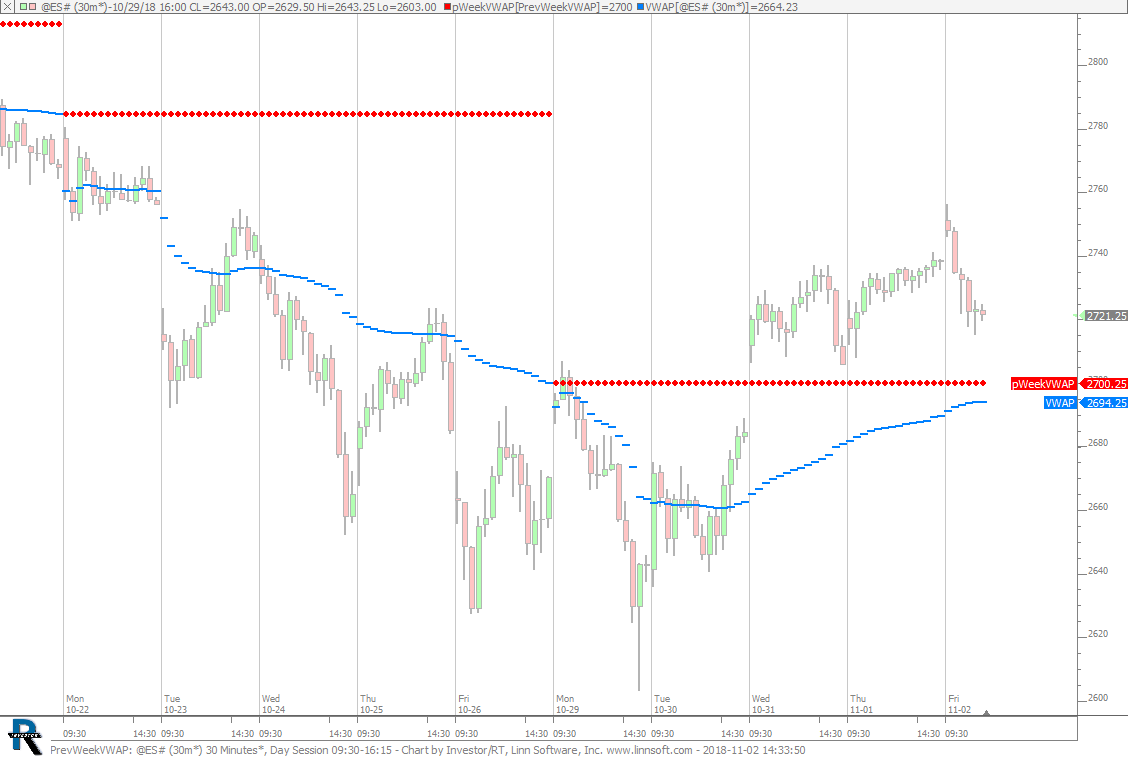 |
PrevWeekVWAP (@ES#) cpayne [totalcount]
7 years 8 months ago
Previous Week VWAP. This chart was uploaded by Investor/RT 13.5.9 showing symbol: @ES#. |
View |
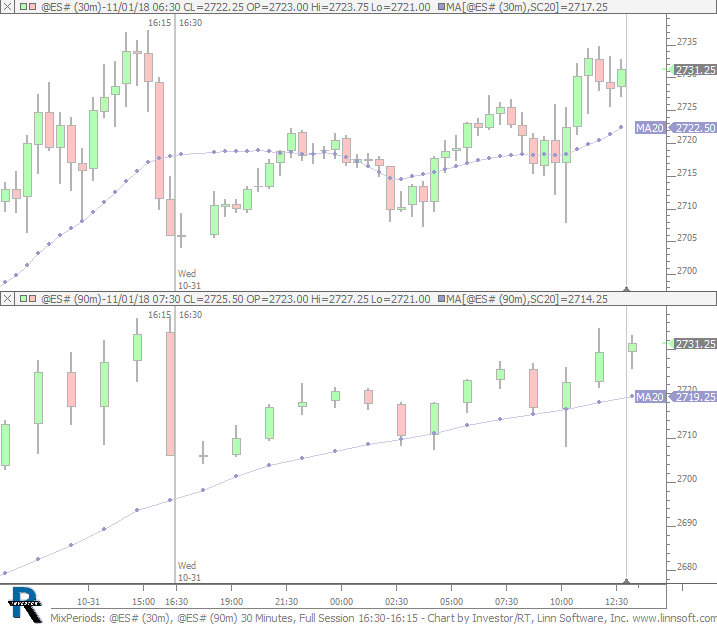 |
MixPeriods (@ES#) cpayne [totalcount]
7 years 8 months ago
This chart was uploaded by Investor/RT 13.5.9 showing symbol: @ES#. |
View |
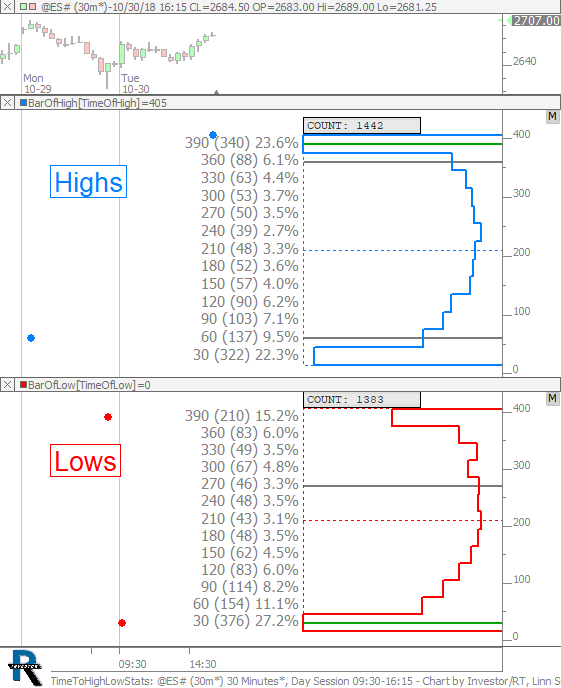 |
TimeToHighLowStats (@ES#) cpayne [totalcount]
7 years 8 months ago
Number of Times the High or Low was made during each Period. This chart was uploaded by Investor/RT 13.5.9 showing symbol: @ES#. |
View |