|
|
Heiken ashi MiniDax 2 (XG#) cpayne [totalcount]
7 years 10 months ago
This chart was uploaded by Investor/RT 13.5.5 showing symbol: XG#. |
View |
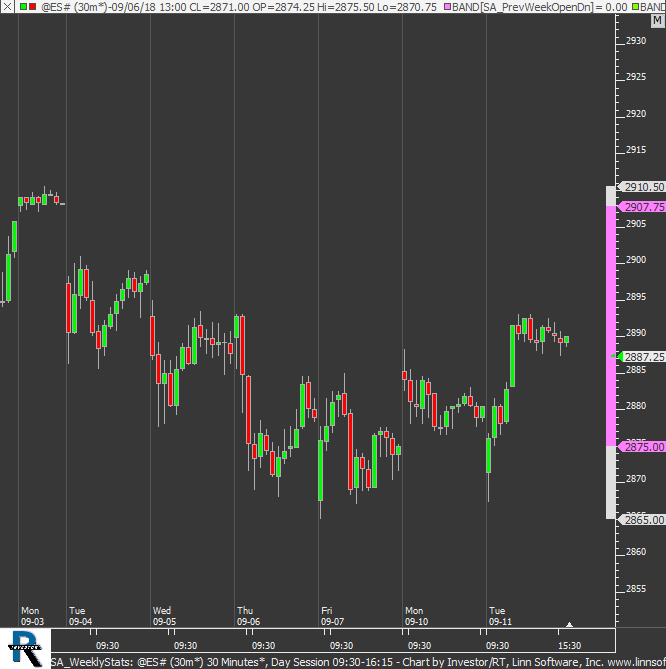 |
SA WeeklyStats (@ES#) cpayne [totalcount]
7 years 10 months ago
Weekly High, Low, Open and Close as Bands. This chart was uploaded by Investor/RT 13.5.5 showing symbol: @ES#. |
View |
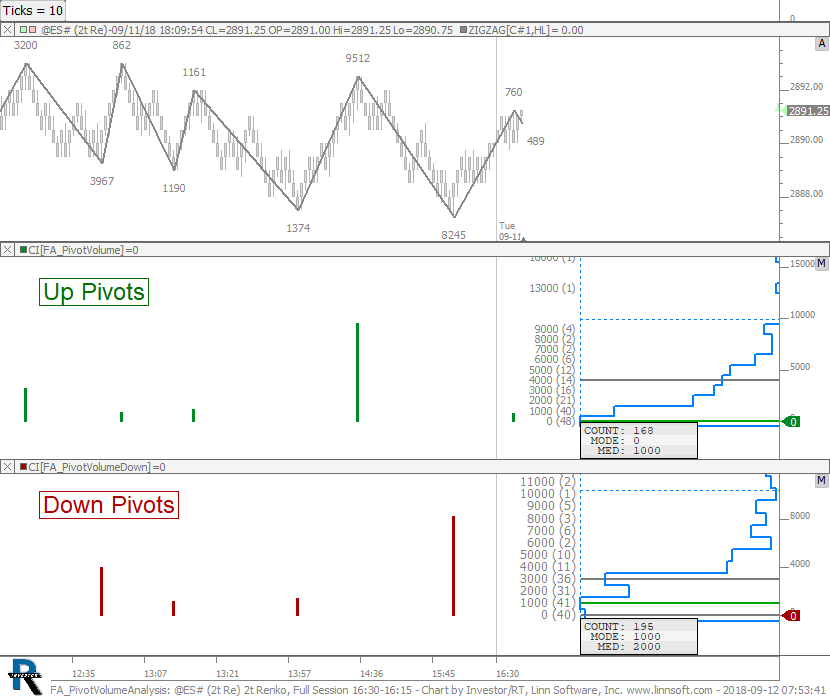 |
FA PivotVolumeAnalysis (@ES#) cpayne [totalcount]
7 years 10 months ago
Volume Analysis on Pivot Bars. This chart was uploaded by Investor/RT 13.5.5 showing symbol: @ES#. |
View |
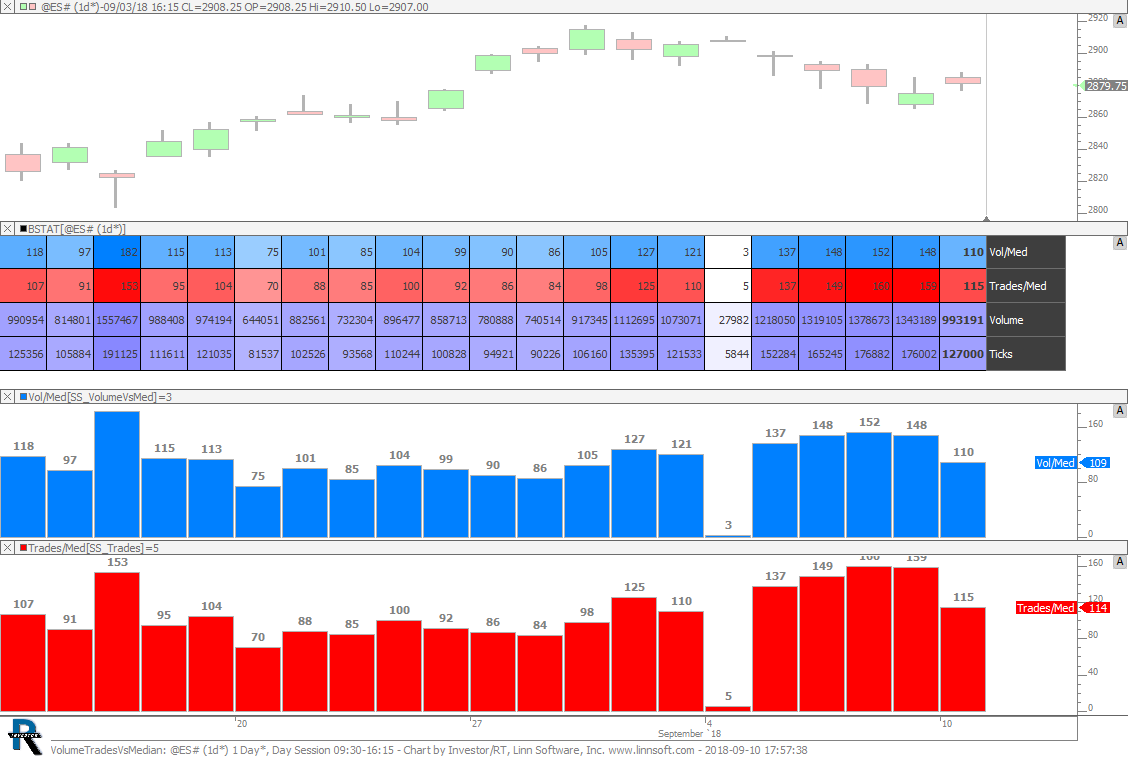 |
VolumeTradesVsMedian (@ES#) cpayne [totalcount]
7 years 10 months ago
Volume and Trades Relative to Median. This chart was uploaded by Investor/RT 13.5.5 showing symbol: @ES#. |
View |
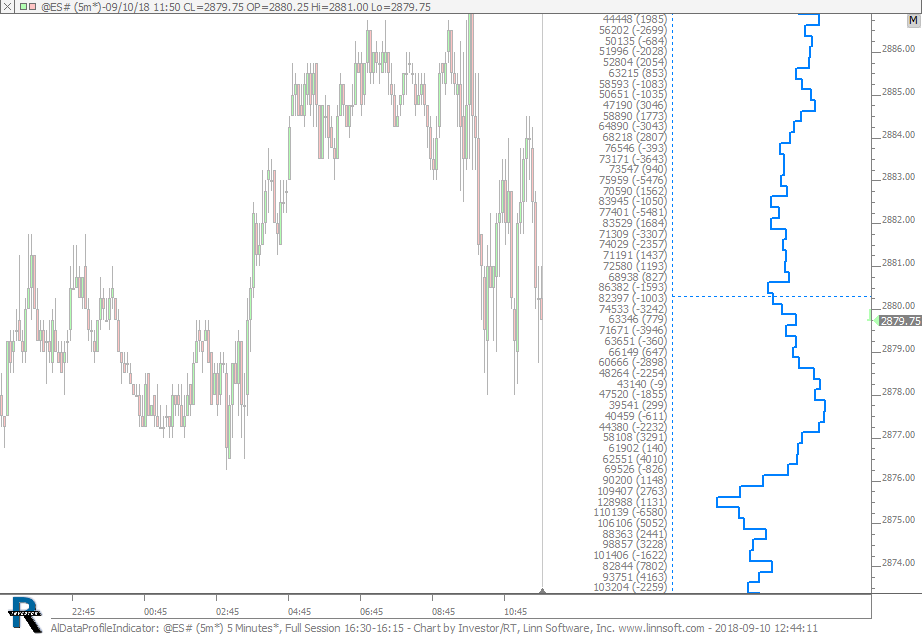 |
AlDataProfileIndicator (@ES#) cpayne [totalcount]
7 years 10 months ago
This chart was uploaded by Investor/RT 13.5.5 showing symbol: @ES#. |
View |
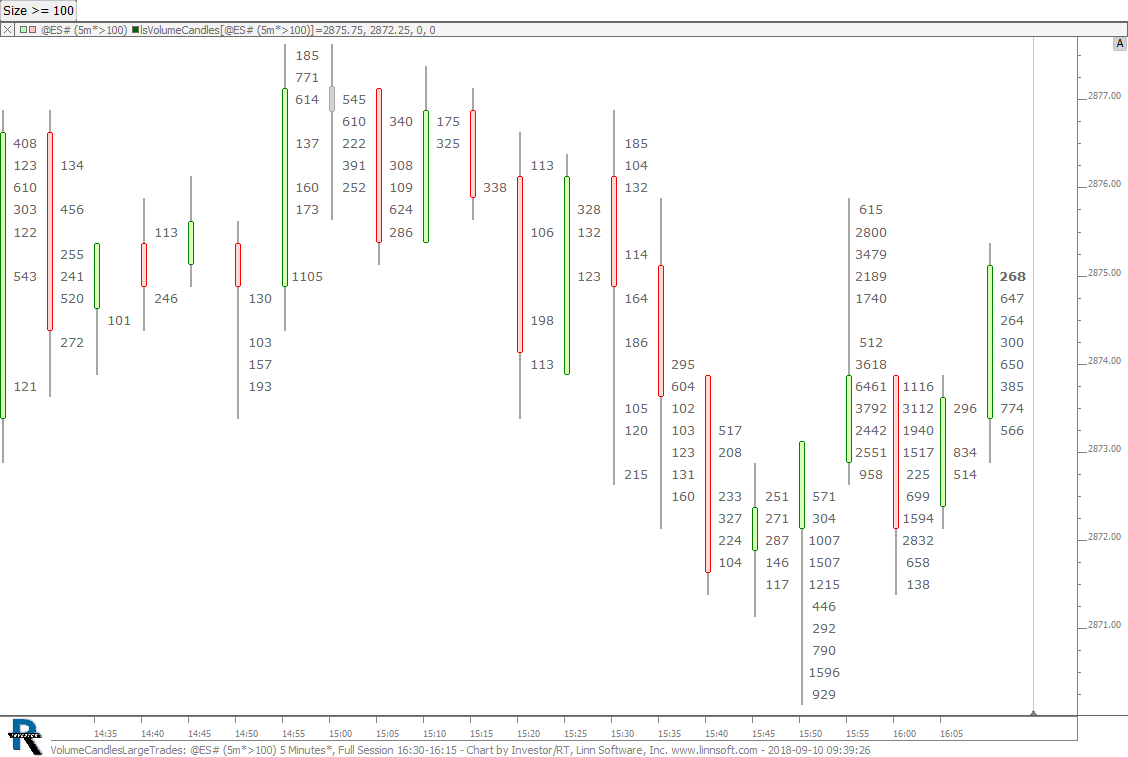 |
VolumeCandlesLargeTrades (@ES#) cpayne [totalcount]
7 years 10 months ago
Using Volume Candles and Volume Filtering to show only the total size of large trades at each price. This chart was uploaded by Investor/RT 13.5.5 showing symbol: @ES#. |
View |
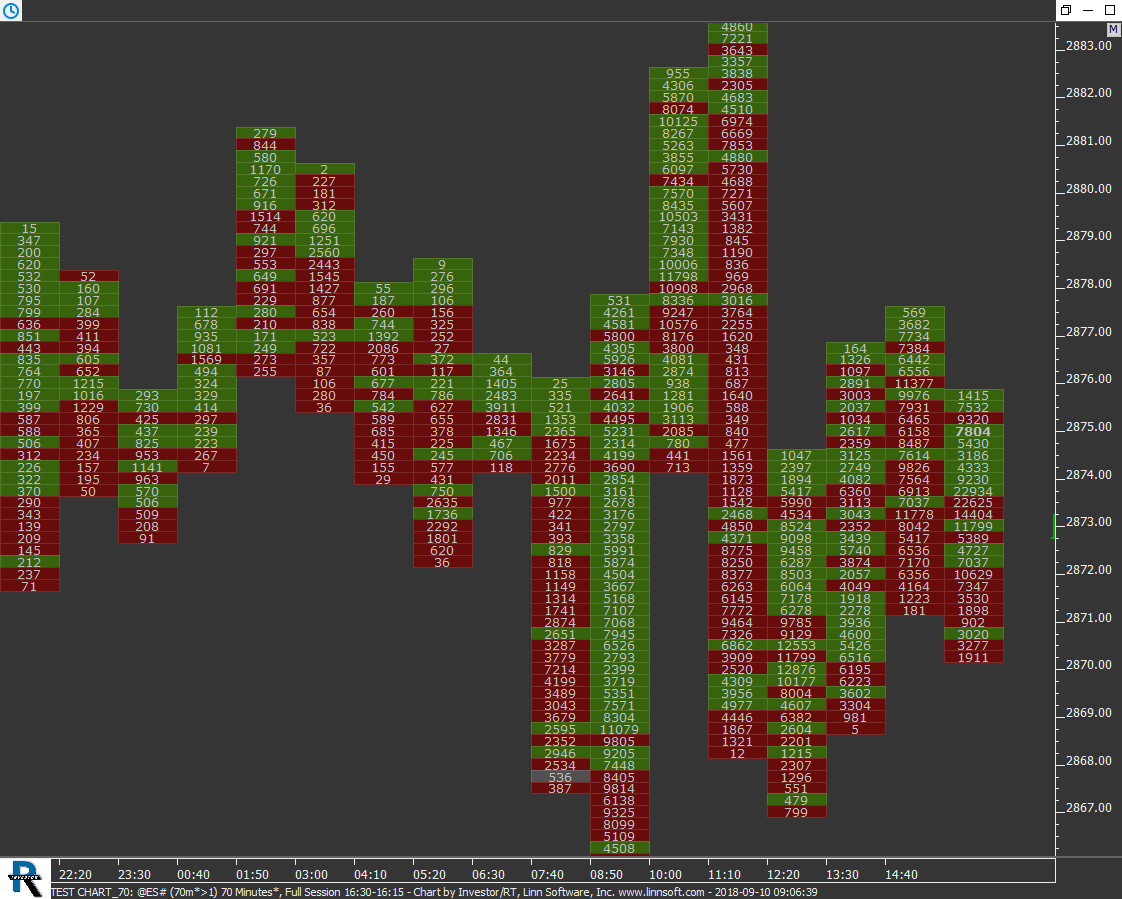 |
TEST CHART 70 (@ES#) cpayne [totalcount]
7 years 10 months ago
This chart was uploaded by Investor/RT 13.5.5 showing symbol: @ES#. |
View |
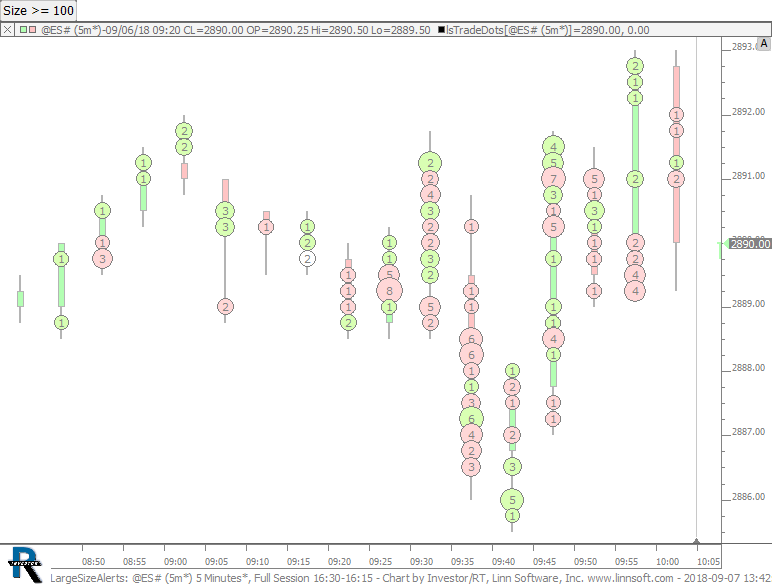 |
LargeSizeAlerts (@ES#) cpayne [totalcount]
7 years 10 months ago
Alerts with Corkpop on large trades (>= 100). This chart was uploaded by Investor/RT 13.5.5 showing symbol: @ES#. |
View |
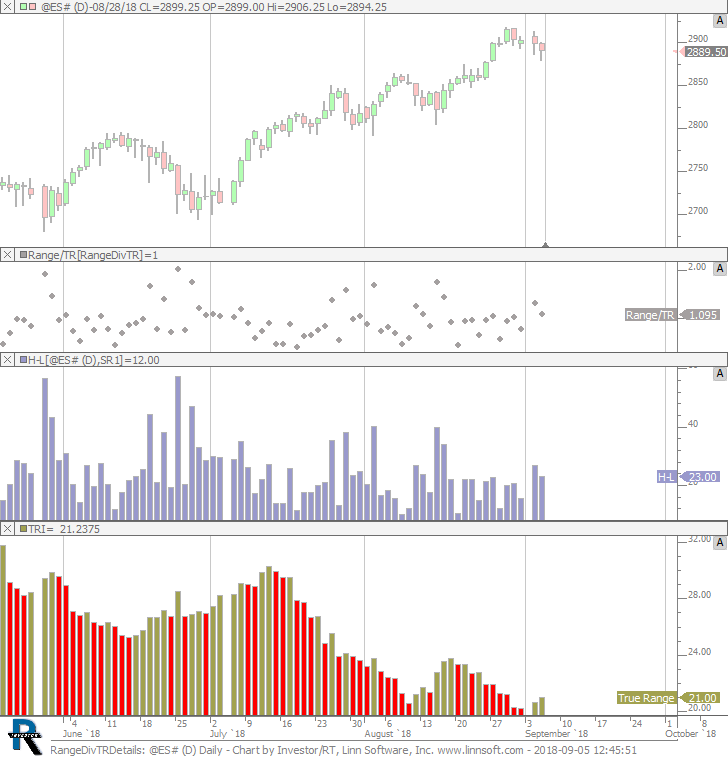 |
RangeDivTRDetails (@ES#) cpayne [totalcount]
7 years 10 months ago
This chart was uploaded by Investor/RT 13.5.5 showing symbol: @ES#. |
View |
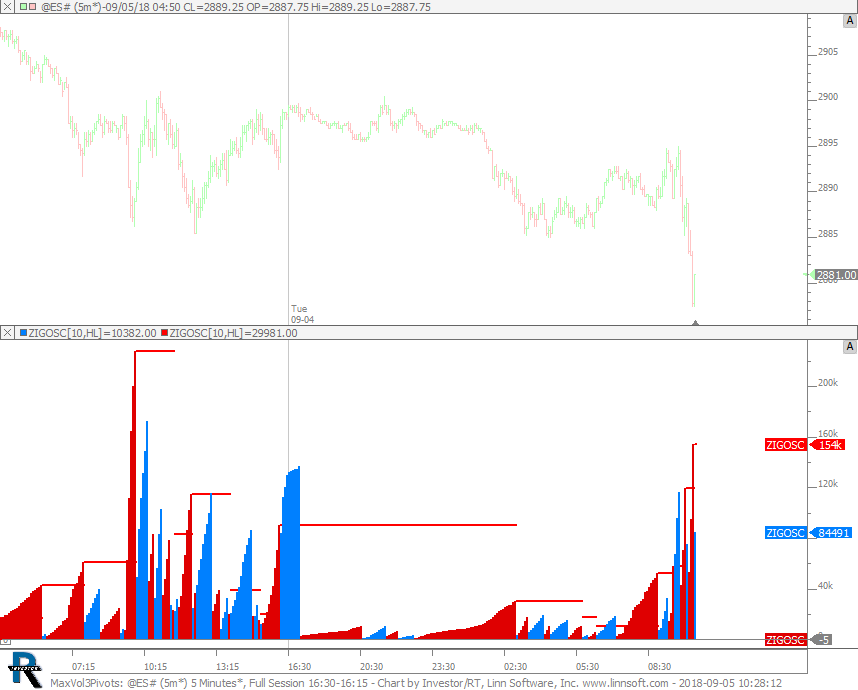 |
MaxVol3Pivots (@ES#) cpayne [totalcount]
7 years 10 months ago
This chart was uploaded by Investor/RT 13.5.5 showing symbol: @ES#. |
View |
 |
RangeDivTR cpayne [totalcount]
7 years 10 months ago
Range Divided by 20 Period True Range. This chart was uploaded by Investor/RT 13.5.5. |
View |
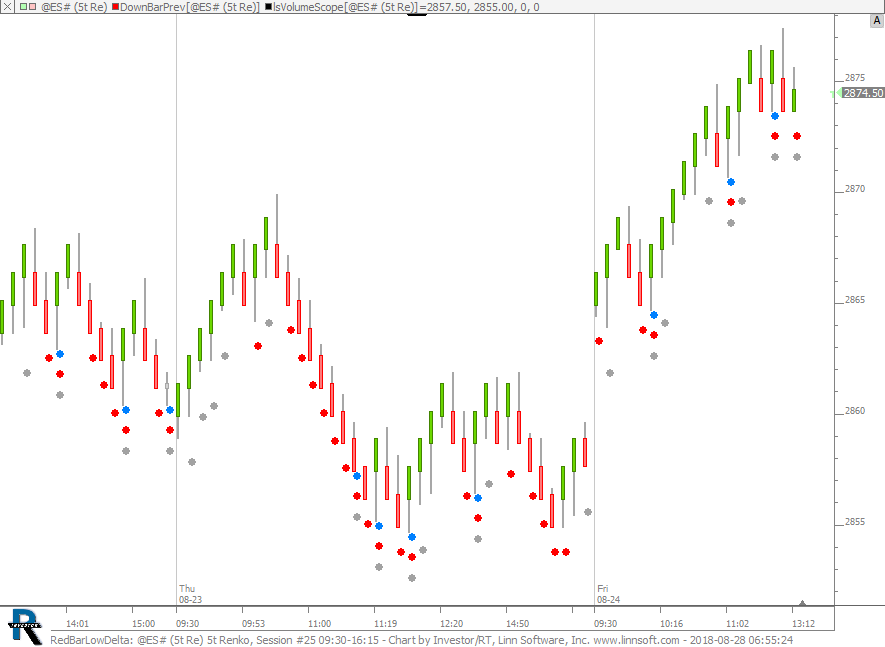 |
RedBarLowDelta (@ES#) cpayne [totalcount]
7 years 10 months ago
This chart was uploaded by Investor/RT 13.5.4 showing symbol: @ES#. |
View |
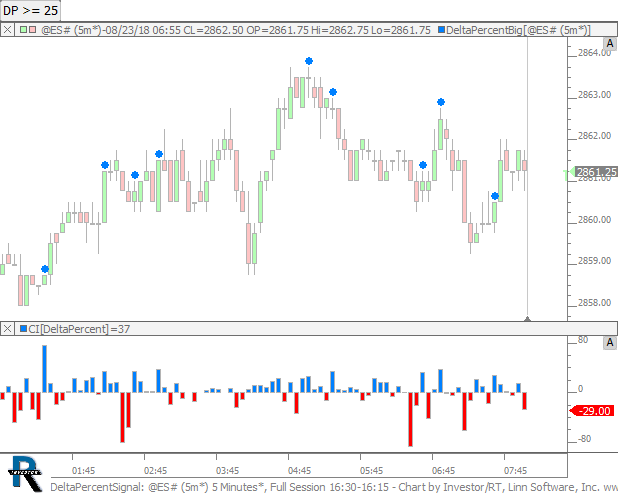 |
DeltaPercentSignal (@ES#) cpayne [totalcount]
7 years 10 months ago
Signal when delta percent is greater than value specified with button at top. This chart was uploaded by Investor/RT 13.5.4 showing symbol: @ES#. |
View |
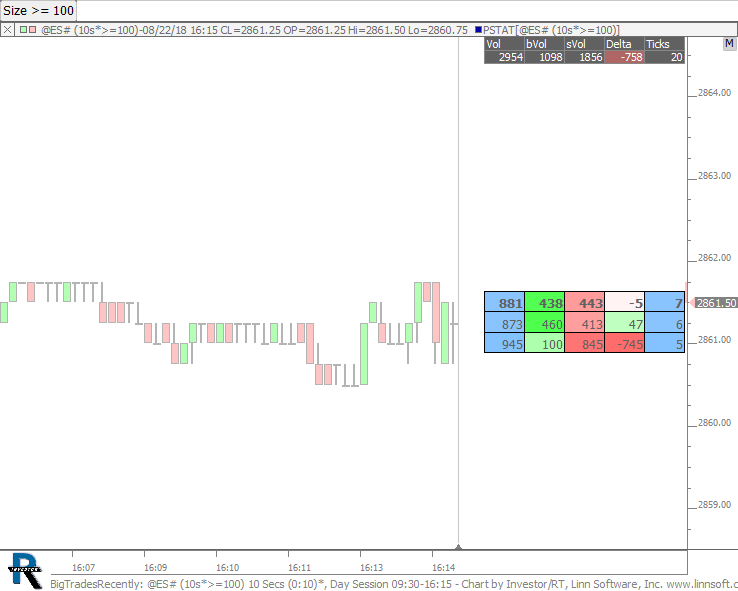 |
BigTradesRecently (@ES#) cpayne [totalcount]
7 years 10 months ago
Data is filtered (size >= 100) and the Price Stats on the right represents last 12 bars (2 minutes) and hides prices with volume < 500. |
View |
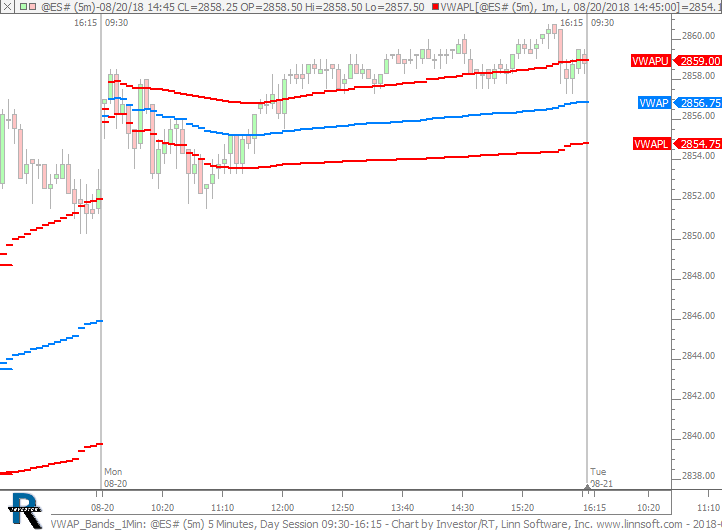 |
VWAP Bands 1Min (@ES#) cpayne [totalcount]
7 years 10 months ago
VWAP Bands based off 1-min data. This chart was uploaded by Investor/RT 13.5.4 showing symbol: @ES#. |
View |
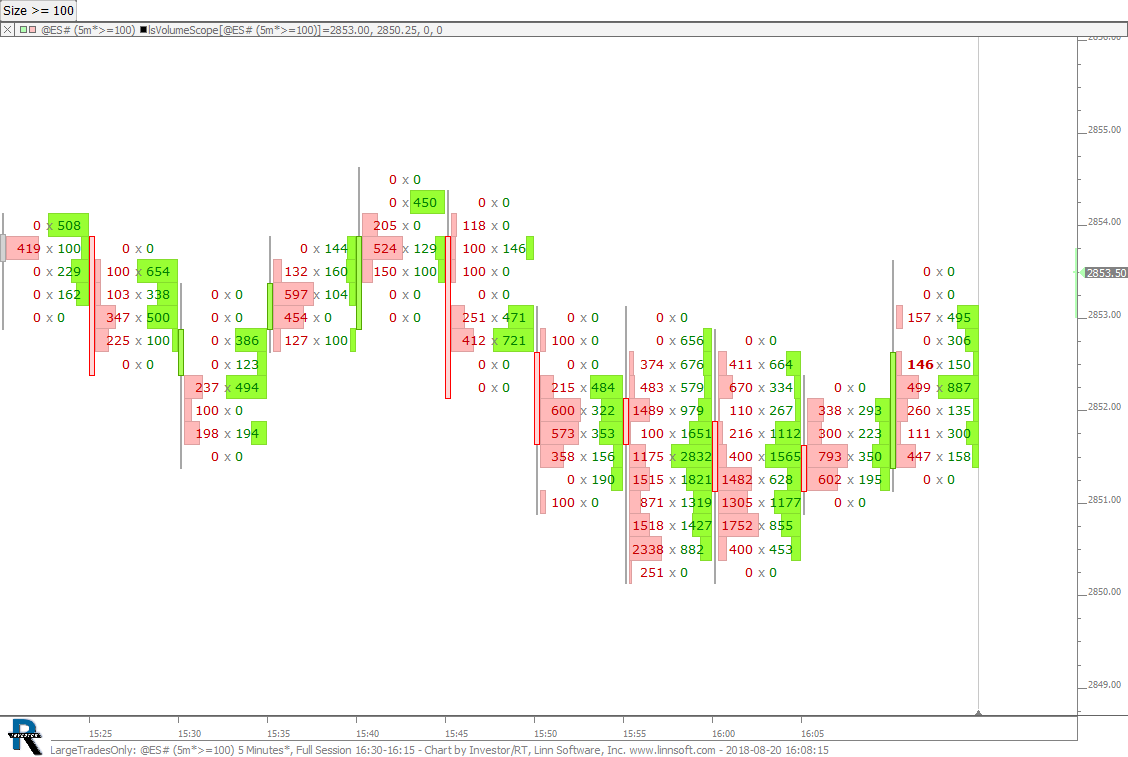 |
LargeTradesOnly (@ES#) cpayne [totalcount]
7 years 10 months ago
Large Trades Only (>= 100 - controlled by button). This chart was uploaded by Investor/RT 13.5.4 showing symbol: @ES#. |
View |
 |
Sequential (@ES#) cpayne [totalcount]
7 years 11 months ago
Sequential. This chart was uploaded by Investor/RT 13.5.4 showing symbol: @ES#. |
View |
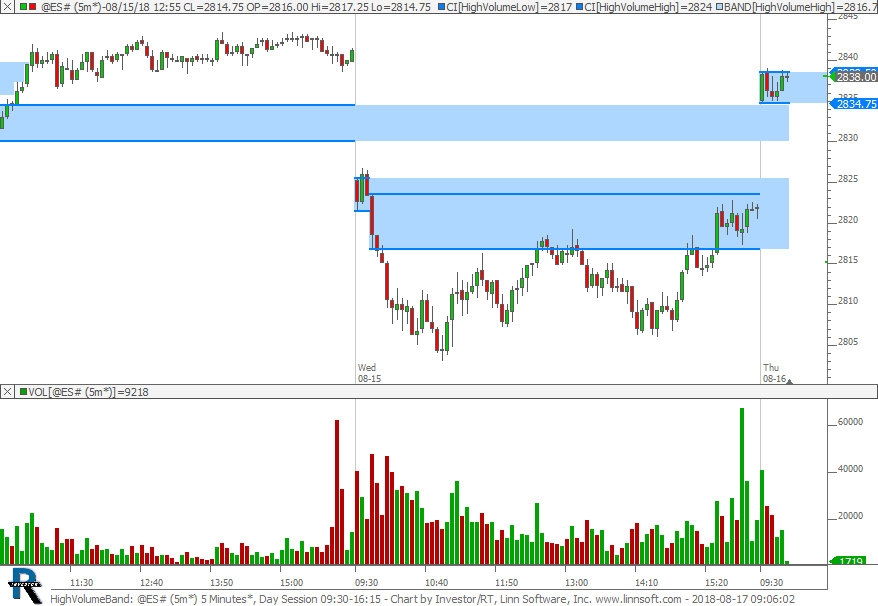 |
HighVolumeBand (@ES#) cpayne [totalcount]
7 years 11 months ago
Price Bands for 5-minute bar with highest volume. This chart was uploaded by Investor/RT 13.5.4 showing symbol: @ES#. |
View |
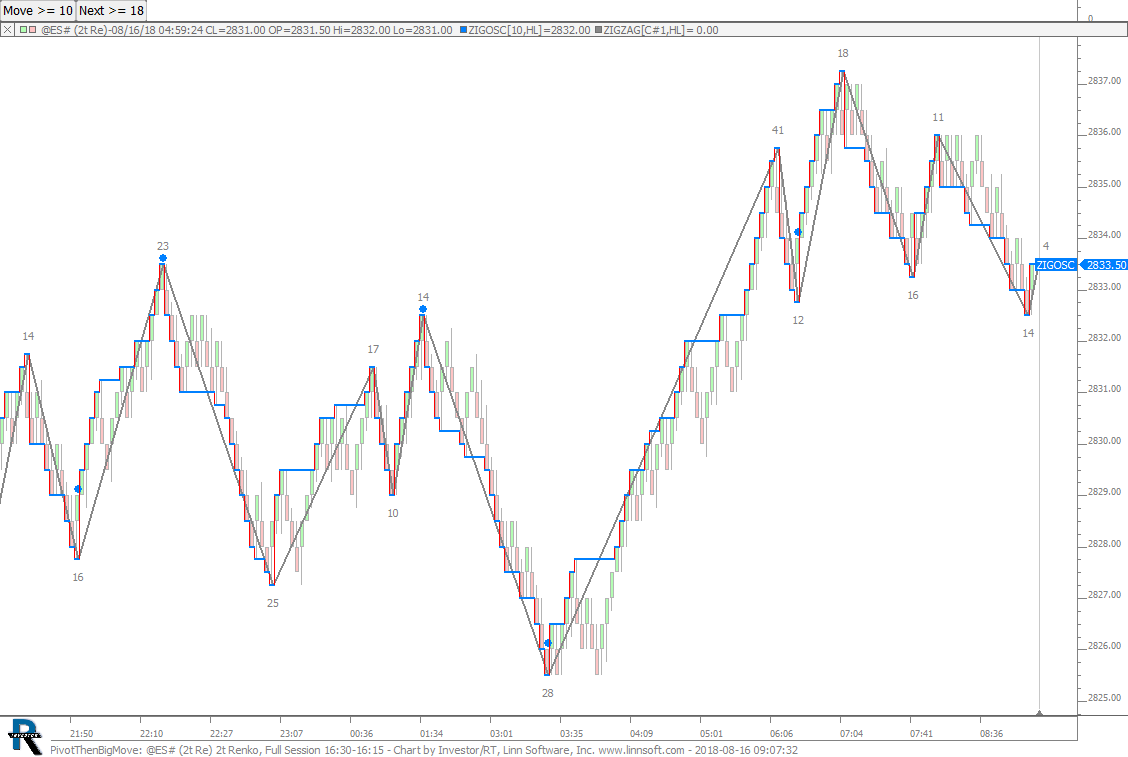 |
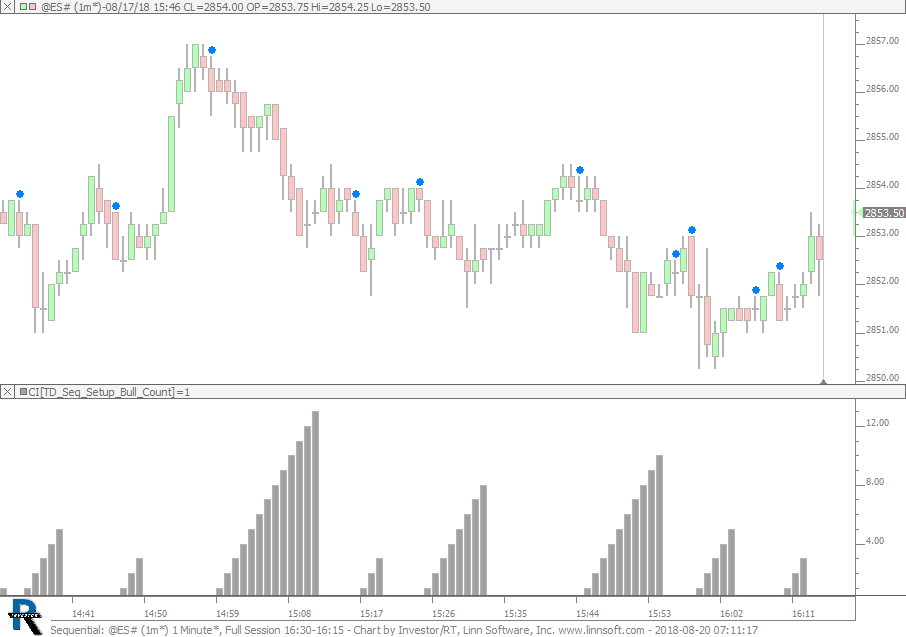
PivotThenBigMove (@ES#) cpayne [totalcount]
7 years 11 months ago
Blue dot identifies pivots with a big move after. This chart was uploaded by Investor/RT 13.5.4 showing symbol: @ES#. |
View |
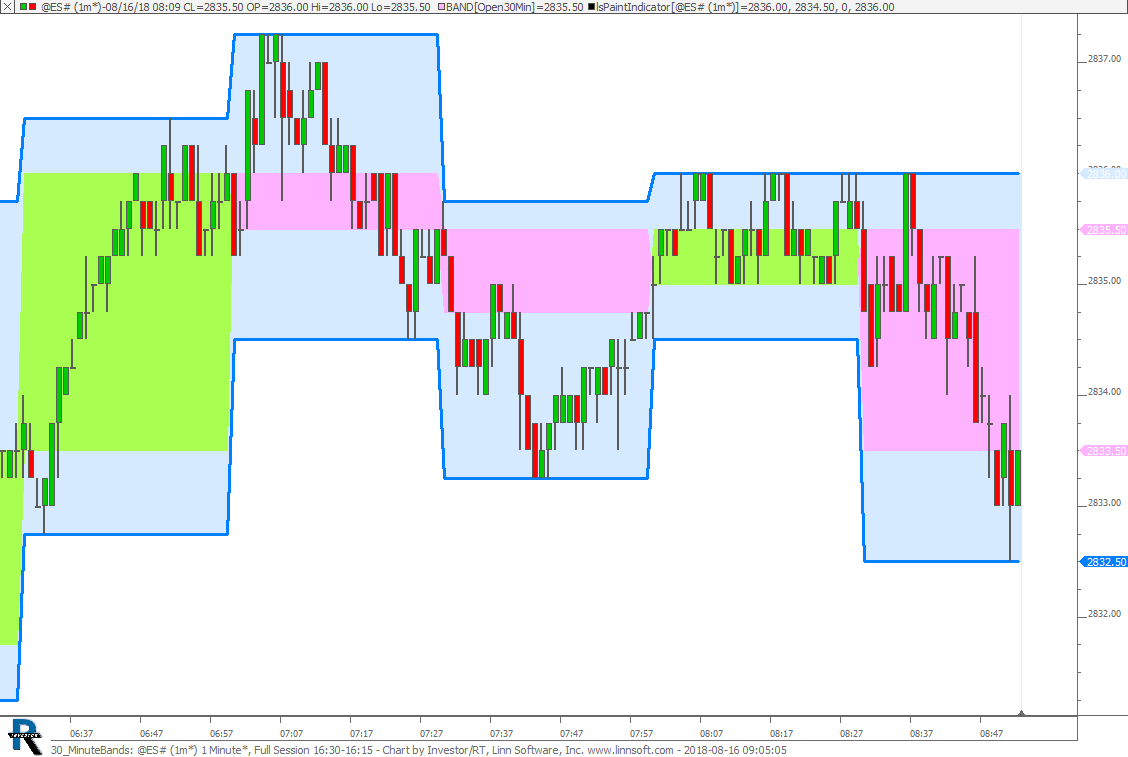 |
30 MinuteBands (@ES#) cpayne [totalcount]
7 years 11 months ago
30 Minute High and Low Bands on 1-min Chart. This chart was uploaded by Investor/RT 13.5.4 showing symbol: @ES#. |
View |
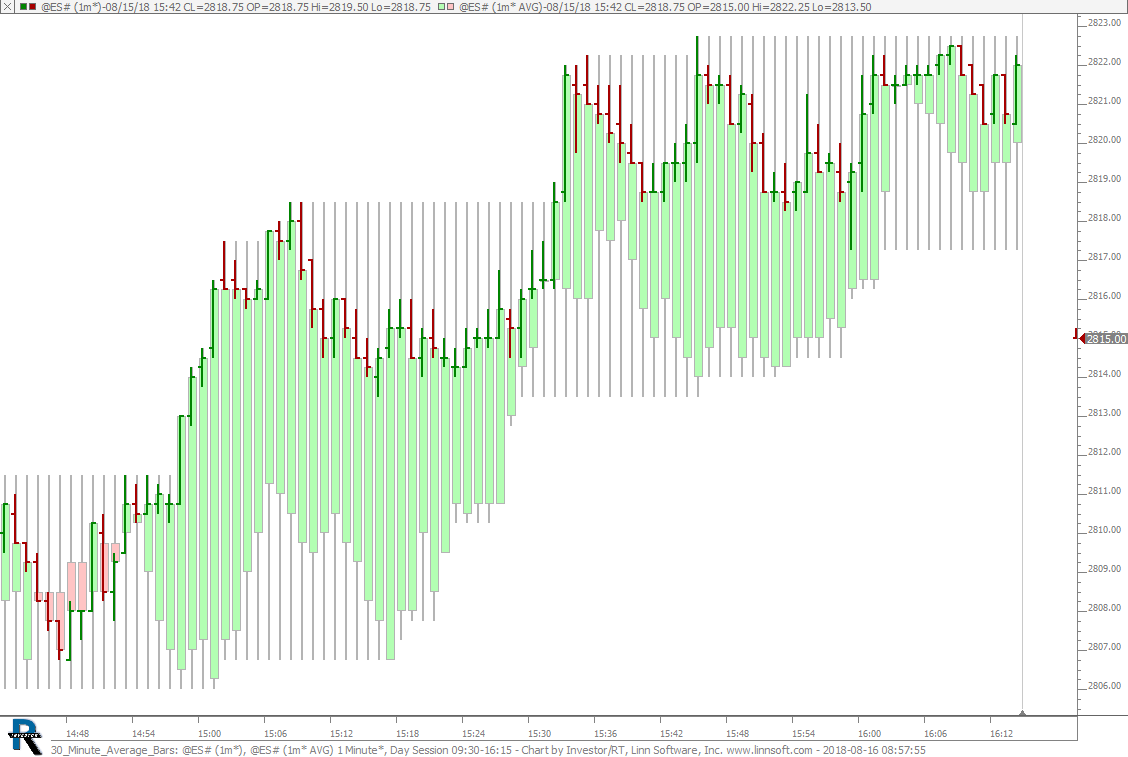 |
30 Minute Average Bars (@ES#) cpayne [totalcount]
7 years 11 months ago
30 Minute Average Bars. This chart was uploaded by Investor/RT 13.5.4 showing symbol: @ES#. |
View |
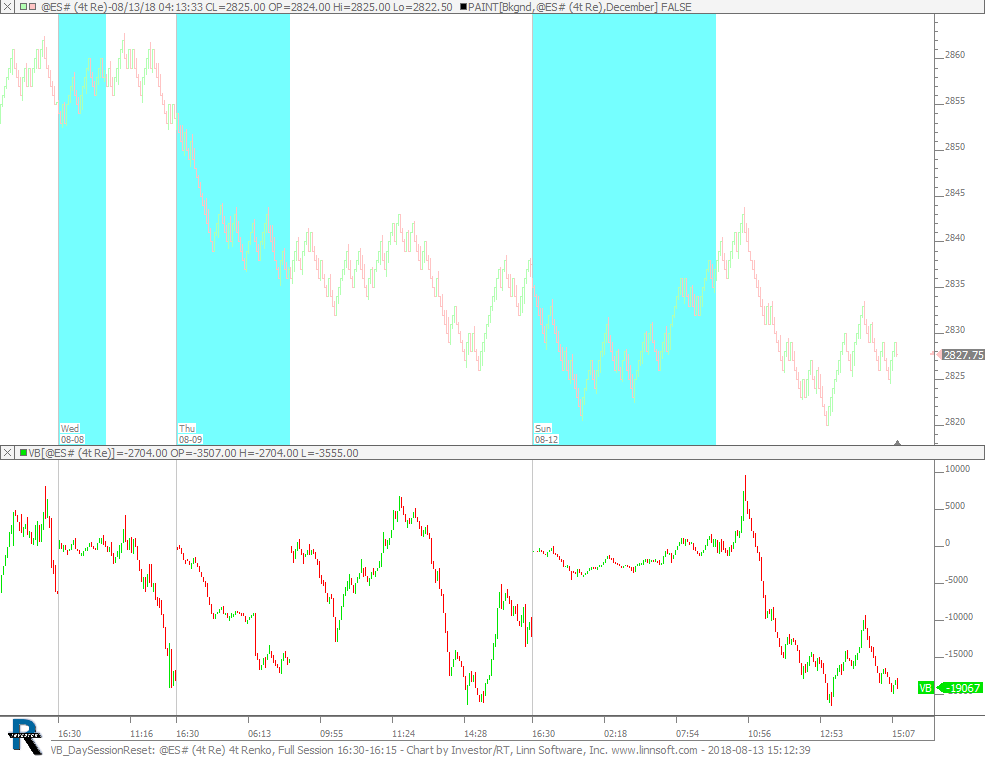 |
VB DaySessionReset (@ES#) cpayne [totalcount]
7 years 11 months ago
VB resets at start of day session (1020 minutes for ES). This chart was uploaded by Investor/RT 13.5.4 showing symbol: @ES#. |
View |
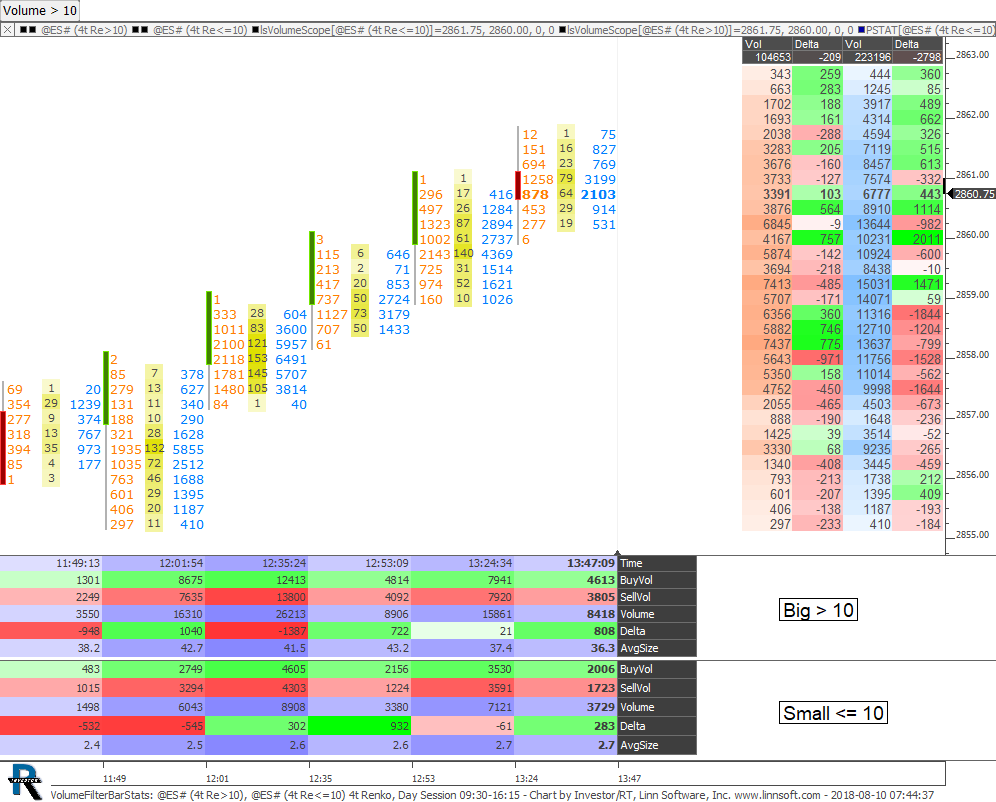 |
VolumeFilterBarStats (@ES#) cpayne [totalcount]
7 years 11 months ago
Volume Filtering with Bar Statistics and Price Staistics. This chart was uploaded by Investor/RT 13.5.3 showing symbol: @ES#. |
View |
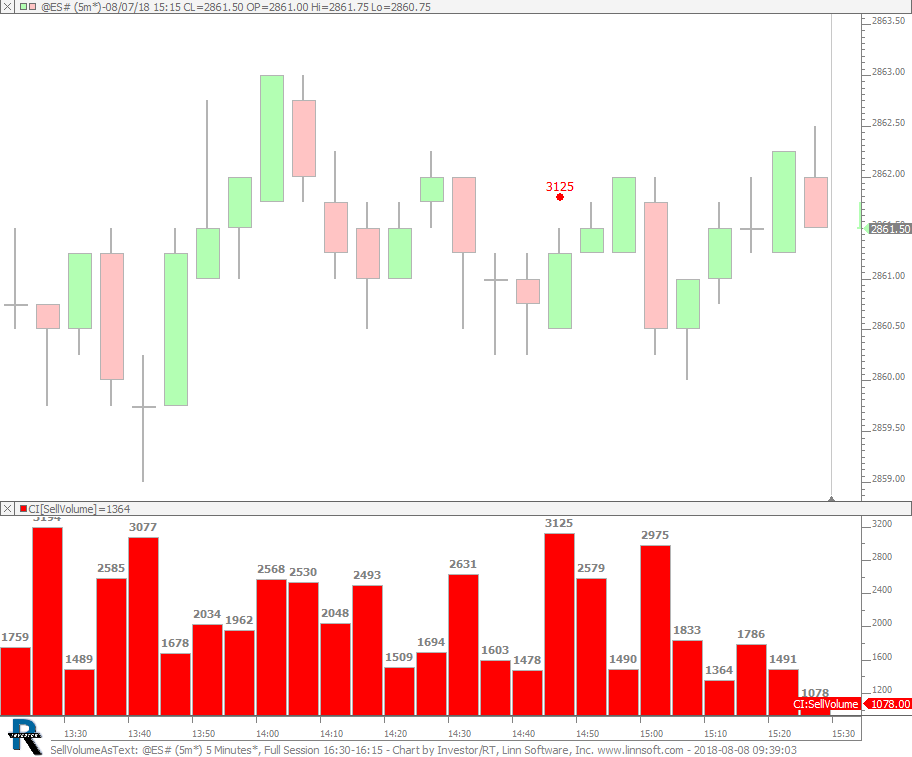 |
SellVolumeAsText (@ES#) cpayne [totalcount]
7 years 11 months ago
Sell Volume As Text on Signal. This chart was uploaded by Investor/RT 13.5.3 showing symbol: @ES#. |
View |
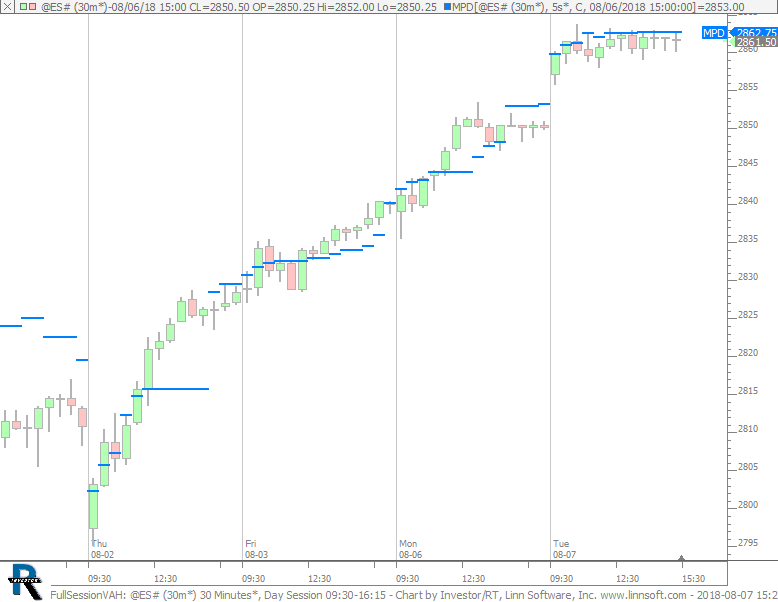 |
FullSessionVAH (@ES#) cpayne [totalcount]
7 years 11 months ago
Full Session Value Area on Day Session Chart. This chart was uploaded by Investor/RT 13.5.3 showing symbol: @ES#. |
View |