 |
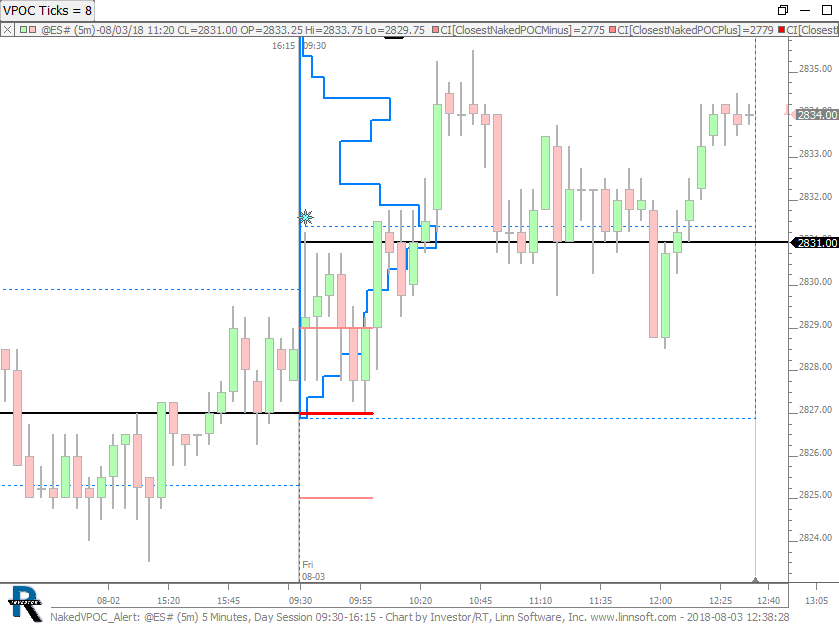
NakedVPOC Alert (@ES#) cpayne [totalcount]
7 years 11 months ago
Chart generates an audible alert (Cork Pop) when price gets within X ticks of the closest Naked VPOC. Use button to control number of ticks. |
View |
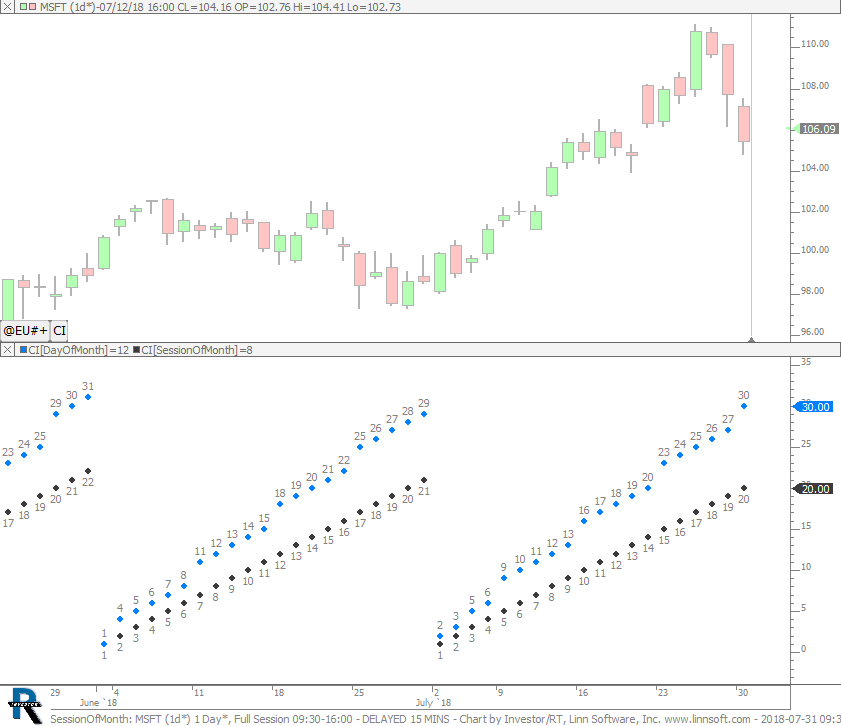 |
SessionOfMonth (MSFT) cpayne [totalcount]
7 years 11 months ago
Session of Month (Black) and Day of Month (Blue). This chart was uploaded by Investor/RT 13.5.1 showing symbol: MSFT. |
View |
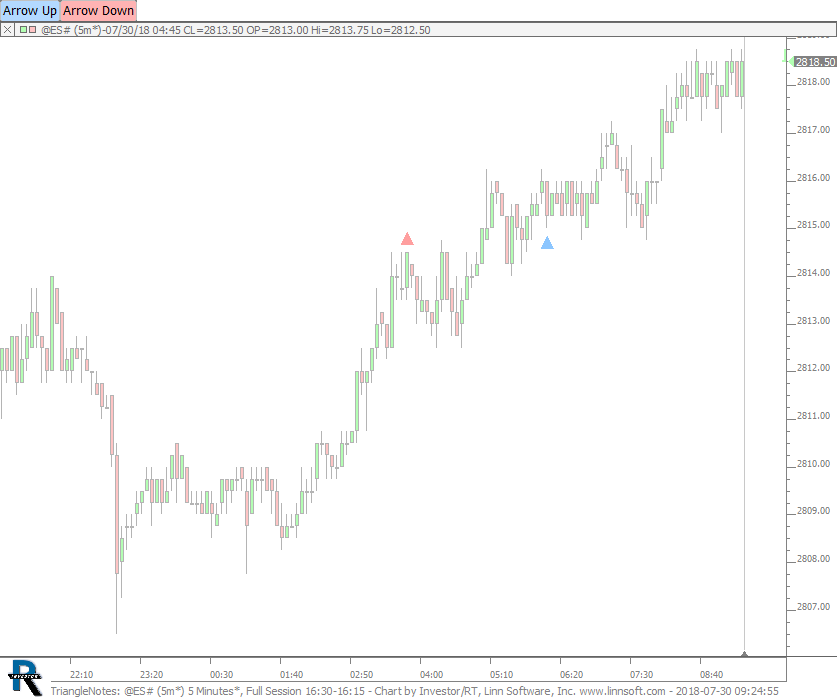 |
TriangleNotes (@ES#) cpayne [totalcount]
7 years 11 months ago
Triangle Notes. This chart was uploaded by Investor/RT 13.5.1 showing symbol: @ES#. |
View |
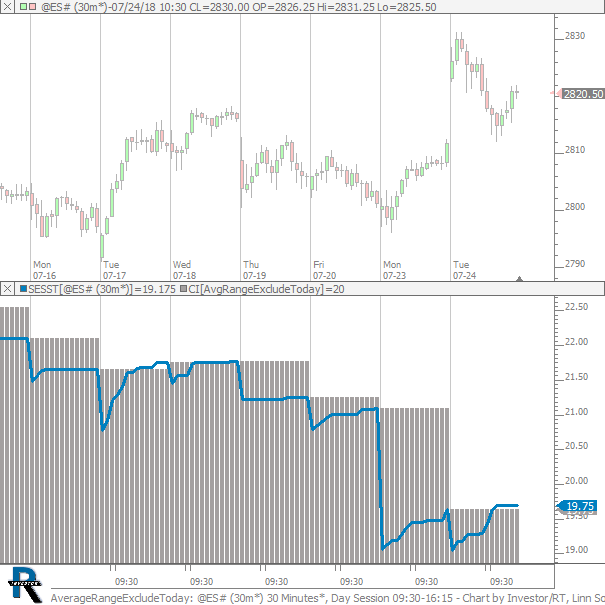 |
AverageRangeExcludeToday (@ES#) cpayne [totalcount]
7 years 11 months ago
Average Range of Last 20 Days - Excluding Current Partial Session. This chart was uploaded by Investor/RT 13.5.1 showing symbol: @ES#. |
View |
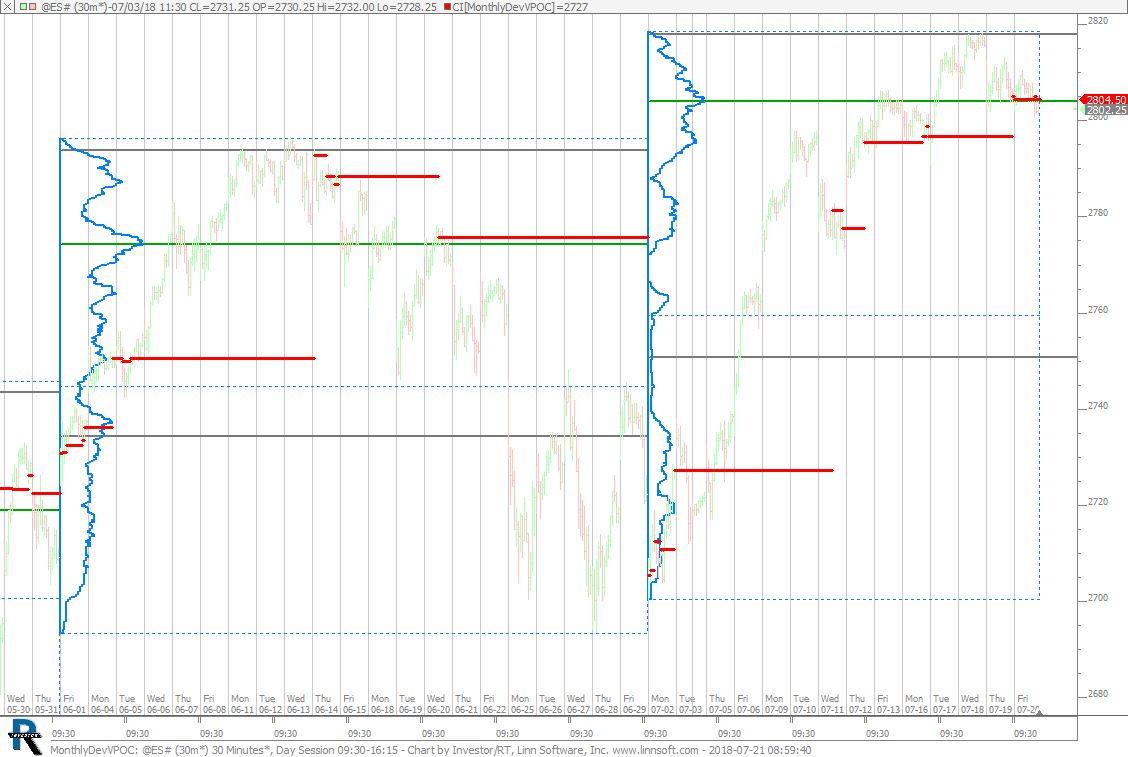 |
MonthlyDevVPOC (@ES#) cpayne [totalcount]
7 years 12 months ago
Time-Based Monthly Profiles - Dev VPOC. This chart was uploaded by Investor/RT 13.5.1 showing symbol: @ES#. |
View |
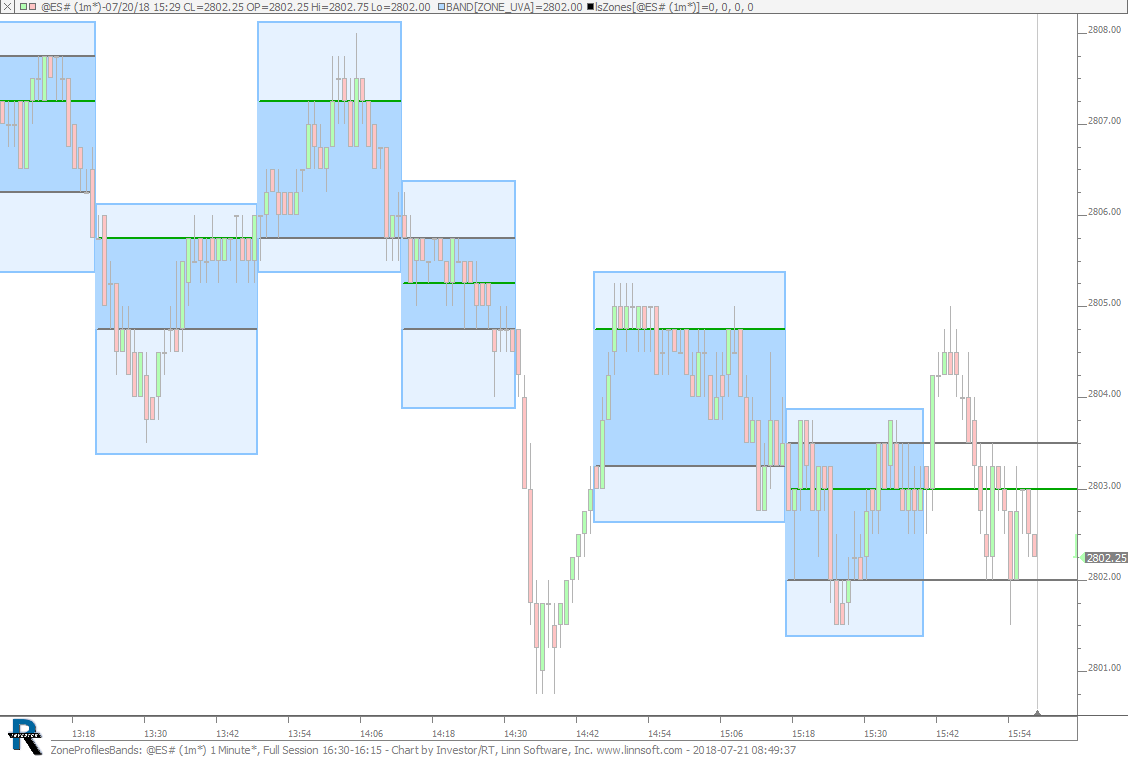 |
ZoneProfilesBands (@ES#) cpayne [totalcount]
7 years 12 months ago
Zone Profiles with VA Bands. This chart was uploaded by Investor/RT 13.5.1 showing symbol: @ES#. |
View |
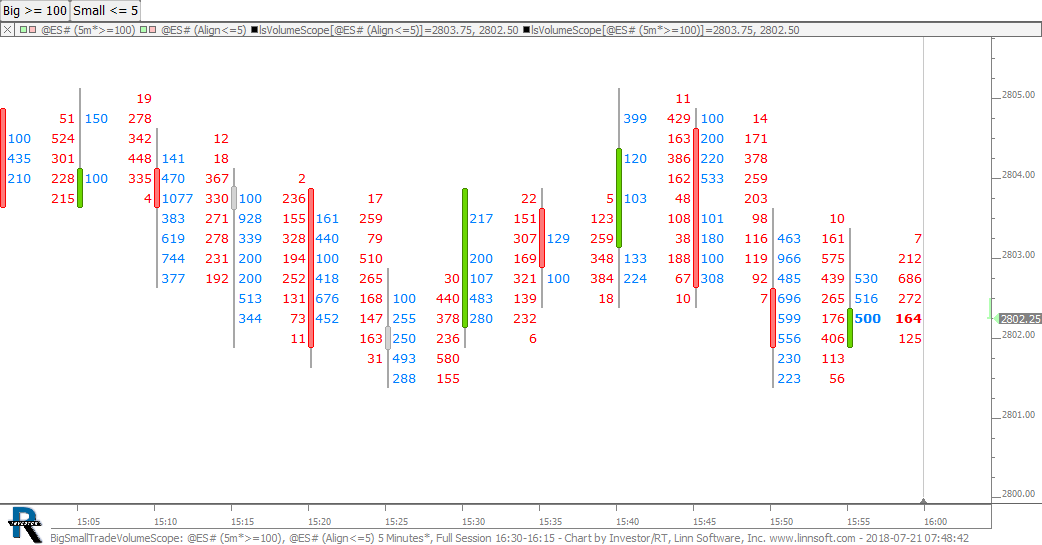 |
BigSmallTradeVolumeScope (@ES#) cpayne [totalcount]
7 years 12 months ago
Big Trades in Blue. Small Trades in Red. Use buttons to control sizes. This chart was uploaded by Investor/RT 13.5.1 showing symbol: @ES#. |
View |
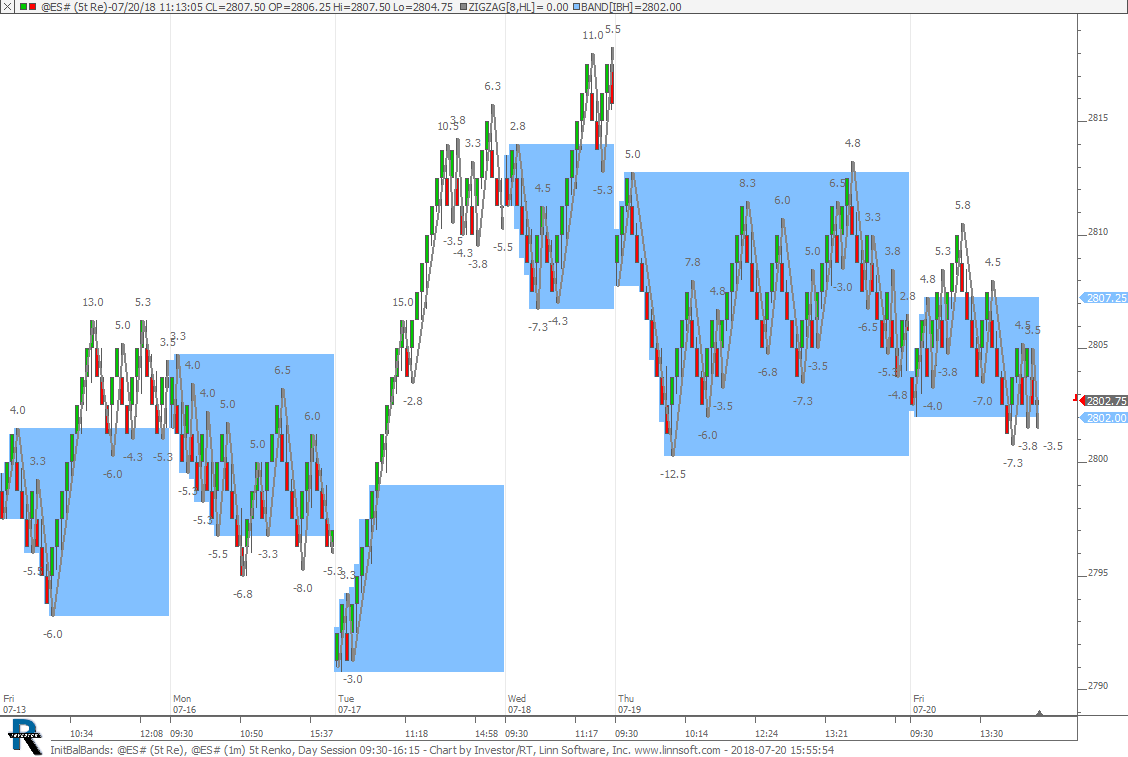 |
InitBalBands (@ES#) cpayne [totalcount]
7 years 12 months ago
Initial Balance Bands. This chart was uploaded by Investor/RT 13.5.1 showing symbol: @ES#. |
View |
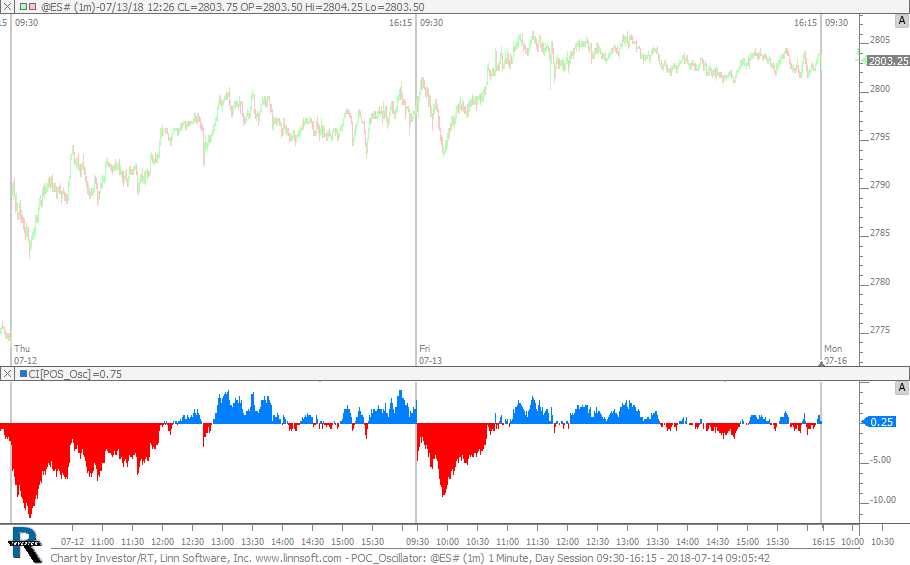 |
POC Oscillator (@ES#) cpayne [totalcount]
8 years 2 days ago
POC Oscillator (CL - POC). This chart was uploaded by Investor/RT 13.5.1 showing symbol: @ES#. |
View |
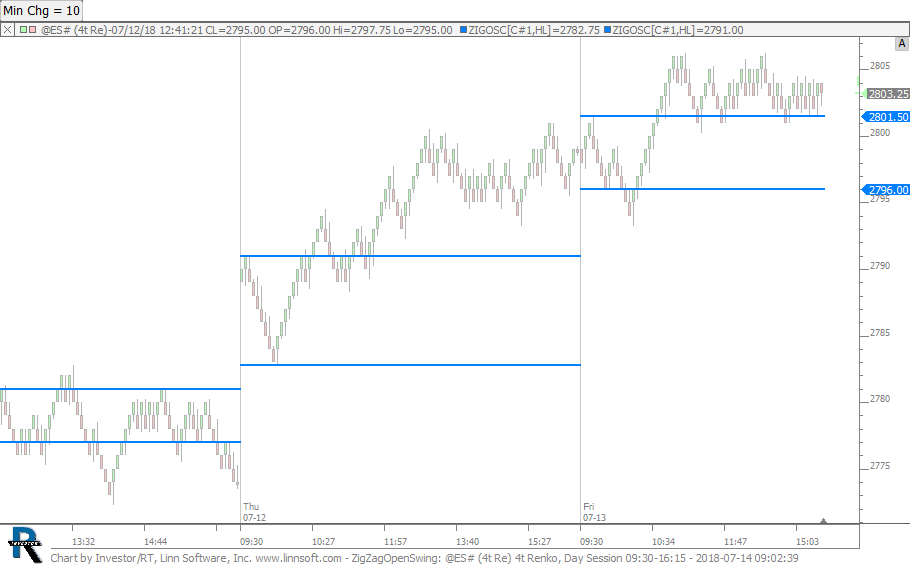 |
ZigZagOpenSwing (@ES#) cpayne [totalcount]
8 years 2 days ago
Zig Zag Open Swing High and Low. This chart was uploaded by Investor/RT 13.5.1 showing symbol: @ES#. |
View |
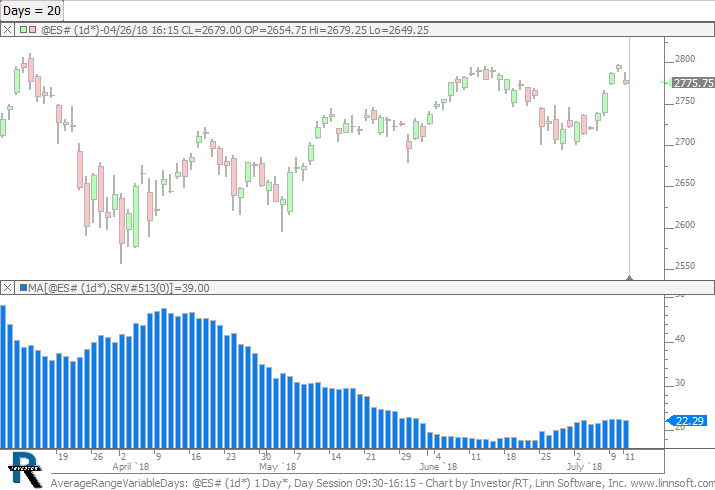 |
AverageRangeVariableDays (@ES#) cpayne [totalcount]
8 years 4 days ago
Average Range - Variable Days. This chart was uploaded by Investor/RT 13.5.1 showing symbol: @ES#. |
View |
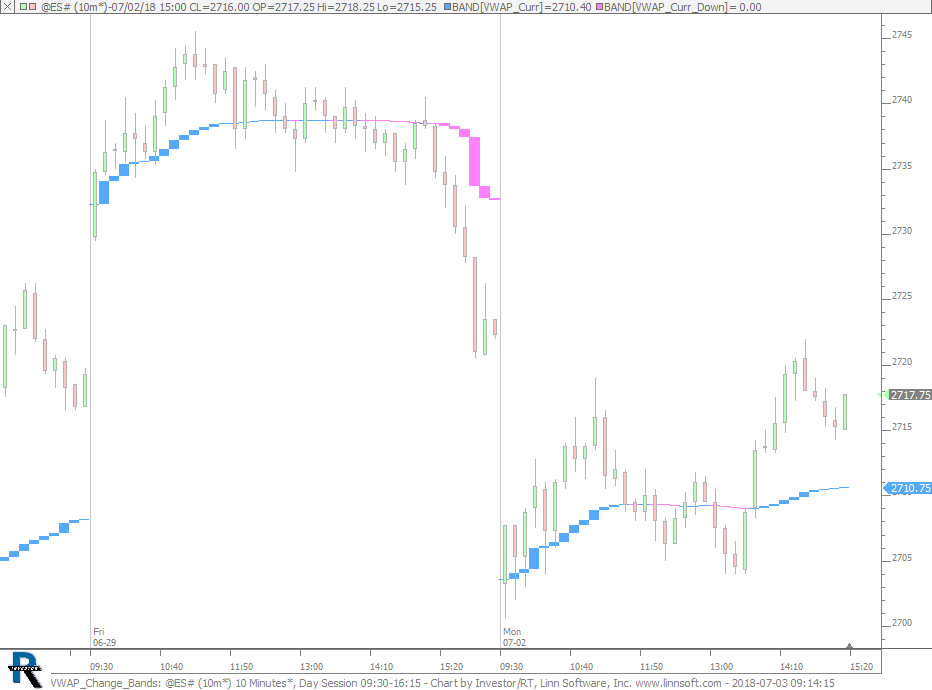 |
VWAP Change Bands (@ES#) cpayne [totalcount]
8 years 1 week ago
VWAP Change Bands. This chart was uploaded by Investor/RT 13.3.5 showing symbol: @ES#. |
View |
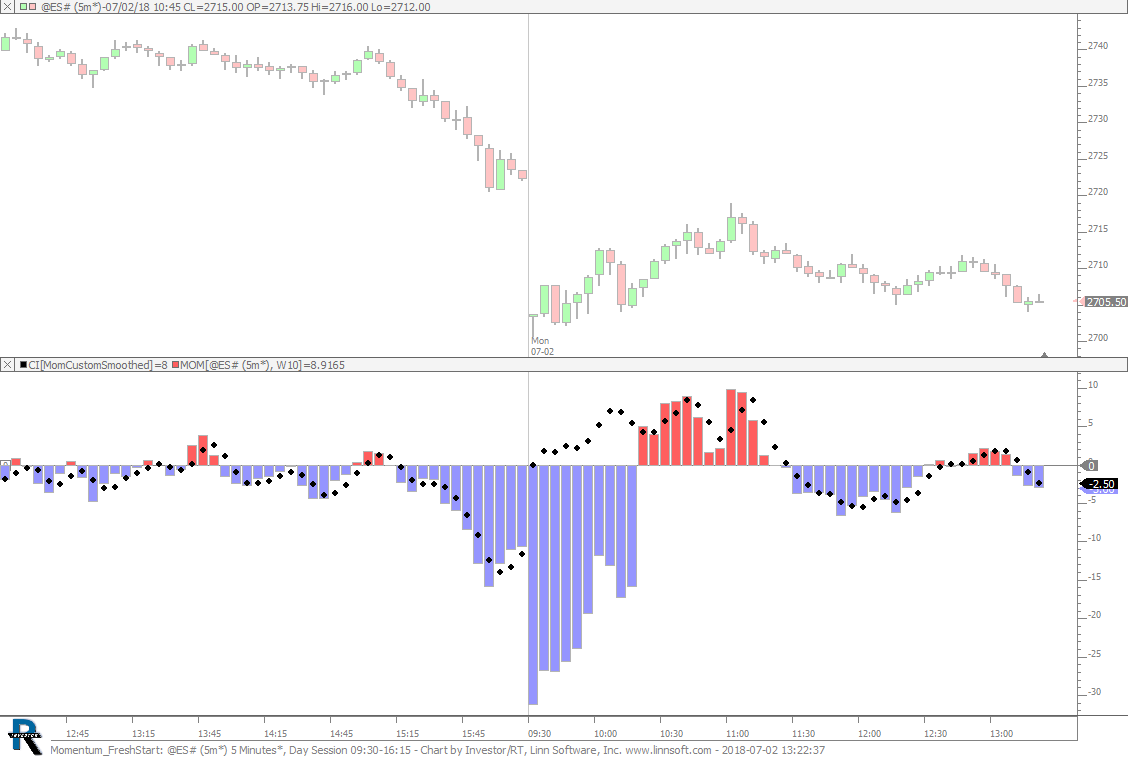 |
Momentum FreshStart (@ES#) cpayne [totalcount]
8 years 2 weeks ago
Momentum with Fresh Start. This chart was uploaded by Investor/RT 13.3.5 showing symbol: @ES#. |
View |
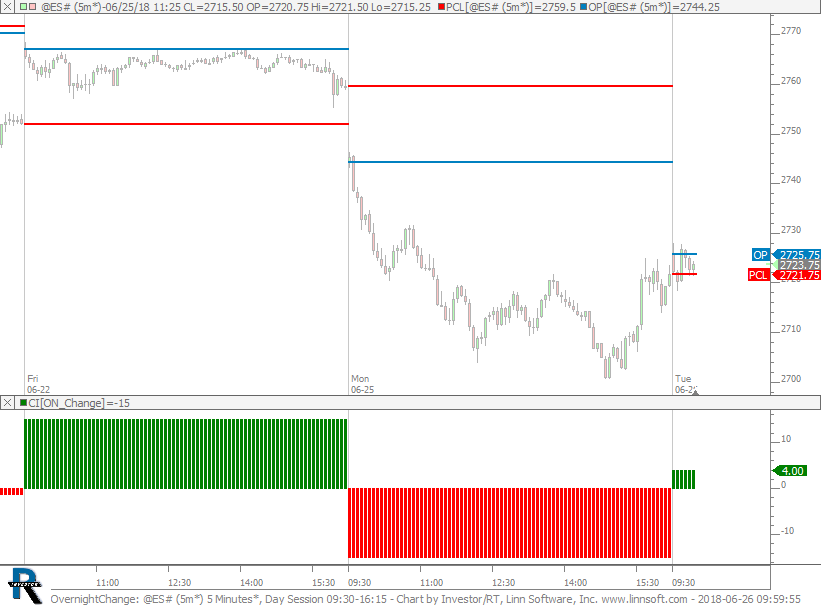 |
OvernightChange (@ES#) cpayne [totalcount]
8 years 2 weeks ago
Overnight Change, Session Open, Previous Close. This chart was uploaded by Investor/RT 13.3.5 showing symbol: @ES#. |
View |
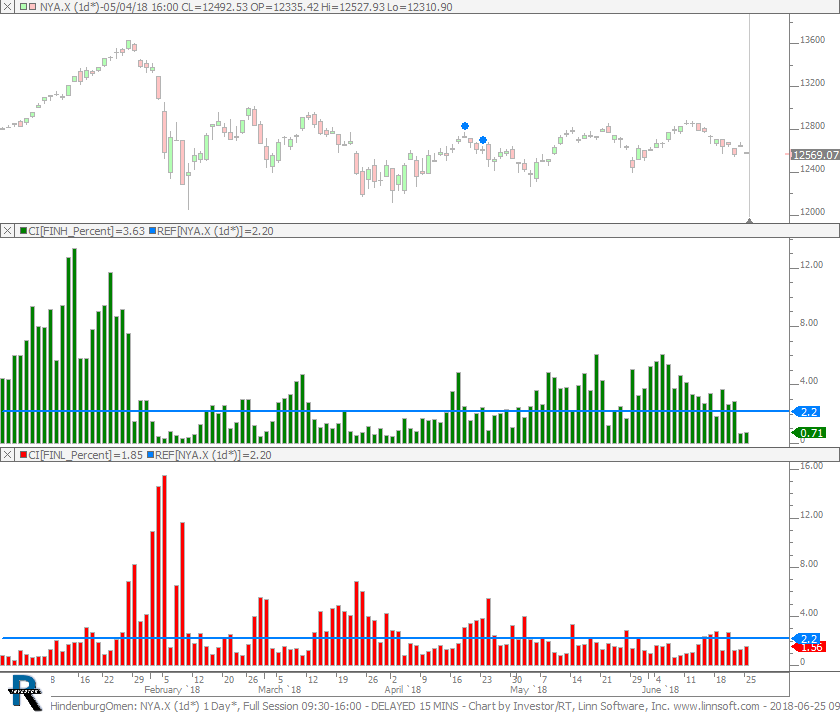 |
HindenburgOmen (NYA.X) cpayne [totalcount]
8 years 3 weeks ago
Hindenburg Omen. This chart was uploaded by Investor/RT 13.3.5 showing symbol: NYA.X. |
View |
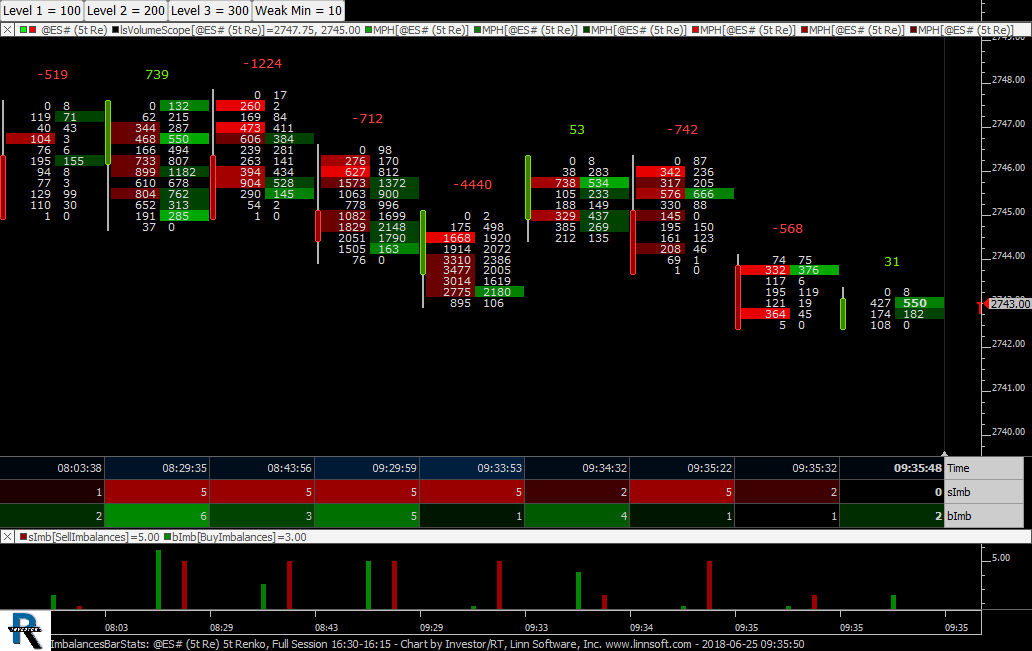 |
ImbalancesBarStats (@ES#) cpayne [totalcount]
8 years 3 weeks ago
Imbalances Counts via Bar Statistics. This chart was uploaded by Investor/RT 13.3.5 showing symbol: @ES#. |
View |
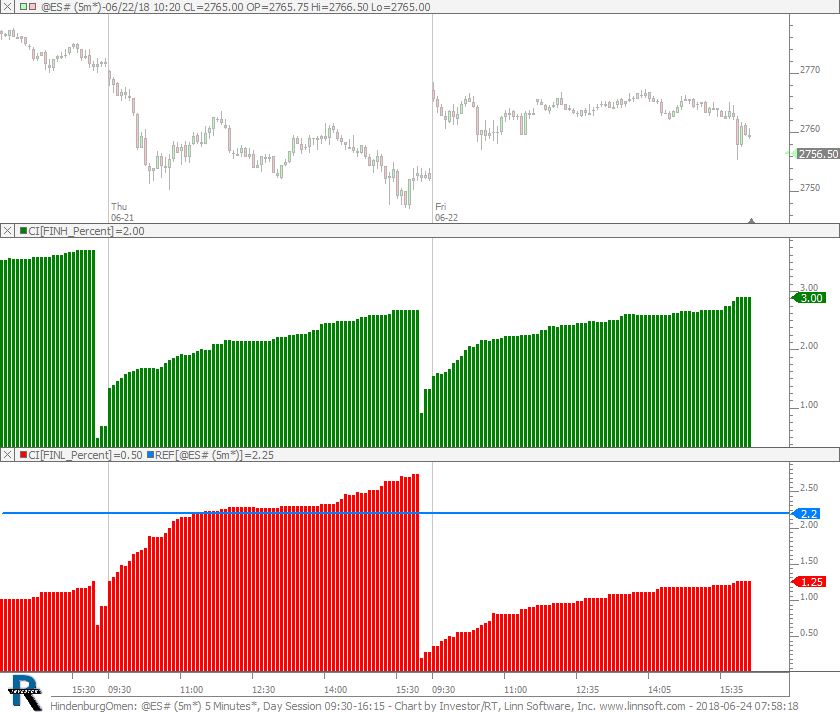 |
HindenburgOmen (@ES#) cpayne [totalcount]
8 years 3 weeks ago
Hindenburg Omen. This chart was uploaded by Investor/RT 13.3.5 showing symbol: @ES#. |
View |
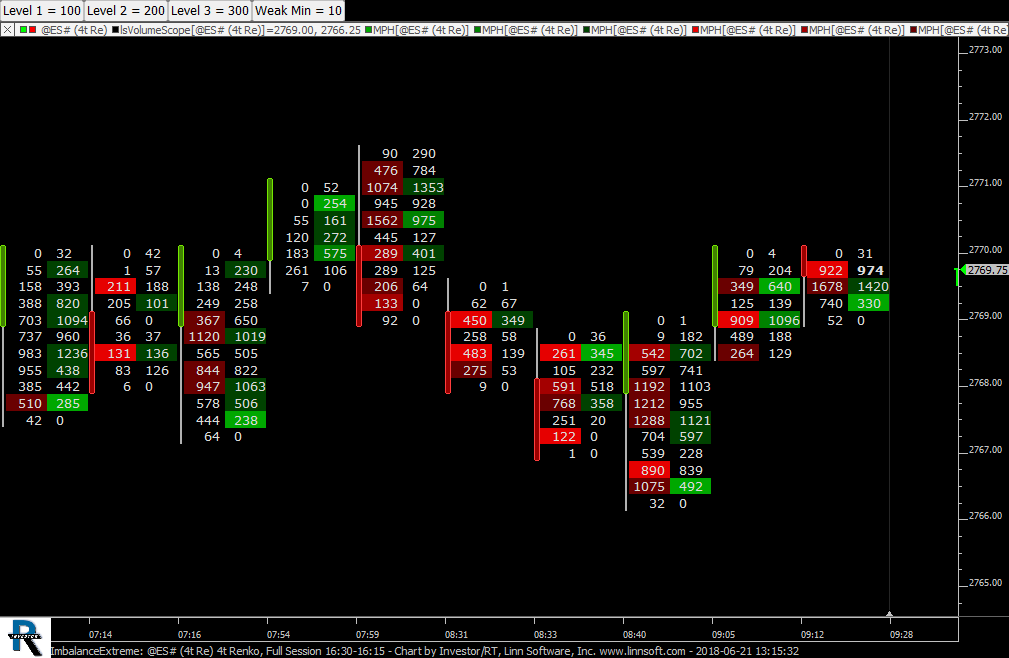 |
ImbalanceExtreme (@ES#) cpayne [totalcount]
8 years 3 weeks ago
Three Levels of Imbalance Controlled by Buttons. Darker colors for 100-200%. Medium shades for 200-300%. Lighter Shades for 300-400%. Weak Side Minimum controlled by button also. |
View |
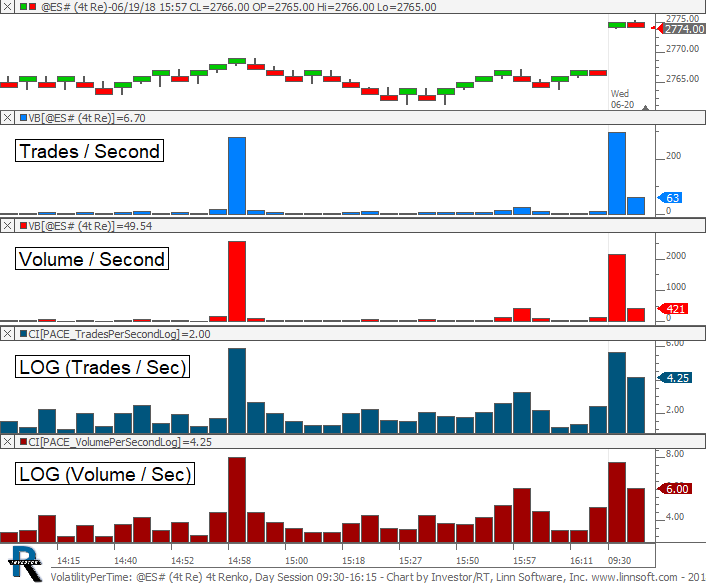 |
VolatilityPerTime (@ES#) cpayne [totalcount]
8 years 3 weeks ago
Trades and Volume Per Second. This chart was uploaded by Investor/RT 13.3.5 showing symbol: @ES#. |
View |
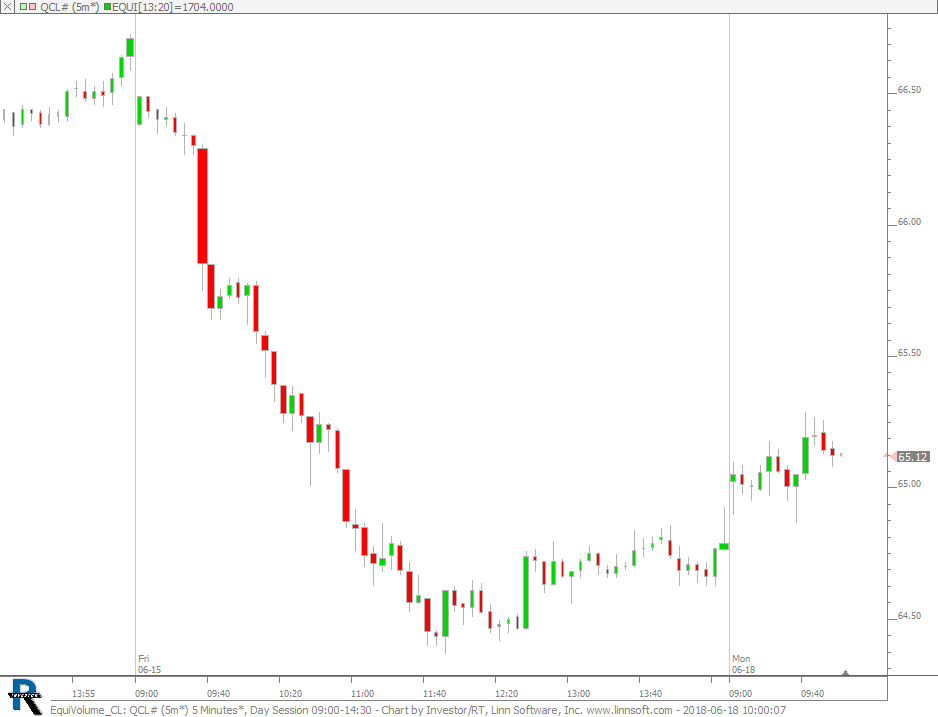 |
EquiVolume CL (QCL#) cpayne [totalcount]
8 years 4 weeks ago
Equ-Volume Candles - CL. This chart was uploaded by Investor/RT 13.3.5 showing symbol: QCL#. |
View |
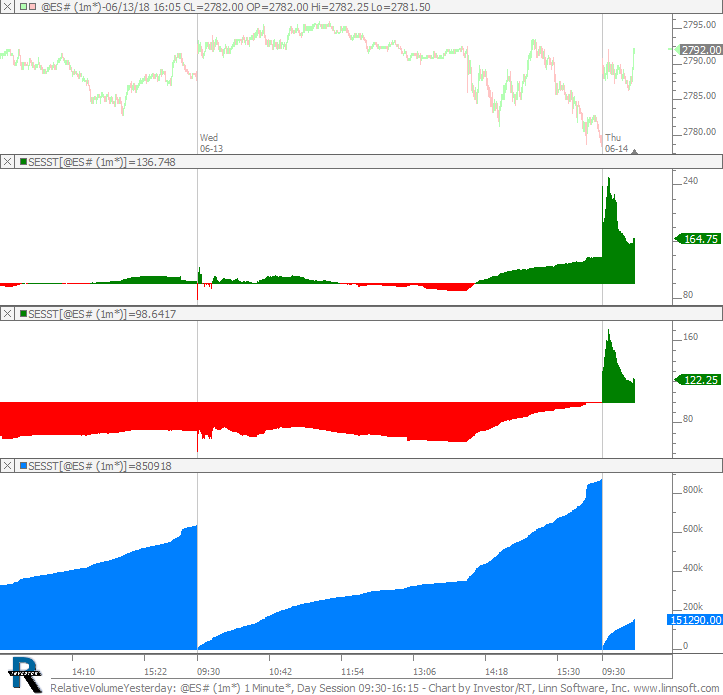 |
RelativeVolumeYesterday (@ES#) cpayne [totalcount]
8 years 1 month ago
Relative Volume (at time of day) vs Yesterday and vs 20 day average. This chart was uploaded by Investor/RT 13.3.5 showing symbol: @ES#. |
View |
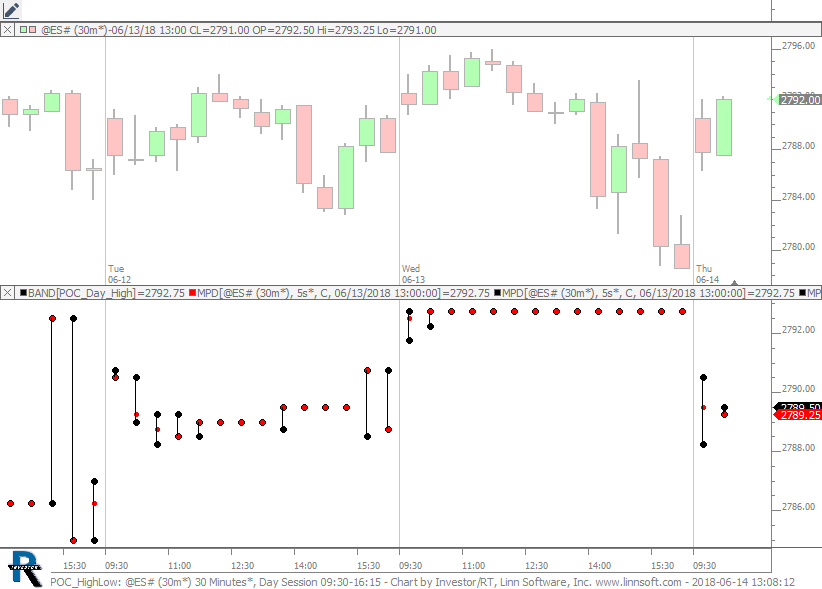 |
POC HighLow (@ES#) cpayne [totalcount]
8 years 1 month ago
This chart was uploaded by Investor/RT 13.3.5 showing symbol: @ES#. |
View |
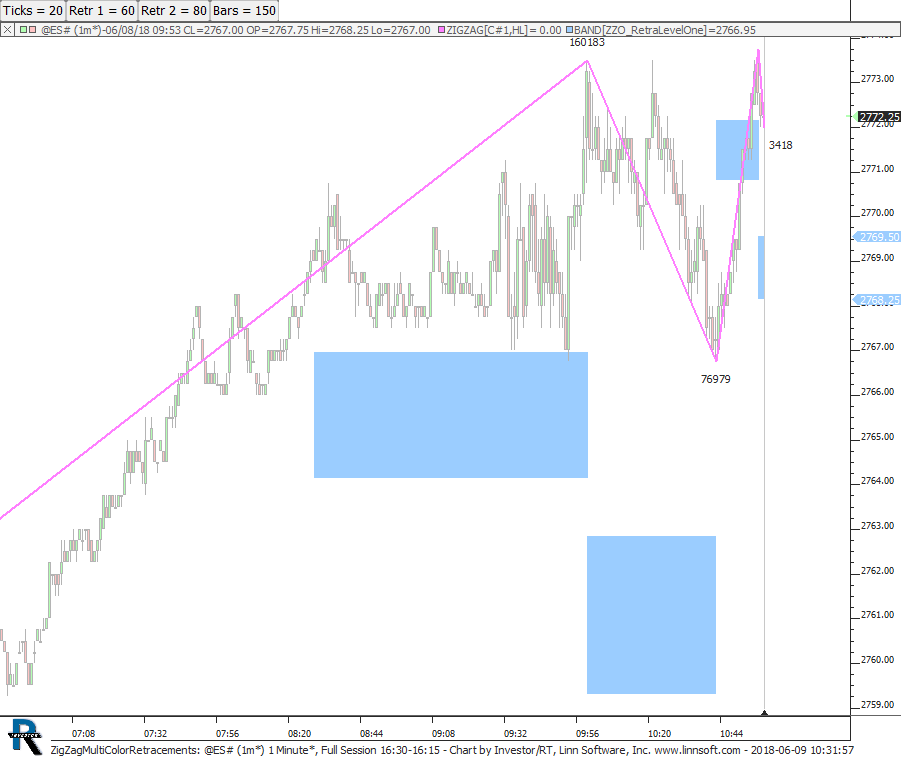 |
ZigZagMultiColorRetracements (@ES#) cpayne [totalcount]
8 years 1 month ago
This chart was uploaded by Investor/RT 13.3.3 showing symbol: @ES#. |
View |
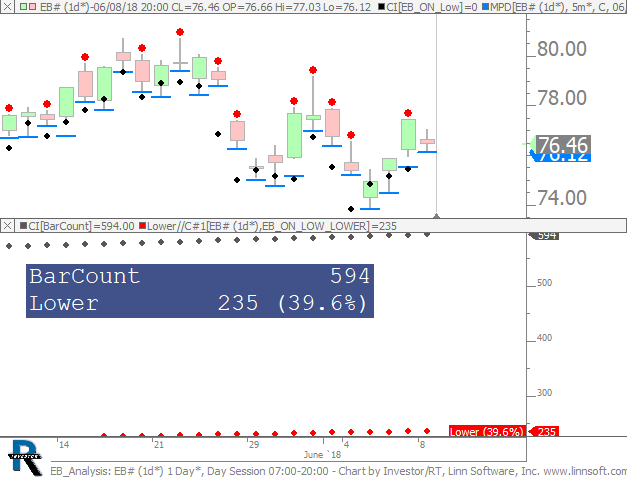 |
EB Analysis (EB#) cpayne [totalcount]
8 years 1 month ago
Analysis of IB Overnight Lows. This chart was uploaded by Investor/RT 13.3.4 showing symbol: EB#. |
View |
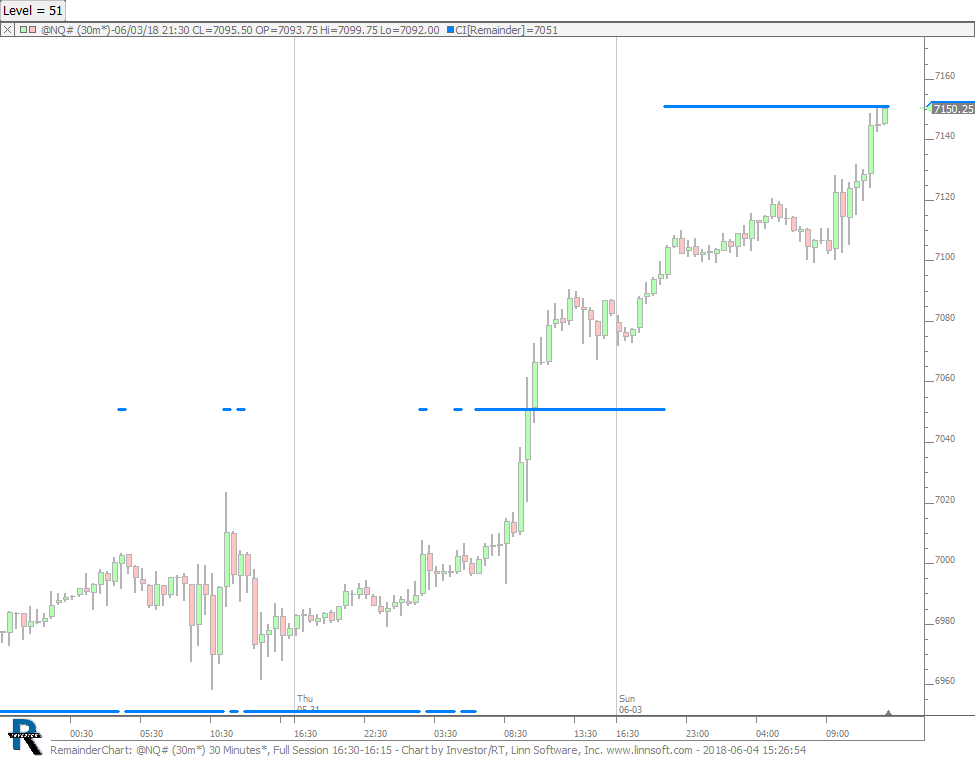 |
RemainderChart (@NQ#) cpayne [totalcount]
8 years 1 month ago
Remainder Chart. This chart was uploaded by Investor/RT 13.3.4 showing symbol: @NQ#. |
View |