 |
POT InverseOfTime (@ES#) cpayne [totalcount]
8 years 2 months ago
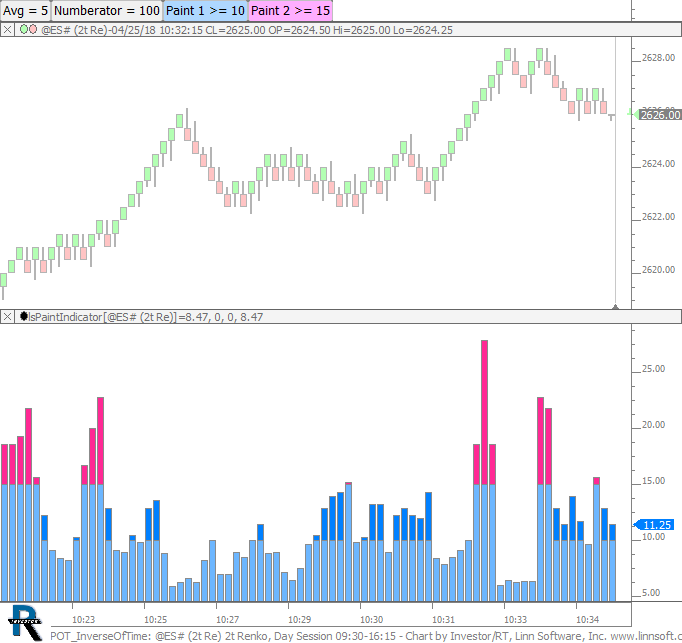
Pace of Tape - Lower Pane computes an inverse of the time it takes to complete each bar. A smoothing of time is used for that denominator with the smoothing period specified with button. |
View |
 |
InverseTimeRate (@ES#) cpayne [totalcount]
8 years 2 months ago
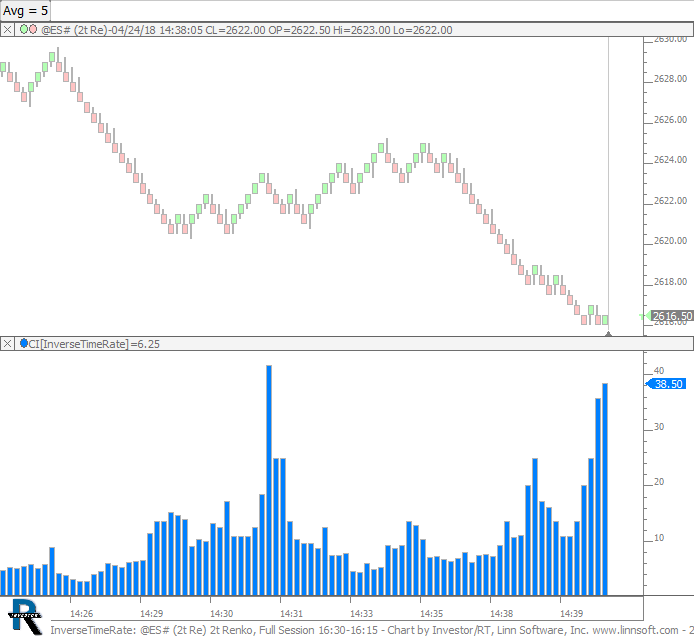
Indicator in lower pane computes 100 / time (in seconds). Larger value for faster bars and faster moves. The denominator is the 3 bar average of time (in seconds). |
View |
 |
DeltaBars SplitSession (@ES#) cpayne [totalcount]
8 years 2 months ago
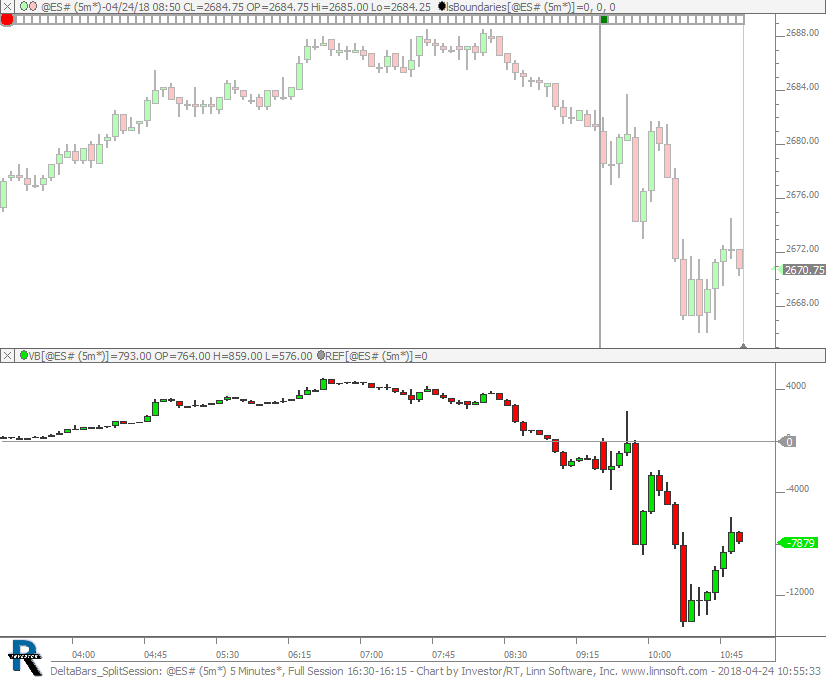
Cumulative Delta Bars resetting on split session using the Boundaries indicator. This chart was uploaded by Investor/RT 13.2.8 showing symbol: @ES#. |
View |
 |
POT Pace Size Delta (@NQ#) cpayne [totalcount]
8 years 2 months ago
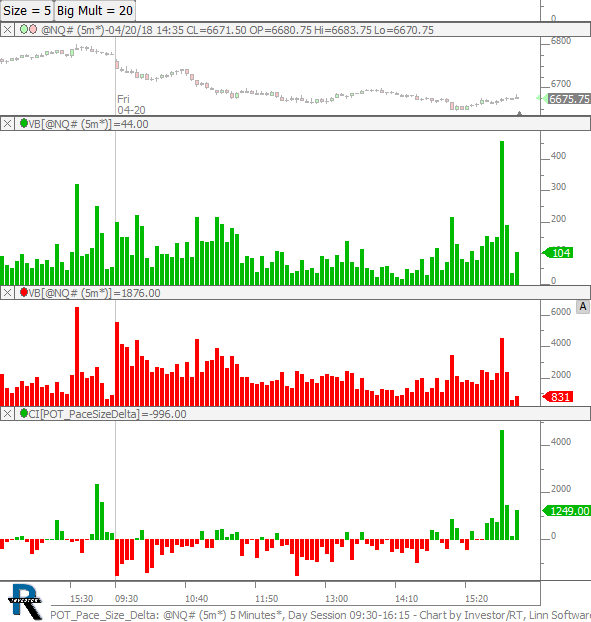
Pace of Trade - Pace of big vs pace of small trades. This chart was uploaded by Investor/RT 13.2.8 showing symbol: @NQ#. |
View |
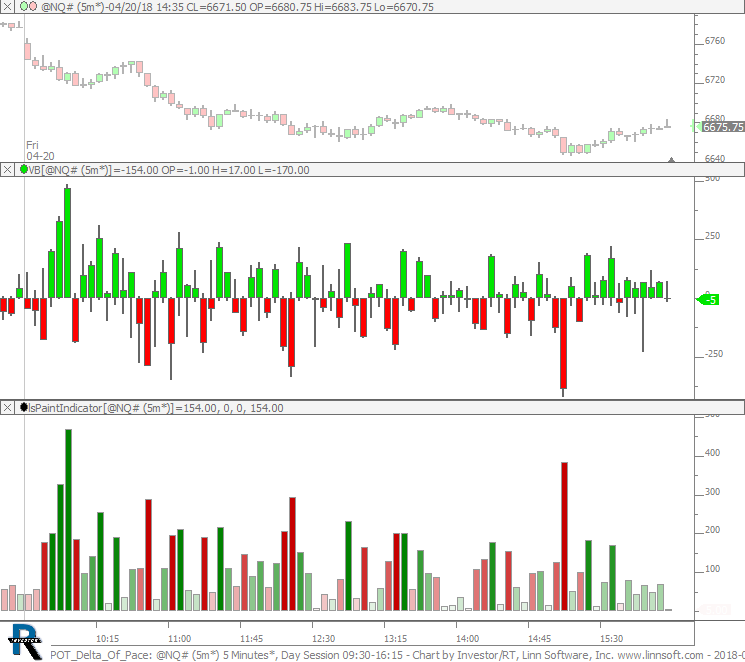 |
POT Delta Of Pace (@NQ#) cpayne [totalcount]
8 years 2 months ago
Pace of Trade - Delta of Pace - Middle pane plots the difference between the number of trades that occurred at ask minus the number of trades that occurred at the bid. |
View |
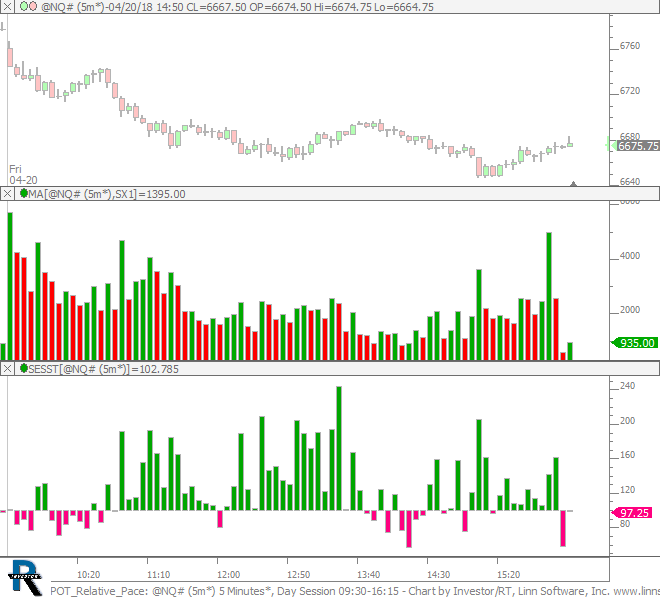 |
POT Relative Pace (@NQ#) cpayne [totalcount]
8 years 2 months ago
Pace of Tape - Relative Pace - Middle pane plots the number of trades (pace) and bottom pane shows the pace relative to avergae of past 5 days (same timeframe). |
View |
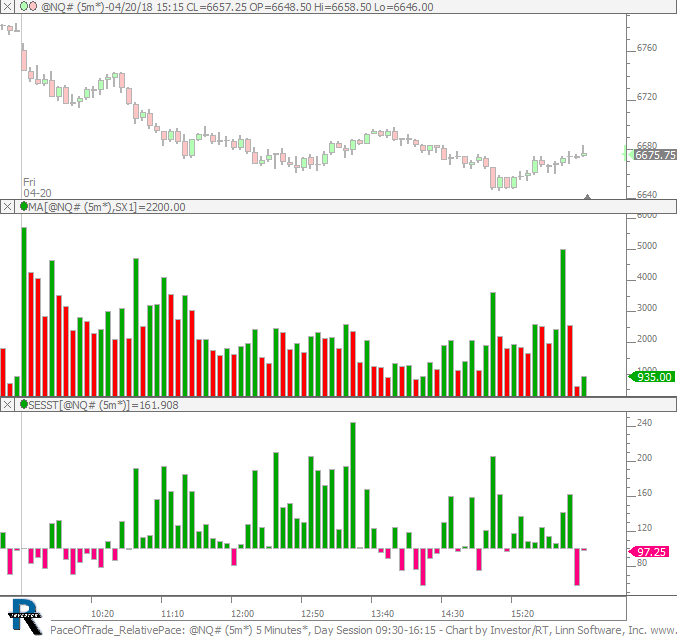 |
PaceOfTrade RelativePace (@NQ#) cpayne [totalcount]
8 years 2 months ago
Pace of Tape - Relative Pace - Middle pane plots the number of trades (pace) and bottom pane shows the pace relative to avergae of past 5 days (same timeframe). |
View |
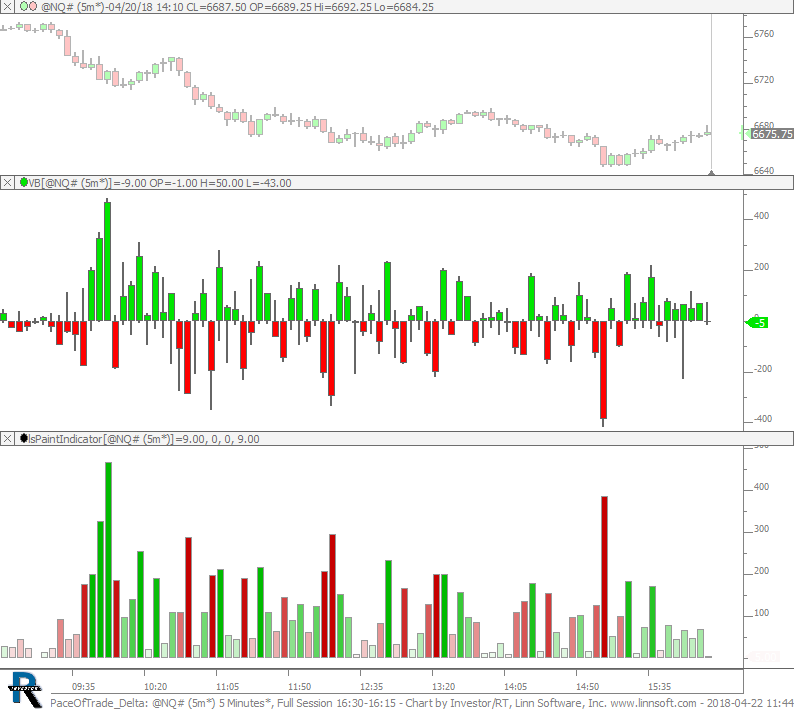 |
PaceOfTrade Delta (@NQ#) cpayne [totalcount]
8 years 2 months ago
Pace of Trade - Delta. This chart was uploaded by Investor/RT 13.2.8 showing symbol: @NQ#. |
View |
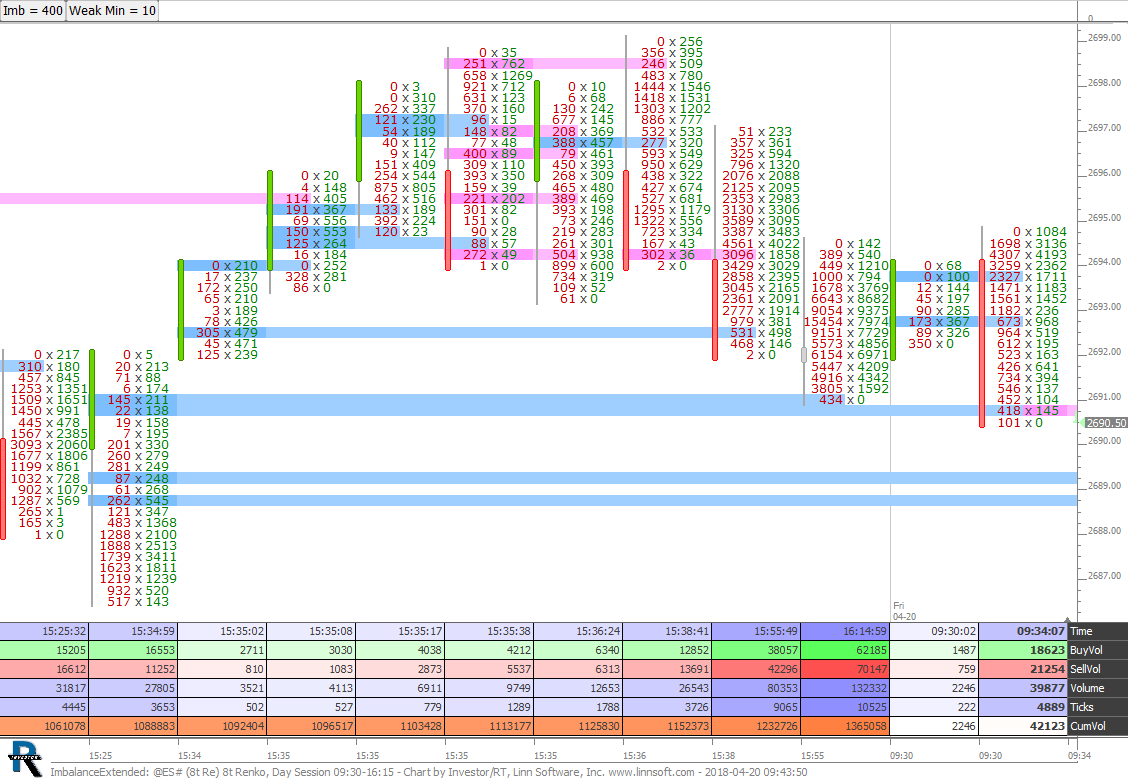 |
ImbalanceExtended (@ES#) cpayne [totalcount]
8 years 2 months ago
This chart was uploaded by Investor/RT 13.2.8 showing symbol: @ES#. |
View |
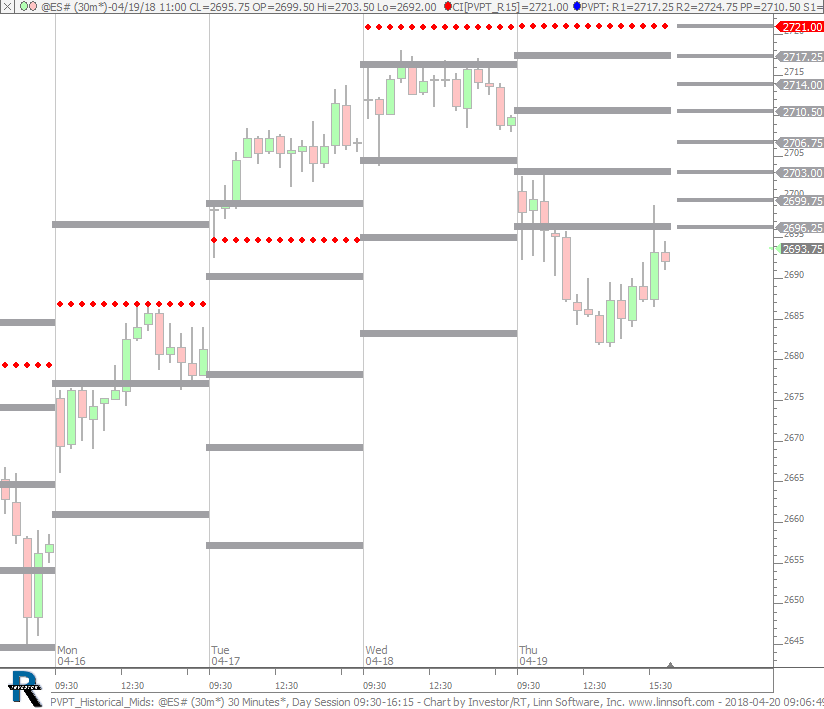 |
PVPT Historical Mids (@ES#) cpayne [totalcount]
8 years 2 months ago
Pivot Point - Historical R 1.5. This chart was uploaded by Investor/RT 13.2.8 showing symbol: @ES#. |
View |
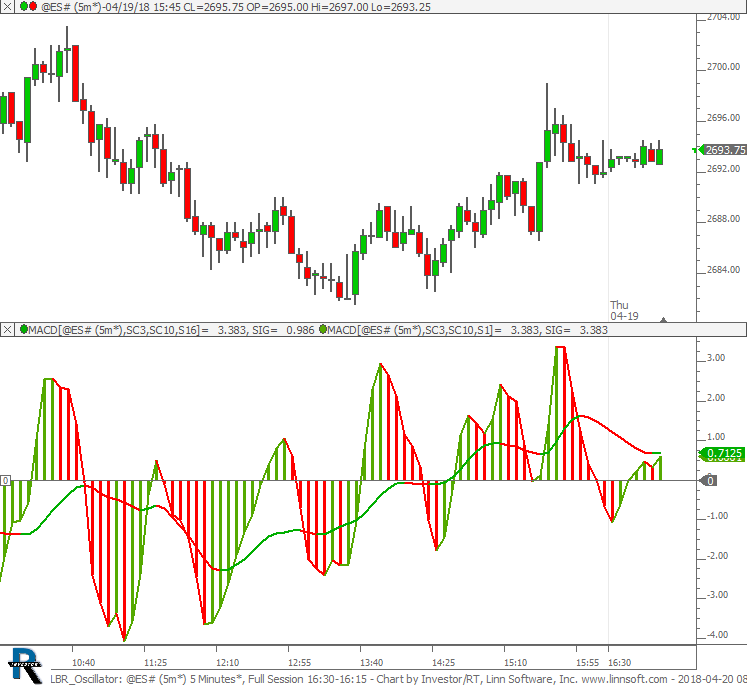 |
LBR Oscillator (@ES#) cpayne [totalcount]
8 years 2 months ago
LBR 3/10 Oscillator - Linda Bradford Rashke Three Ten Oscillator (310). This chart was uploaded by Investor/RT 13.2.8 showing symbol: @ES#. |
View |
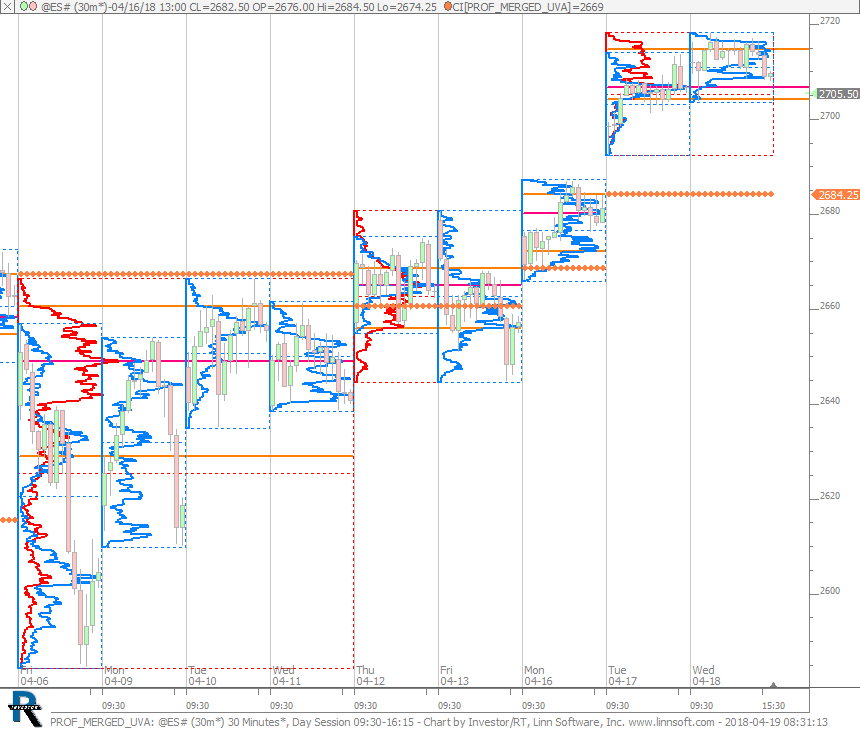 |
PROF MERGED UVA (@ES#) cpayne [totalcount]
8 years 2 months ago
This chart was uploaded by Investor/RT 13.2.8 showing symbol: @ES#. |
View |
 |
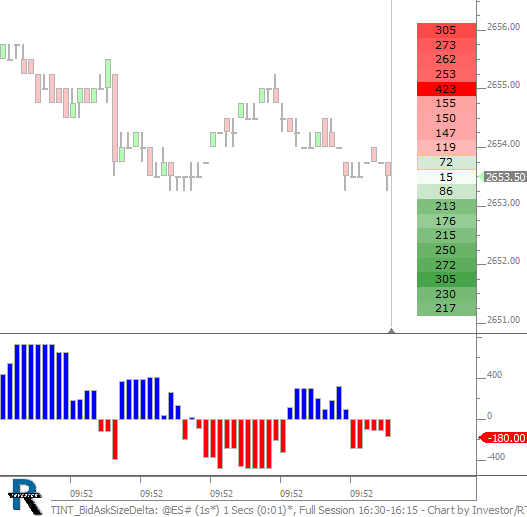
TINT BidAskDelta (@ES#) cpayne [totalcount]
8 years 3 months ago
TINT with bid size minus ask size in lower pane. This chart was uploaded by Investor/RT 13.2.8 showing symbol: @ES#. |
View |
 |
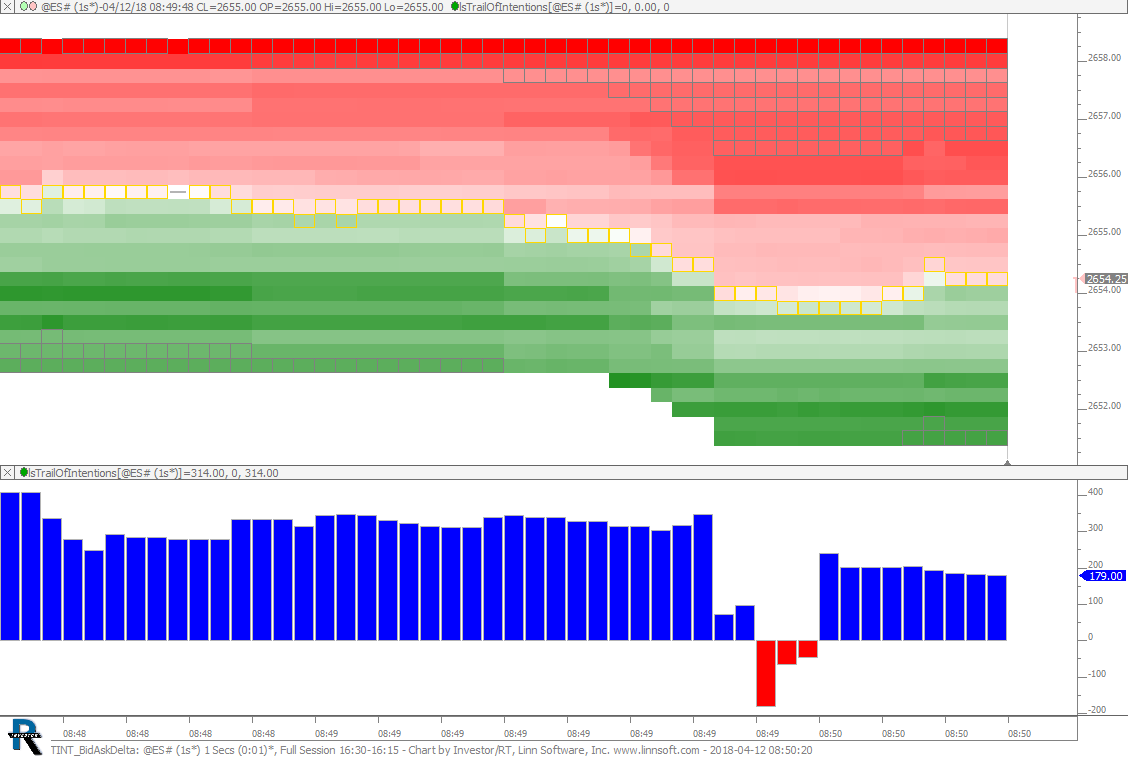
TINT BidAskSizeDelta (@ES#) cpayne [totalcount]
8 years 3 months ago
Trail of Intentions. Plotting difference between bid sizes and ask sizes in lower pane. This chart was uploaded by Investor/RT 13.2.7 showing symbol: @ES#. |
View |
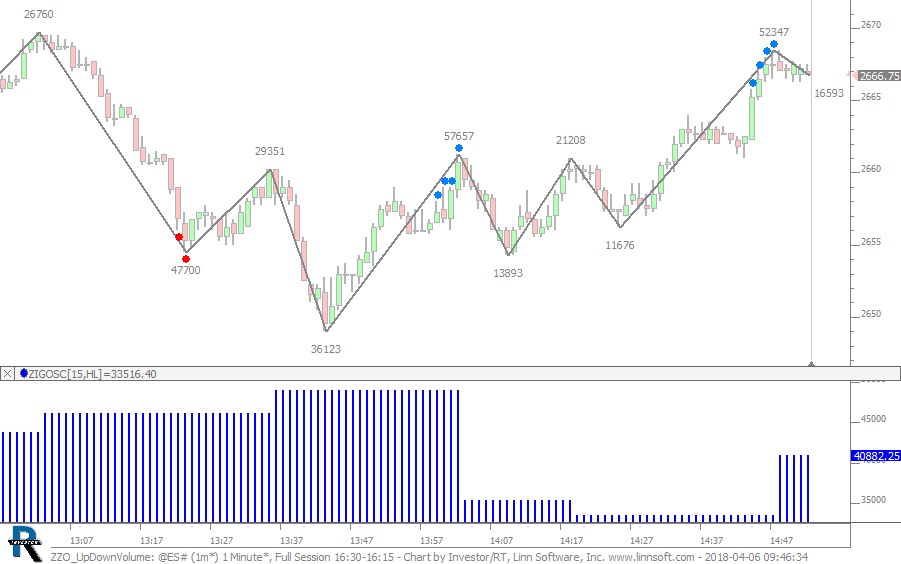 |
ZZO UpDownVolume (@ES#) cpayne [totalcount]
8 years 3 months ago
Big Volume Up Move. This chart was uploaded by Investor/RT 13.2.7 showing symbol: @ES#. |
View |
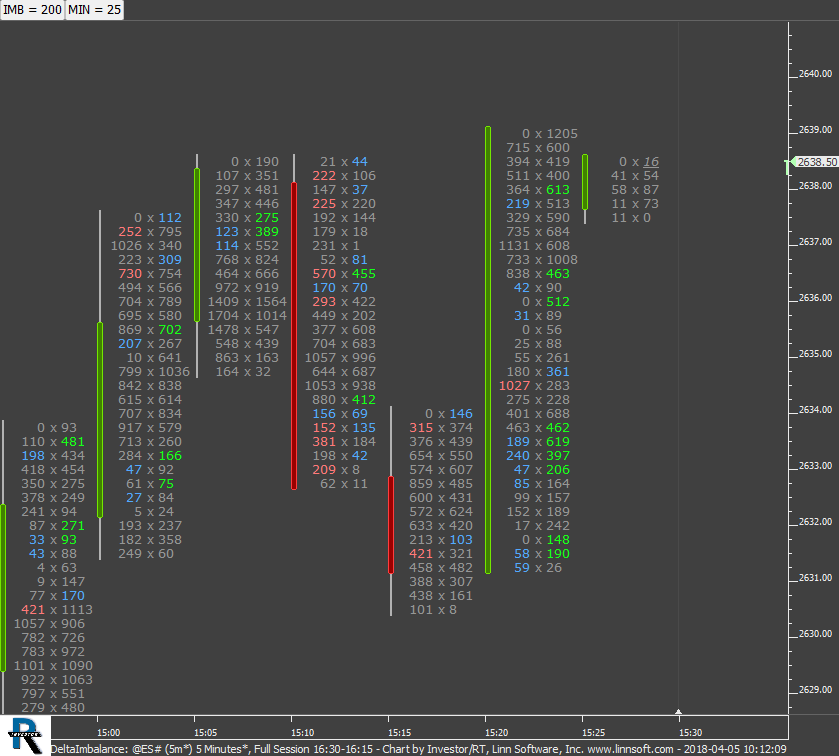 |
DeltaImbalance (@ES#) cpayne [totalcount]
8 years 3 months ago
Delta Imbalance - Use Buttons To Control IMB percent and MIN weak side volume. This chart was uploaded by Investor/RT 13.2.7 showing symbol: @ES#. |
View |
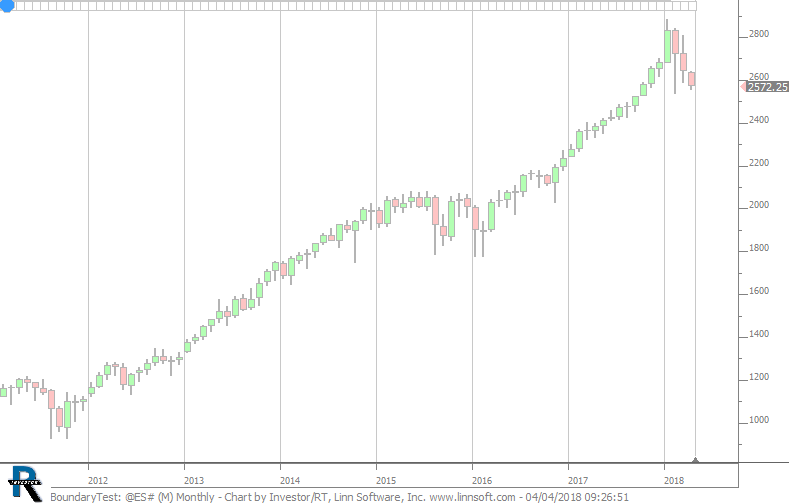 |
BoundaryTest (@ES#) cpayne [totalcount]
8 years 3 months ago
Boundaries Testing. This chart was uploaded by Investor/RT 13.2.7 showing symbol: @ES#. |
View |
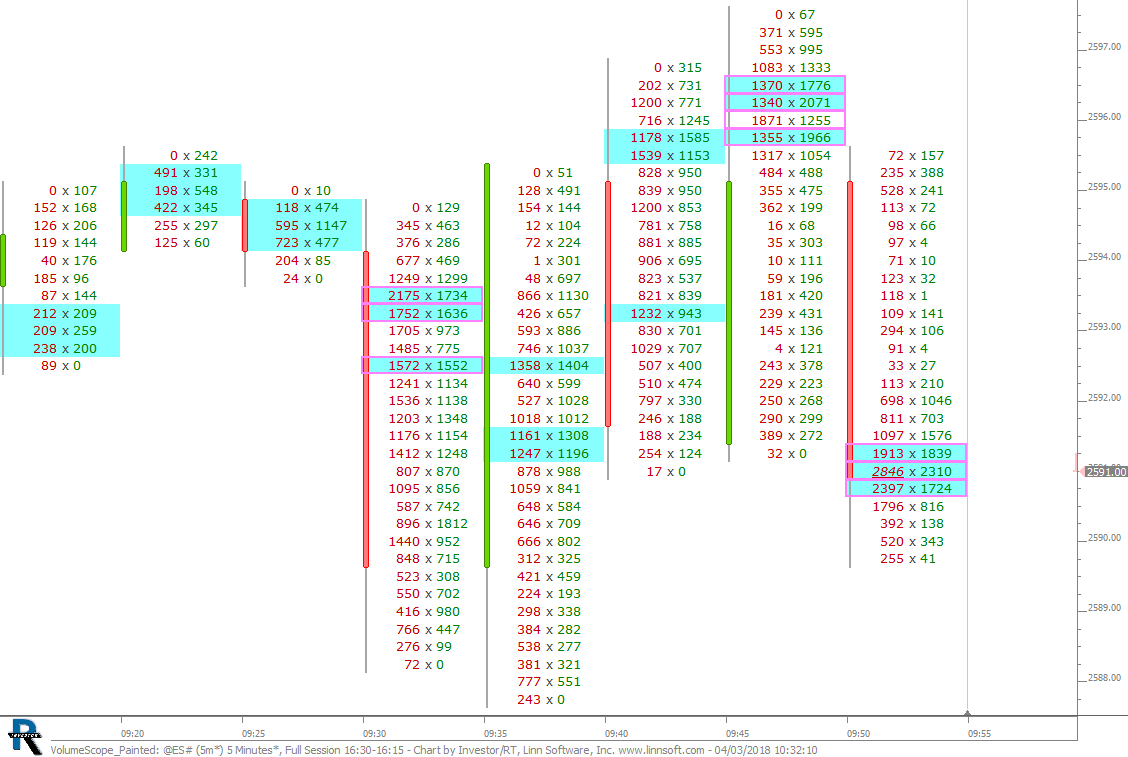 |
VolumeScope Painted (@ES#) cpayne [totalcount]
8 years 3 months ago
Highest 3 volume prices painted blue. Volume above 3000 highlighted in pink. This chart was uploaded by Investor/RT 13.2.7 showing symbol: @ES#. |
View |
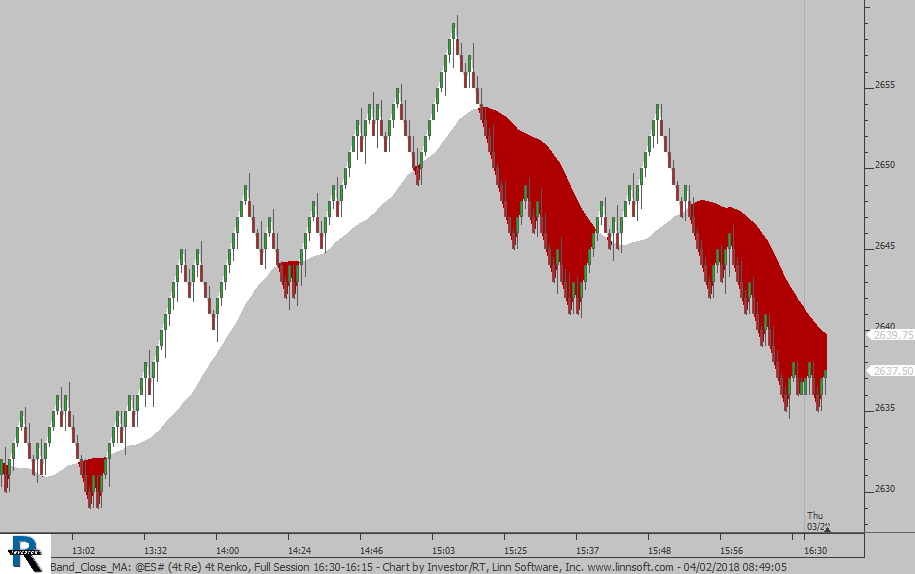 |
Band Close MA (@ES#) cpayne [totalcount]
8 years 3 months ago
Band between close and moving average. This chart was uploaded by Investor/RT 13.2.7 showing symbol: @ES#. |
View |
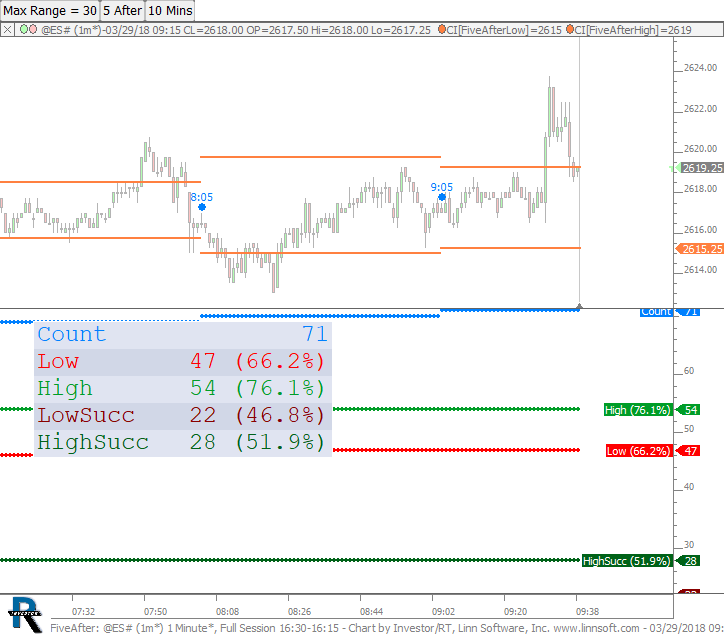 |
FiveAfter (@ES#) cpayne [totalcount]
8 years 3 months ago
IB every hour. This chart was uploaded by Investor/RT 13.2.7 showing symbol: @ES#. |
View |
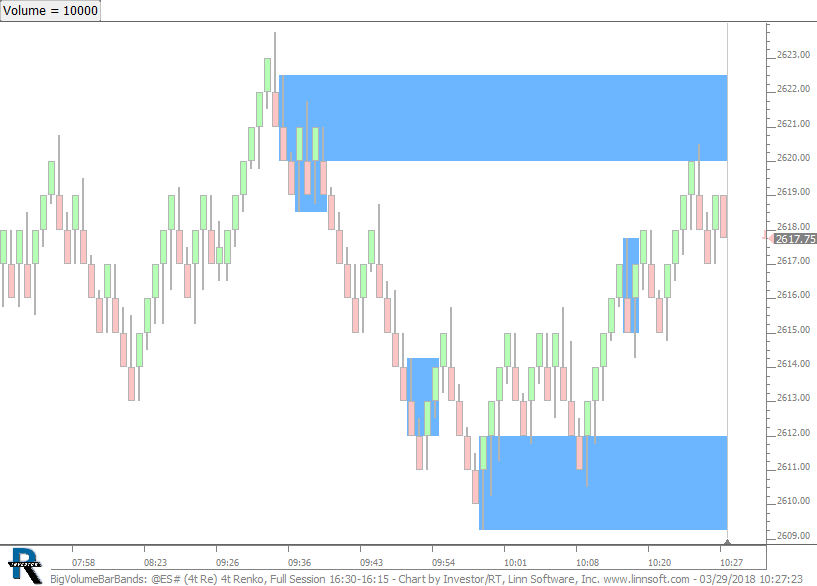 |
BigVolumeBarBands (@ES#) cpayne [totalcount]
8 years 3 months ago
Extends the range of high volume bars until filled. Volume level is dictated by button at top. This chart was uploaded by Investor/RT 13.2.7 showing symbol: @ES#. |
View |
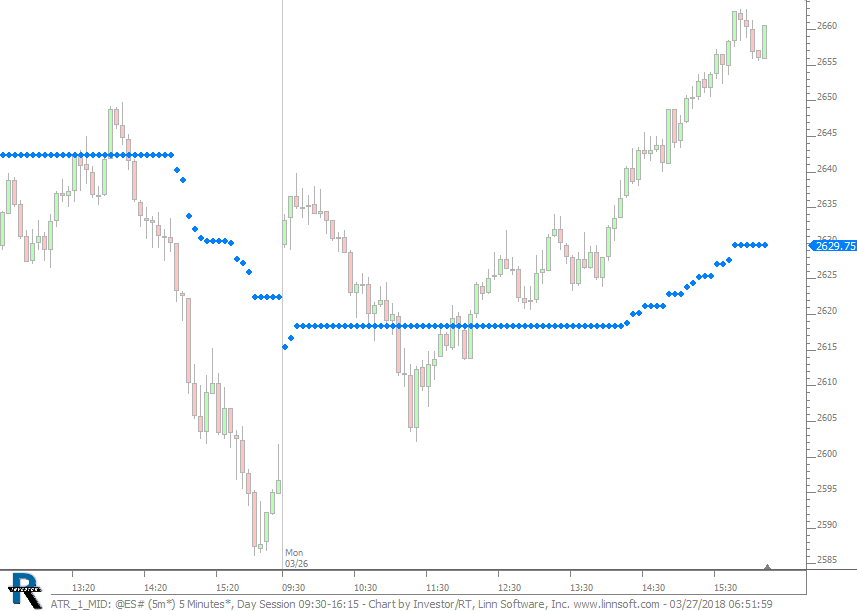 |
ATR 1 MID (@ES#) cpayne [totalcount]
8 years 3 months ago
ATR Midpoint - 1 Day Lookback. This chart was uploaded by Investor/RT 13.2.7 showing symbol: @ES#. |
View |
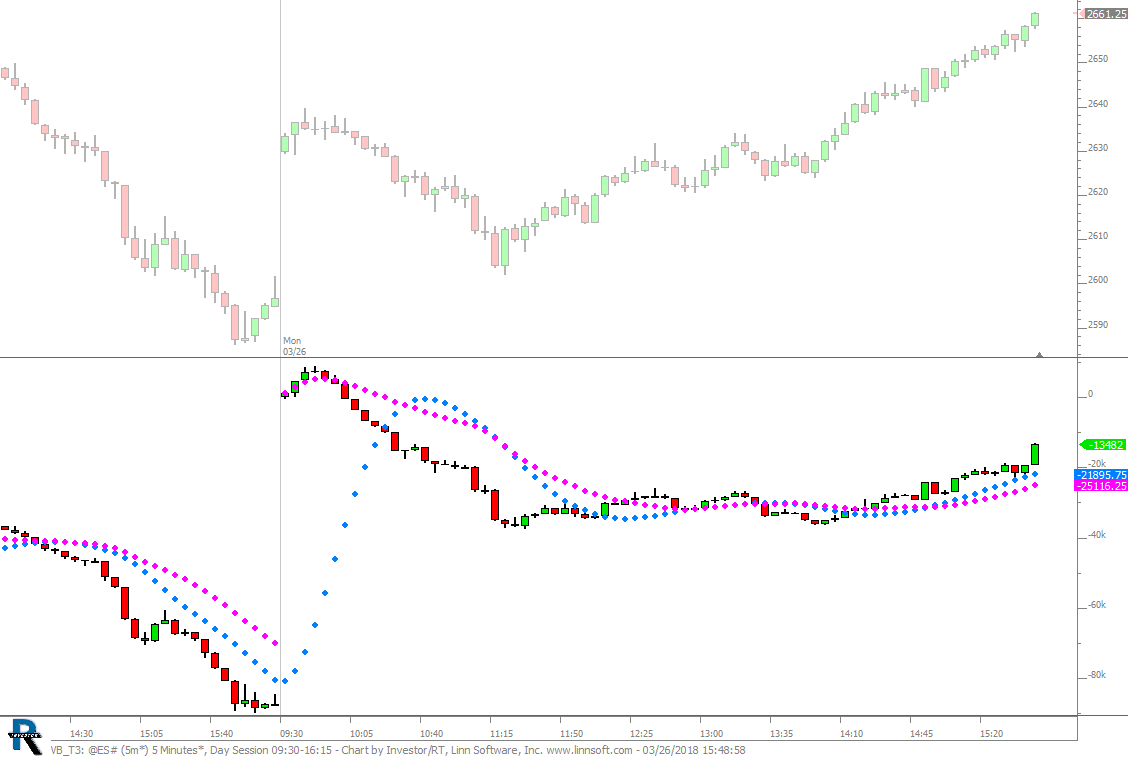 |
VB T3 (@ES#) cpayne [totalcount]
8 years 3 months ago
This chart was uploaded by Investor/RT 13.2.7 showing symbol: @ES#. |
View |
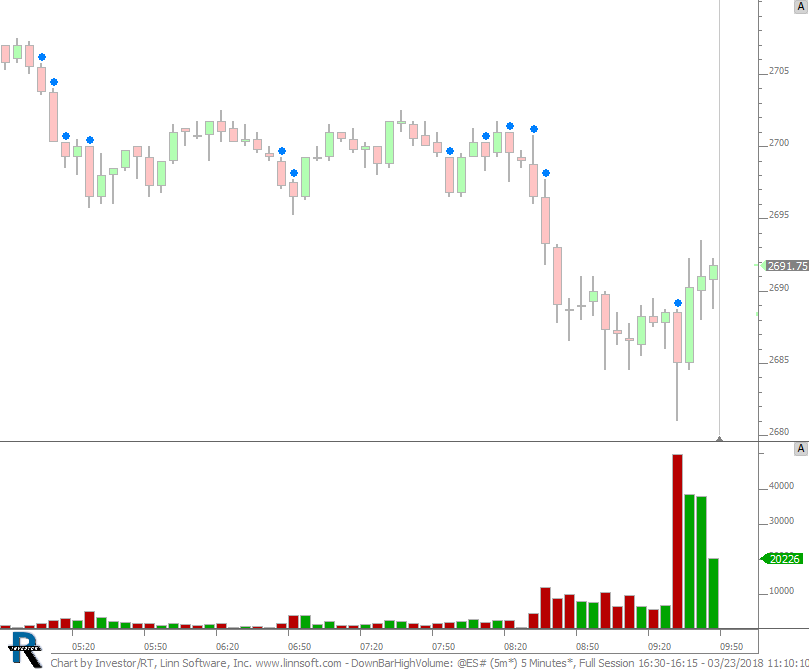 |
DownBarHighVolume (@ES#) cpayne [totalcount]
8 years 3 months ago
Identifies Down Bars whose volume is greater than the volume of the previous 5 down bars. This chart was uploaded by Investor/RT 13.2.7 showing symbol: @ES#. |
View |
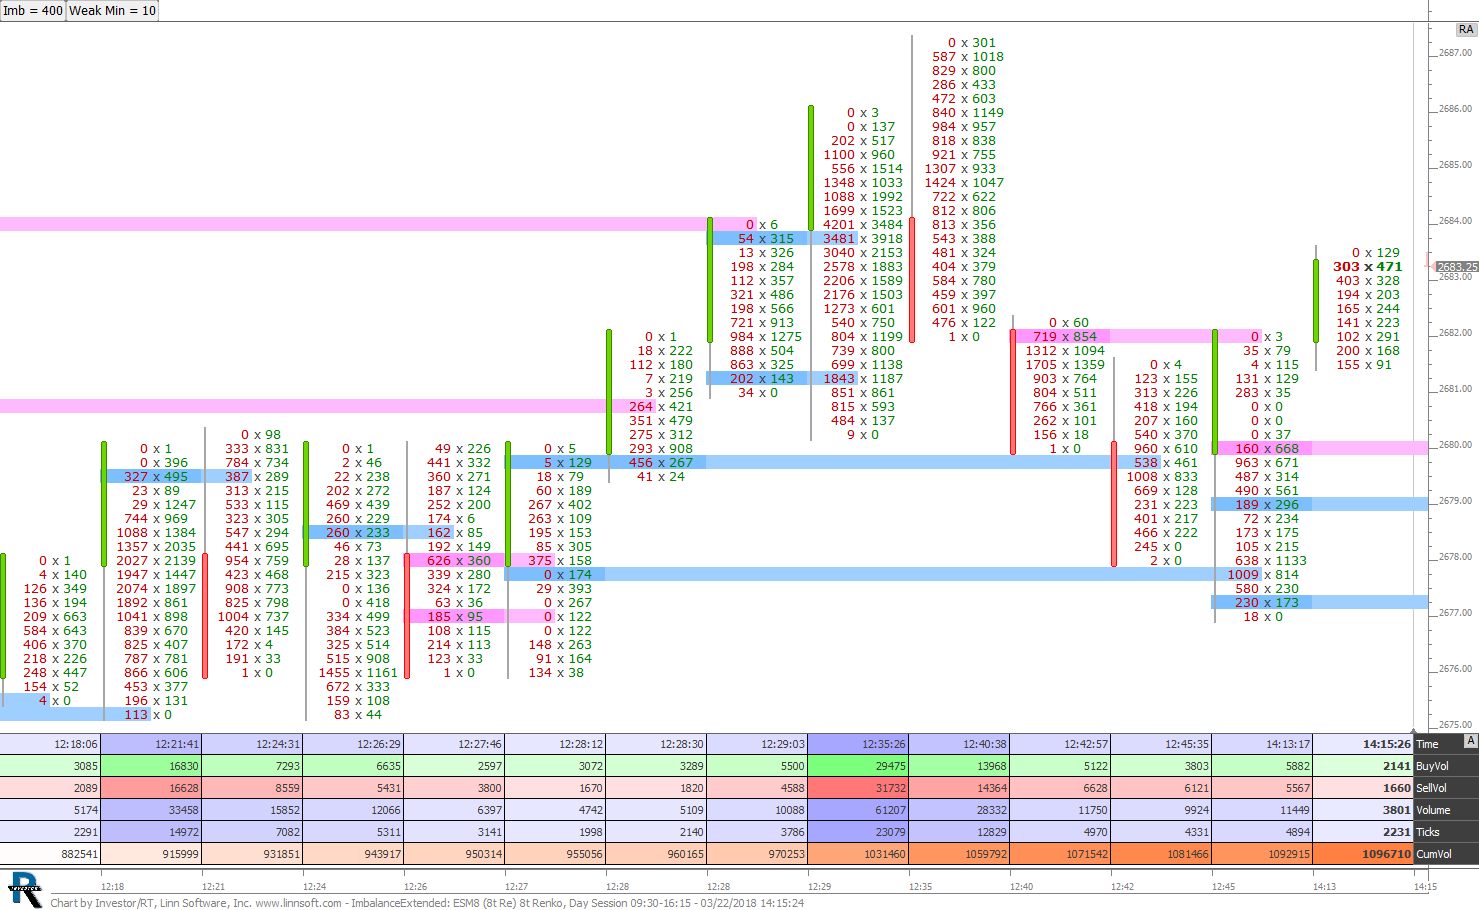 |
ImbalanceExtended (ESM8) cpayne [totalcount]
8 years 3 months ago
Buy (blue) and Sell (pink) imbalance are identified and extended while naked using MPH. The buttons at top control the imbalance percent and the minimum volume required on the weak side. |
View |