 |
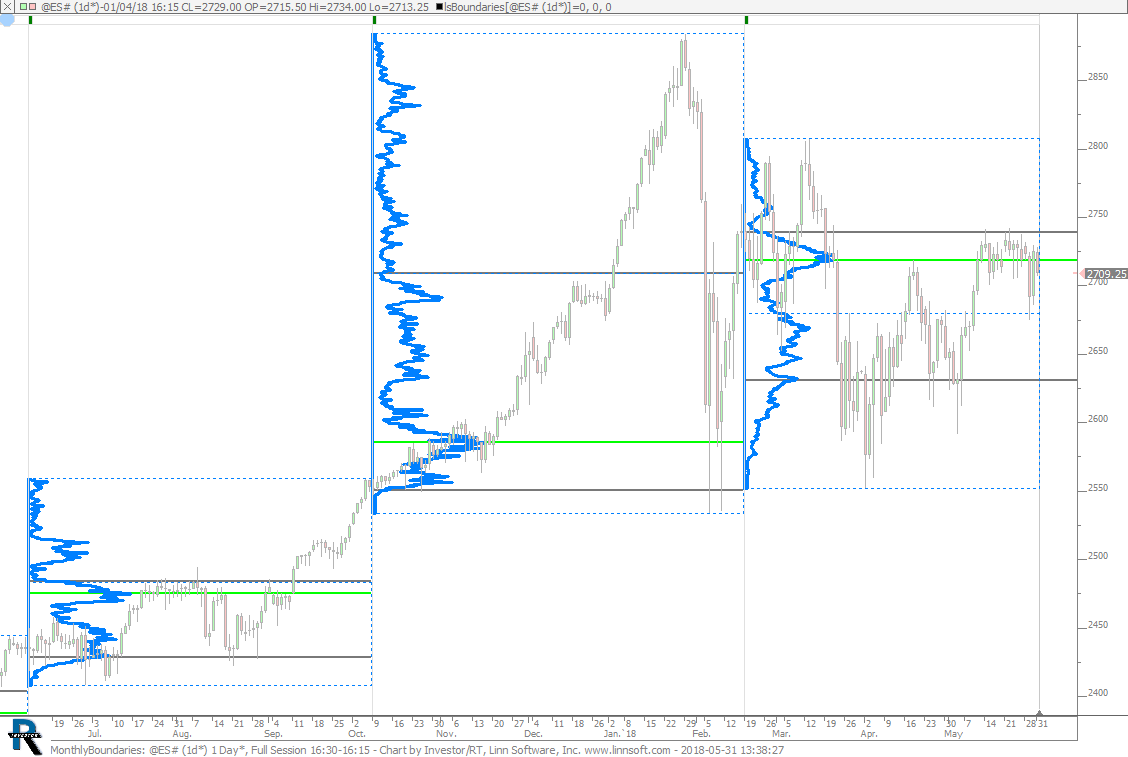
MonthlyBoundaries (@ES#) cpayne [totalcount]
8 years 1 month ago
Monthly Boundaries. This chart was uploaded by Investor/RT 13.3.4 showing symbol: @ES#. |
View |
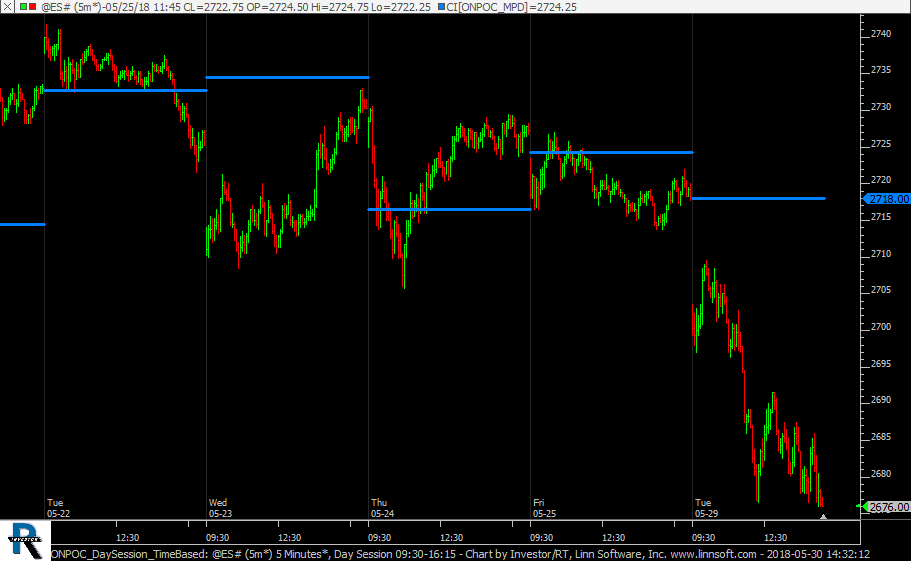 |
ONPOC DaySession TimeBased (@ES#) cpayne [totalcount]
8 years 1 month ago
Overnight time-based POC on day session chart. This chart was uploaded by Investor/RT 13.3.4 showing symbol: @ES#. |
View |
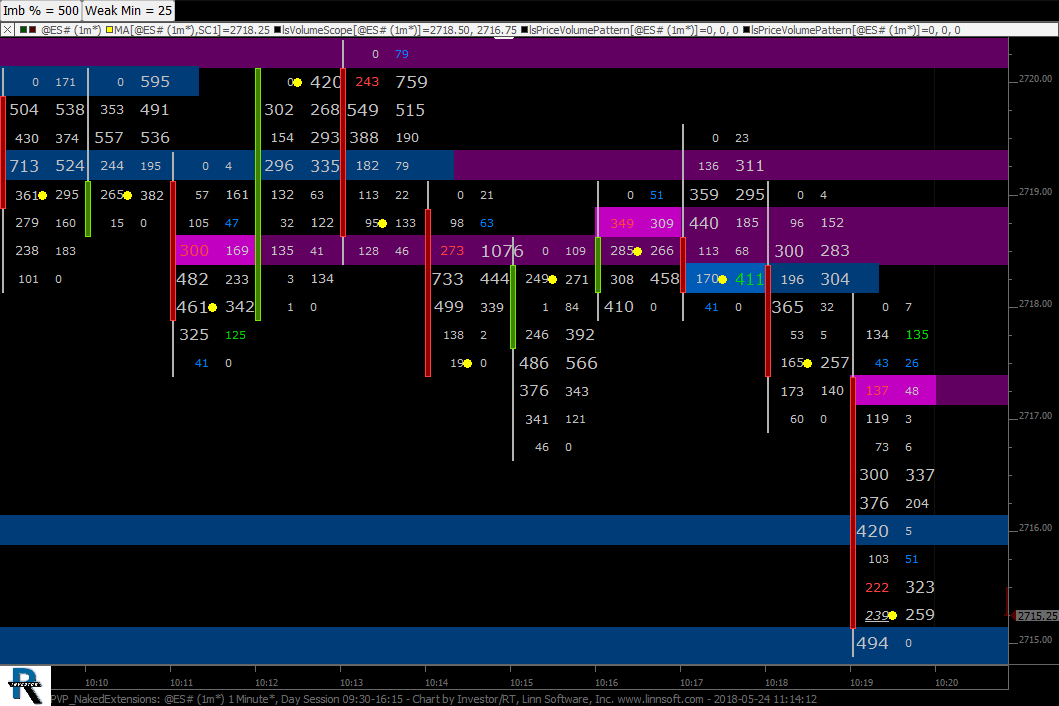 |
PVP NakedExtensions (@ES#) cpayne [totalcount]
8 years 1 month ago
PVP Naked Extensions. This chart was uploaded by Investor/RT 13.3.4 showing symbol: @ES#. |
View |
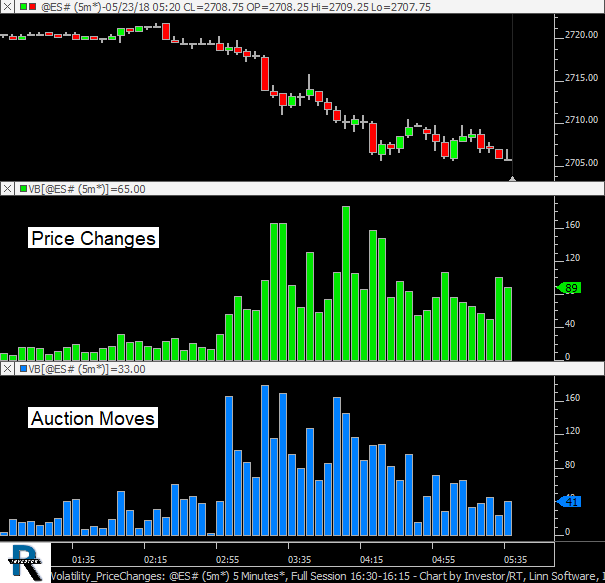 |
Volatility PriceChanges (@ES#) cpayne [totalcount]
8 years 1 month ago
Using VB for Volatility - Price Changes and Auction Moves (Bid Changes). This chart was uploaded by Investor/RT 13.3.4 showing symbol: @ES#. |
View |
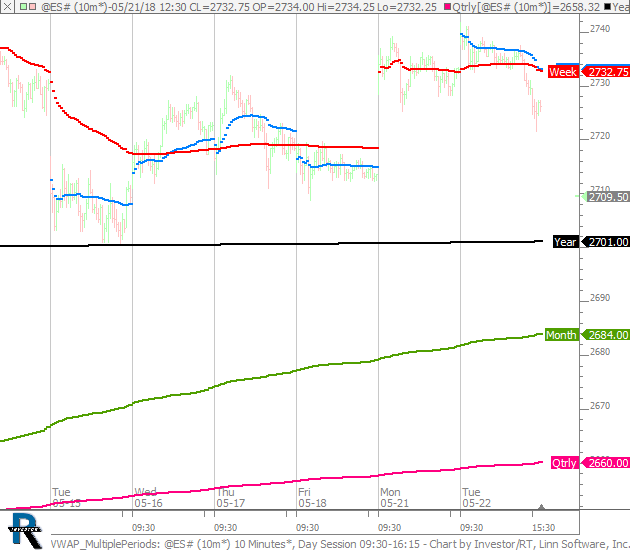 |
VWAP MultiplePeriods (@ES#) cpayne [totalcount]
8 years 1 month ago
VWAP - Multiple Durations. This chart was uploaded by Investor/RT 13.3.3 showing symbol: @ES#. |
View |
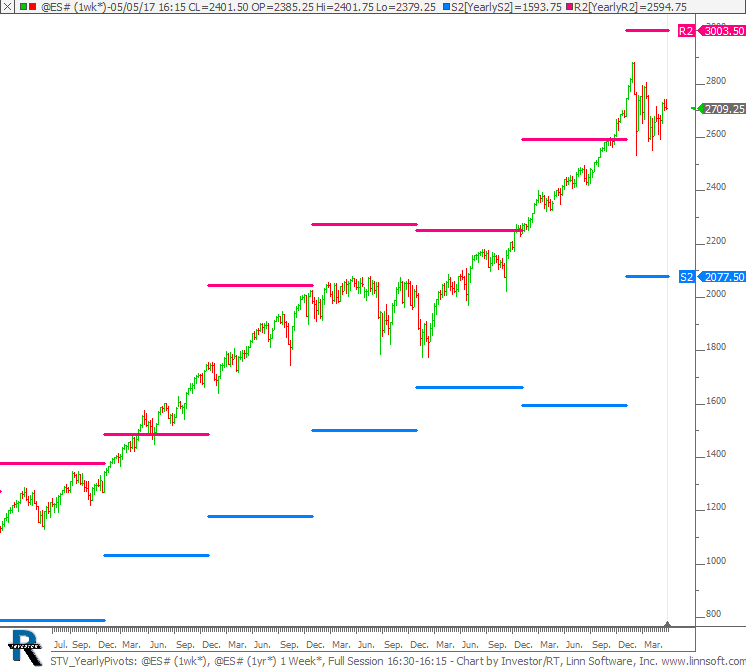 |
STV YearlyPivots (@ES#) cpayne [totalcount]
8 years 1 month ago
Yearly Pivots - S2 and R2. This chart was uploaded by Investor/RT 13.3.4 showing symbol: @ES#. |
View |
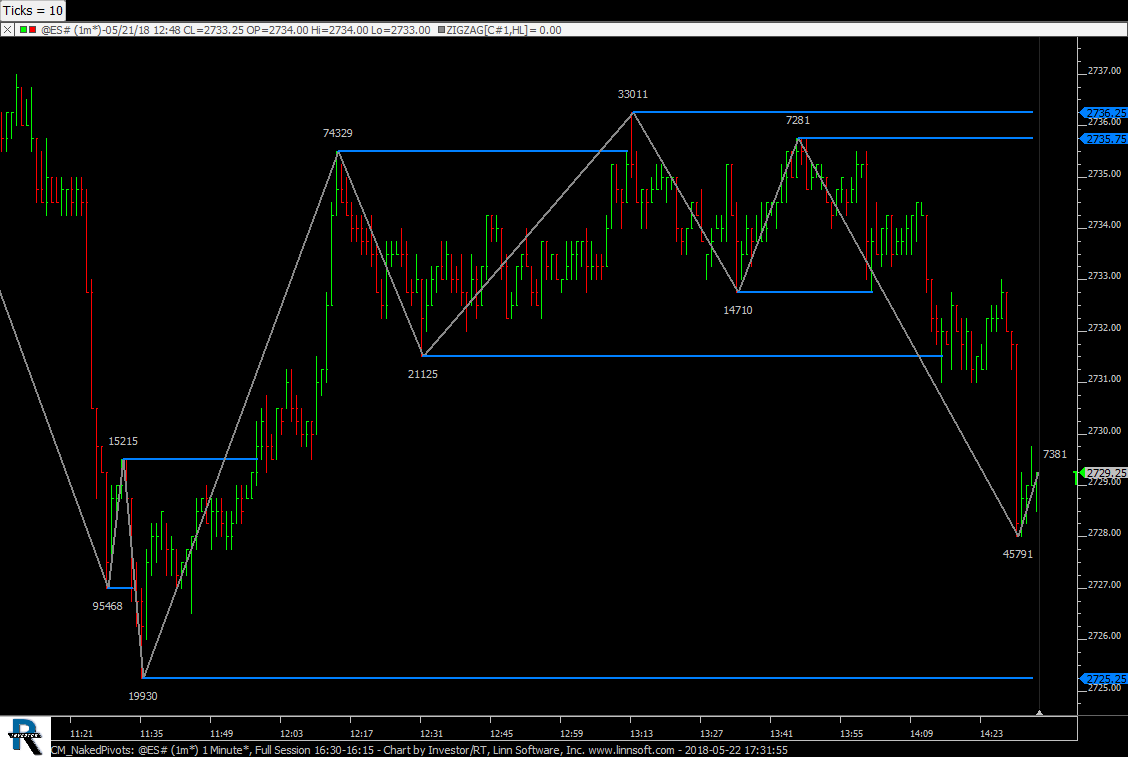 |
CM NakedPivots (@ES#) cpayne [totalcount]
8 years 1 month ago
Extending Pivots of Zig Zag. This chart was uploaded by Investor/RT 13.3.4 showing symbol: @ES#. |
View |
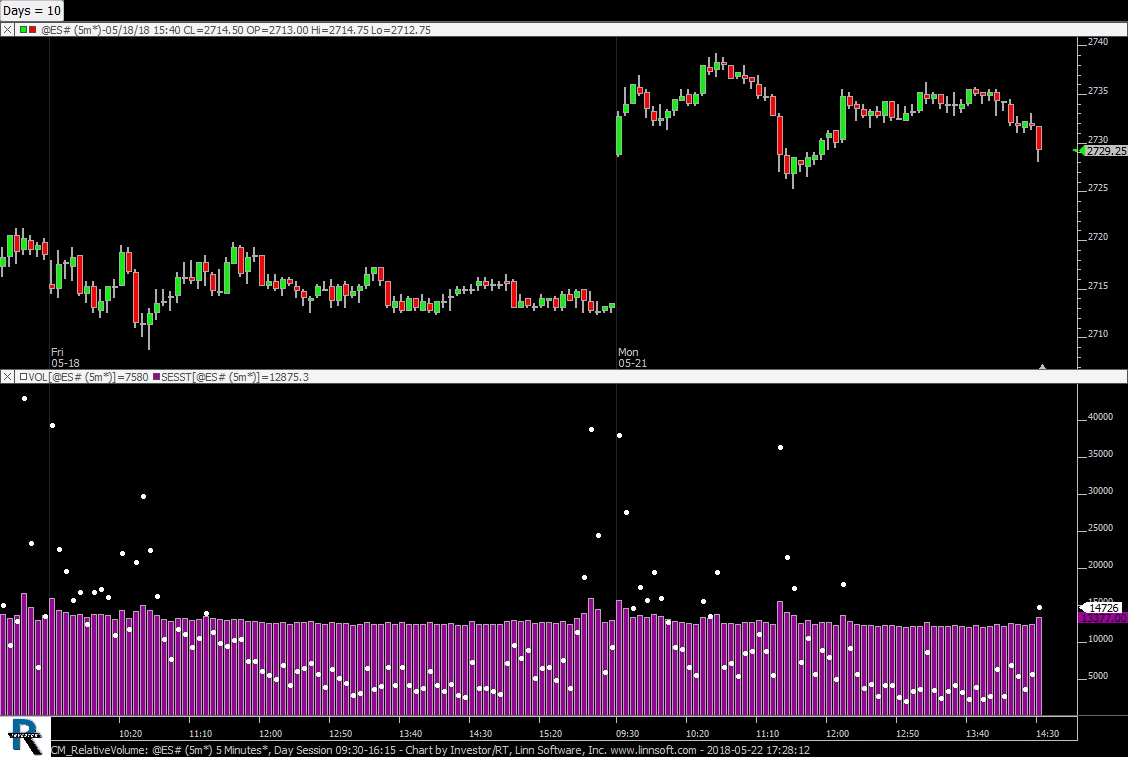 |
CM RelativeVolume (@ES#) cpayne [totalcount]
8 years 1 month ago
Volume vs Average Volume (10 days). This chart was uploaded by Investor/RT 13.3.4 showing symbol: @ES#. |
View |
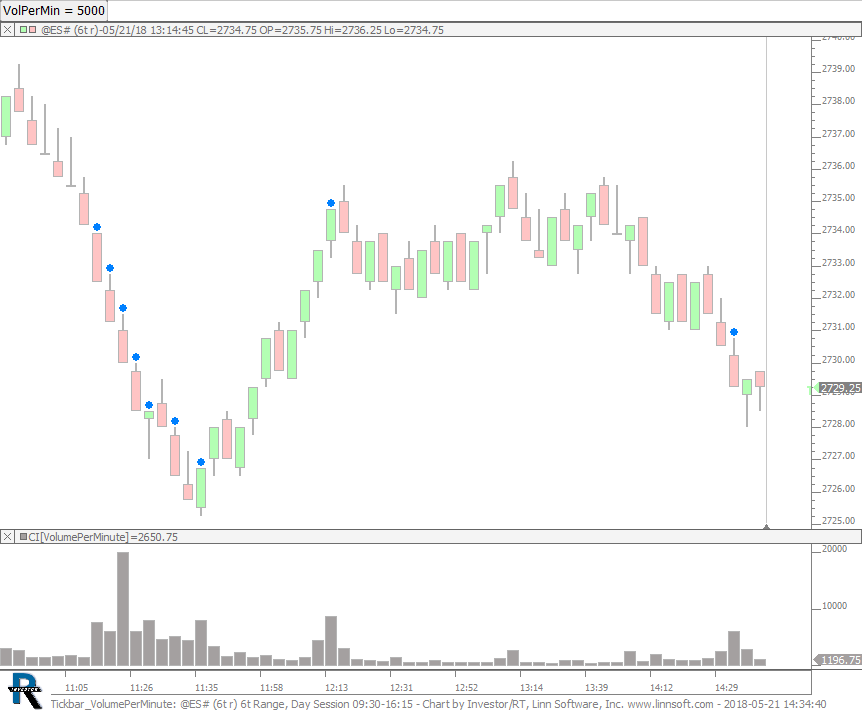 |
Tickbar VolumePerMinute (@ES#) cpayne [totalcount]
8 years 1 month ago
Volume Per Minute Alerts. This chart was uploaded by Investor/RT 13.3.4 showing symbol: @ES#. |
View |
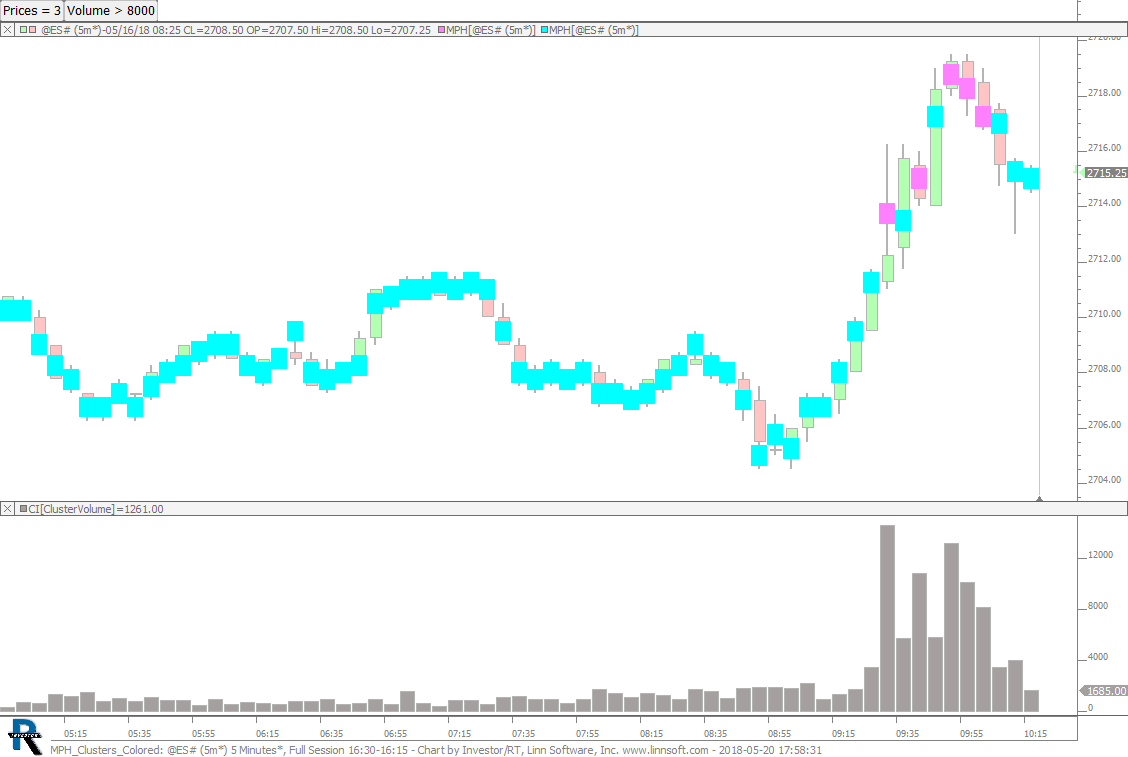 |
MPH Clusters Colored (@ES#) cpayne [totalcount]
8 years 1 month ago
Painting Volume Clusters. This chart was uploaded by Investor/RT 13.3.3 showing symbol: @ES#. |
View |
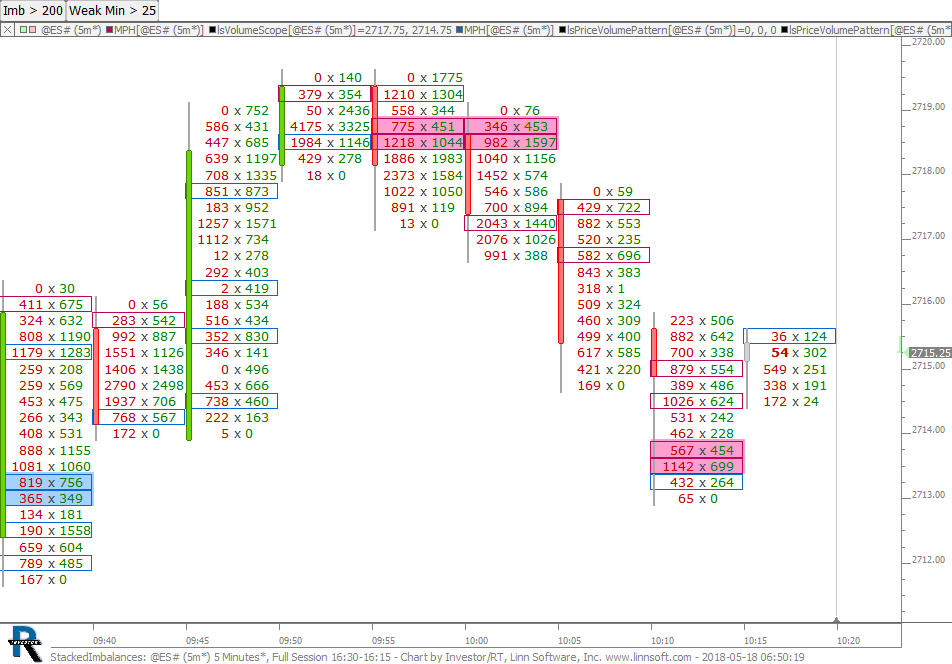 |
StackedImbalances (@ES#) cpayne [totalcount]
8 years 1 month ago
Stacked Imbalances. This chart was uploaded by Investor/RT 13.3.3 showing symbol: @ES#. |
View |
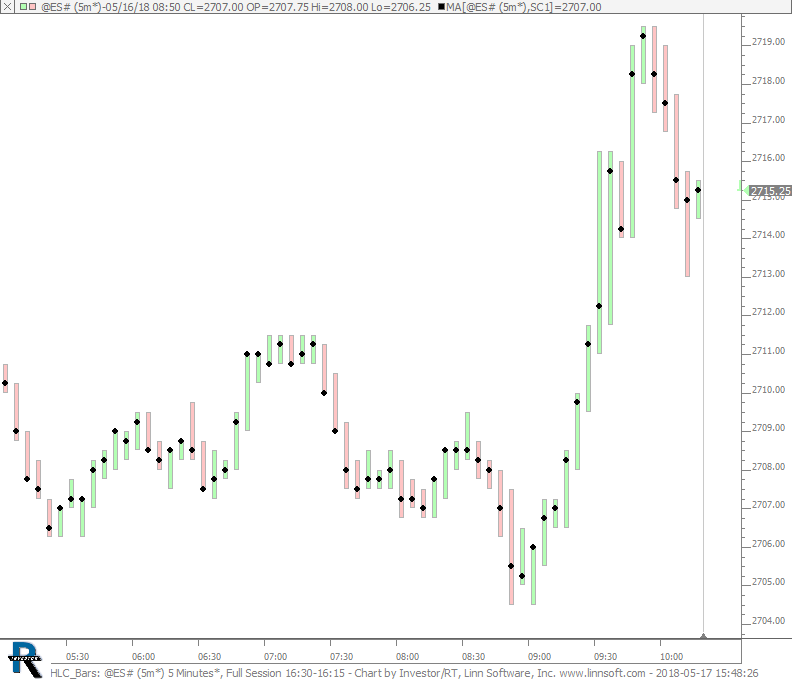 |
HLC Bars (@ES#) cpayne [totalcount]
8 years 1 month ago
HLC Bars. This chart was uploaded by Investor/RT 13.3.3 showing symbol: @ES#. |
View |
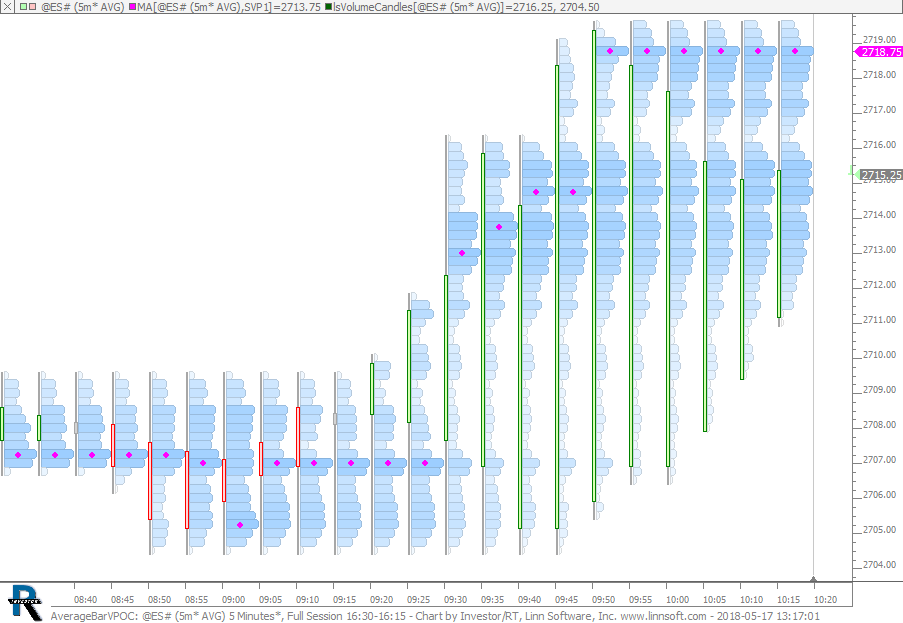 |
AverageBarVPOC (@ES#) cpayne [totalcount]
8 years 2 months ago
Average Bars - VPOC. This chart was uploaded by Investor/RT 13.3.3 showing symbol: @ES#. |
View |
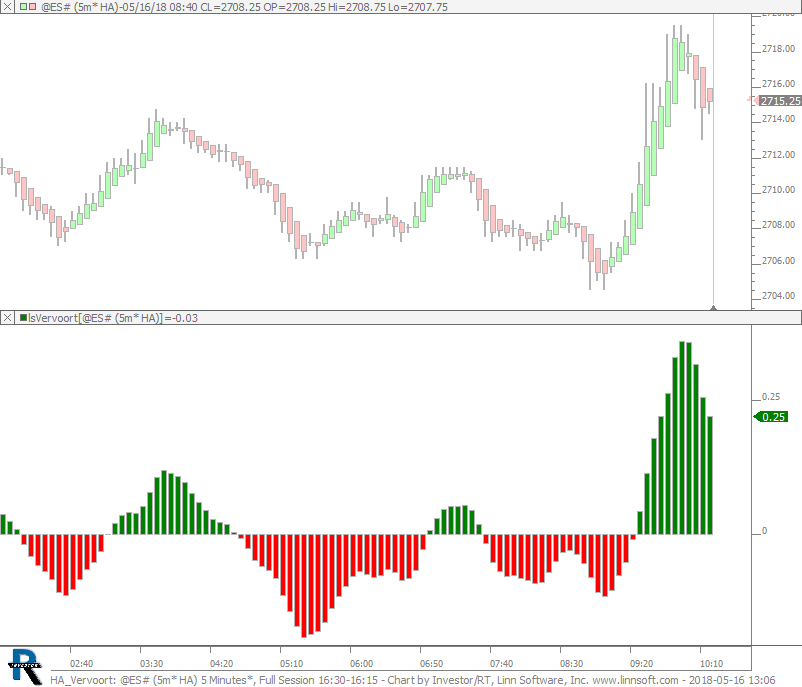 |
HA Vervoort (@ES#) cpayne [totalcount]
8 years 2 months ago
HA Vervoort. This chart was uploaded by Investor/RT 13.3.3 showing symbol: @ES#. |
View |
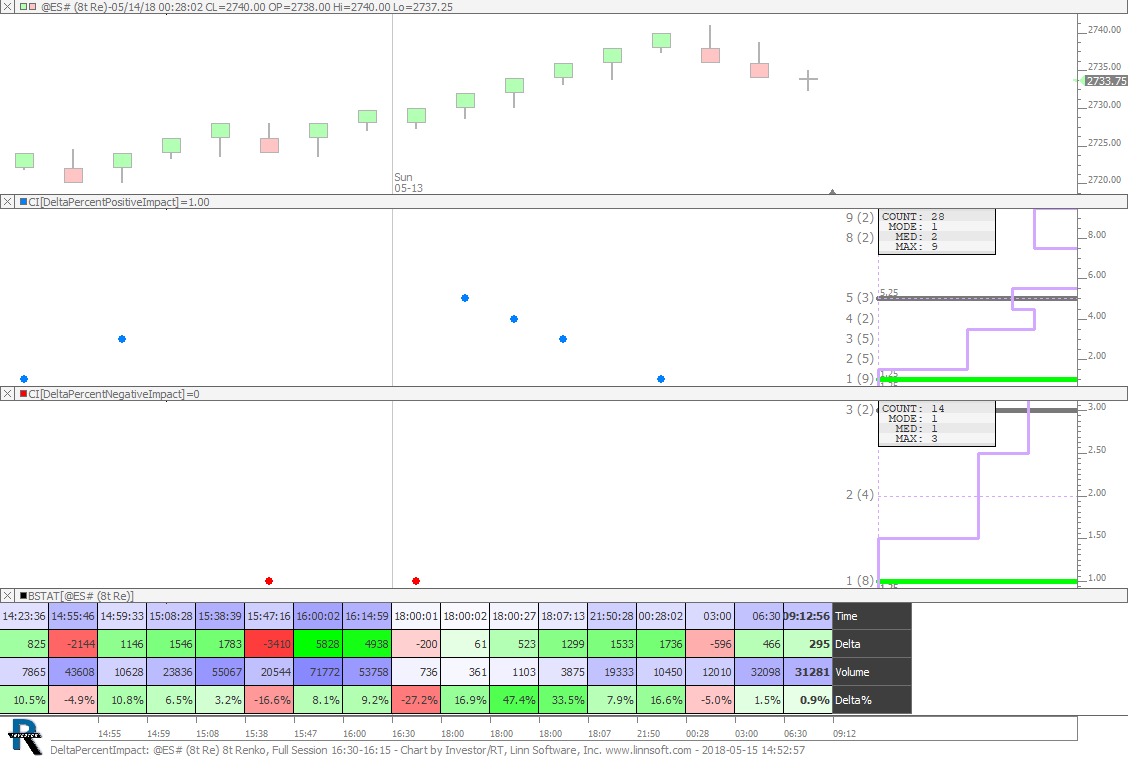 |
DeltaPercentImpact (@ES#) cpayne [totalcount]
8 years 2 months ago
After a Delta Percent Bar of +10% or greater, how many up bars did that generate (include the existing). Same for -10% or lower. |
View |
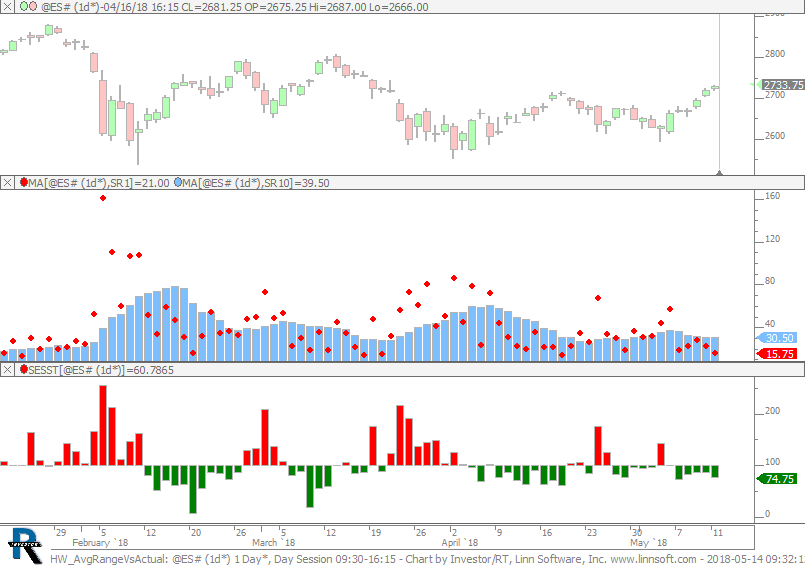 |
HW AvgRangeVsActual (@ES#) cpayne [totalcount]
8 years 2 months ago
Actual Range (Red) vs 10 day Average Range (blue histogram). This chart was uploaded by Investor/RT 13.3.3 showing symbol: @ES#. |
View |
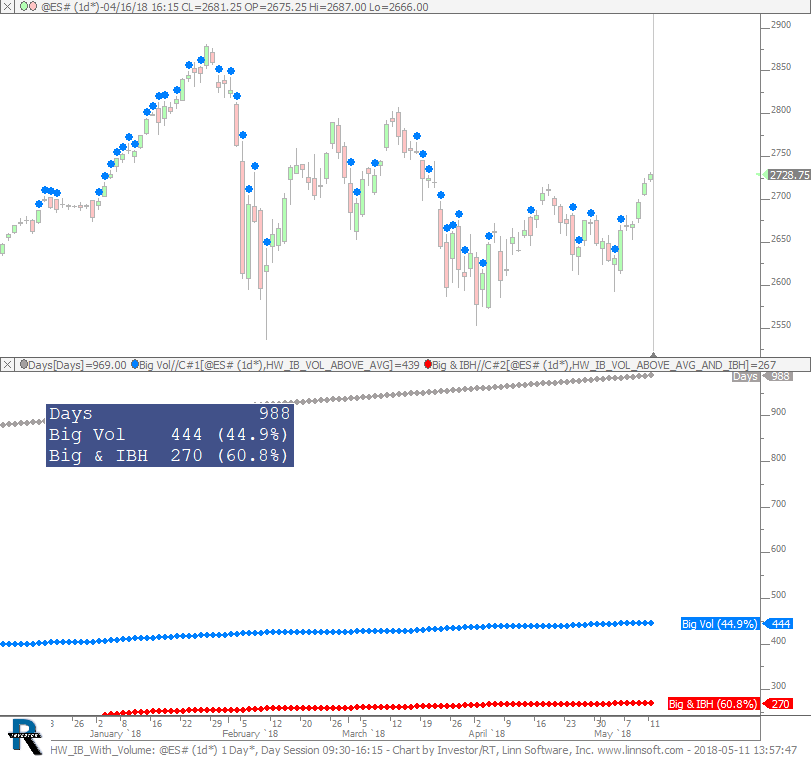 |
HW IB With Volume (@ES#) cpayne [totalcount]
8 years 2 months ago
On above average volume IB days, how often does price break above IBH. This chart was uploaded by Investor/RT 13.3.3 showing symbol: @ES#. |
View |
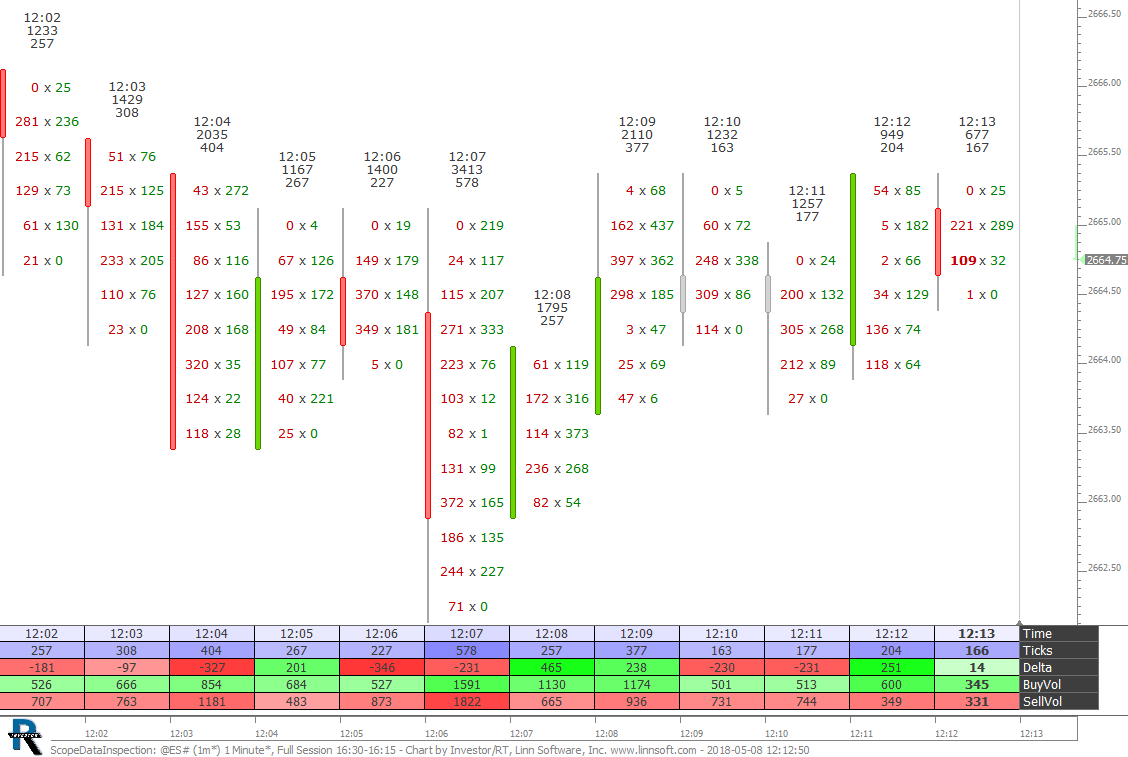 |
ScopeDataInspection (@ES#) cpayne [totalcount]
8 years 2 months ago
This chart was uploaded by Investor/RT 13.3.1 showing symbol: @ES#. |
View |
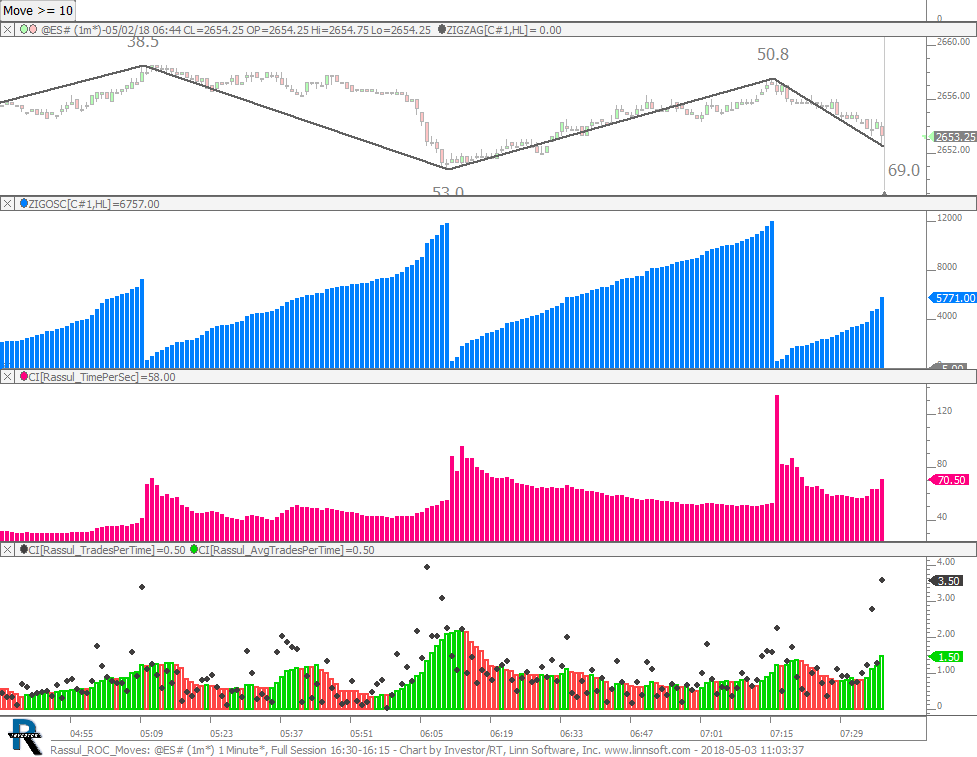 |
Rassul ROC Moves (@ES#) cpayne [totalcount]
8 years 2 months ago
This chart was uploaded by Investor/RT 13.3.1 showing symbol: @ES#. |
View |
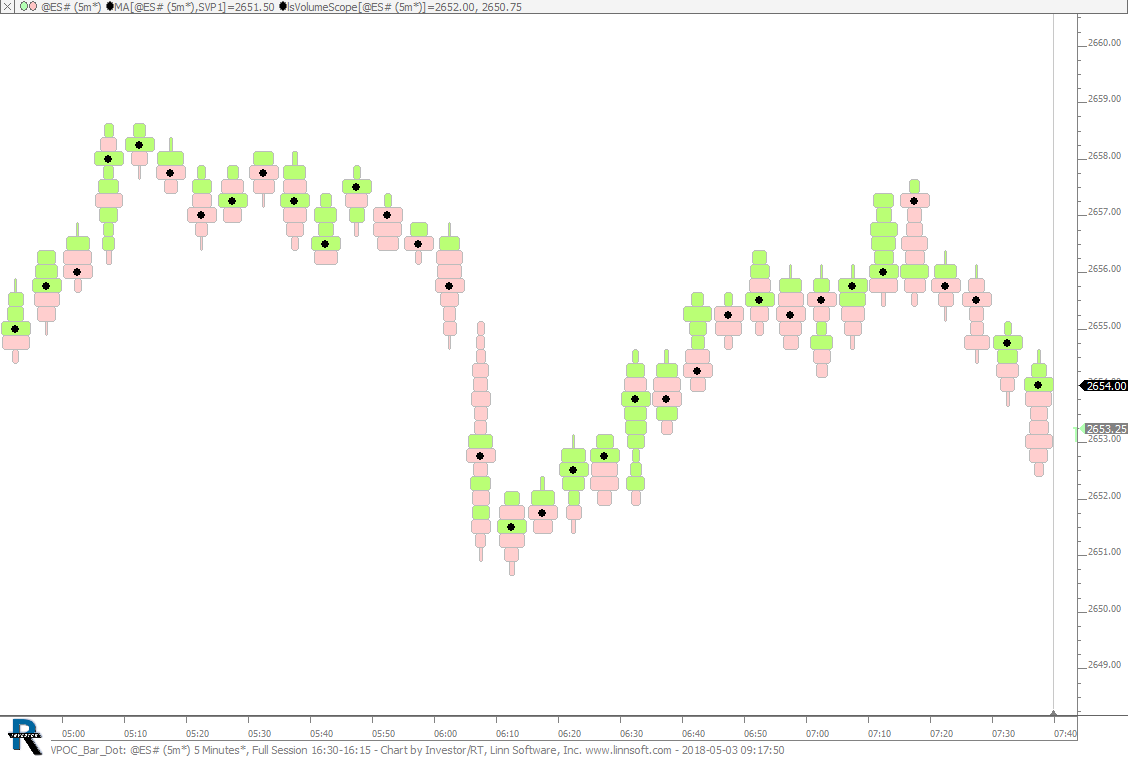 |
VPOC Bar Dot (@ES#) cpayne [totalcount]
8 years 2 months ago
VPOC of Bar is Dot. This chart was uploaded by Investor/RT 13.3.1 showing symbol: @ES#. |
View |
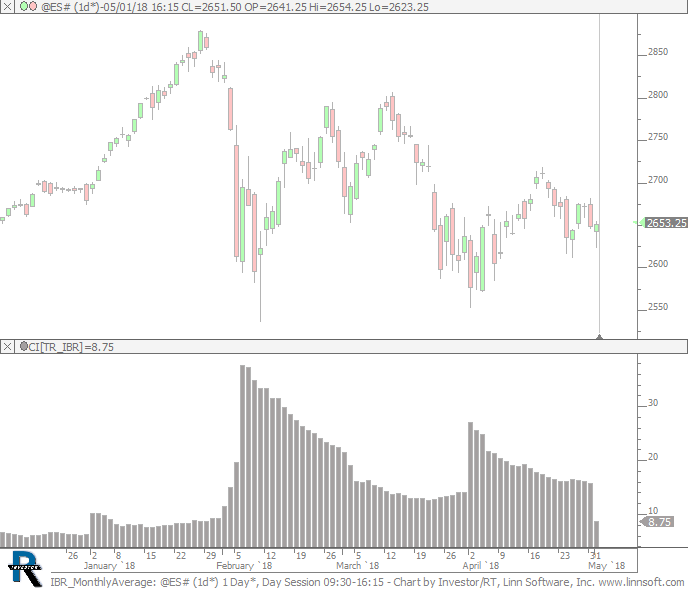 |
IBR MonthlyAverage (@ES#) cpayne [totalcount]
8 years 2 months ago
IB Range - Monthly Average. This chart was uploaded by Investor/RT 13.3.1 showing symbol: @ES#. |
View |
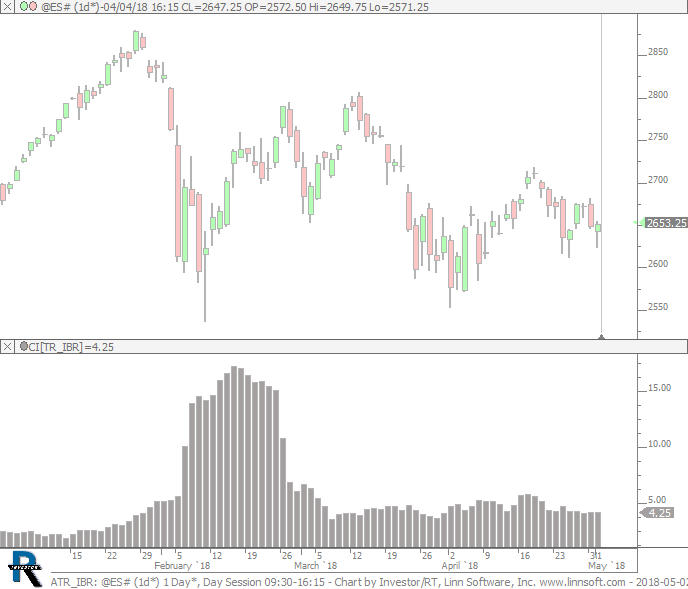 |
ATR IBR (@ES#) cpayne [totalcount]
8 years 2 months ago
ATR of IB Range. This chart was uploaded by Investor/RT 13.3.1 showing symbol: @ES#. |
View |
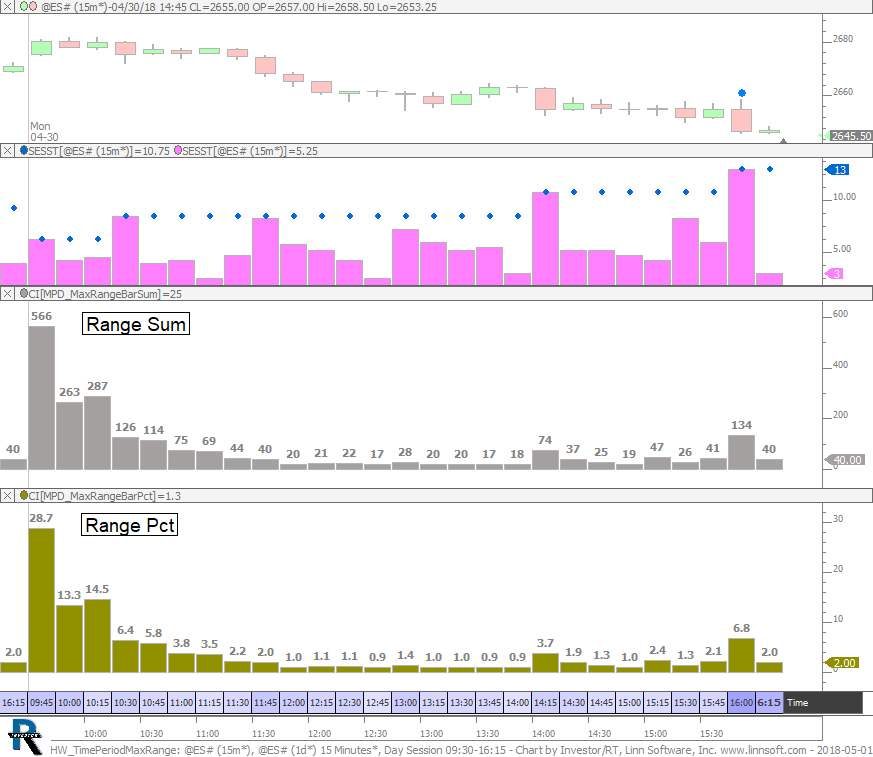 |
HW TimePeriodMaxRange (@ES#) cpayne [totalcount]
8 years 2 months ago
Sum and Percent of time the highest range bar is made at each 15 minute period during the session. This chart was uploaded by Investor/RT 13.3.1 showing symbol: @ES#. |
View |
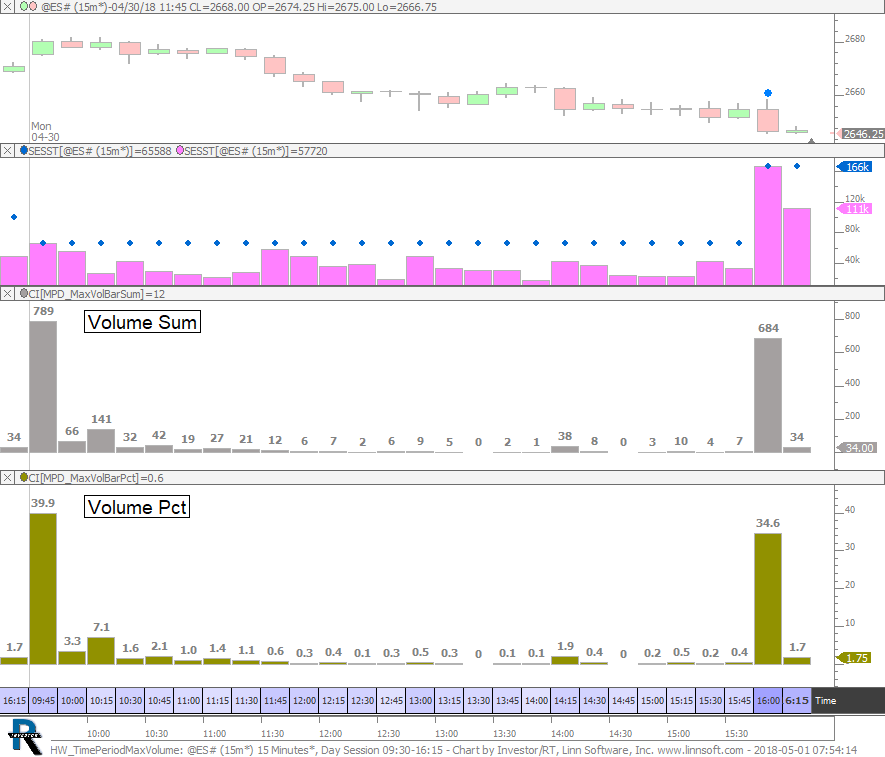 |
HW TimePeriodMaxVolume (@ES#) cpayne [totalcount]
8 years 2 months ago
Sum and Percent of time the highest volume bar is made at each 15 minute period during the session. This chart was uploaded by Investor/RT 13.3.1 showing symbol: @ES#. |
View |
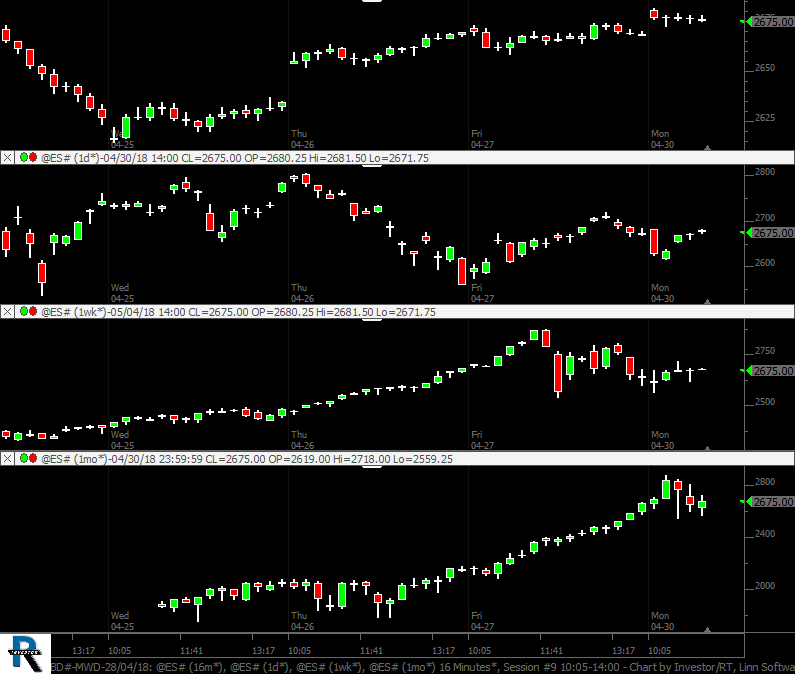 |
BD MWD 28 04 18 (@ES#) cpayne [totalcount]
8 years 2 months ago
This chart was uploaded by Investor/RT 13.3.1 showing symbol: @ES#. |
View |