 |
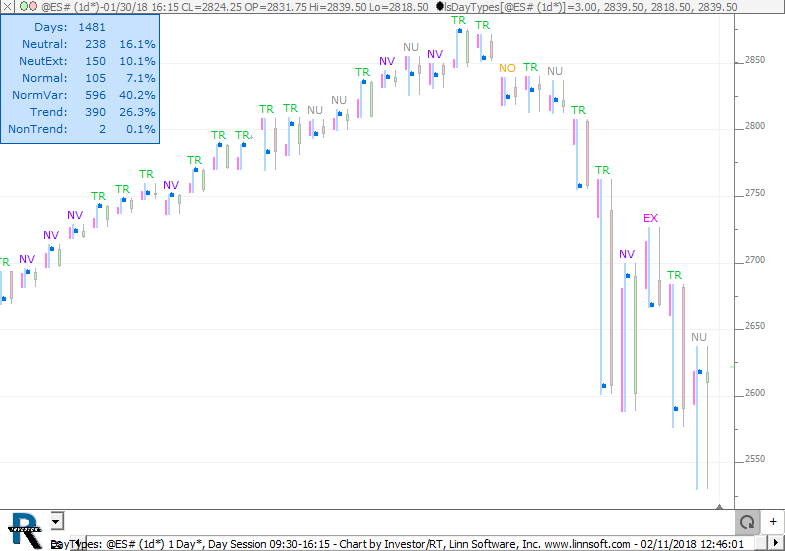
DayTypes (@ES#) cpayne [totalcount]
8 years 5 months ago
This chart was uploaded by Investor/RT 13.2.2 showing symbol: @ES#. |
View |
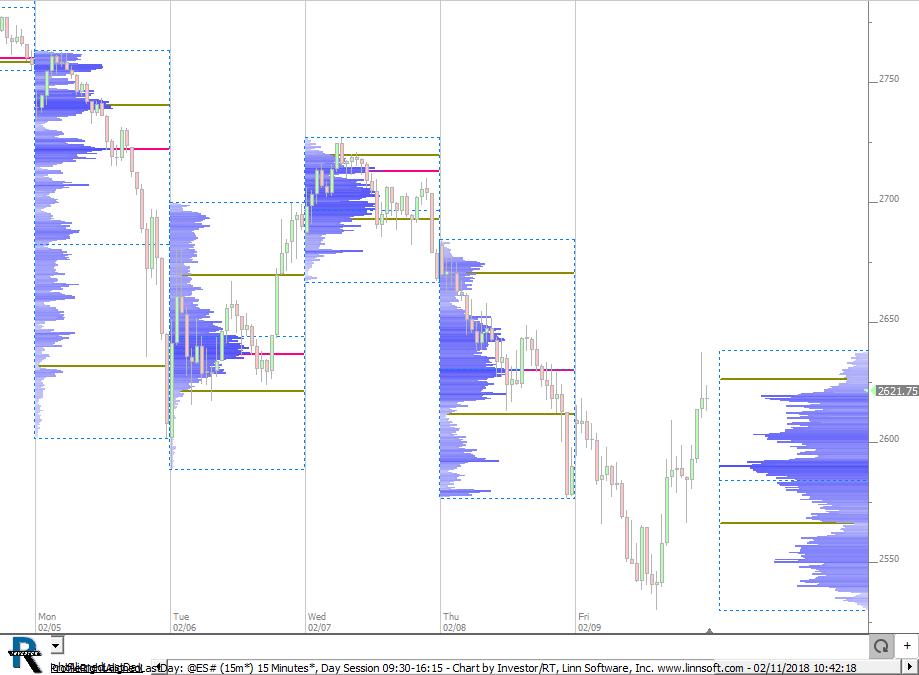 |
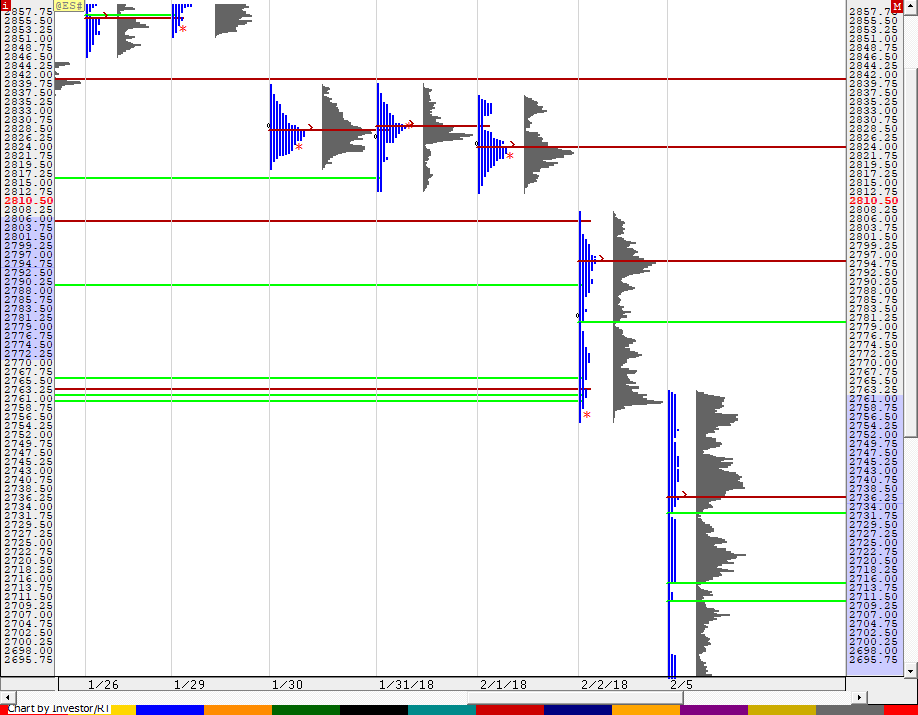
ProfileRightAlignedLastDay (@ES#) cpayne [totalcount]
8 years 5 months ago
Profile Indicator - Last Profile in margin. This chart was uploaded by Investor/RT 13.2.2 showing symbol: @ES#. |
View |
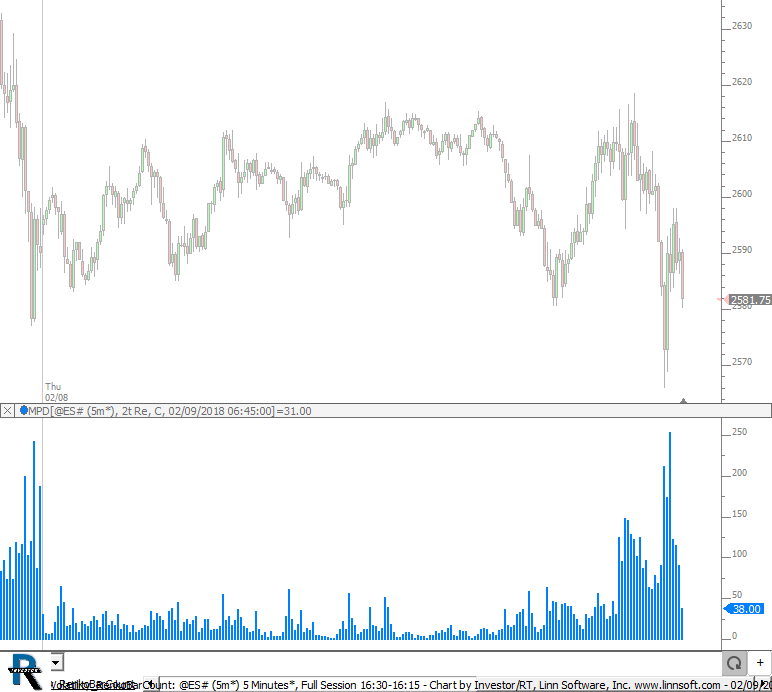 |
Volatility RenkoBarCount (@ES#) cpayne [totalcount]
8 years 5 months ago
Number of 2t Renko Bars inside each bar - measure of volatility. This chart was uploaded by Investor/RT 13.2.2 showing symbol: @ES#. |
View |
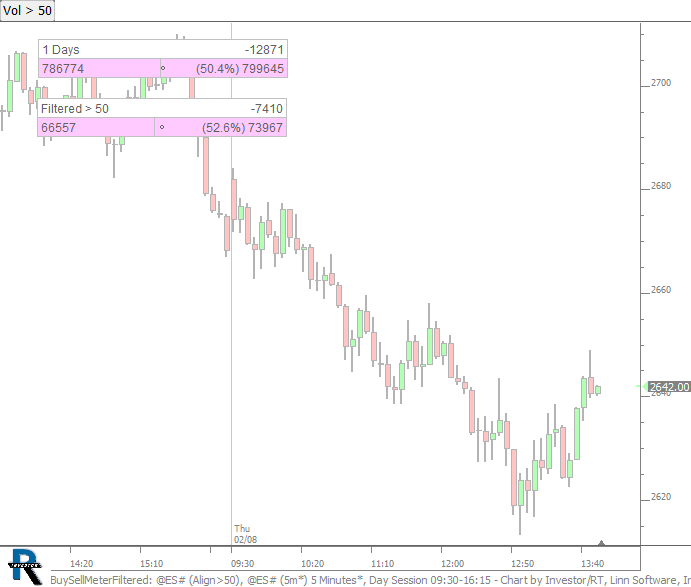 |
BuySellMeterFiltered (@ES#) cpayne [totalcount]
8 years 5 months ago
Buy Sell Meter with all volume, and filtered volume. This chart was uploaded by Investor/RT 13.2.2 showing symbol: @ES#. |
View |
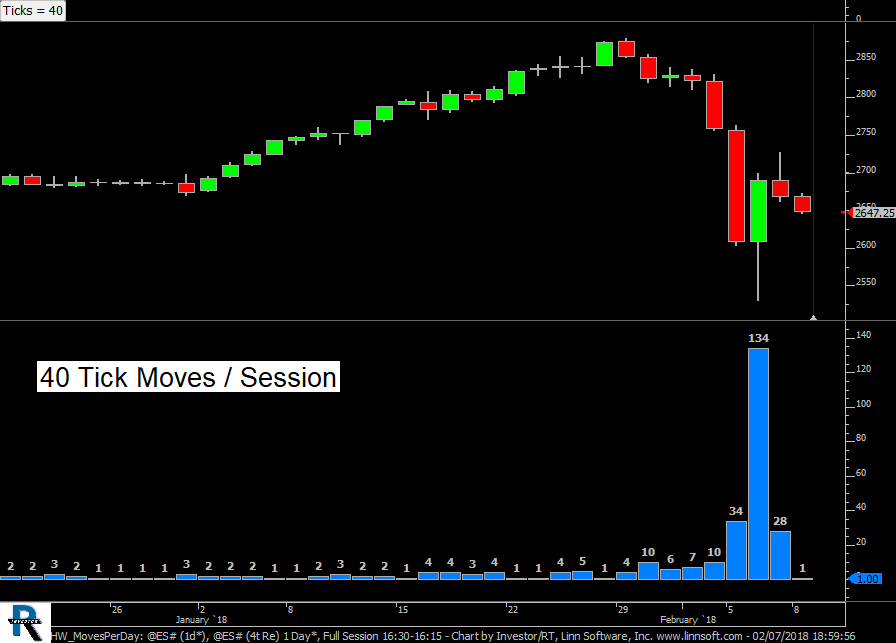 |
HW MovesPerDay (@ES#) cpayne [totalcount]
8 years 5 months ago
Chart counts the number of moves per session. Use button at top to control the number of ticks per counted move. |
View |
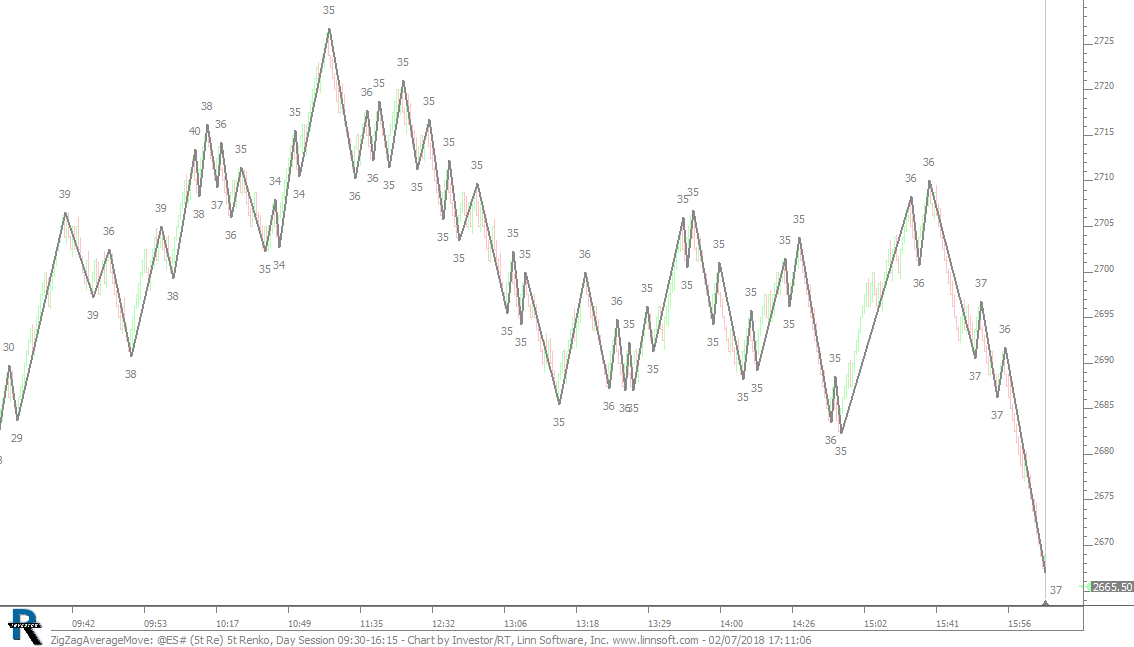 |
ZigZagAverageMove (@ES#) cpayne [totalcount]
8 years 5 months ago
Zig Zag Average Session Move. This chart was uploaded by Investor/RT 13.2.2 showing symbol: @ES#. |
View |
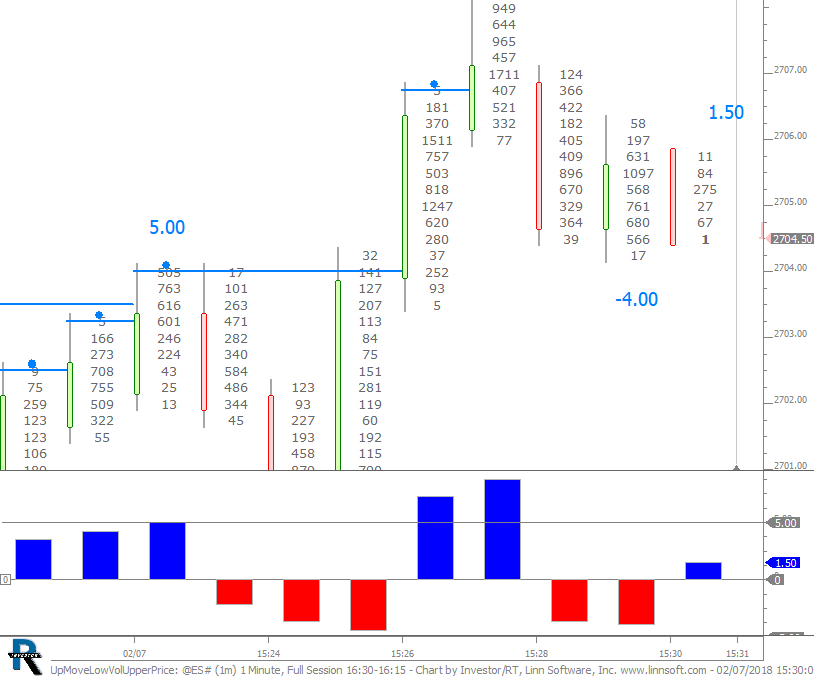 |
UpMoveLowVolUpperPrice (@ES#) cpayne [totalcount]
8 years 5 months ago
Up Move - Low Volume at Extreme Price. This chart was uploaded by Investor/RT 13.2.2 showing symbol: @ES#. |
View |
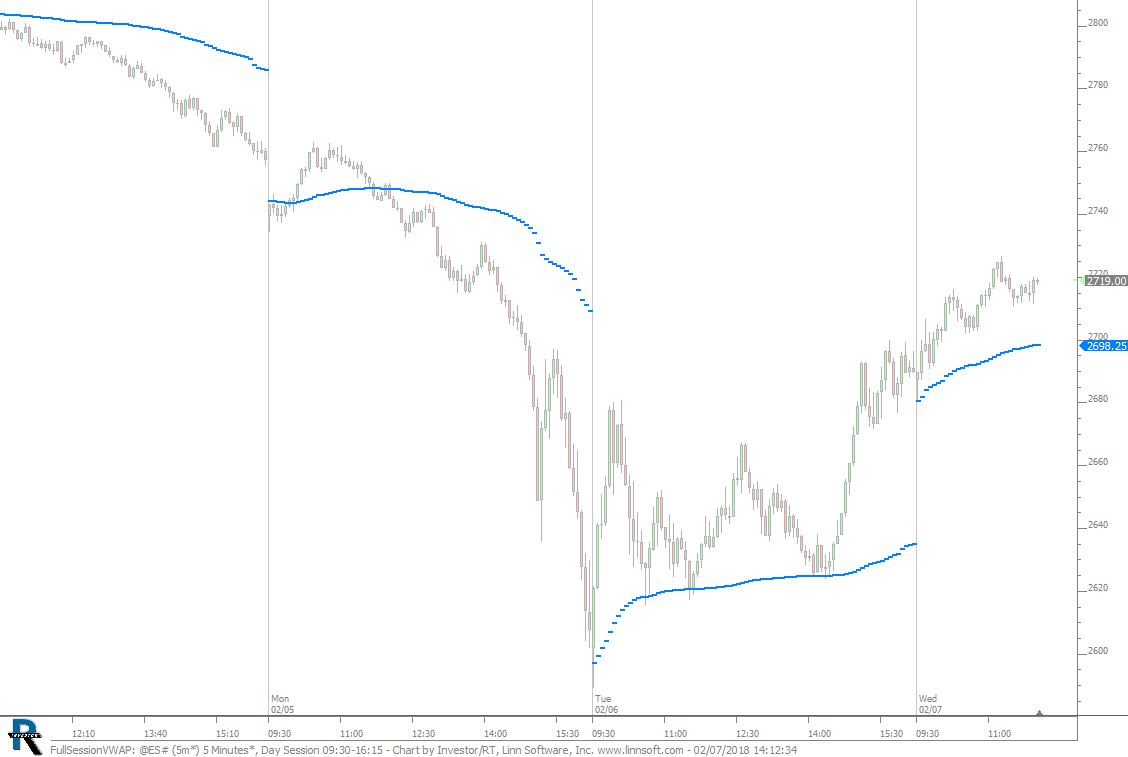 |
FullSessionVWAP (@ES#) cpayne [totalcount]
8 years 5 months ago
Full Session VWAP on Day Sessino Chart. This chart was uploaded by Investor/RT 13.2.2 showing symbol: @ES#. |
View |
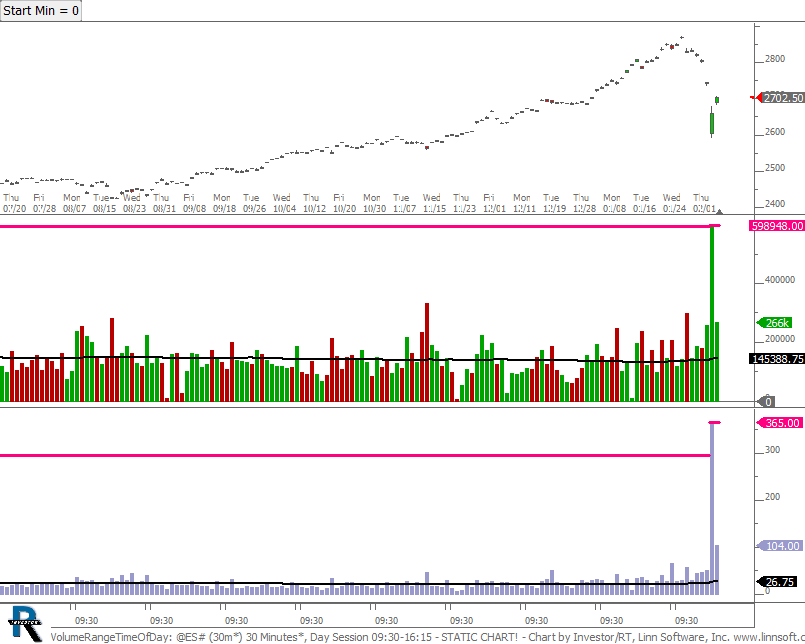 |
VolumeRangeTimeOfDay (@ES#) cpayne [totalcount]
8 years 5 months ago
Volume And Range for 30 Minute Period of Session - Use Button at Top to control offset into session. For instance, Start Min = 30 gives 30 minutes into session to 60 minutes into session. |
View |
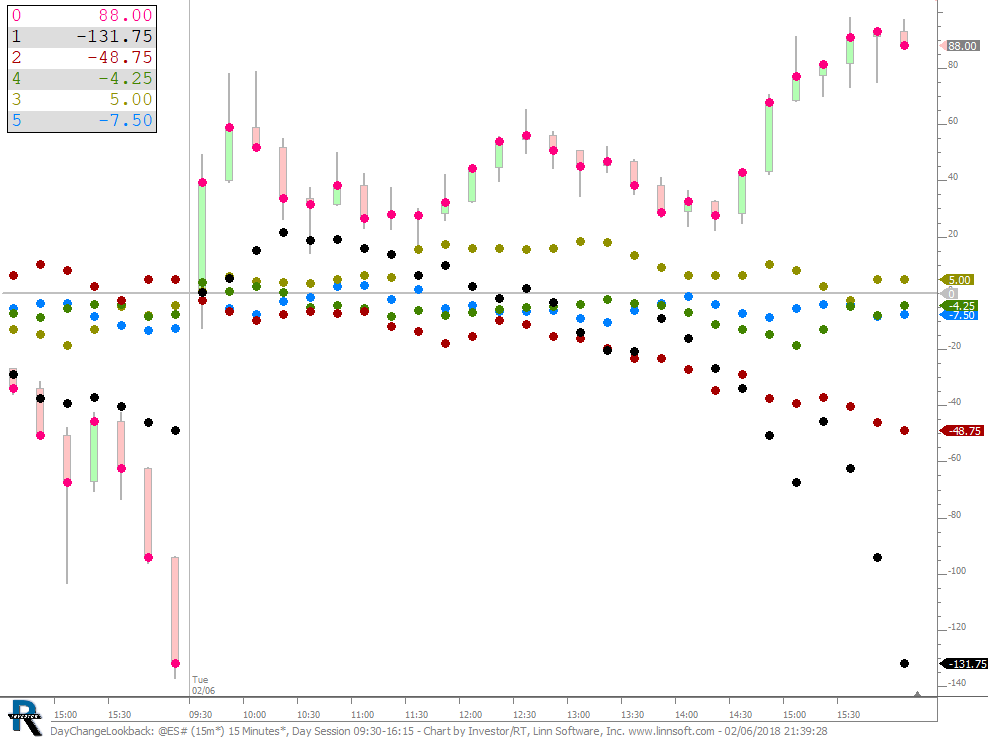 |
DayChangeLookback (@ES#) cpayne [totalcount]
8 years 5 months ago
Day Change Chart eliminates overnight move and compares moves from session open. |
View |
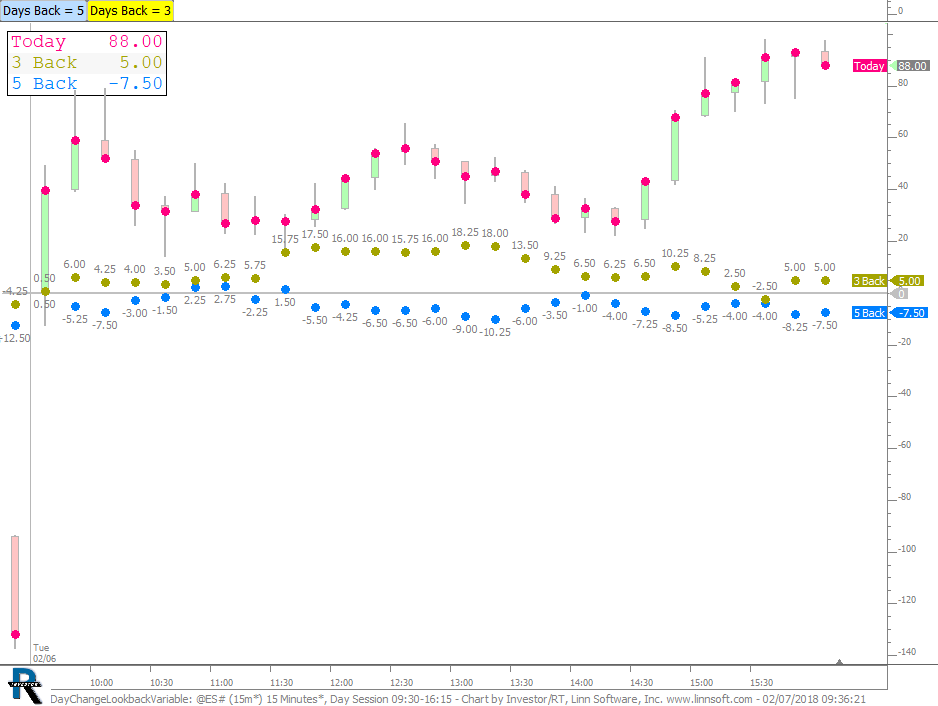 |
DayChangeLookbackVariable (@ES#) cpayne [totalcount]
8 years 5 months ago
Day Change Lookback - Compare today's Day Change price movement from open with that of any past days. Use the buttons at top to control the number of days back (2 overlays). |
View |
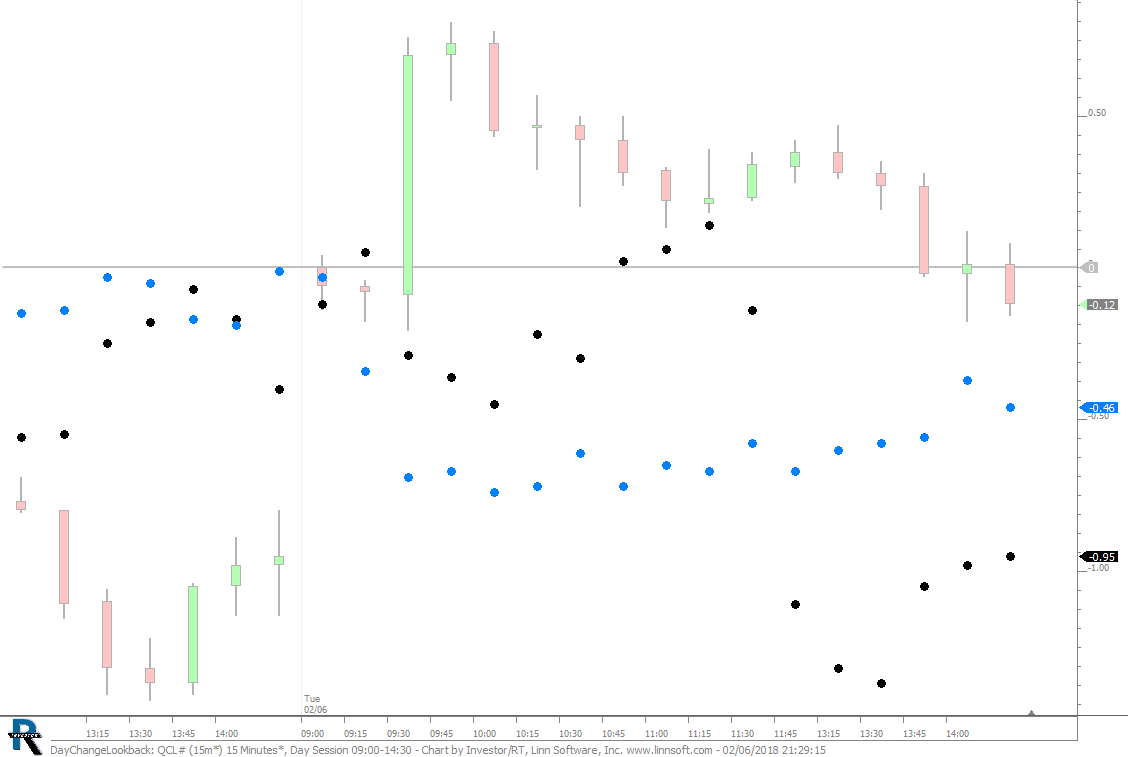 |
DayChangeLookback (QCL#) cpayne [totalcount]
8 years 5 months ago
Day Change Lookback - Black = Yesterday. Blue = Last Week. This chart was uploaded by Investor/RT 13.2.2 showing symbol: QCL#. |
View |
 |
ES RTH MANT (@ES#) cpayne [totalcount]
8 years 5 months ago
ES Day Session TPO Profile Chart. This chart was uploaded by Investor/RT 13.2.2 showing symbol: @ES#. |
View |
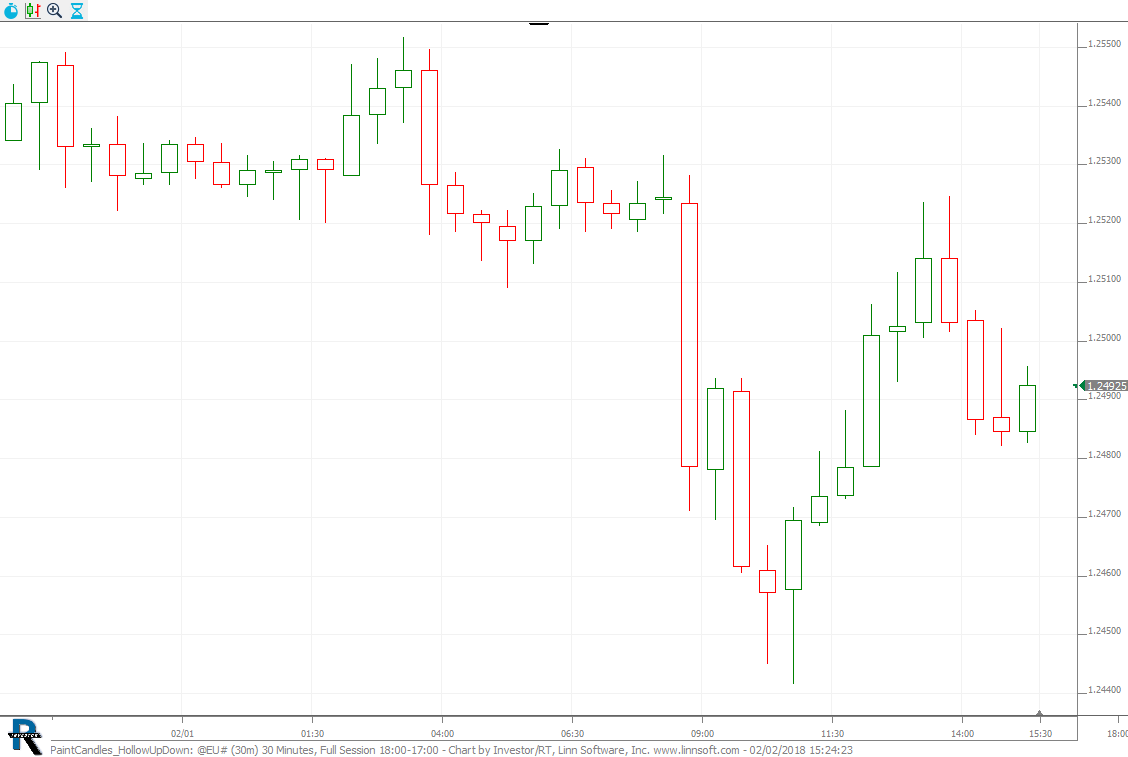 |
PaintCandles HollowUpDown (@EU#) cpayne [totalcount]
8 years 5 months ago
Paint Candles - Hollow Up and Down Candles. This chart was uploaded by Investor/RT 13.2.2 showing symbol: @EU#. |
View |
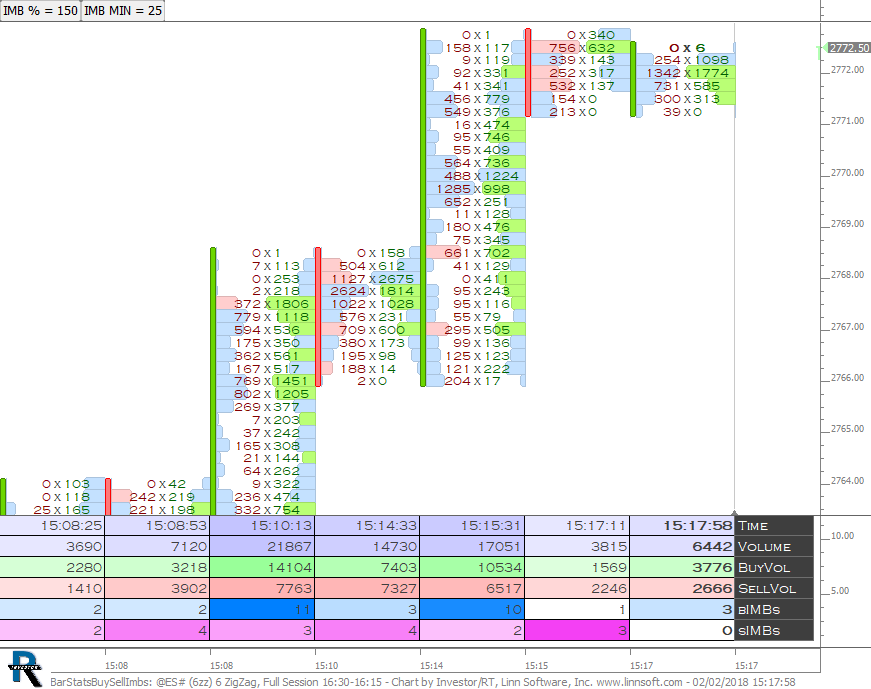 |
BarStatsBuySellImbs (@ES#) cpayne [totalcount]
8 years 5 months ago
Buy and Sell Volume Imbalance Counts as Text in Bar Statistics. This chart was uploaded by Investor/RT 13.2.1 showing symbol: @ES#. |
View |
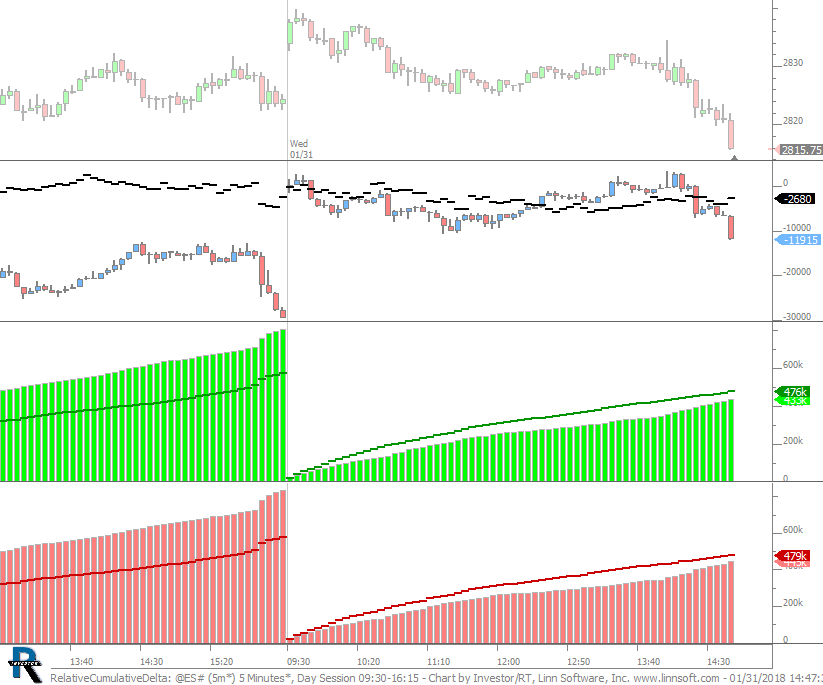 |
RelativeCumulativeDelta (@ES#) cpayne [totalcount]
8 years 5 months ago
Relative Cumulative Delta. This chart was uploaded by Investor/RT 13.2.1 showing symbol: @ES#. |
View |
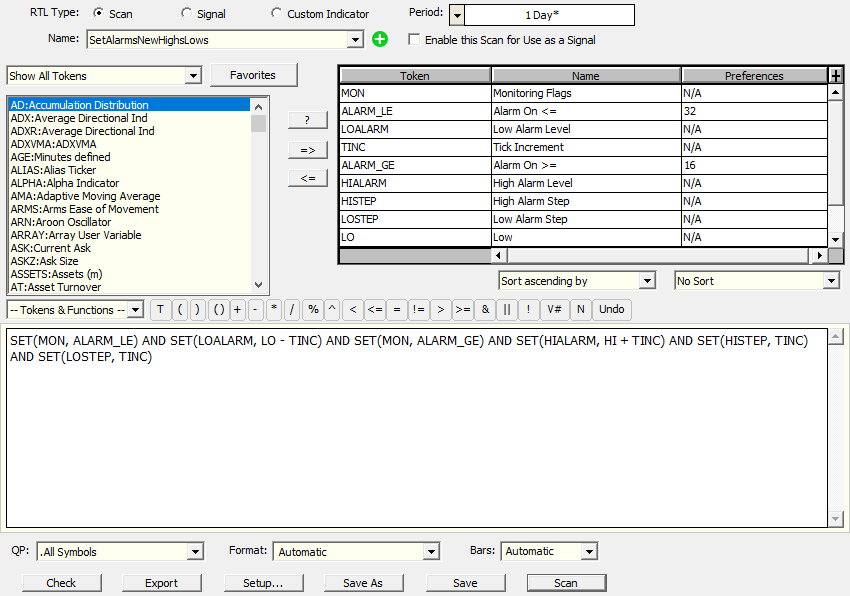 |
SetAlarmsNewHighsLows cpayne [totalcount]
8 years 5 months ago
Scan turns alarms on for new high and low of day. This chart was uploaded by Investor/RT 13.2.1. |
View |
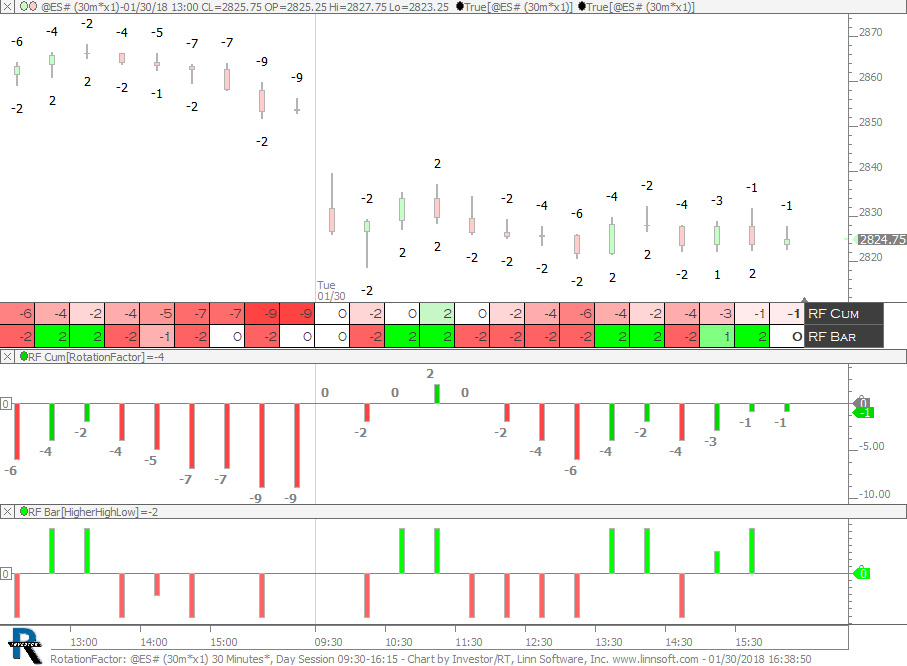 |
RotationFactor (@ES#) cpayne [totalcount]
8 years 5 months ago
Rotation Factor as Text - Per Bar and Cumulative for Session. This chart was uploaded by Investor/RT 13.2.2 showing symbol: @ES#. |
View |
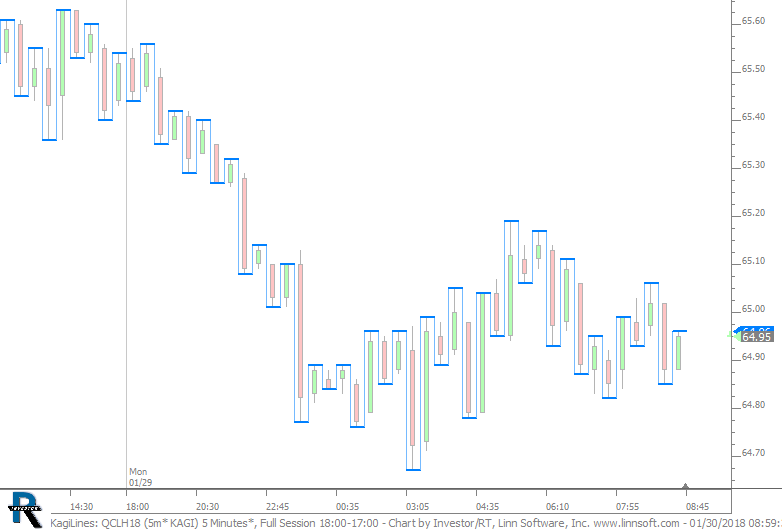 |
KagiLines (QCLH18) cpayne [totalcount]
8 years 5 months ago
Kagi Lines. This chart was uploaded by Investor/RT 13.2.1 showing symbol: QCLH18. |
View |
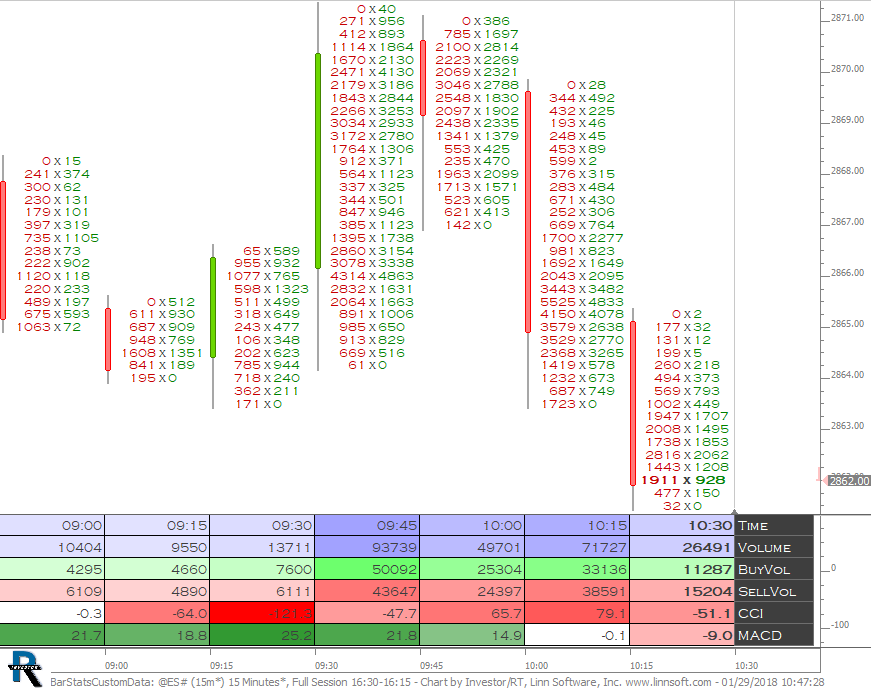 |
BarStatsCustomData (@ES#) cpayne [totalcount]
8 years 5 months ago
Bar Statistics with Custom Data. This chart was uploaded by Investor/RT 13.2.1 showing symbol: @ES#. |
View |
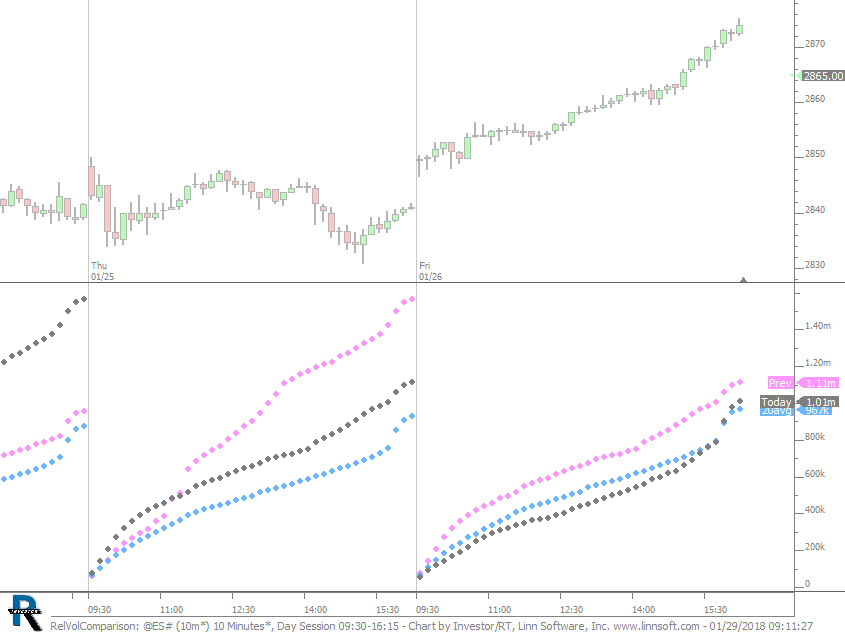 |
RelVolComparison (@ES#) cpayne [totalcount]
8 years 5 months ago
Compares todays cumulative volume with previous day and 20 day average. This chart was uploaded by Investor/RT 13.2.1 showing symbol: @ES#. |
View |
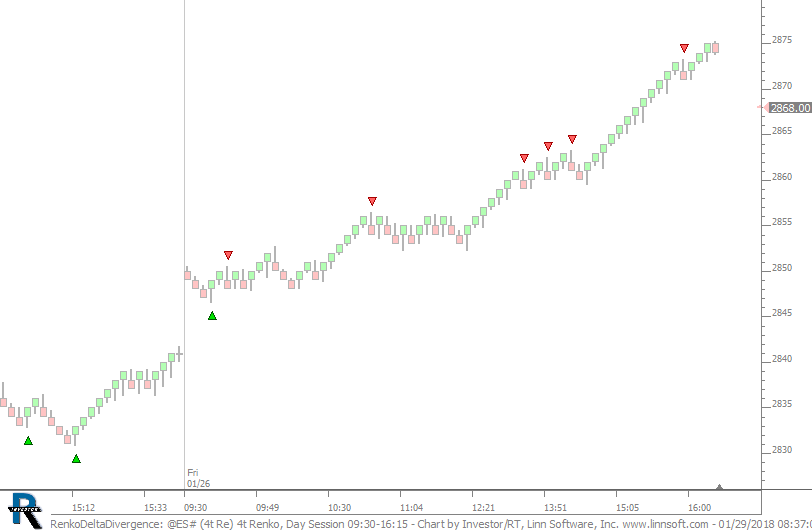 |
RenkoDeltaDivergence (@ES#) cpayne [totalcount]
8 years 5 months ago
Divergence. Positive Delta on Lows. Negative Delta on Highs. This chart was uploaded by Investor/RT 13.1.5 showing symbol: @ES#. |
View |
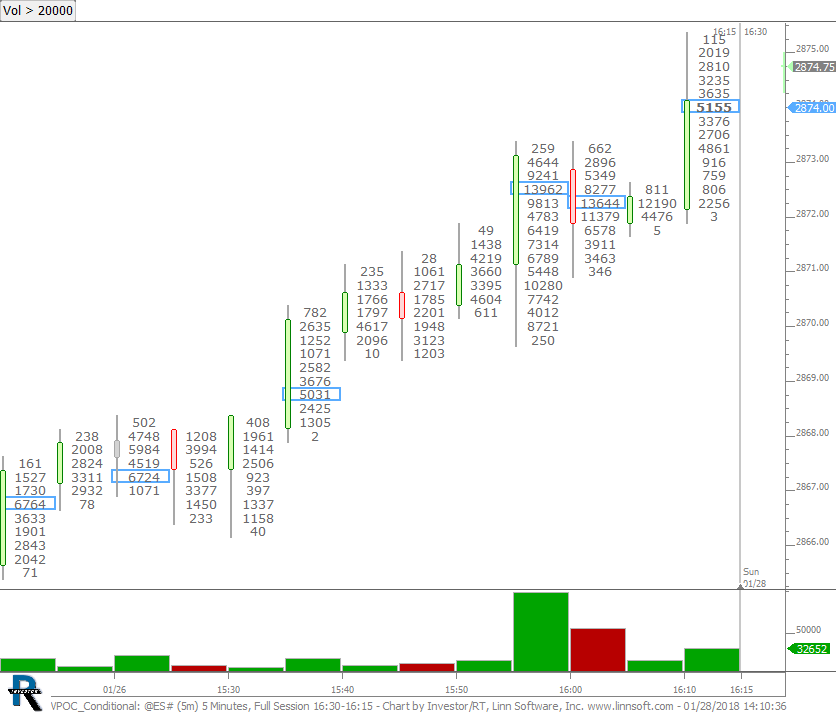 |
VPOC Conditional (@ES#) cpayne [totalcount]
8 years 5 months ago
VPOC highlighted conditionally on volume. This chart was uploaded by Investor/RT 13.2.1 showing symbol: @ES#. |
View |
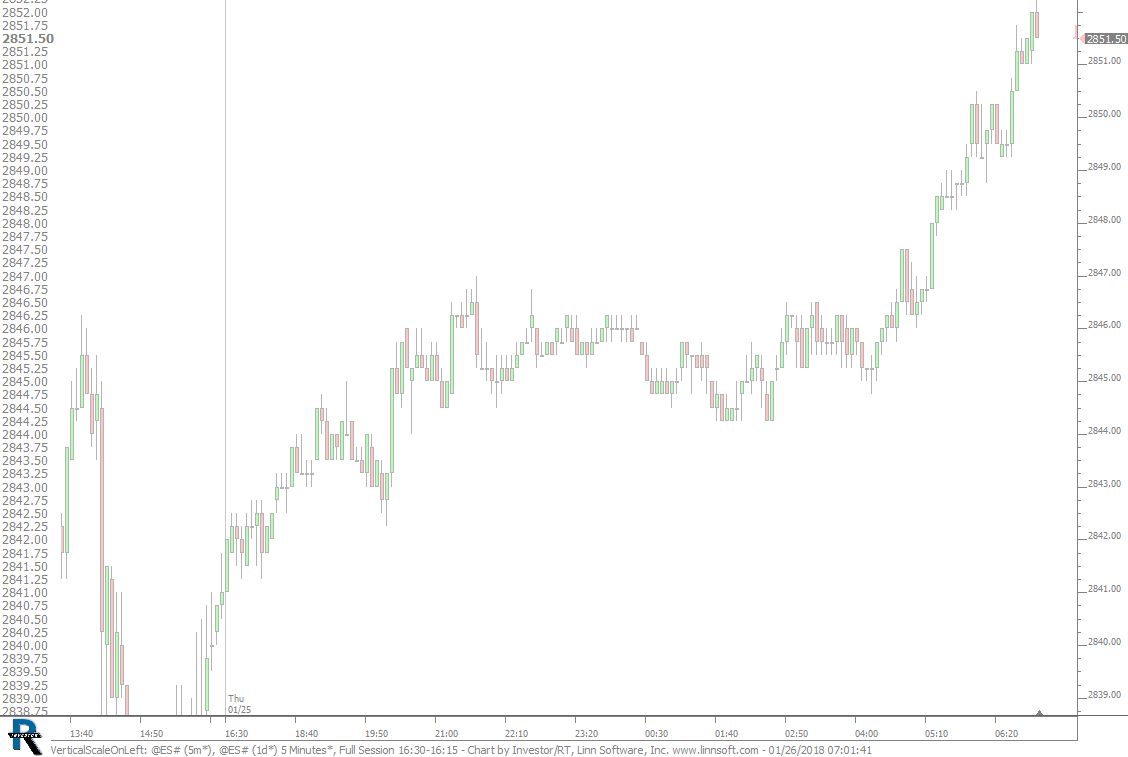 |
VerticalScaleOnLeft (@ES#) cpayne [totalcount]
8 years 5 months ago
Vertical Scale On Left. This chart was uploaded by Investor/RT 13.1.5 showing symbol: @ES#. |
View |
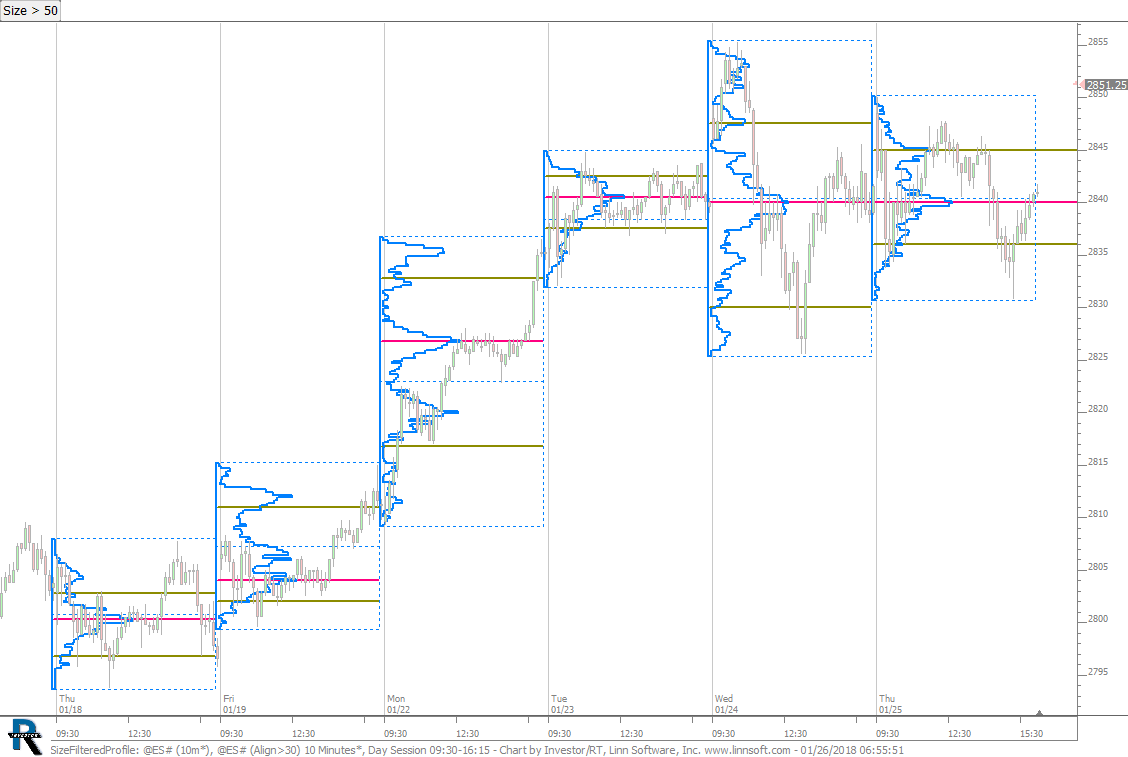 |
SizeFilteredProfile (@ES#) cpayne [totalcount]
8 years 5 months ago
Size Filtered Profiles. This chart was uploaded by Investor/RT 13.1.5 showing symbol: @ES#. |
View |