 |
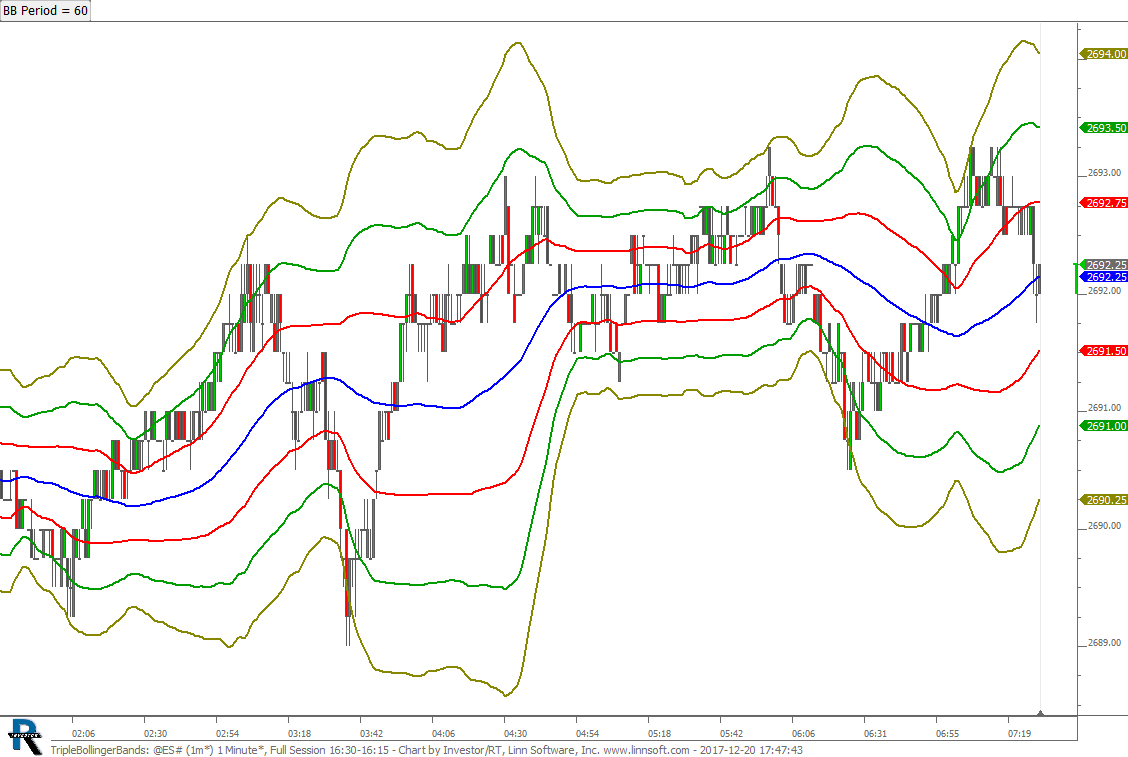
TripleBollingerBands (@ES#) cpayne [totalcount]
8 years 6 months ago
Triple Bollinger Bands. This chart was uploaded by Investor/RT 13.1.4 showing symbol: @ES#. |
View |
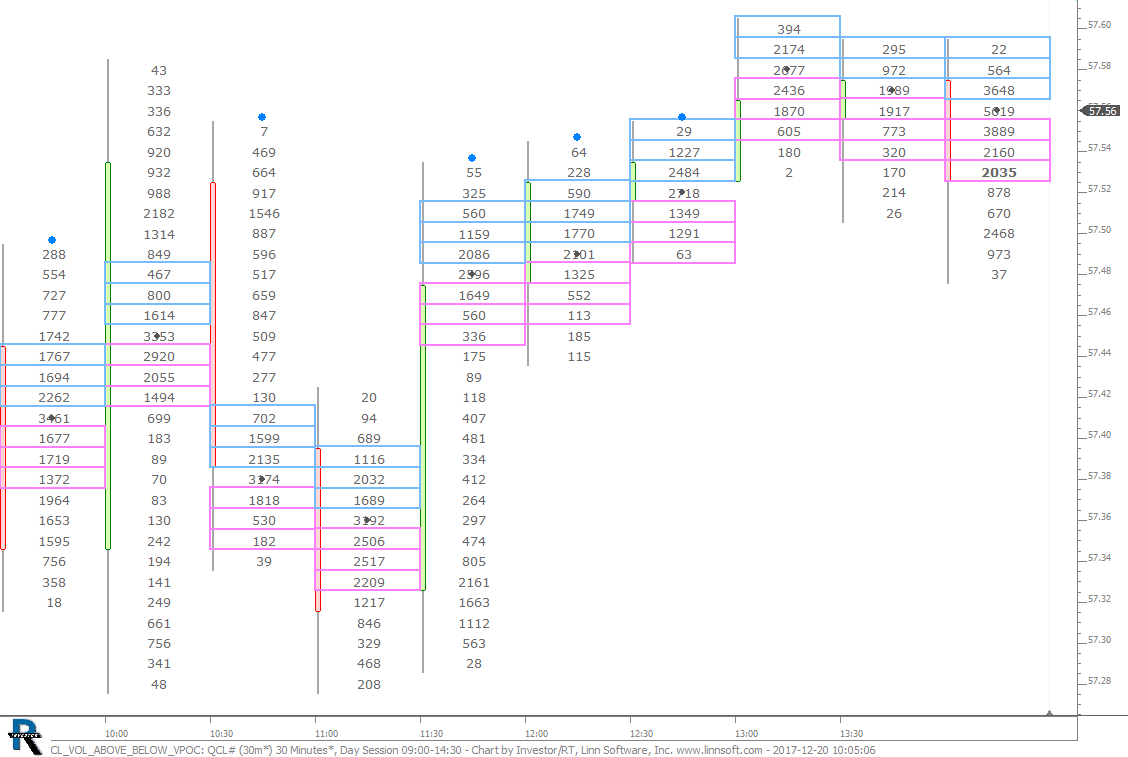 |
CL VOL ABOVE BELOW VPOC (QCL#) cpayne [totalcount]
8 years 6 months ago
This chart was uploaded by Investor/RT 13.1.4 showing symbol: QCL#. |
View |
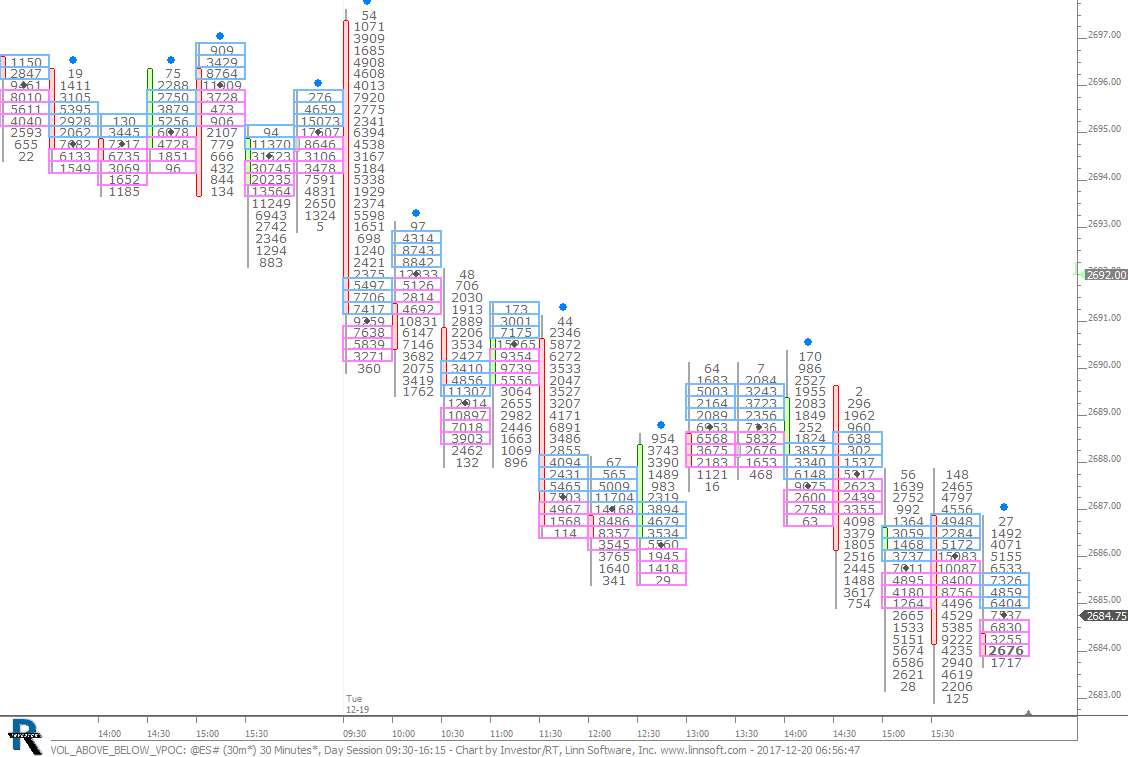 |
VOL ABOVE BELOW VPOC (@ES#) cpayne [totalcount]
8 years 6 months ago
Volume 3 Prices Above and Below VPOC. This chart was uploaded by Investor/RT 13.1.4 showing symbol: @ES#. |
View |
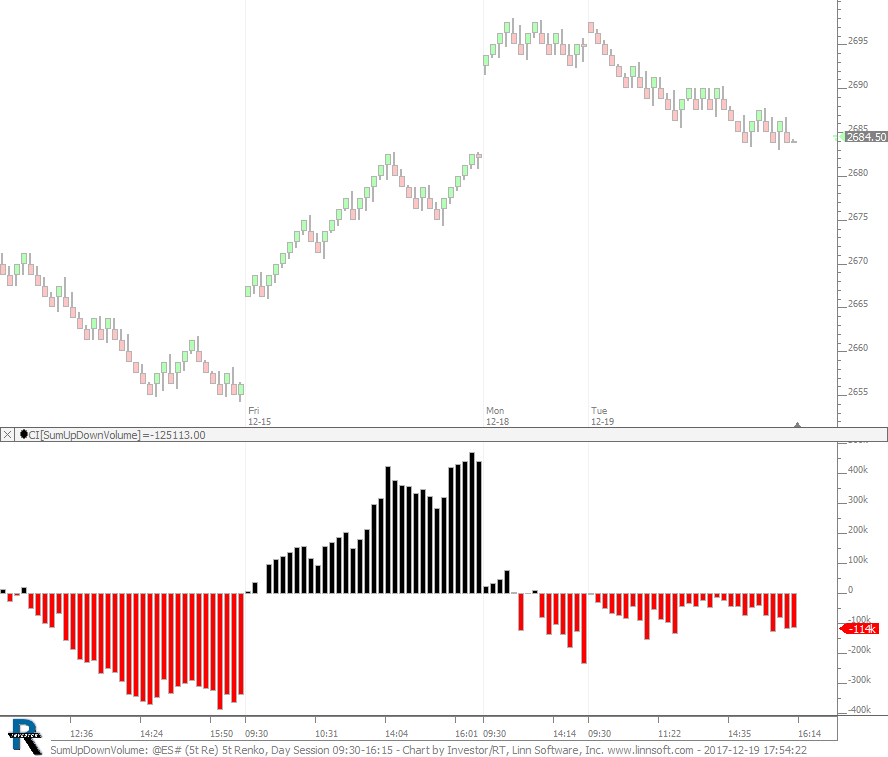 |
SumUpDownVolume (@ES#) cpayne [totalcount]
8 years 6 months ago
Sum Up Down Volume for Session. This chart was uploaded by Investor/RT 13.1.4 showing symbol: @ES#. |
View |
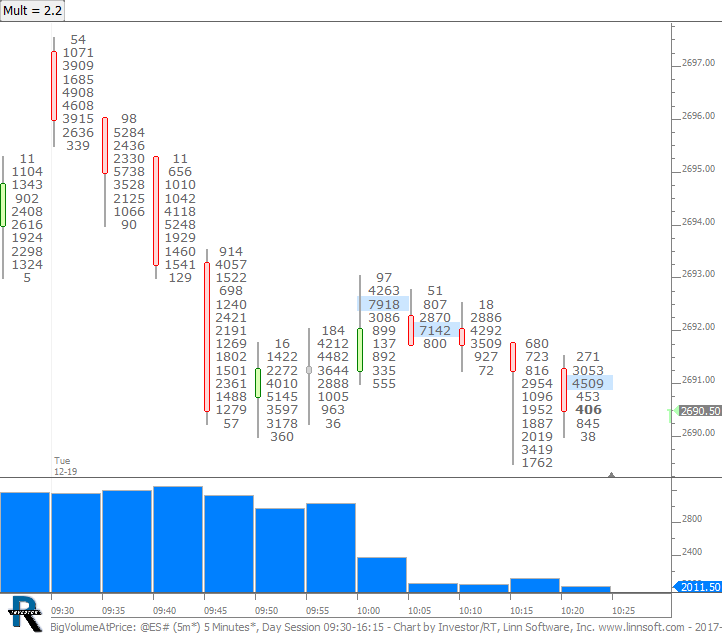 |
BigVolumeAtPrice (@ES#) cpayne [totalcount]
8 years 6 months ago
Chart identifies large volume at price relative to average volume at price of previous 9 bars. Use button to control multiplier. |
View |
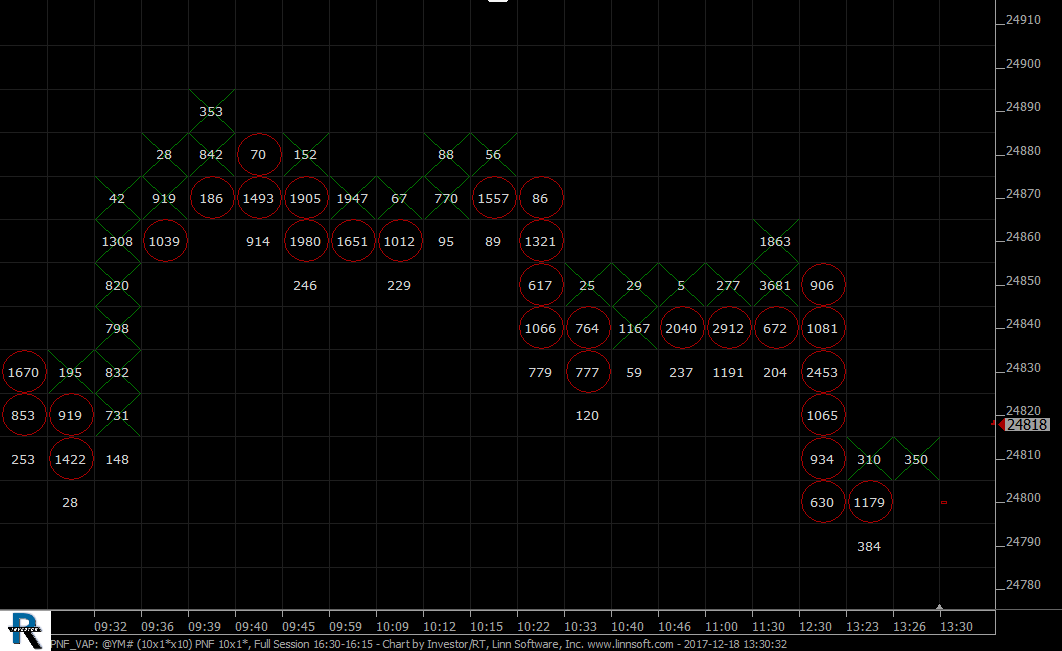 |
PNF VAP (@YM#) cpayne [totalcount]
8 years 7 months ago
Point and Figure with Volume at Price. This chart was uploaded by Investor/RT 13.1.4 showing symbol: @YM#. |
View |
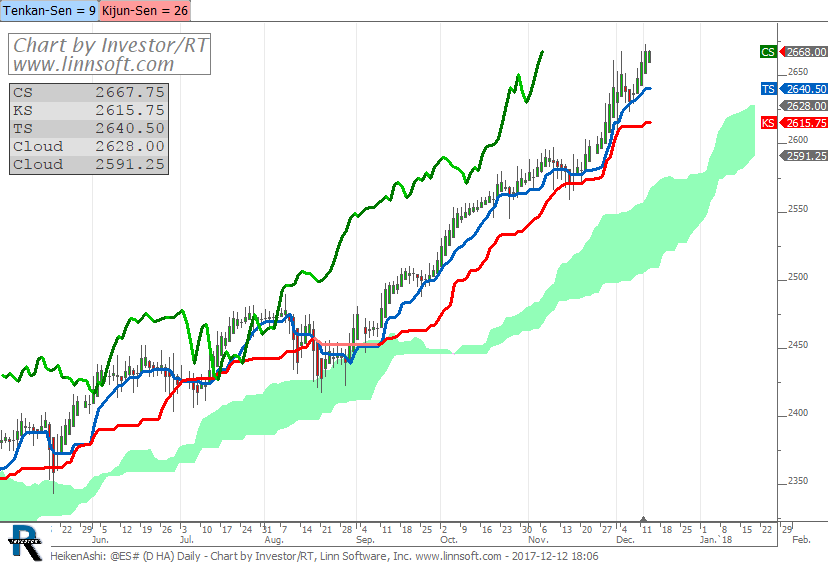 |
HeikenAshi (@ES#) cpayne [totalcount]
8 years 7 months ago
Heiken-Ashi with Ichimoku Kinko Hyo. This chart was uploaded by Investor/RT 13.1.1 showing symbol: @ES#. |
View |
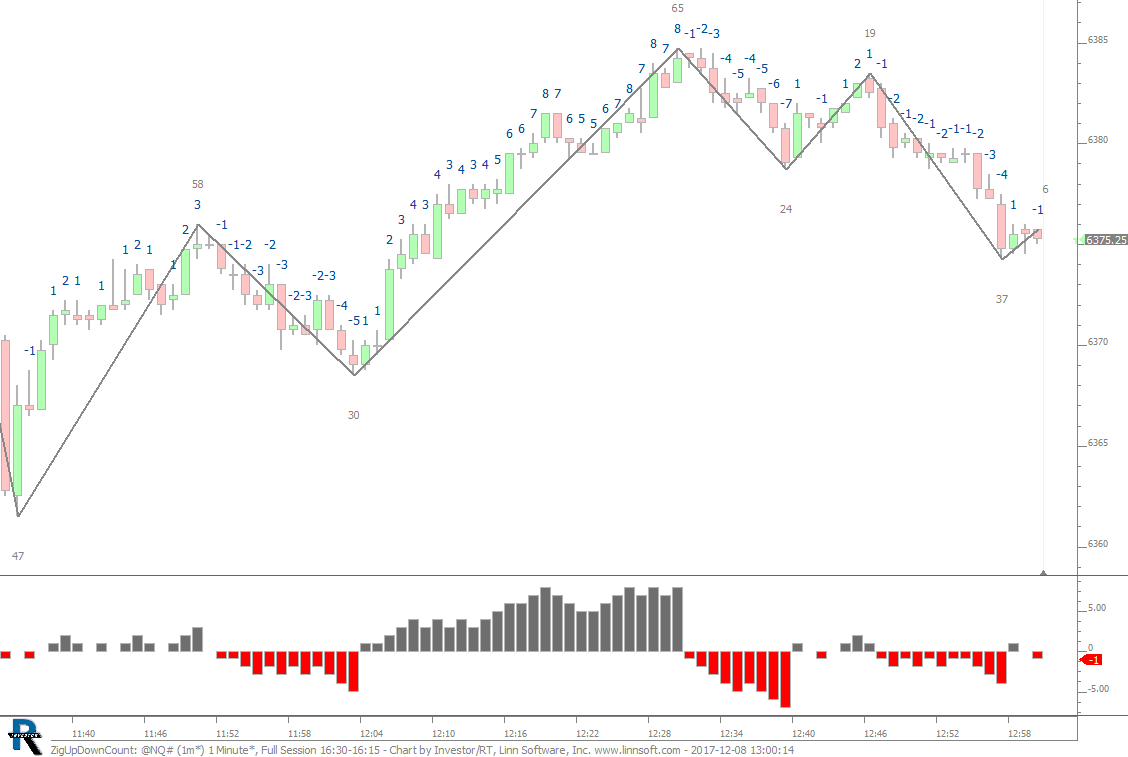 |
ZigUpDownCount (@NQ#) cpayne [totalcount]
8 years 7 months ago
Counting Cumulative Up and Down Bars In Each Move. This chart was uploaded by Investor/RT 13.1.1 showing symbol: @NQ#. |
View |
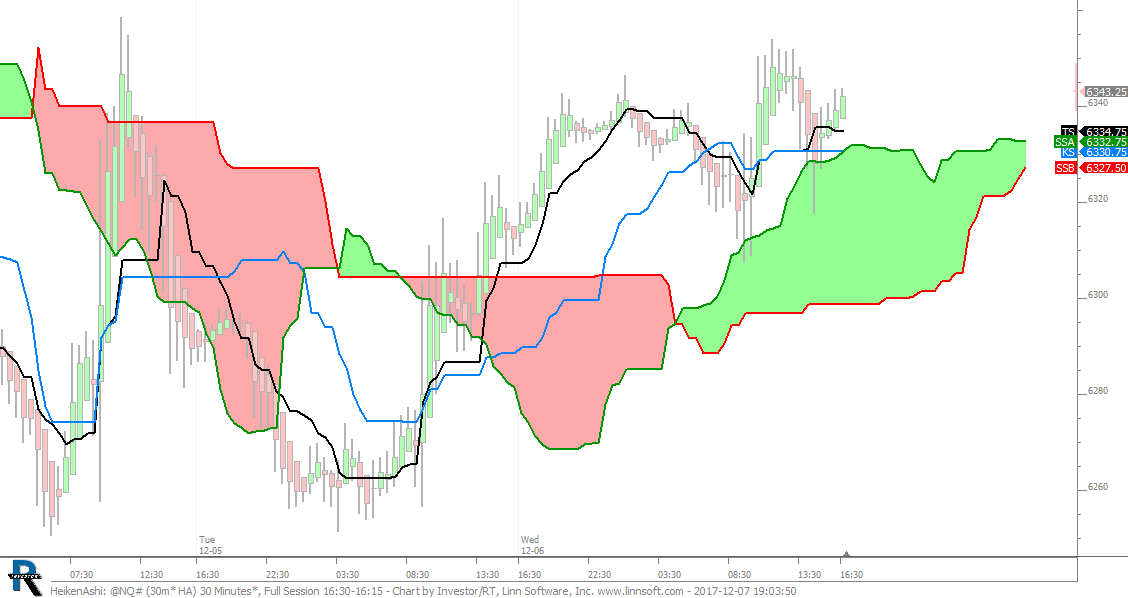 |
HeikenAshi (@NQ#) cpayne [totalcount]
8 years 7 months ago
Heiken-Ashi with Ichimoku Kinko Hyo. This chart was uploaded by Investor/RT 13.1.1 showing symbol: @NQ#. |
View |
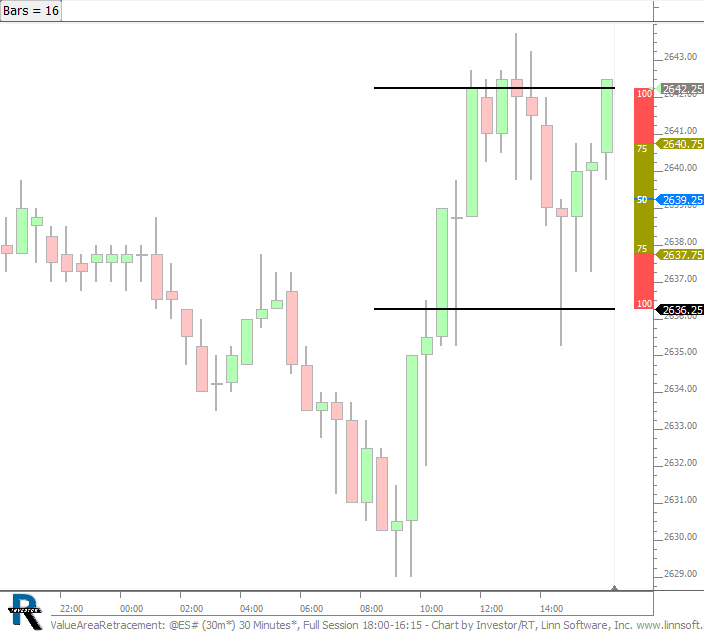 |
ValueAreaRetracement (@ES#) cpayne [totalcount]
8 years 7 months ago
Value Area Retracement. This chart was uploaded by Investor/RT 13.1.1 showing symbol: @ES#. |
View |
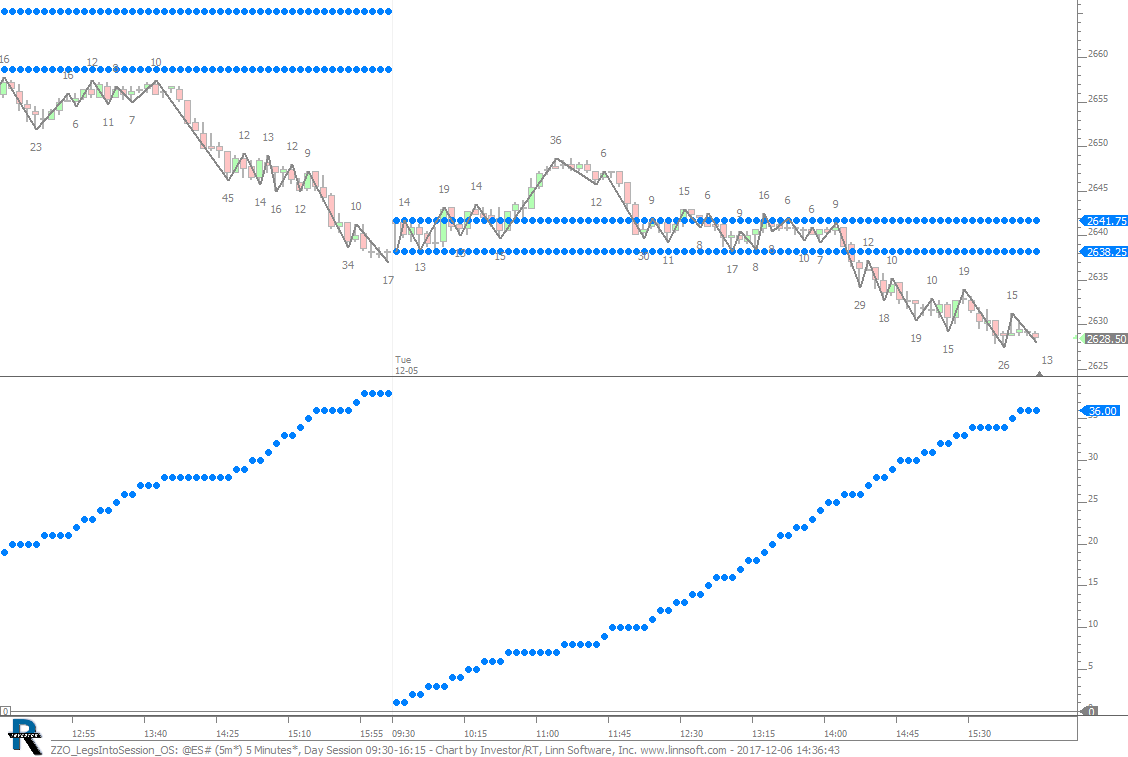 |
ZZO LegsIntoSession OS (@ES#) cpayne [totalcount]
8 years 7 months ago
ZZO Legs Into Session with Opening Swing. This chart was uploaded by Investor/RT 13.1.1 showing symbol: @ES#. |
View |
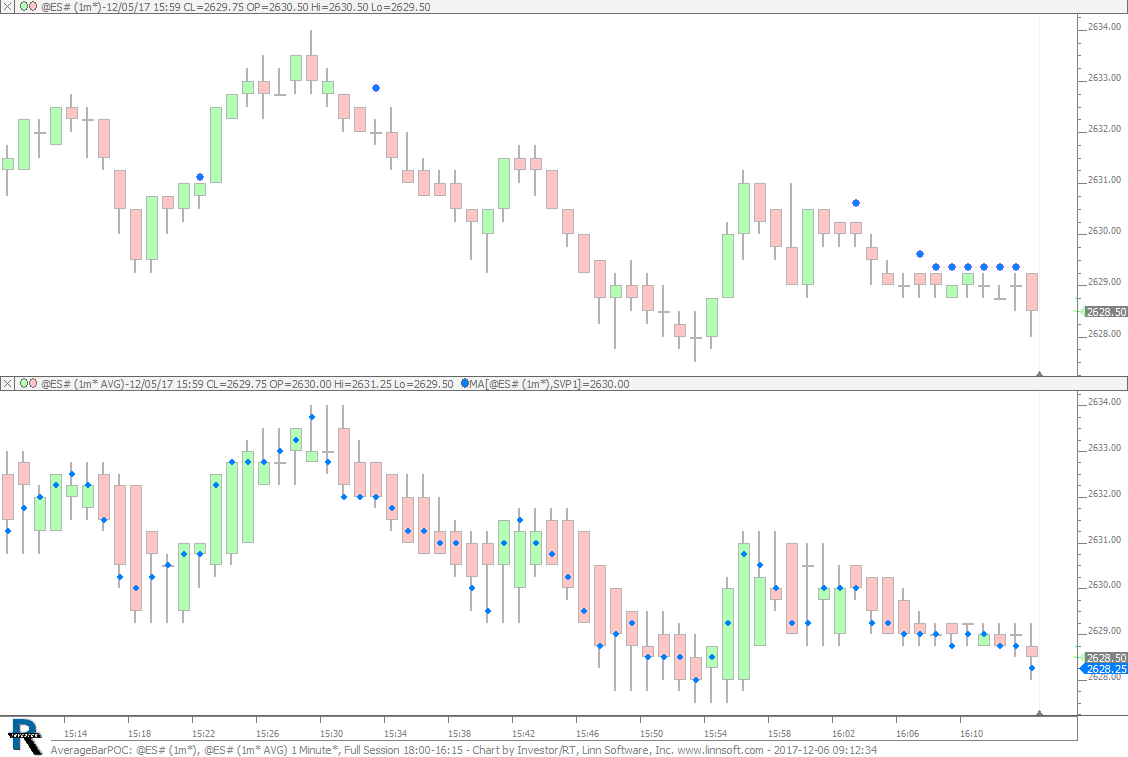 |
AverageBarPOC (@ES#) cpayne [totalcount]
8 years 7 months ago
Average Bars and POC. This chart was uploaded by Investor/RT 13.1.1 showing symbol: @ES#. |
View |
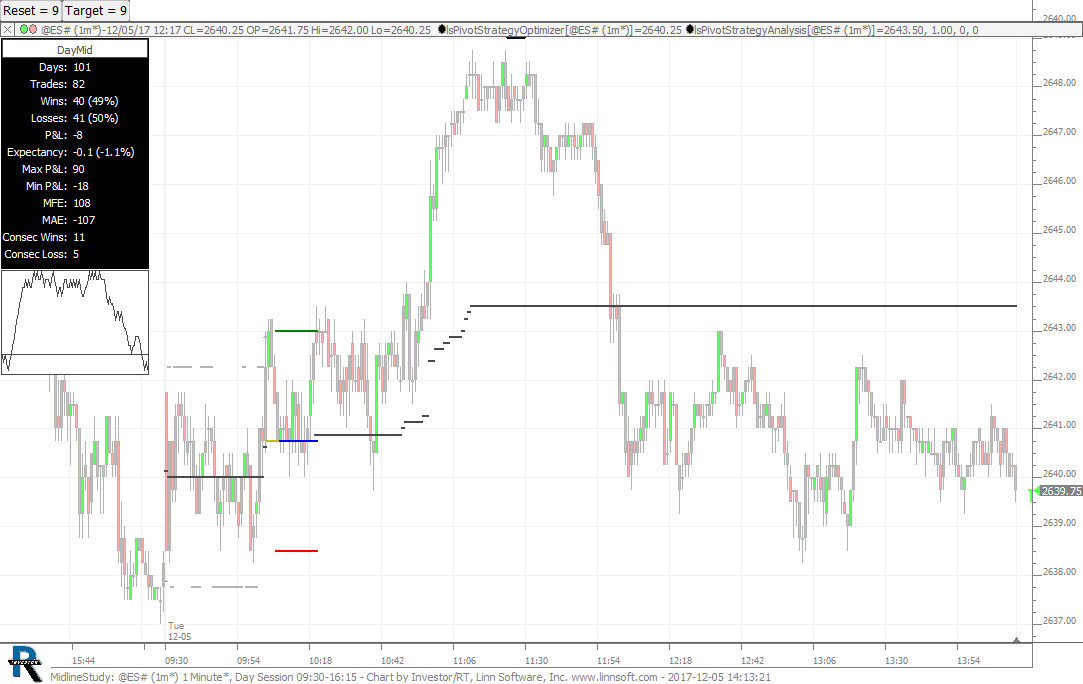 |
MidlineStudy (@ES#) cpayne [totalcount]
8 years 7 months ago
Mid Line Study chart used in Homework 26. This chart was uploaded by Investor/RT 13.1.1 showing symbol: @ES#. |
View |
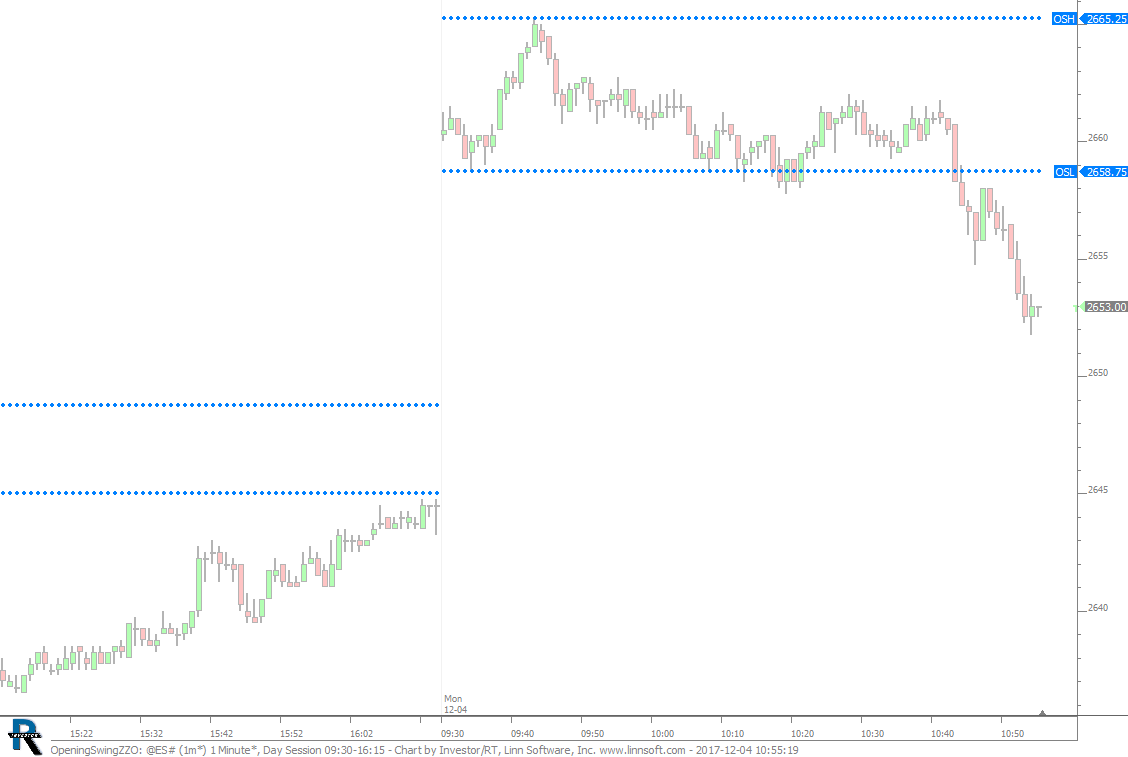 |
OpeningSwingZZO (@ES#) cpayne [totalcount]
8 years 7 months ago
Open Swing High and Low Automated. This chart was uploaded by Investor/RT 13.1.1 showing symbol: @ES#. |
View |
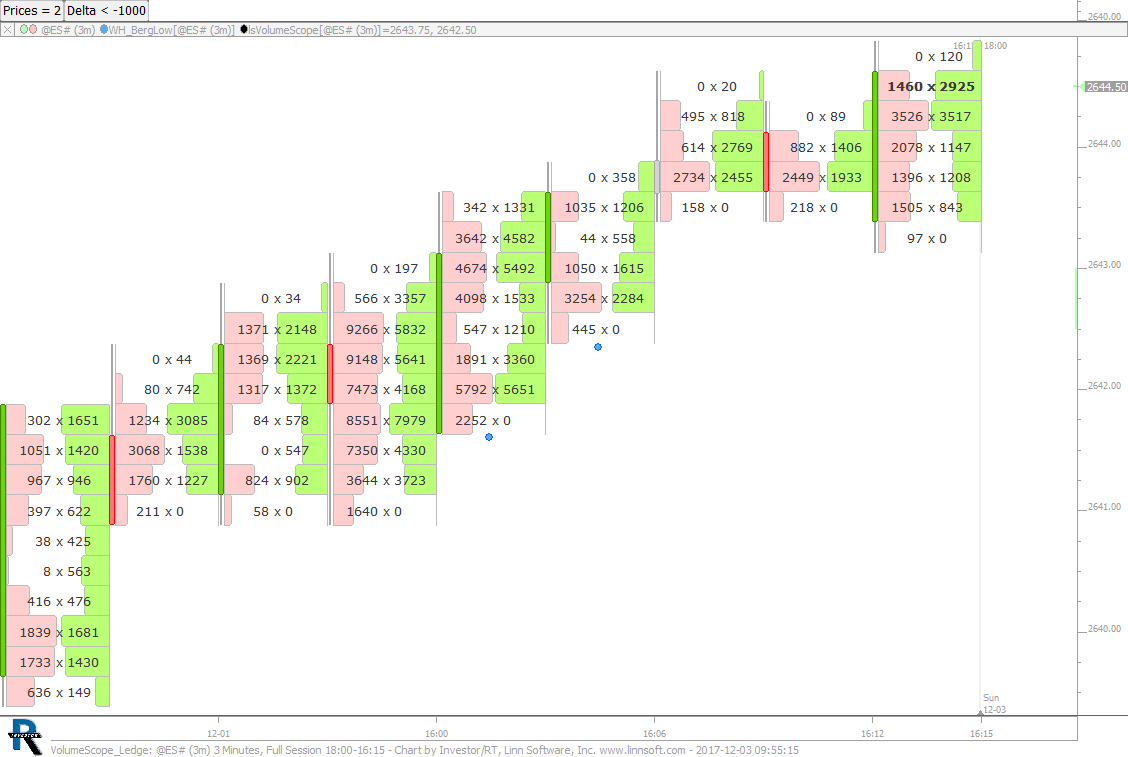 |
VolumeScope Ledge (@ES#) cpayne [totalcount]
8 years 7 months ago
This chart was uploaded by Investor/RT 13.1.1 showing symbol: @ES#. |
View |
 |
HolidayTree (@ES#) cpayne [totalcount]
8 years 7 months ago
Holiday Tree 2017. This chart was uploaded by Investor/RT 13.1.1 showing symbol: @ES#. |
View |
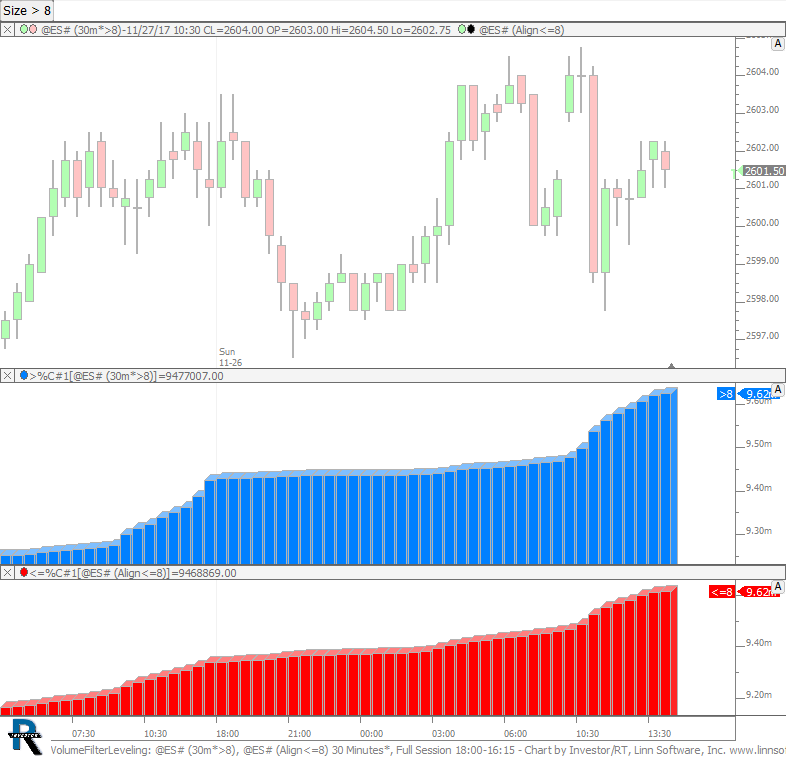 |
VolumeFilterLeveling (@ES#) cpayne [totalcount]
8 years 7 months ago
Volume Size Selection for Equal Distribution of Volume. This chart was uploaded by Investor/RT 13.1.1 showing symbol: @ES#. |
View |
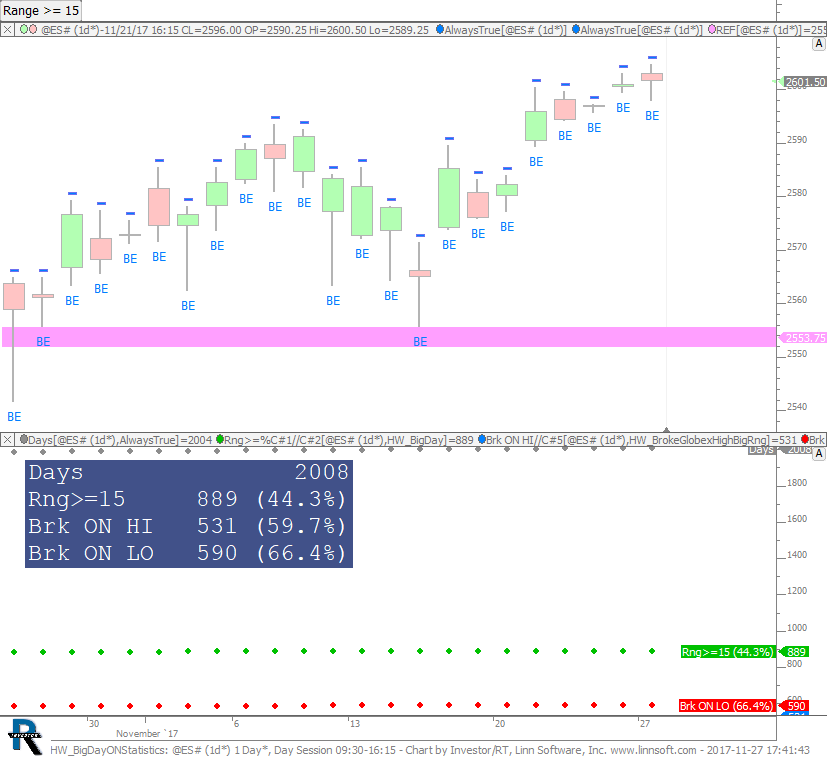 |
HW BigDayONStatistics (@ES#) cpayne [totalcount]
8 years 7 months ago
Big Range Days, and What Percent Brk Overnight High and Low. This chart was uploaded by Investor/RT 13.1.1 showing symbol: @ES#. |
View |
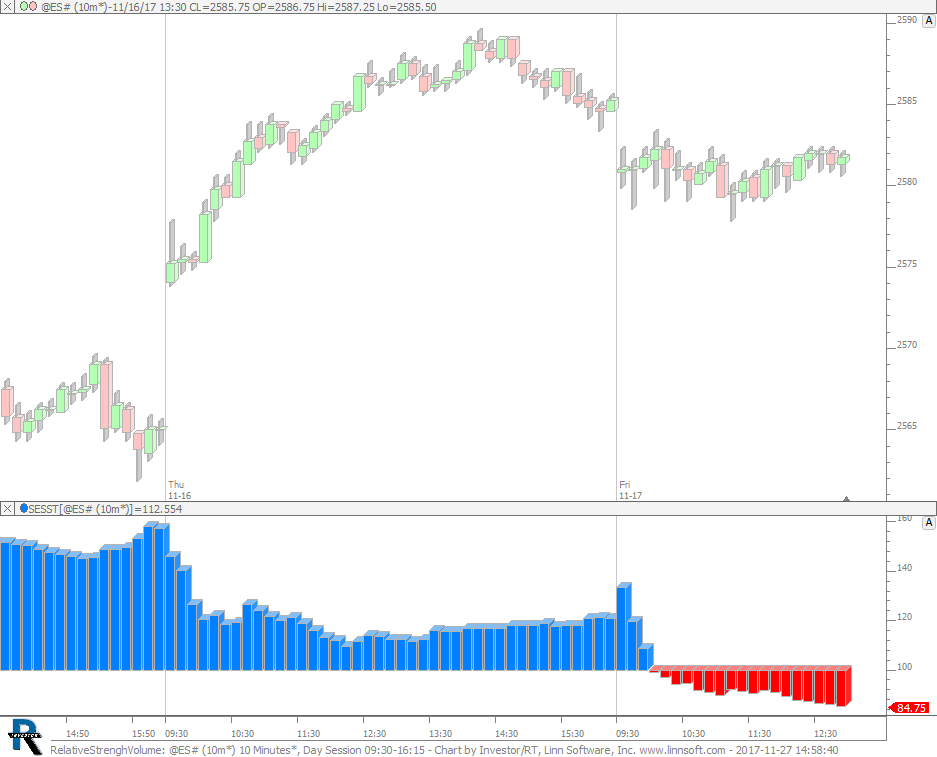 |
RelativeStrenghVolume (@ES#) cpayne [totalcount]
8 years 7 months ago
Relative Strengh - Volume. This chart was uploaded by Investor/RT 13.1.1 showing symbol: @ES#. |
View |
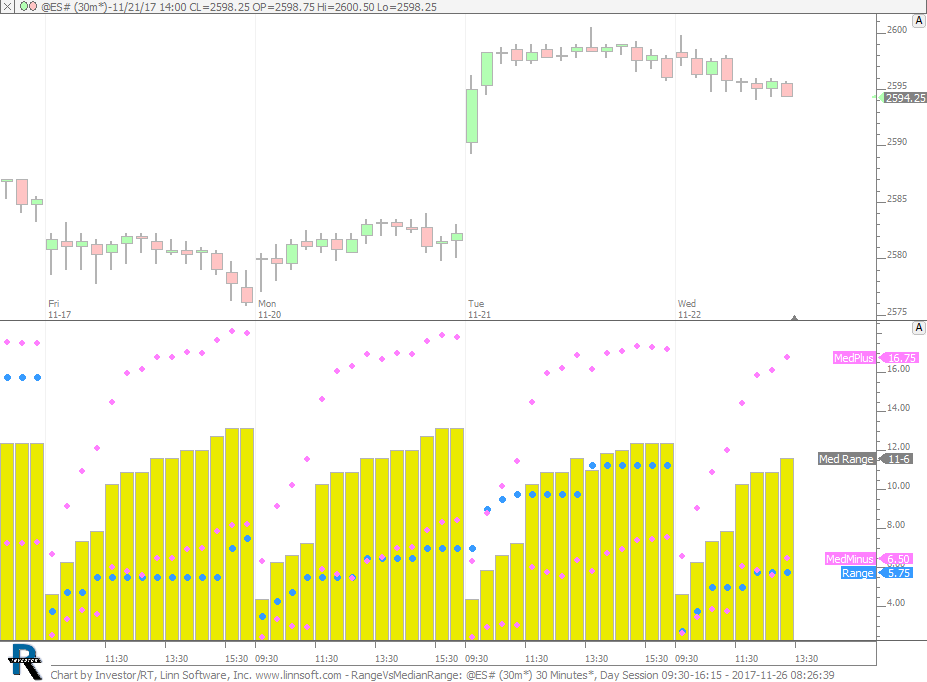 |
RangeVsMedianRange (@ES#) cpayne [totalcount]
8 years 7 months ago
Range Vs Median Range. This chart was uploaded by Investor/RT 13.1.1 showing symbol: @ES#. |
View |
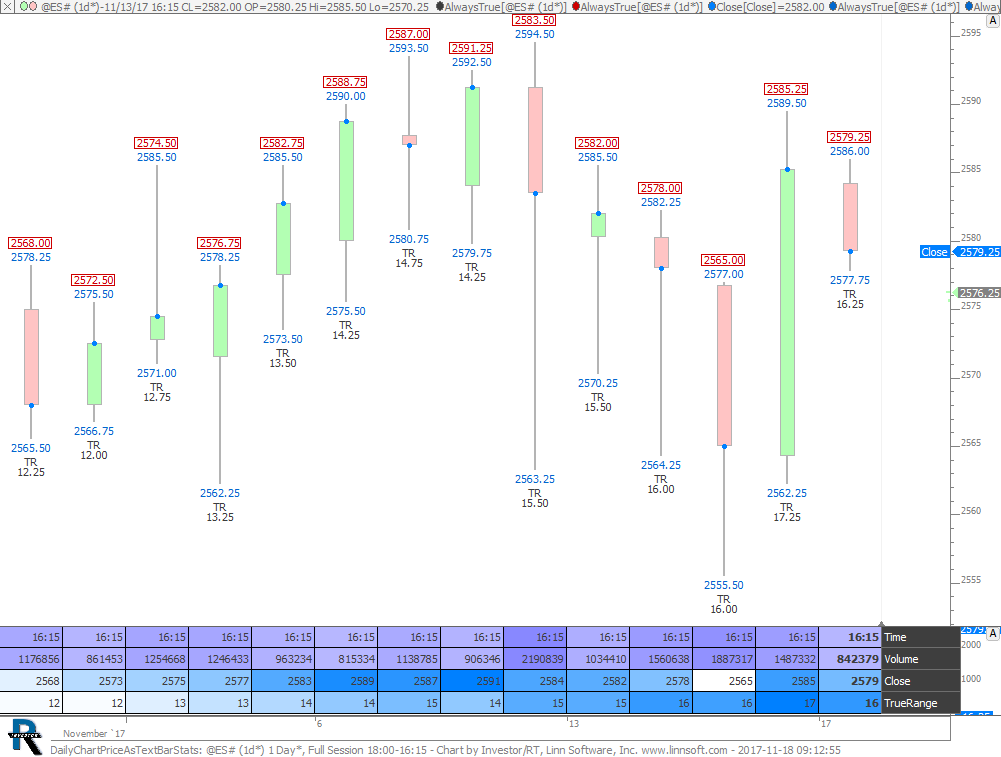 |
DailyChartPriceAsTextBarStats (@ES#) cpayne [totalcount]
8 years 8 months ago
Daily Chart with Prices as Text using Bar Statistics. This chart was uploaded by Investor/RT 13.1.1 showing symbol: @ES#. |
View |
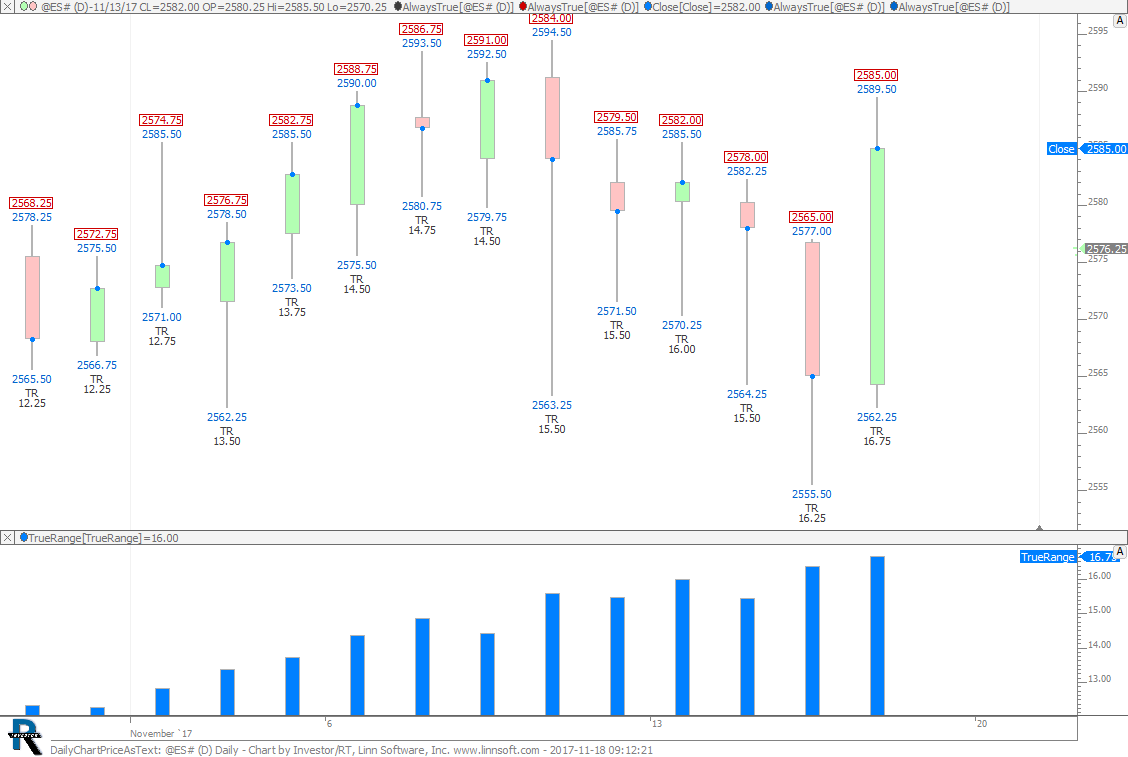 |
DailyChartPriceAsText (@ES#) cpayne [totalcount]
8 years 8 months ago
Daily Chart with Prices as Text. This chart was uploaded by Investor/RT 13.1.1 showing symbol: @ES#. |
View |
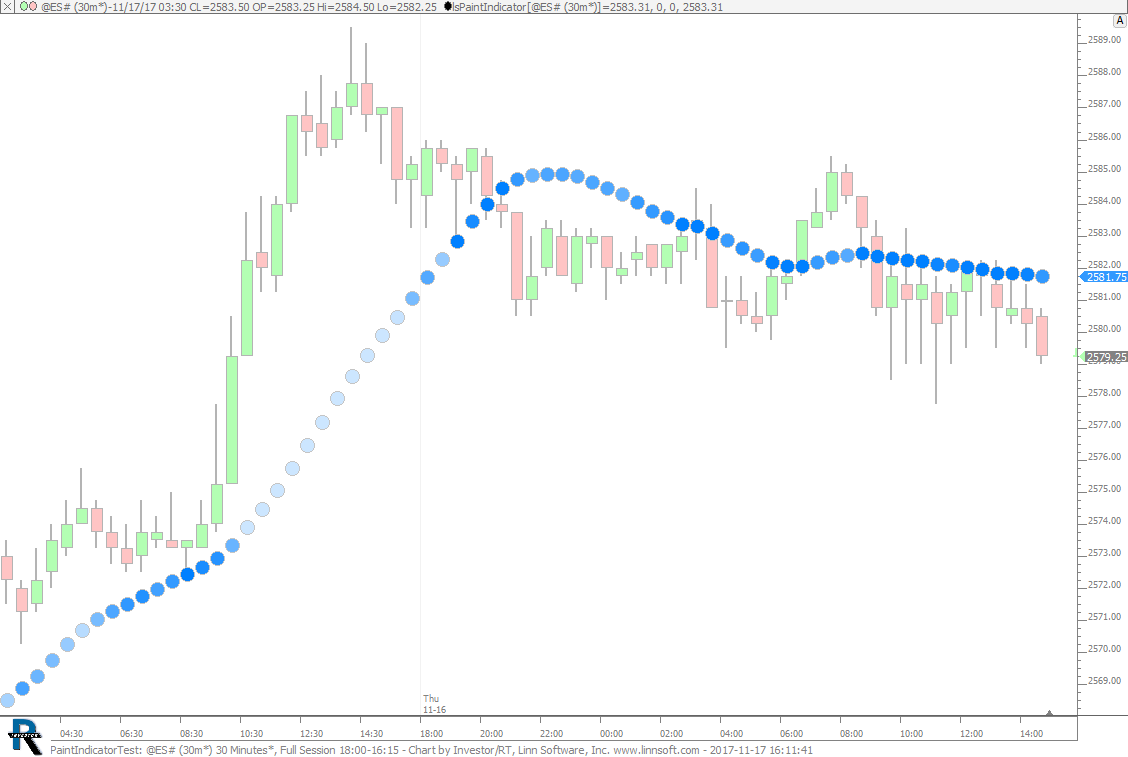 |
PaintIndicatorTest (@ES#) cpayne [totalcount]
8 years 8 months ago
Paint Indicator Test - Painted MA based on how close it is to bars. This chart was uploaded by Investor/RT 13.1.1 showing symbol: @ES#. |
View |
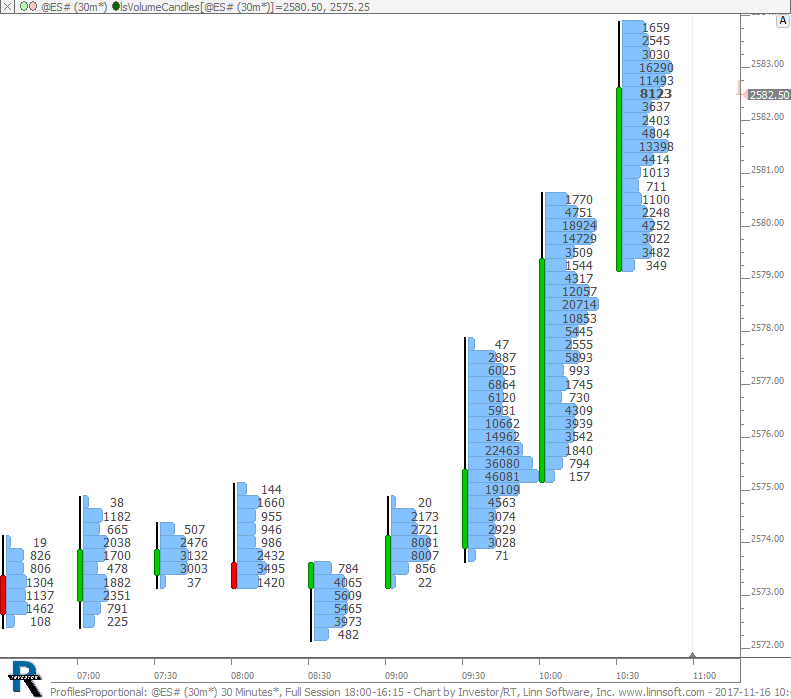 |
ProfilesProportional (@ES#) cpayne [totalcount]
8 years 8 months ago
Proportional Bar Profiles. This chart was uploaded by Investor/RT 13.1.1 showing symbol: @ES#. |
View |
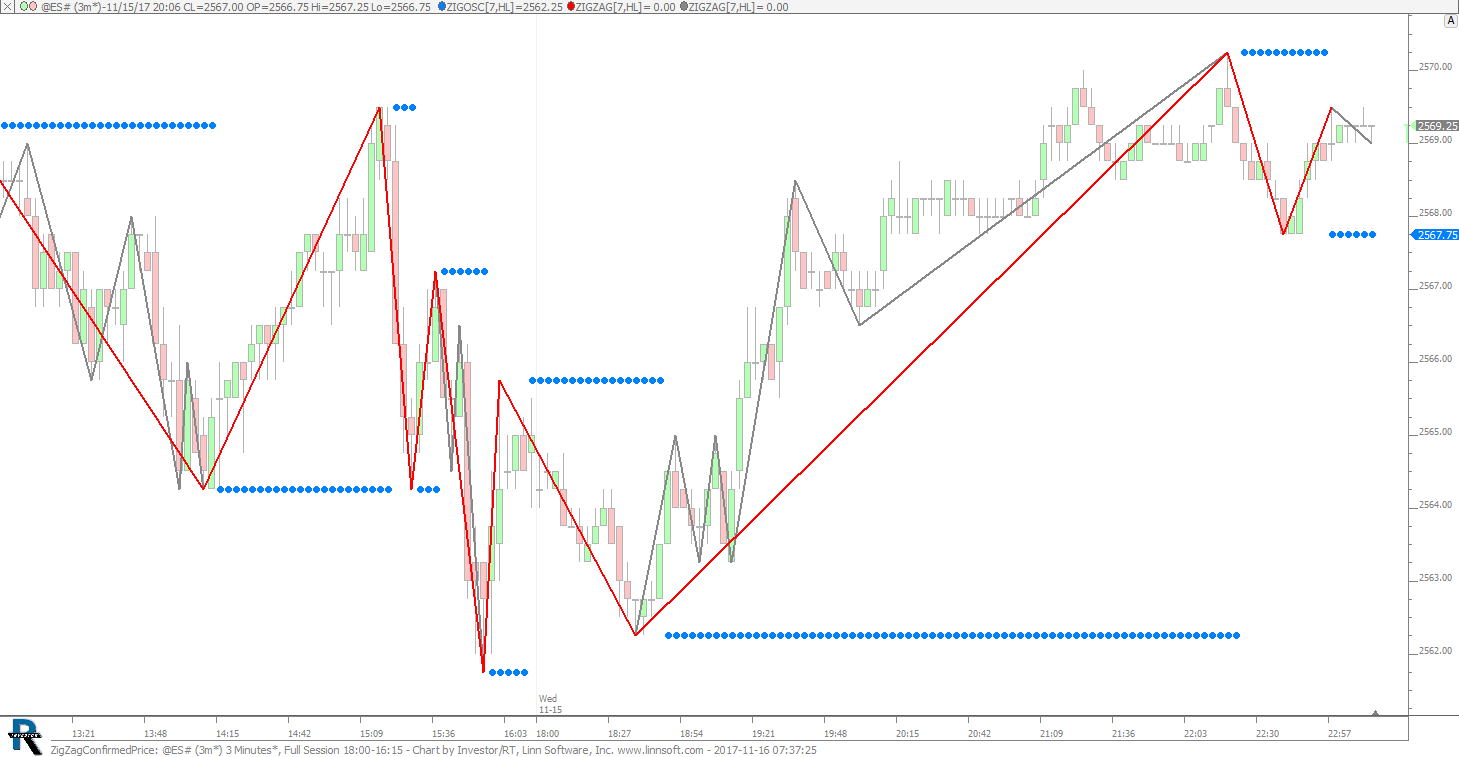 |
ZigZagConfirmedPrice (@ES#) cpayne [totalcount]
8 years 8 months ago
This chart was uploaded by Investor/RT 13.1.1 showing symbol: @ES#. |
View |