 |
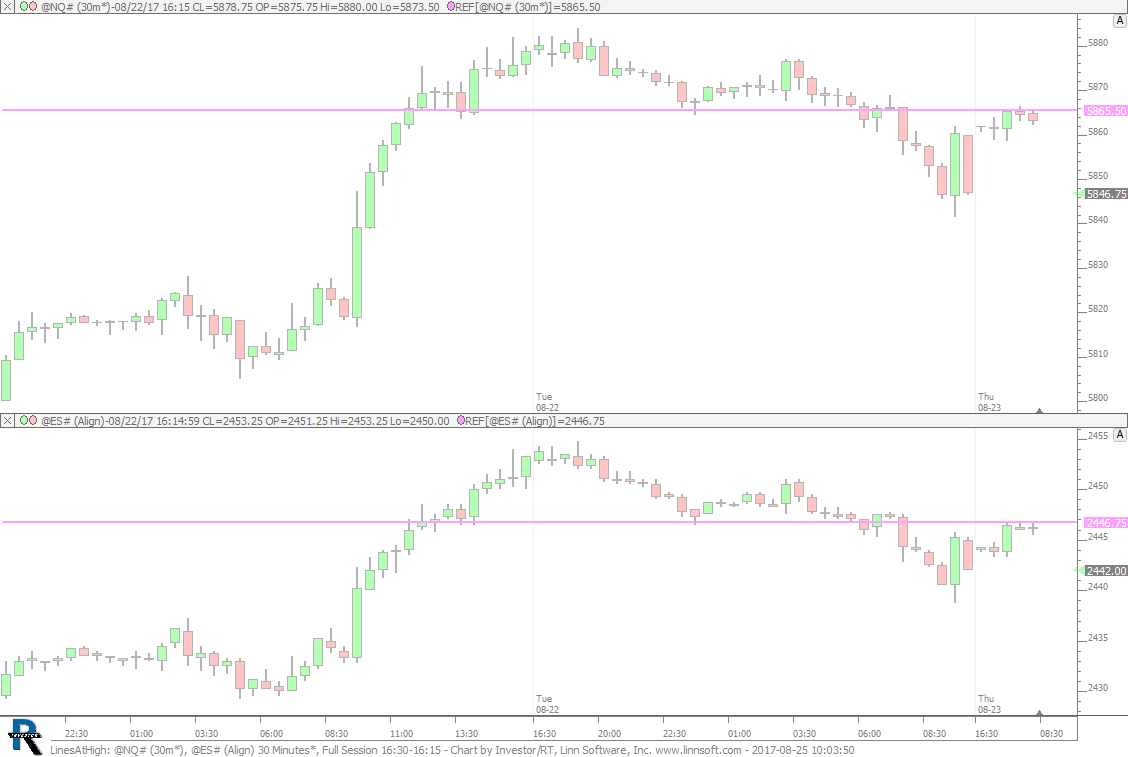
LinesAtHigh (@NQ#) cpayne [totalcount]
8 years 10 months ago
Lines At Highs. This chart was uploaded by Investor/RT 13.1.1 showing symbol: @NQ#. |
View |
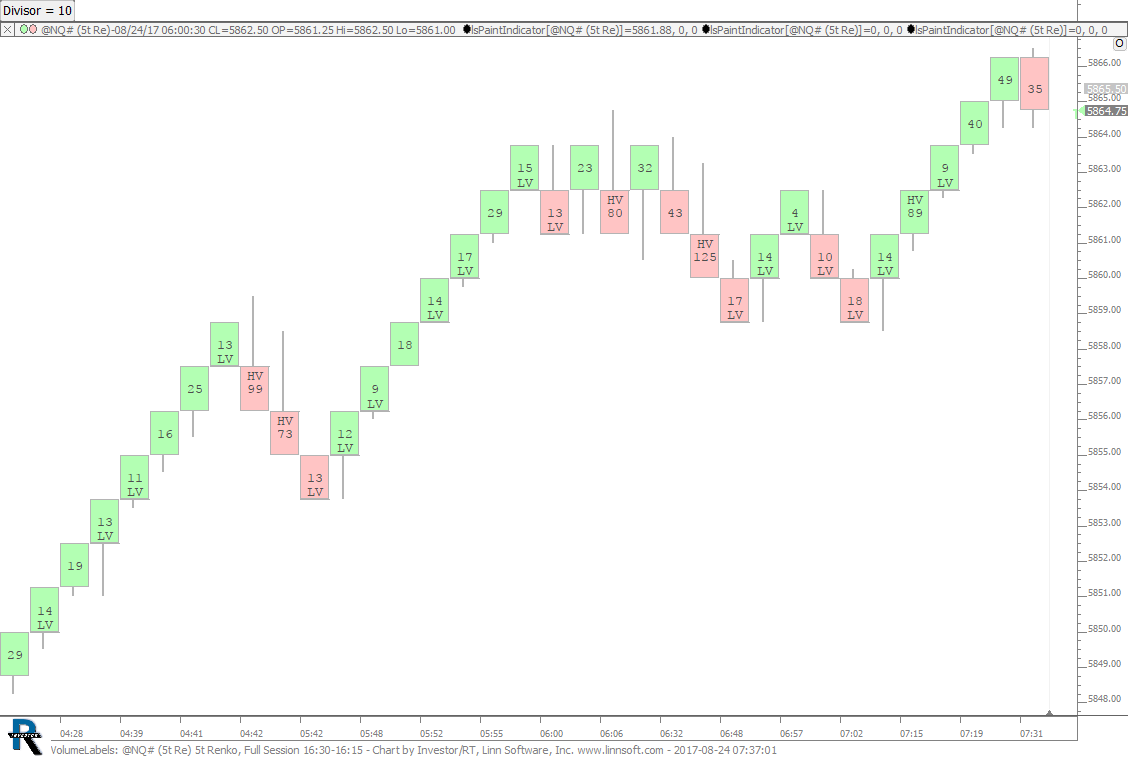 |
VolumeLabels (@NQ#) cpayne [totalcount]
8 years 10 months ago
Volume Labeling using Paint Indicator. This chart was uploaded by Investor/RT 12.7.7 showing symbol: @NQ#. |
View |
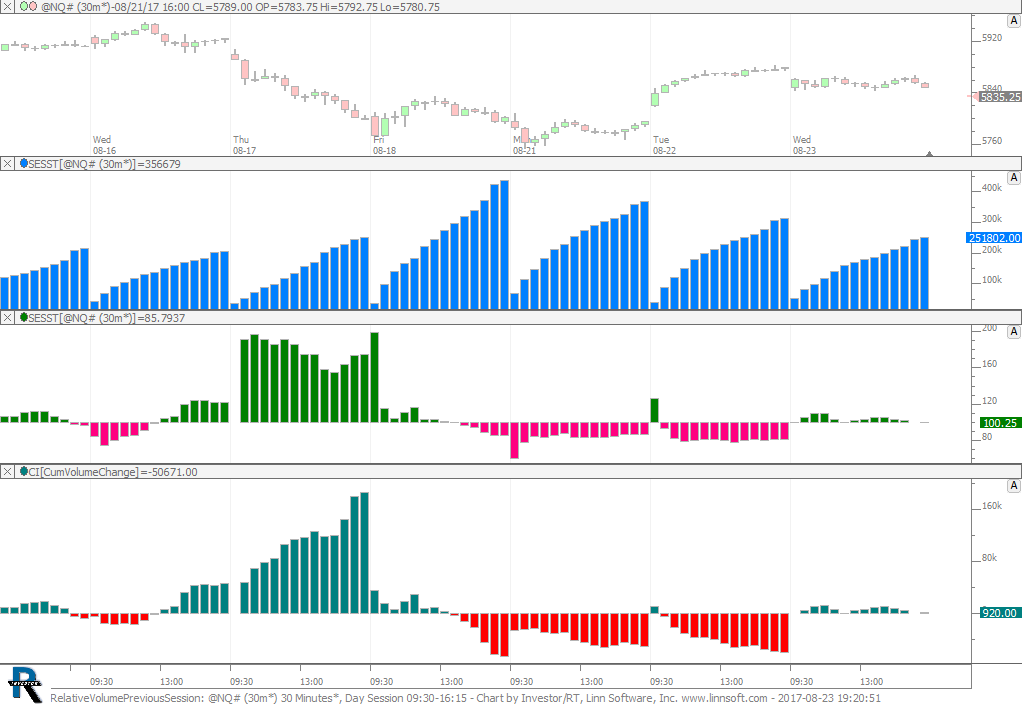 |
RelativeVolumePreviousSession (@NQ#) cpayne [totalcount]
8 years 10 months ago
Relative Volume Previous Session. This chart was uploaded by Investor/RT 12.7.7 showing symbol: @NQ#. |
View |
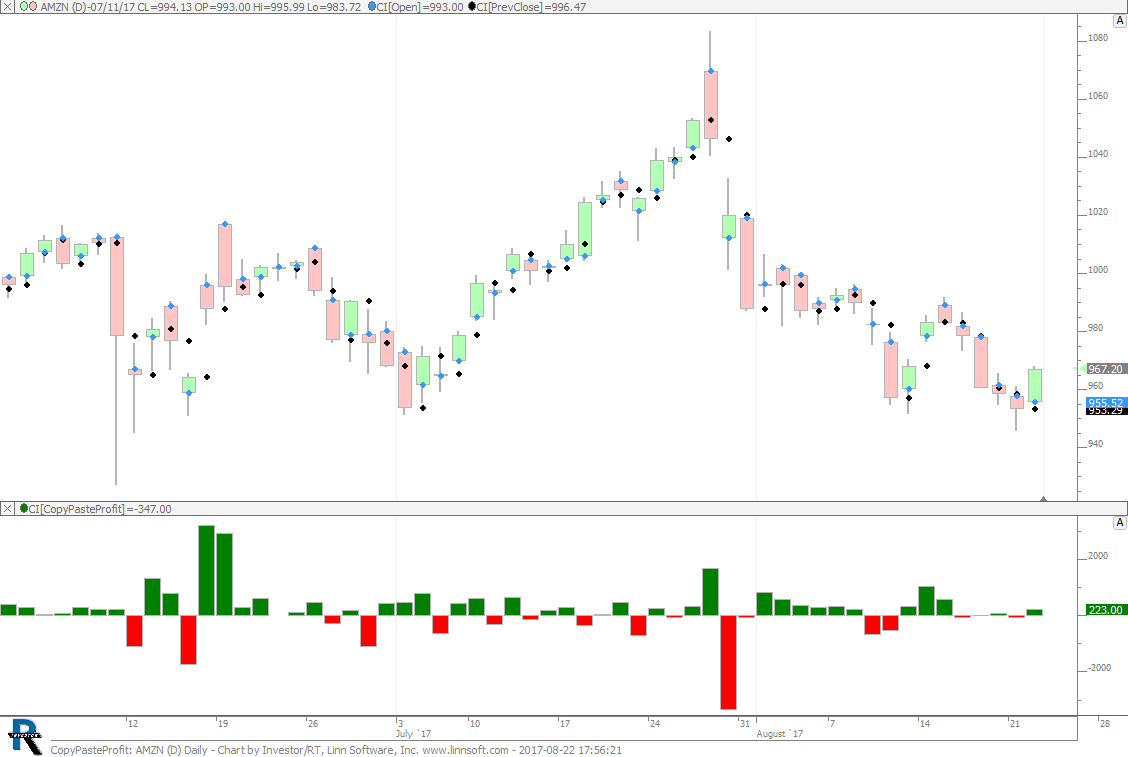 |
CopyPasteProfit (AMZN) cpayne [totalcount]
8 years 10 months ago
Copy / Paste Profit. This chart was uploaded by Investor/RT 12.7.7 showing symbol: AMZN. |
View |
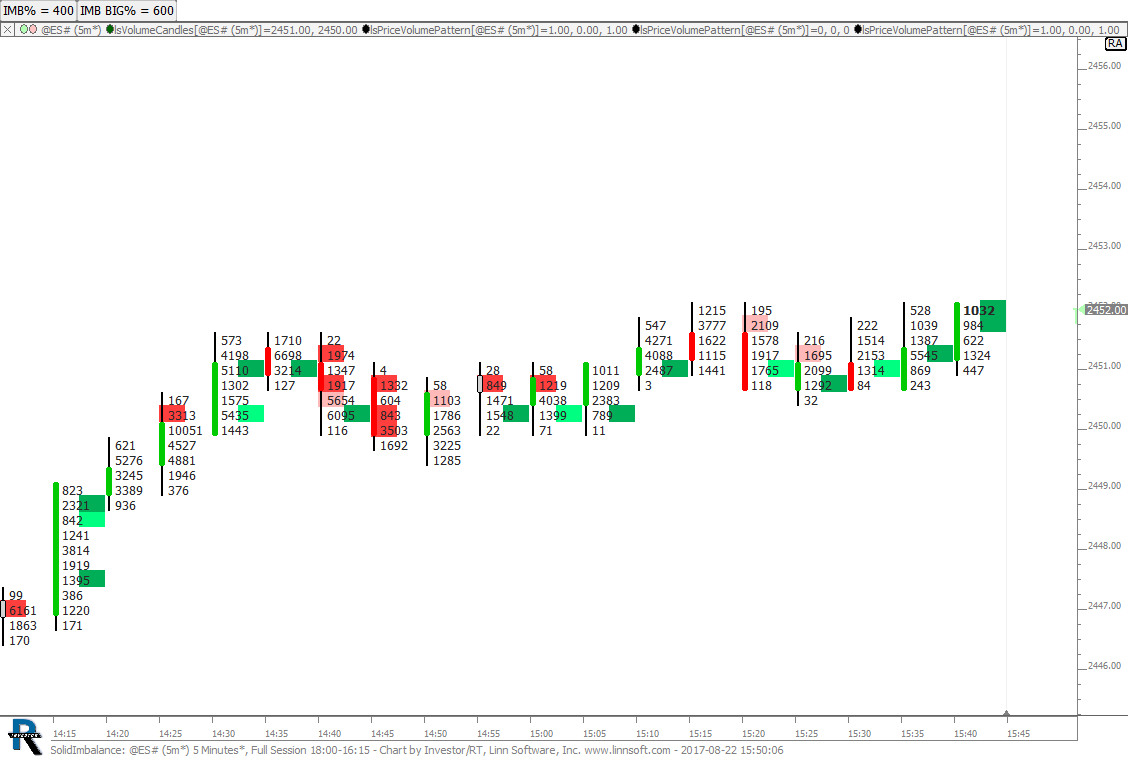 |
SolidImbalance (@ES#) cpayne [totalcount]
8 years 10 months ago
Solid Imbalance. This chart was uploaded by Investor/RT 12.7.7 showing symbol: @ES#. |
View |
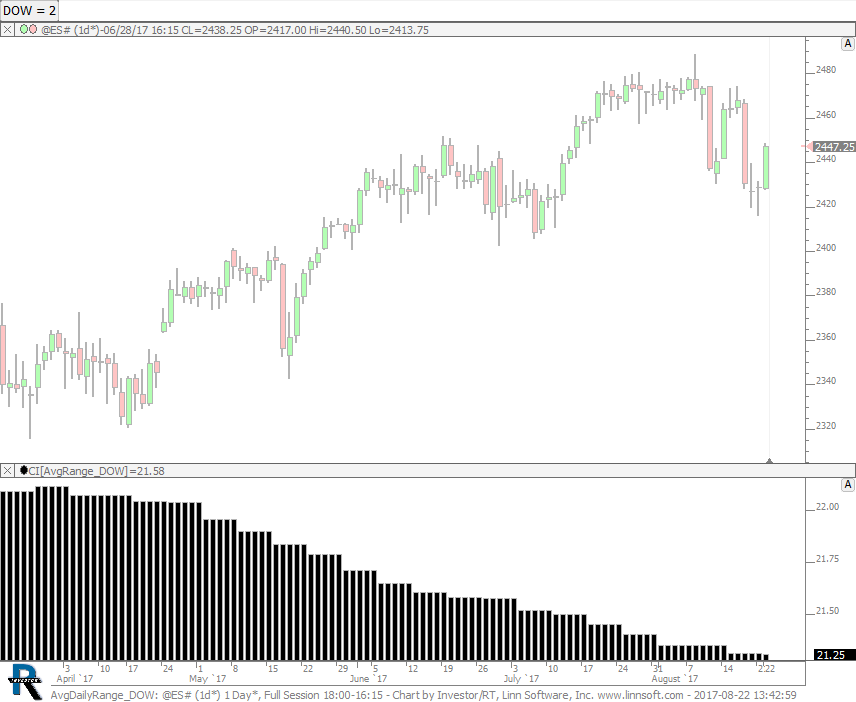 |
AvgDailyRange DOW (@ES#) cpayne [totalcount]
8 years 10 months ago
Average Range - Day of Week. This chart was uploaded by Investor/RT 12.7.7 showing symbol: @ES#. |
View |
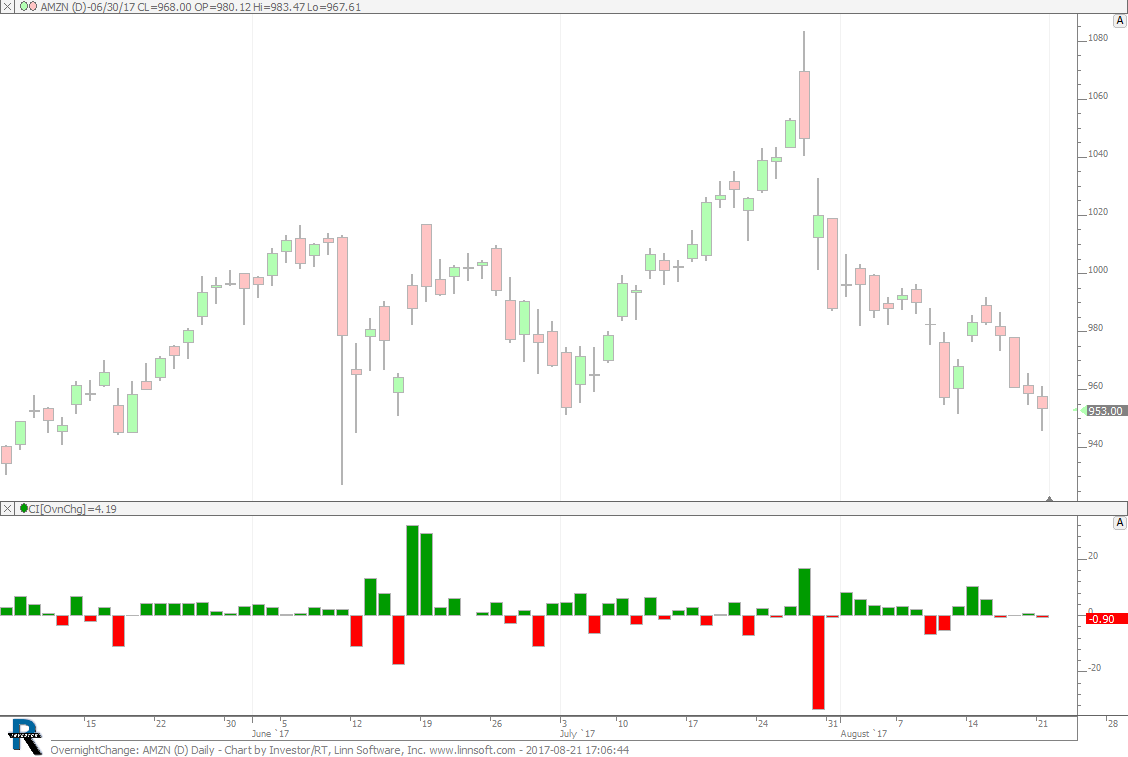 |
OvernightChange (AMZN) cpayne [totalcount]
8 years 10 months ago
Overnight Change. This chart was uploaded by Investor/RT 12.7.7 showing symbol: AMZN. |
View |
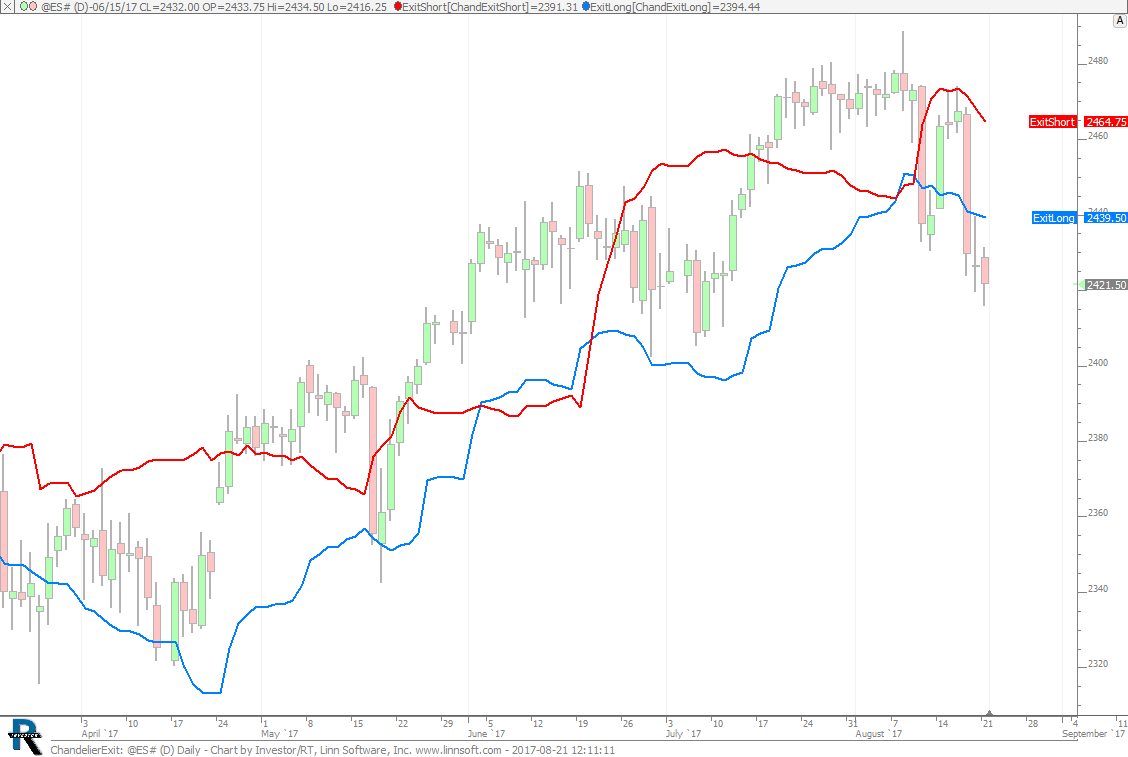 |
ChandelierExit (@ES#) cpayne [totalcount]
8 years 10 months ago
Chandelier Exit. This chart was uploaded by Investor/RT 12.7.7 showing symbol: @ES#. |
View |
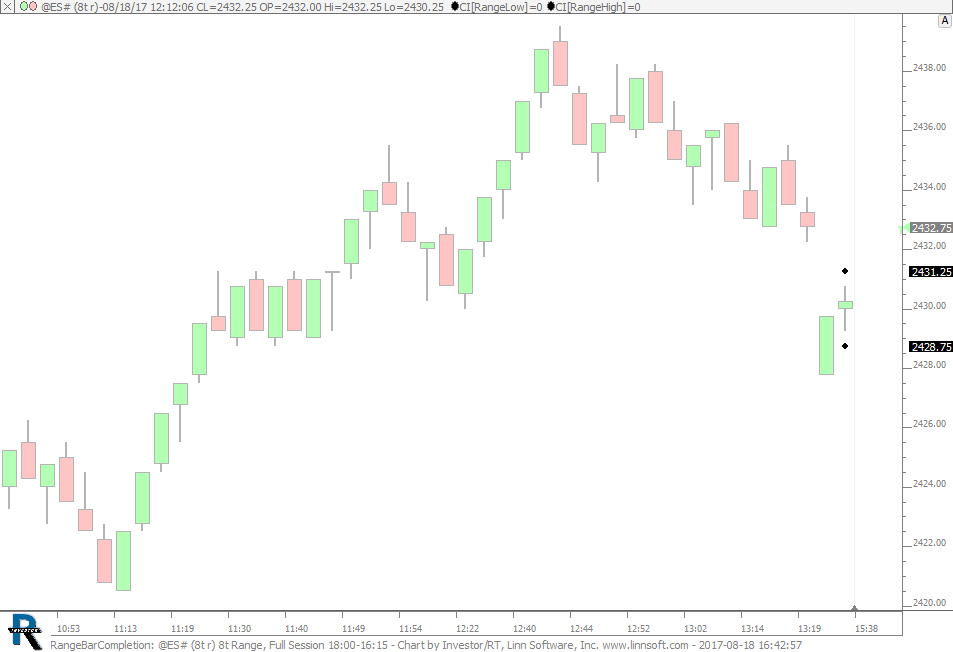 |
RangeBarCompletion (@ES#) cpayne [totalcount]
8 years 11 months ago
Range Bar Forecast. This chart was uploaded by Investor/RT 12.7.7 showing symbol: @ES#. |
View |
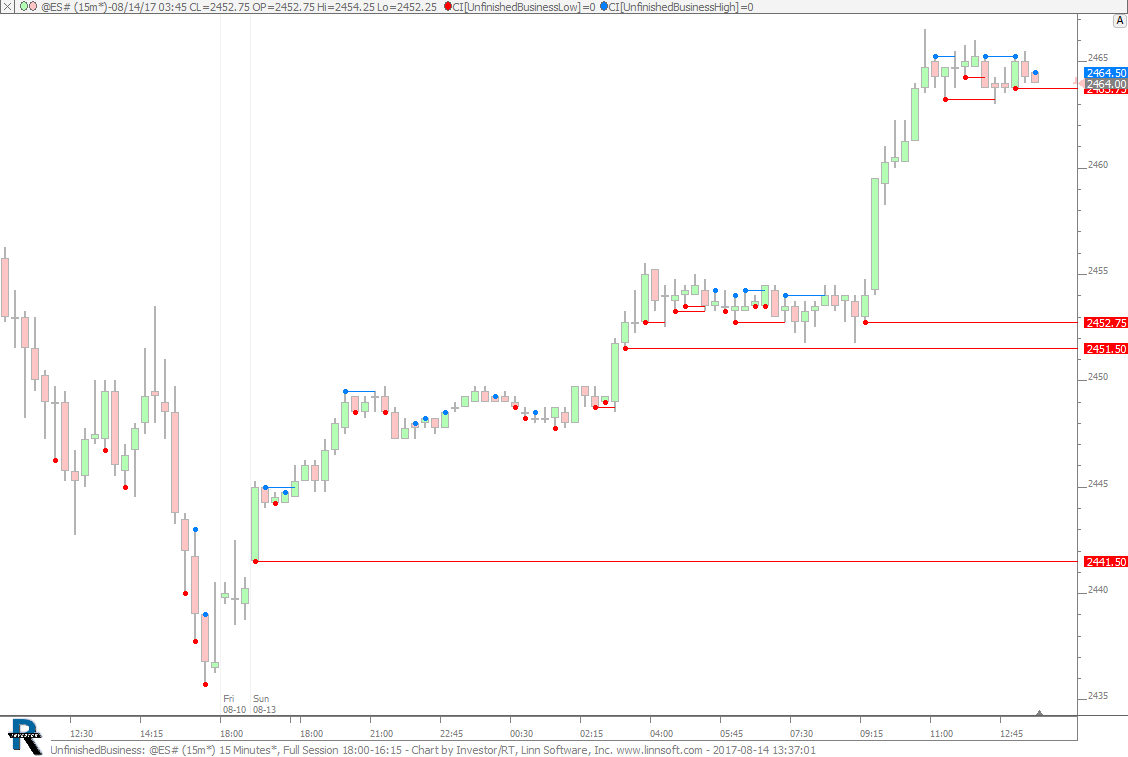 |
UnfinishedBusiness (@ES#) cpayne [totalcount]
8 years 11 months ago
Unfinished Business. This chart was uploaded by Investor/RT 12.7.7 showing symbol: @ES#. |
View |
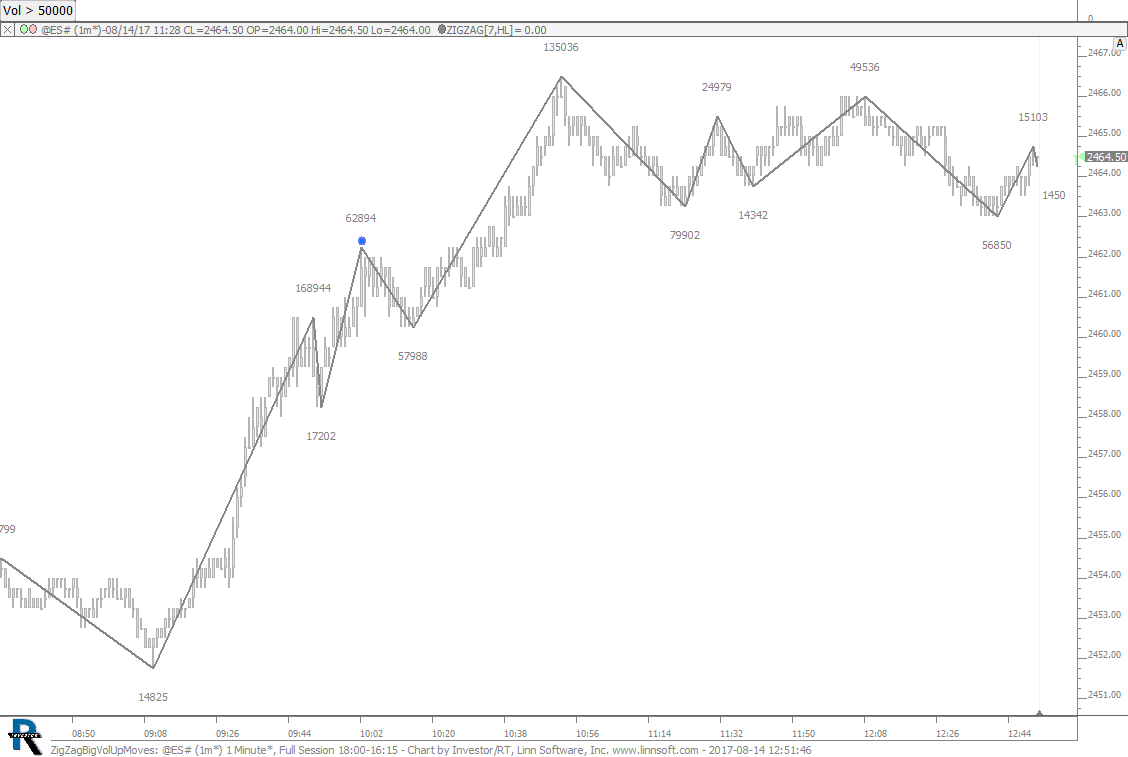 |
ZigZagBigVolUpMoves (@ES#) cpayne [totalcount]
8 years 11 months ago
Zig Zag Big Volume Up Moves (2 Consecutive - 2nd less vol than 1st). This chart was uploaded by Investor/RT 12.7.7 showing symbol: @ES#. |
View |
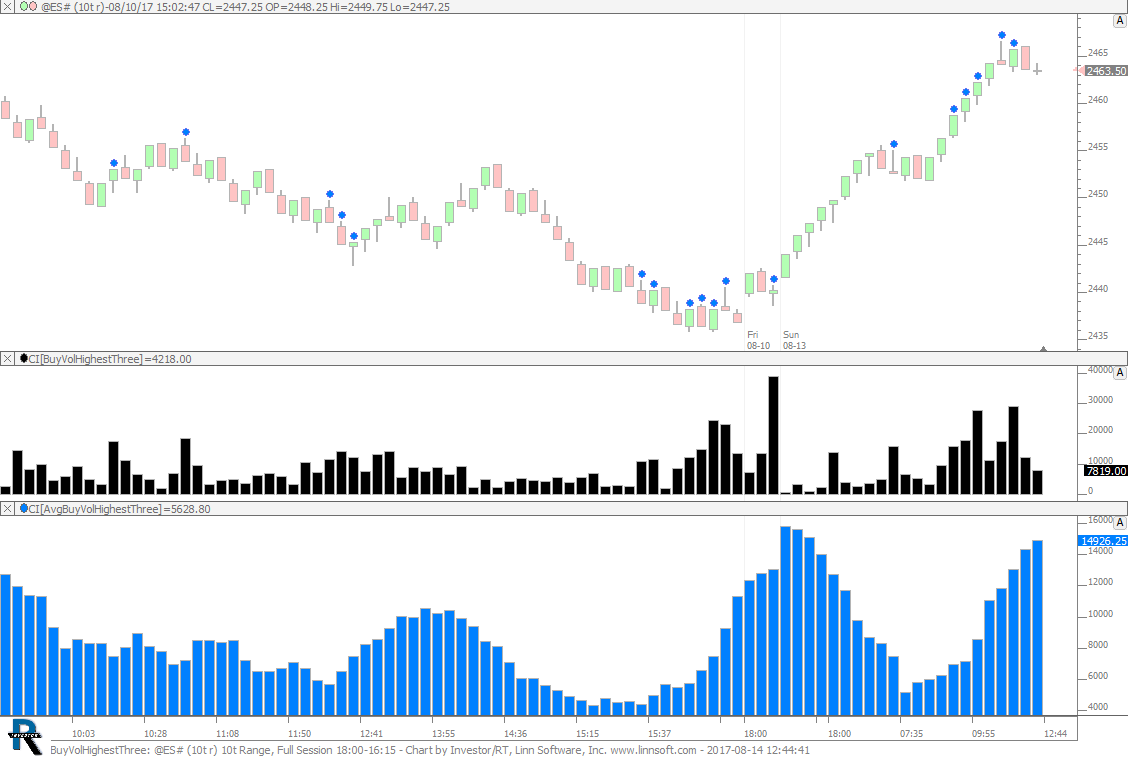 |
BuyVolHighestThree (@ES#) cpayne [totalcount]
8 years 11 months ago
Finds Excessive Volume In Upper Three Prices. This chart was uploaded by Investor/RT 12.7.7 showing symbol: @ES#. |
View |
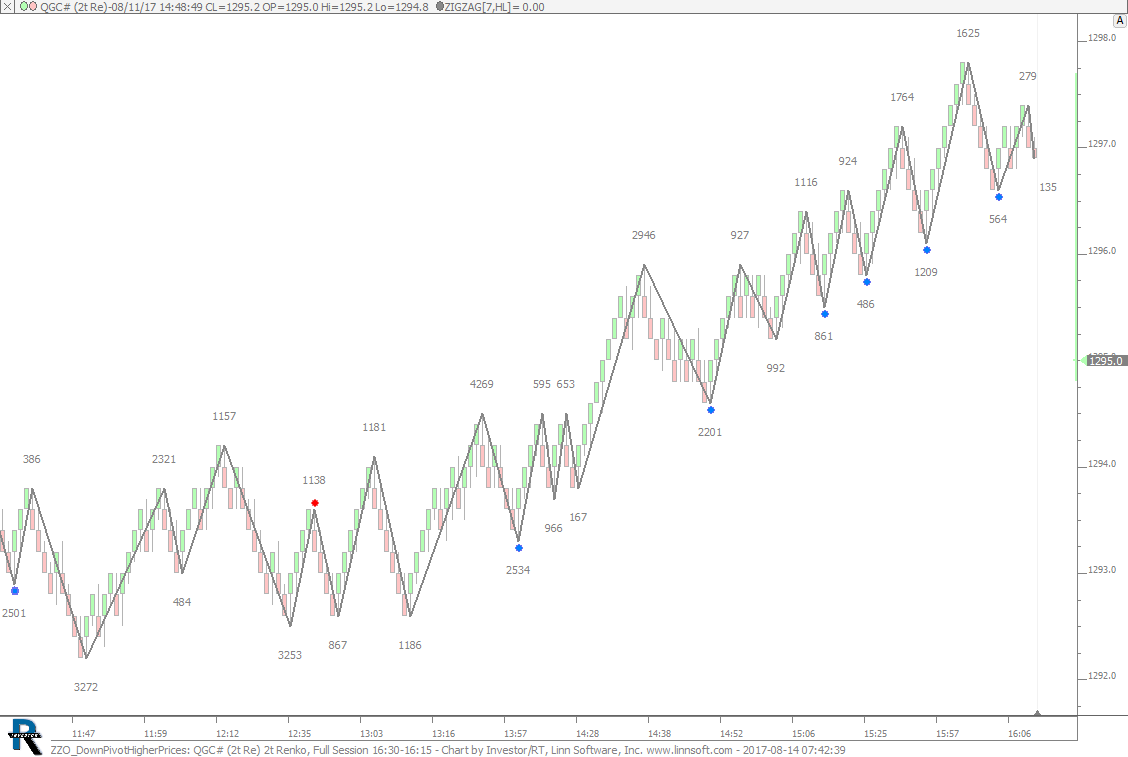 |
ZZO DownPivotHigherPrices (QGC#) cpayne [totalcount]
8 years 11 months ago
ZZO - Down Pivot Higher Prices. This chart was uploaded by Investor/RT 12.7.7 showing symbol: QGC#. |
View |
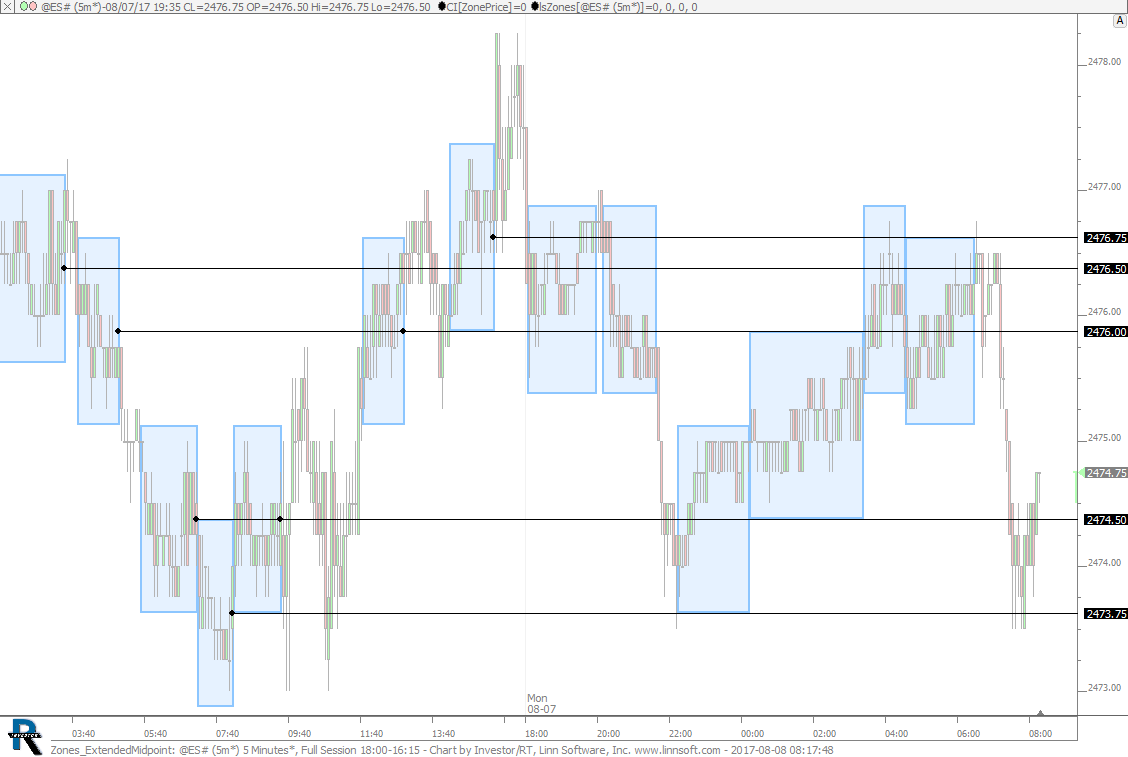 |
Zones ExtendedMidpoint (@ES#) cpayne [totalcount]
8 years 11 months ago
Extended Zones Midopint. This chart was uploaded by Investor/RT 12.7.7 showing symbol: @ES#. |
View |
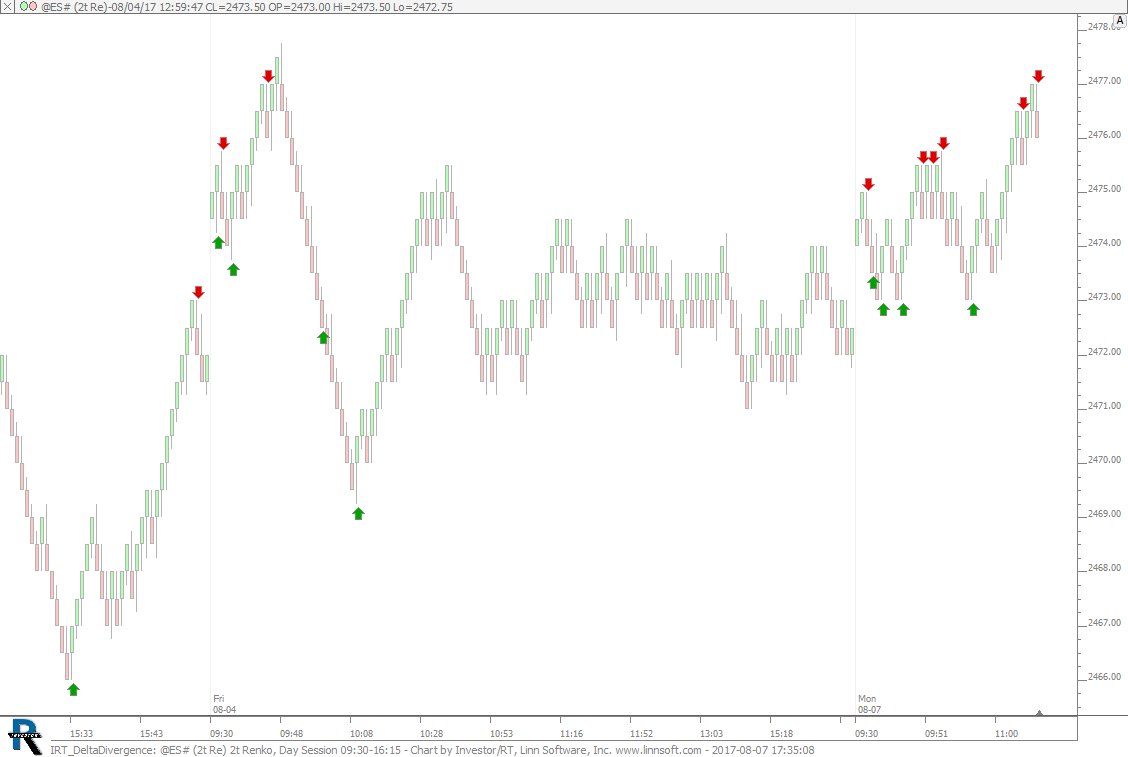 |
IRT DeltaDivergence (@ES#) cpayne [totalcount]
8 years 11 months ago
Delta Divergence. This chart was uploaded by Investor/RT 12.7.7 showing symbol: @ES#. |
View |
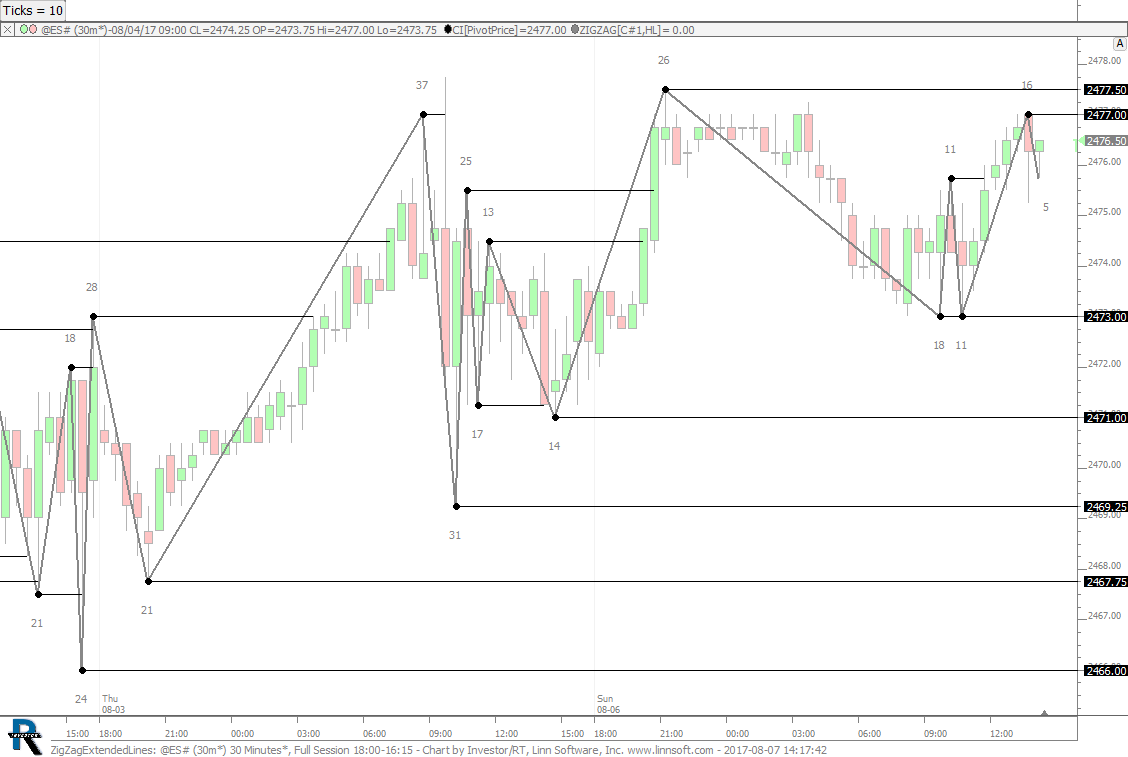 |
ZigZagExtendedLines (@ES#) cpayne [totalcount]
8 years 11 months ago
Zig Zag Extended Lines. This chart was uploaded by Investor/RT 12.7.7 showing symbol: @ES#. |
View |
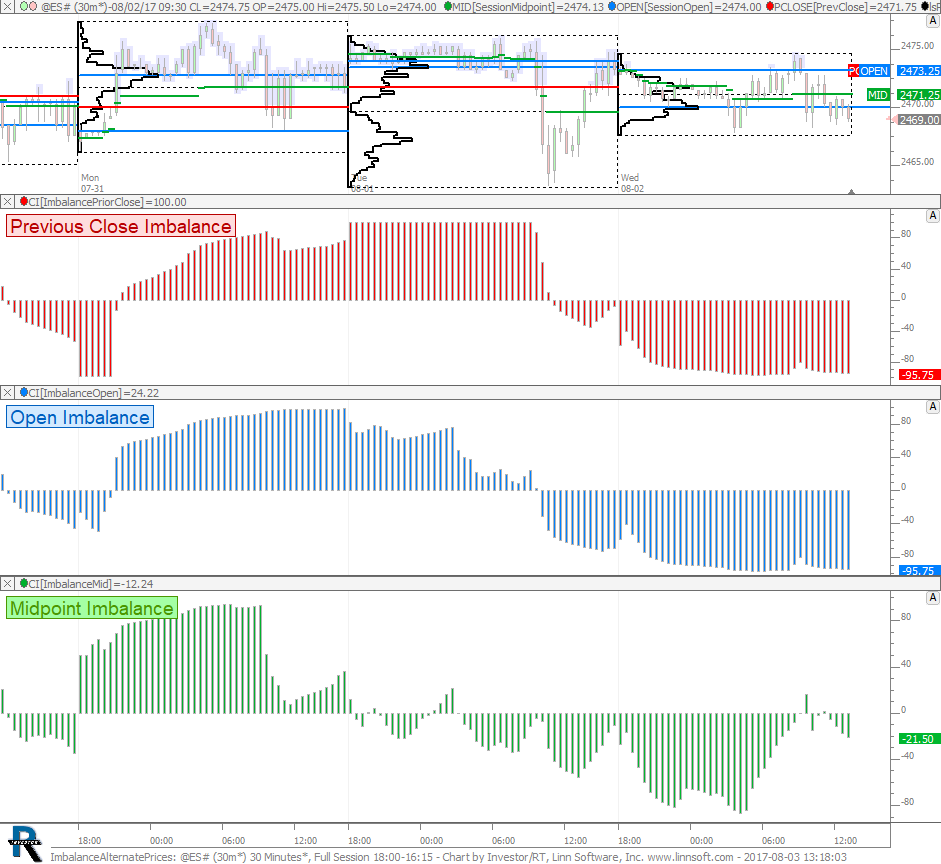 |
ImbalanceAlternatePrices (@ES#) cpayne [totalcount]
8 years 11 months ago
Alternate Price Imbalance. This chart was uploaded by Investor/RT 12.7.7 showing symbol: @ES#. |
View |
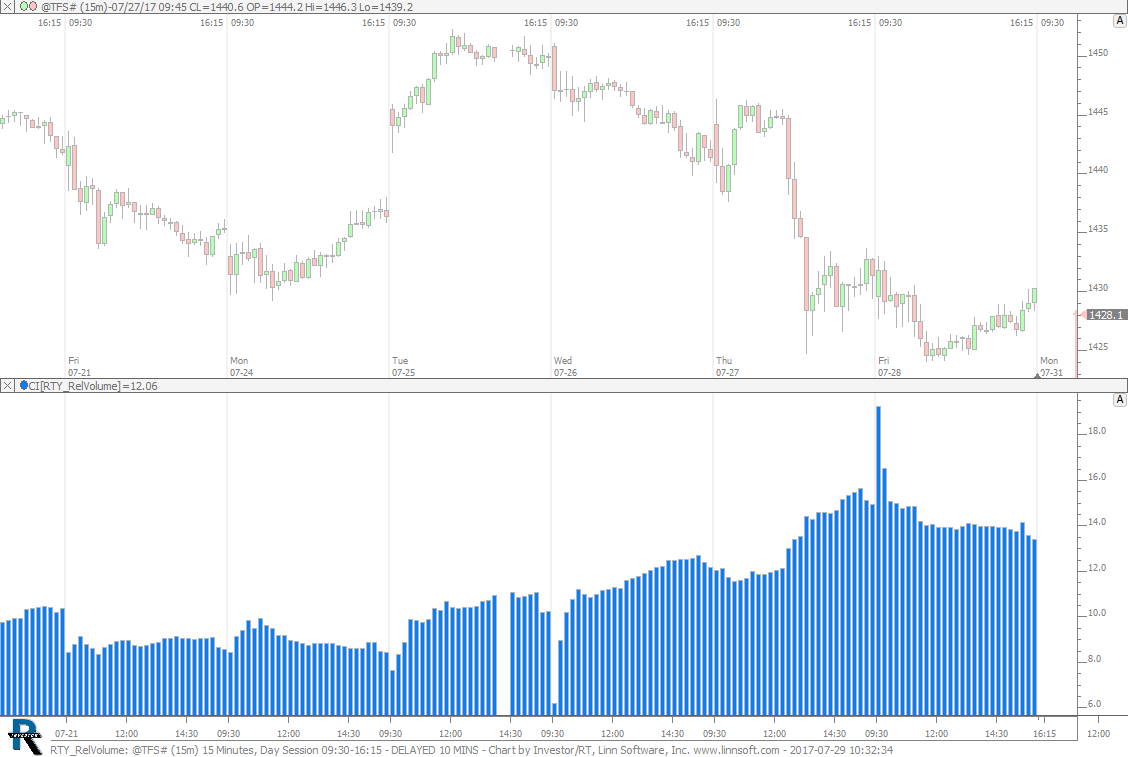 |
RTY RelVolume (@TFS#) cpayne [totalcount]
8 years 11 months ago
Relaive Voulme - 100 * RTY_VOL / (RTY_VOL + TFS_VOL). This chart was uploaded by Investor/RT 12.7.7 showing symbol: @TFS#. |
View |
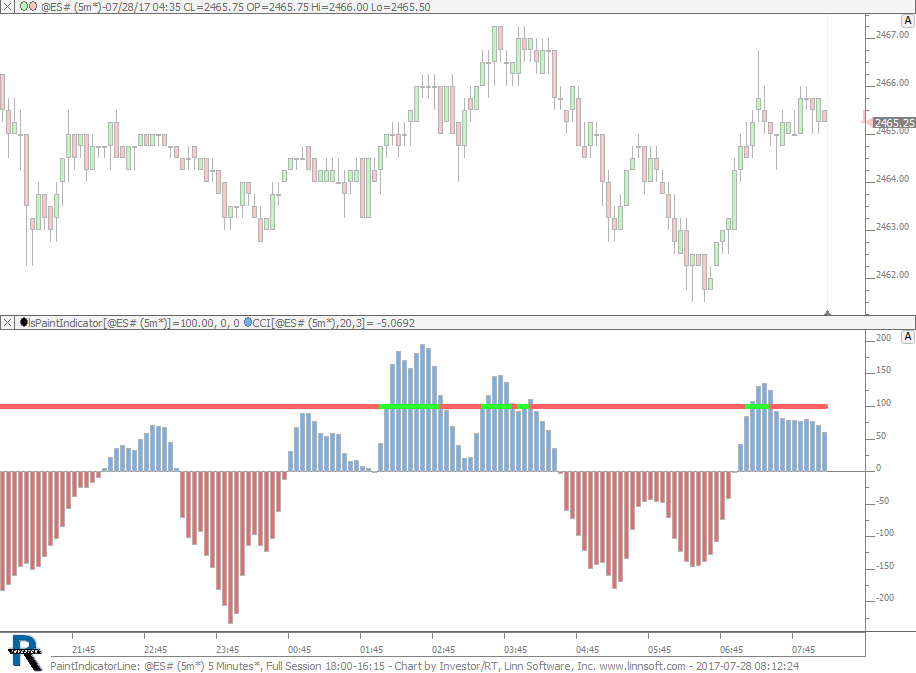 |
PaintIndicatorLine (@ES#) cpayne [totalcount]
8 years 11 months ago
Painted Reference Line. This chart was uploaded by Investor/RT 12.7.7 showing symbol: @ES#. |
View |
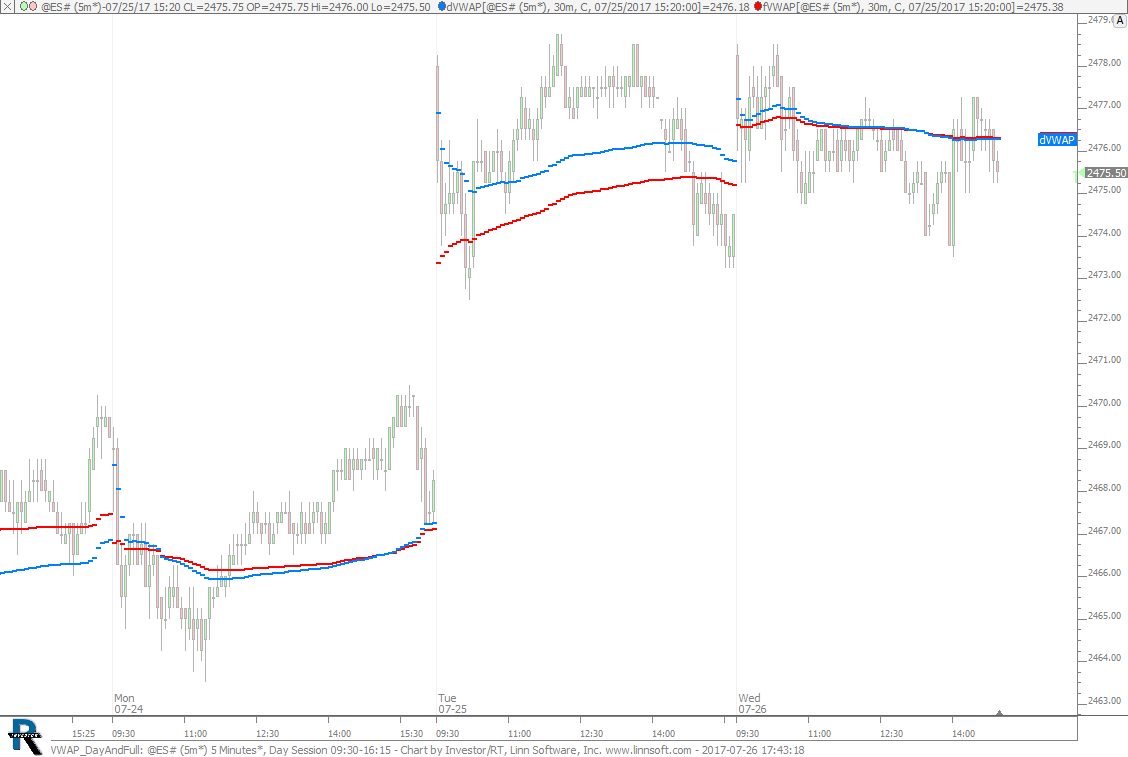 |
VWAP DayAndFull (@ES#) cpayne [totalcount]
8 years 11 months ago
Day (Blue) and Full (Red) Session VWAP. Both are independant of session of chart. This chart was uploaded by Investor/RT 12.7.7 showing symbol: @ES#. |
View |
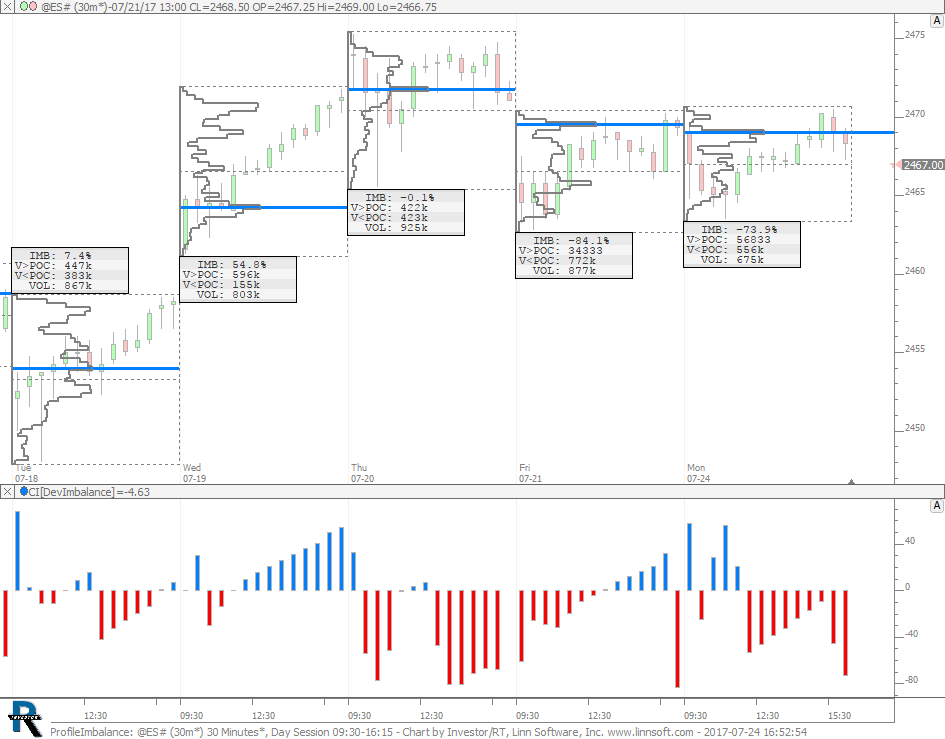 |
ProfileImbalance (@ES#) cpayne [totalcount]
8 years 11 months ago
Profile Imbalance. This chart was uploaded by Investor/RT 12.7.7 showing symbol: @ES#. |
View |
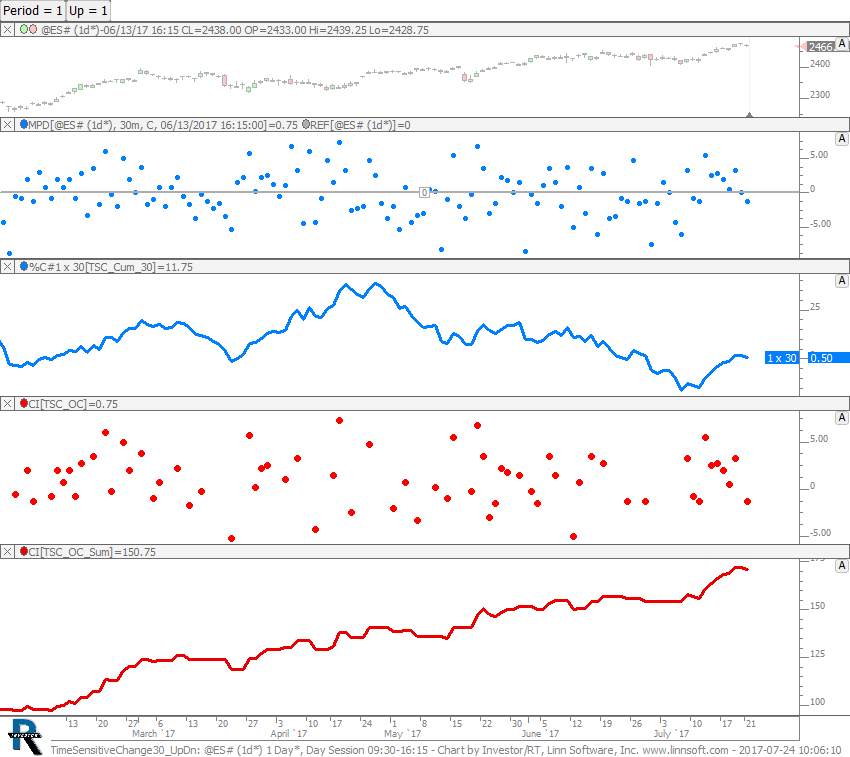 |
TimeSensitiveChange30 UpDn (@ES#) cpayne [totalcount]
8 years 11 months ago
Time Sensitive Change - Up or Down Days (Up = 1 for Up Days and Up = 0 for Down Days). This chart was uploaded by Investor/RT 12.7.7 showing symbol: @ES#. |
View |
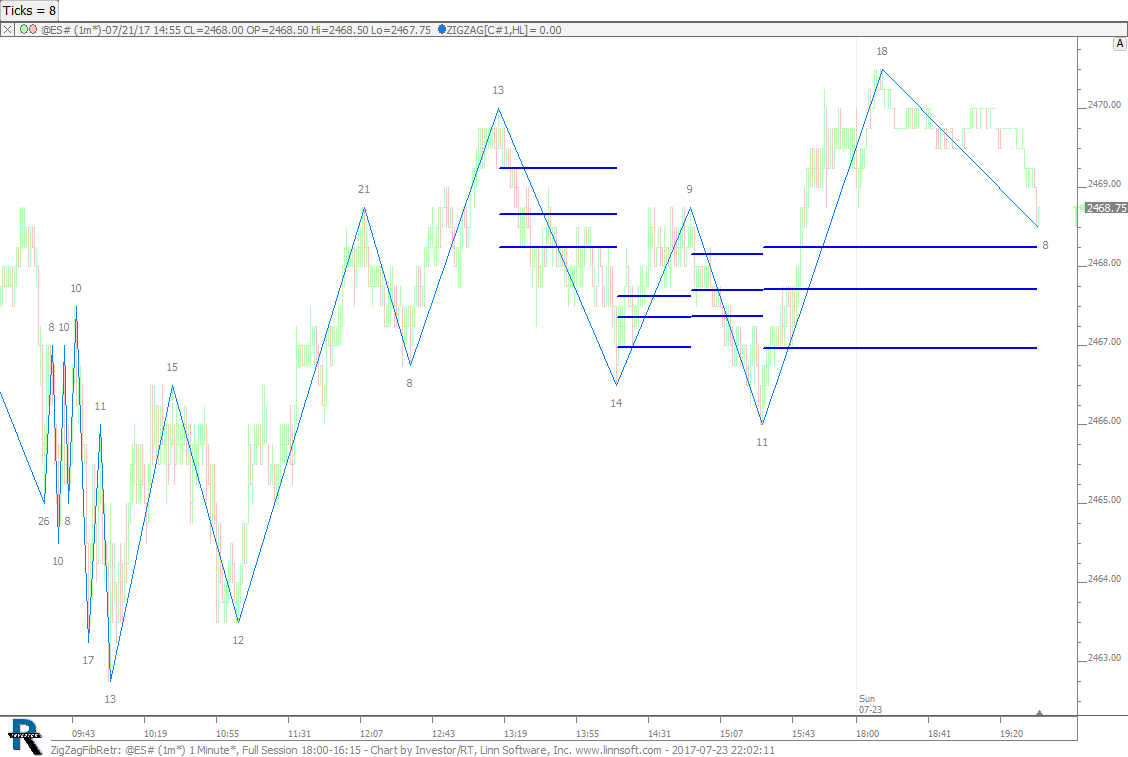 |
ZigZagFibRetr (@ES#) cpayne [totalcount]
8 years 11 months ago
This chart was uploaded by Investor/RT 12.7.7 showing symbol: @ES#. |
View |
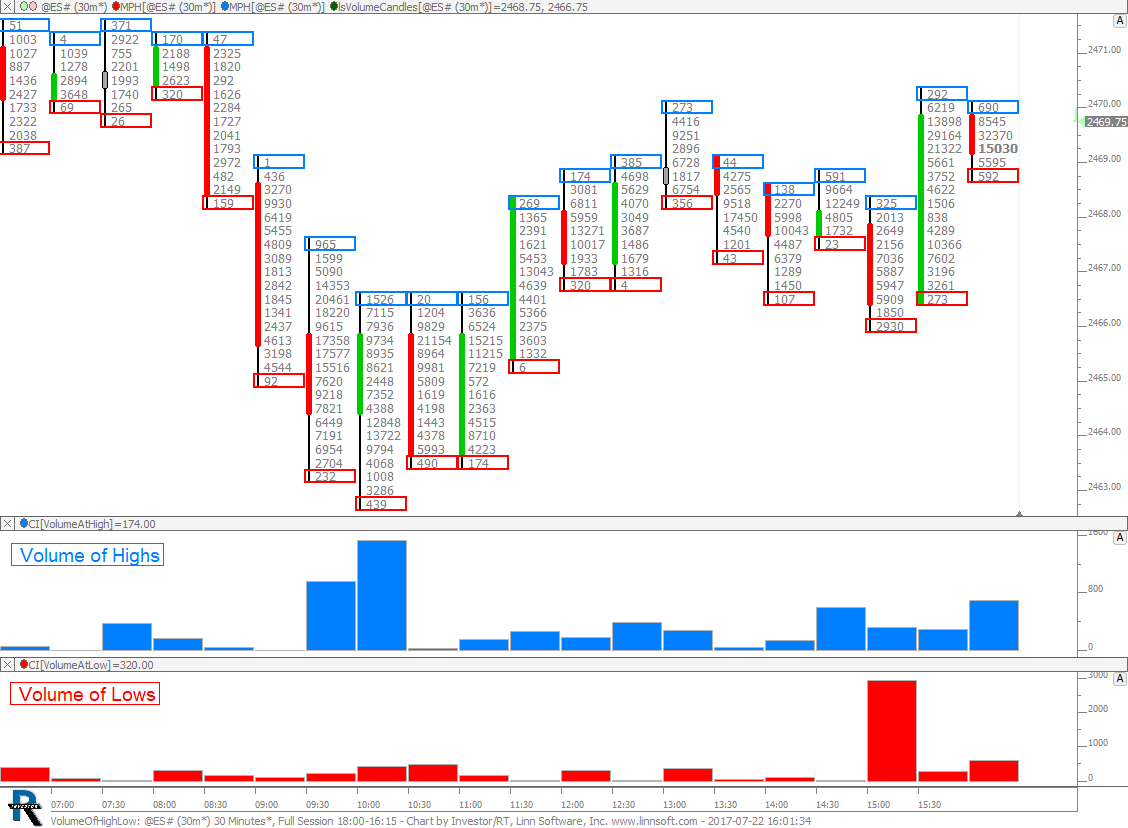 |
VolumeOfHighLow (@ES#) cpayne [totalcount]
8 years 11 months ago
Volume of High and Low Prices in RTL. This chart was uploaded by Investor/RT 12.7.7 showing symbol: @ES#. |
View |
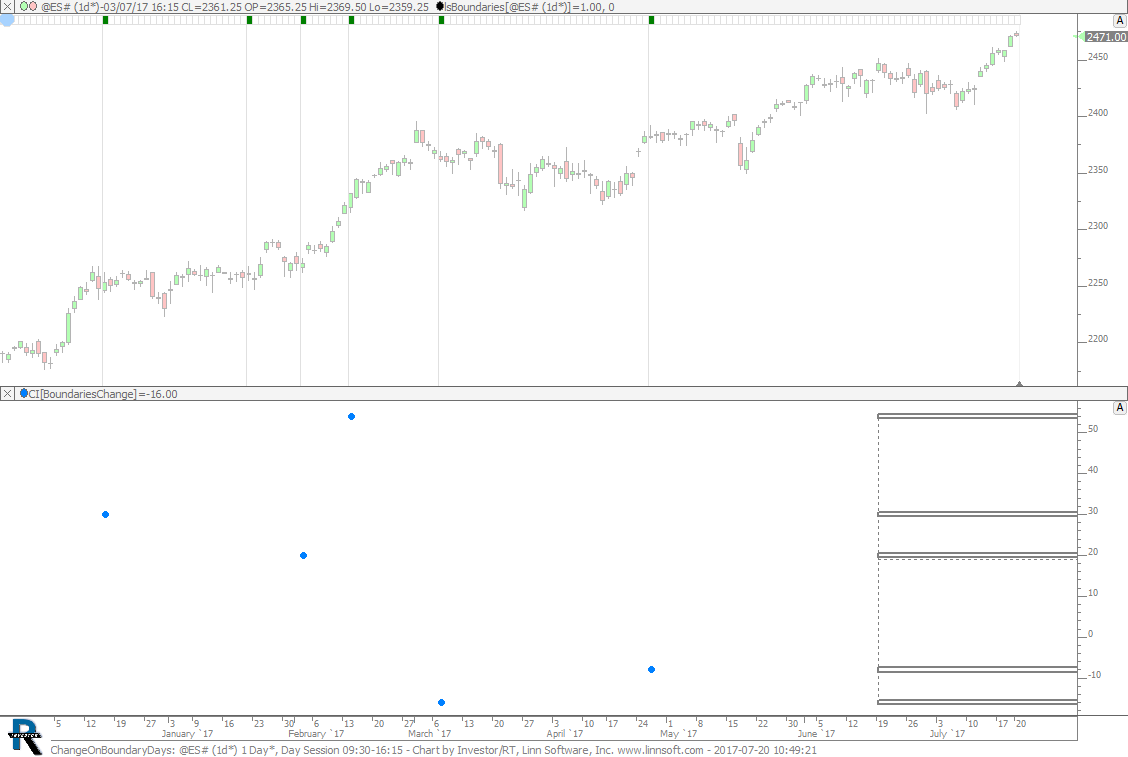 |
ChangeOnBoundaryDays (@ES#) cpayne [totalcount]
8 years 12 months ago
Change on Boundary Days Profiled. This chart was uploaded by Investor/RT 12.7.7 showing symbol: @ES#. |
View |