 |
VolumeBreakdownSamples (@ES#) cpayne [totalcount]
8 years 12 months ago
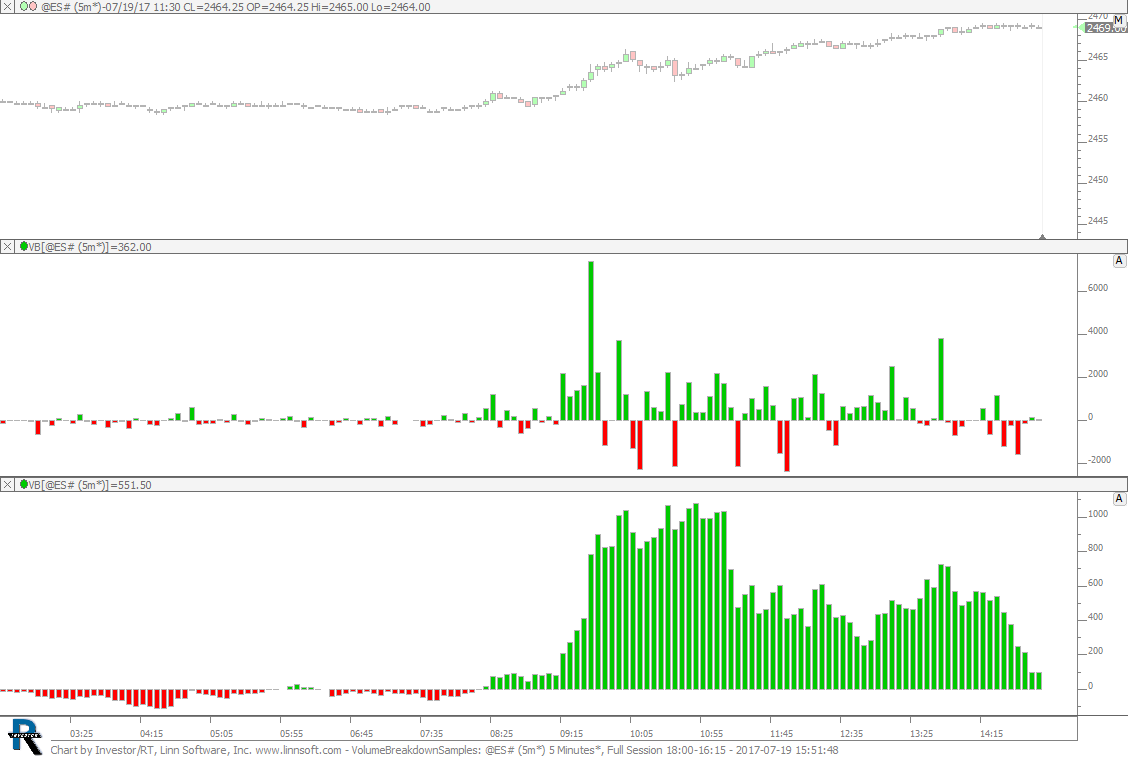
Volume Breakdown Samples. This chart was uploaded by Investor/RT 12.7.6 showing symbol: @ES#. |
View |
 |
OpenNearPrices (@ES#) cpayne [totalcount]
8 years 12 months ago
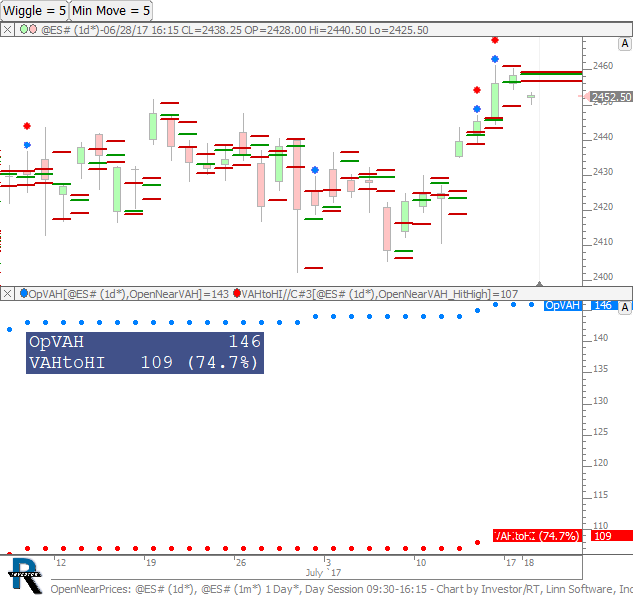
Open Near Prev VAH and Move to Prev High. This chart was uploaded by Investor/RT 12.7.7 showing symbol: @ES#. |
View |
 |
BalanceUnbalance (@ES#) cpayne [totalcount]
8 years 12 months ago
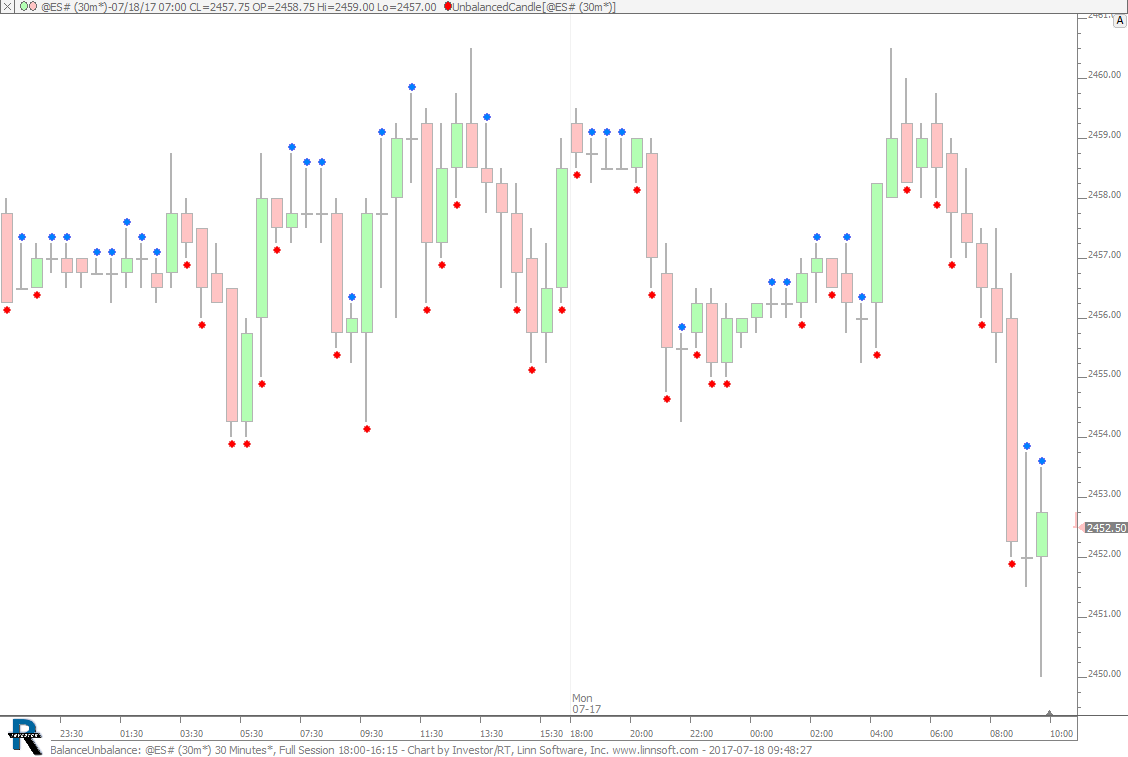
Balanced and Unbalanced Candles. This chart was uploaded by Investor/RT 12.7.7 showing symbol: @ES#. |
View |
 |
TPO BracketVolumeAtPrice (@ES#) cpayne [totalcount]
8 years 12 months ago
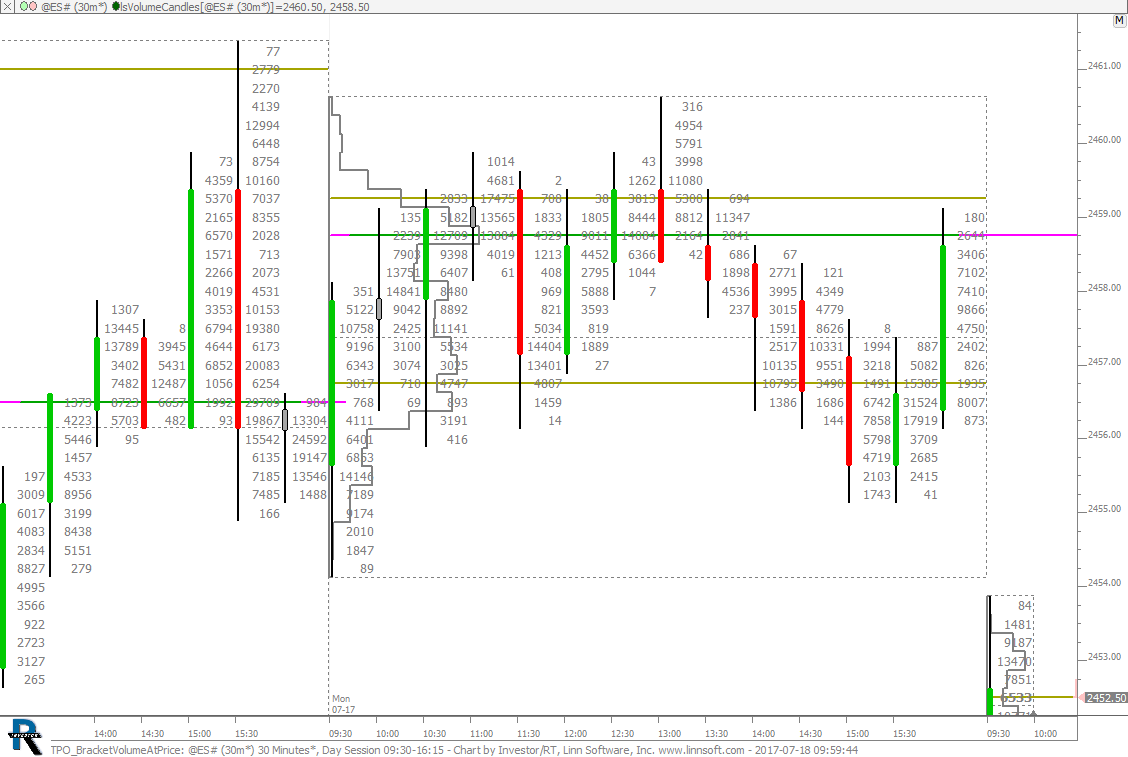
This chart was uploaded by Investor/RT 12.7.7 showing symbol: @ES#. |
View |
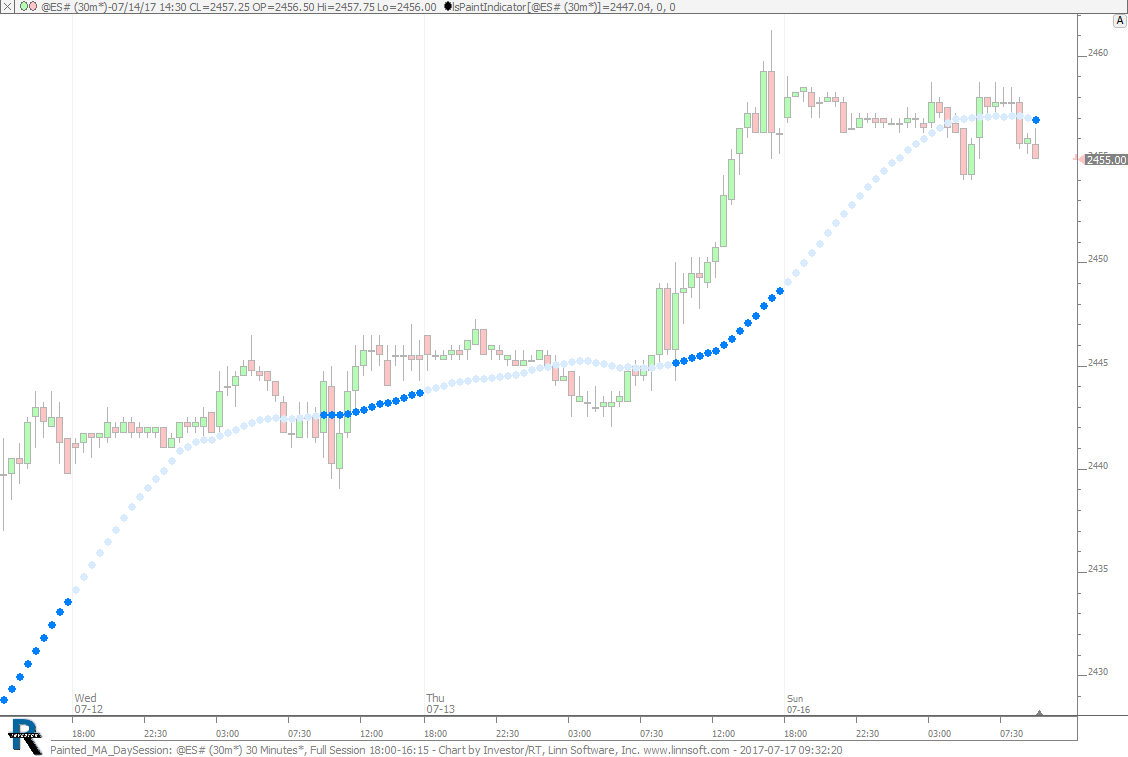 |
Painted MA DaySession (@ES#) cpayne [totalcount]
8 years 12 months ago
Moving Average Painted During Day Session. This chart was uploaded by Investor/RT 12.7.7 showing symbol: @ES#. |
View |
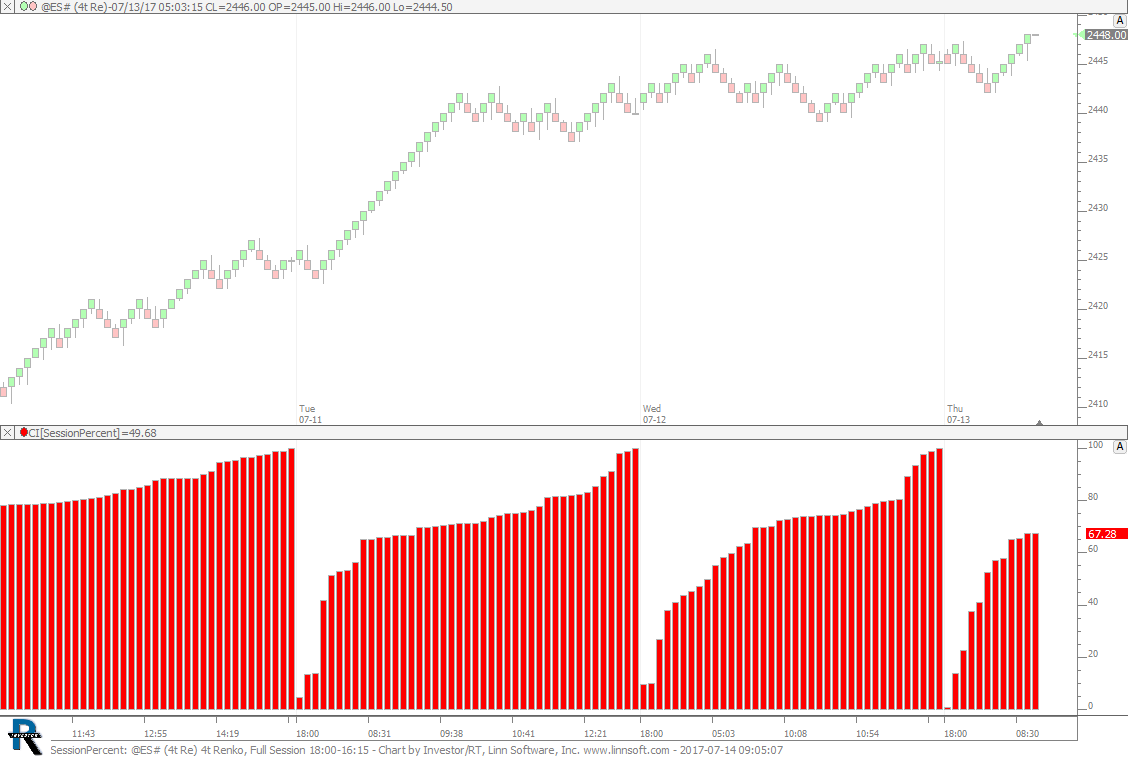 |
SessionPercent (@ES#) cpayne [totalcount]
9 years 2 days ago
Day Percent Historically. This chart was uploaded by Investor/RT 12.7.7 showing symbol: @ES#. |
View |
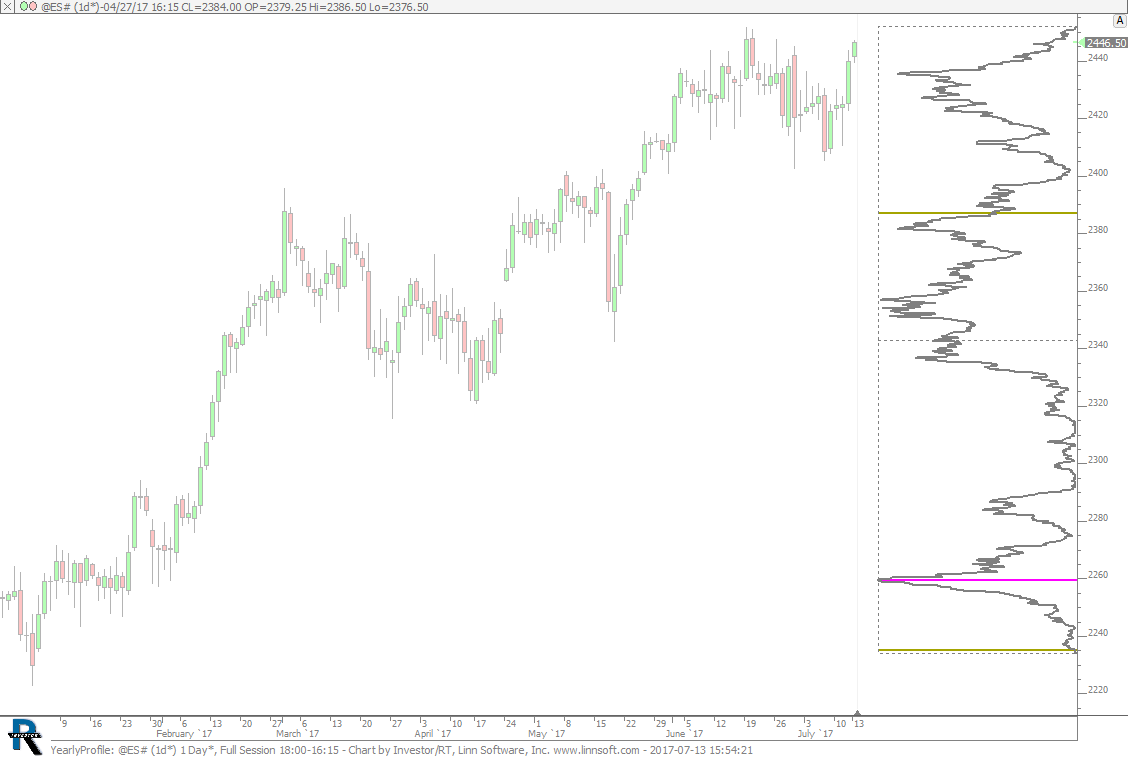 |
YearlyProfile (@ES#) cpayne [totalcount]
9 years 3 days ago
Yearly Profile. This chart was uploaded by Investor/RT 12.7.7 showing symbol: @ES#. |
View |
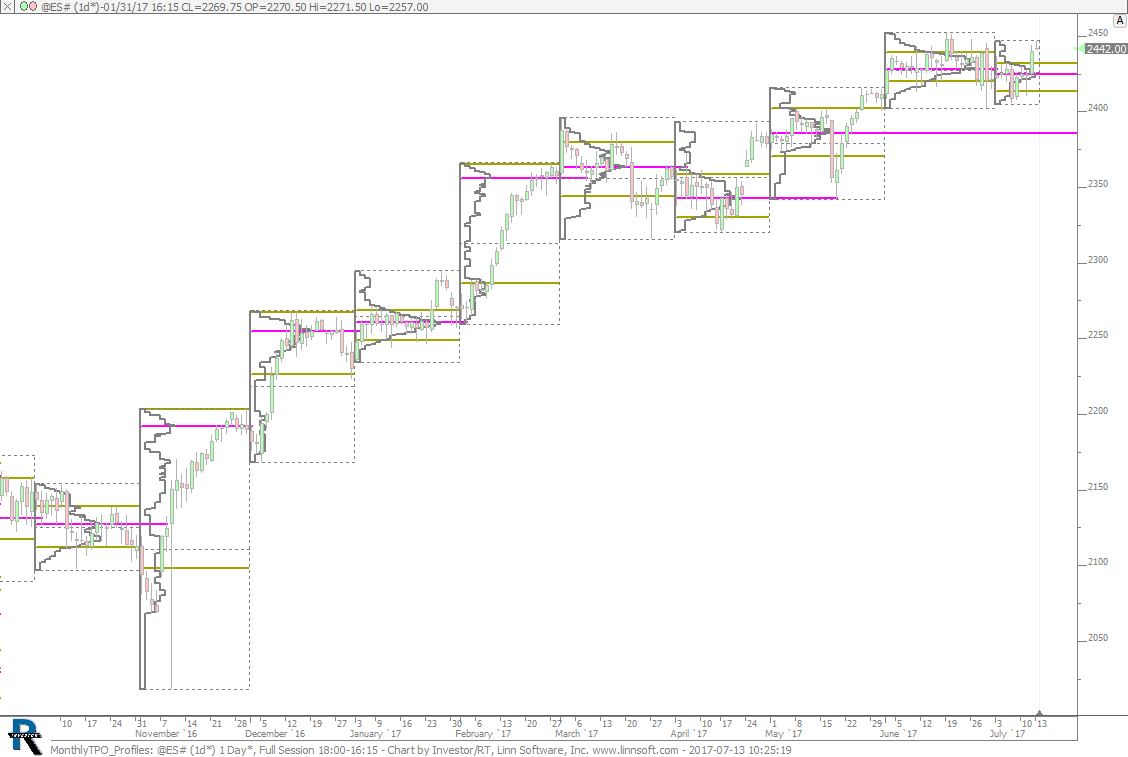 |
MonthlyTPO Profiles (@ES#) cpayne [totalcount]
9 years 3 days ago
Monthly TPO Chart. This chart was uploaded by Investor/RT 12.7.7 showing symbol: @ES#. |
View |
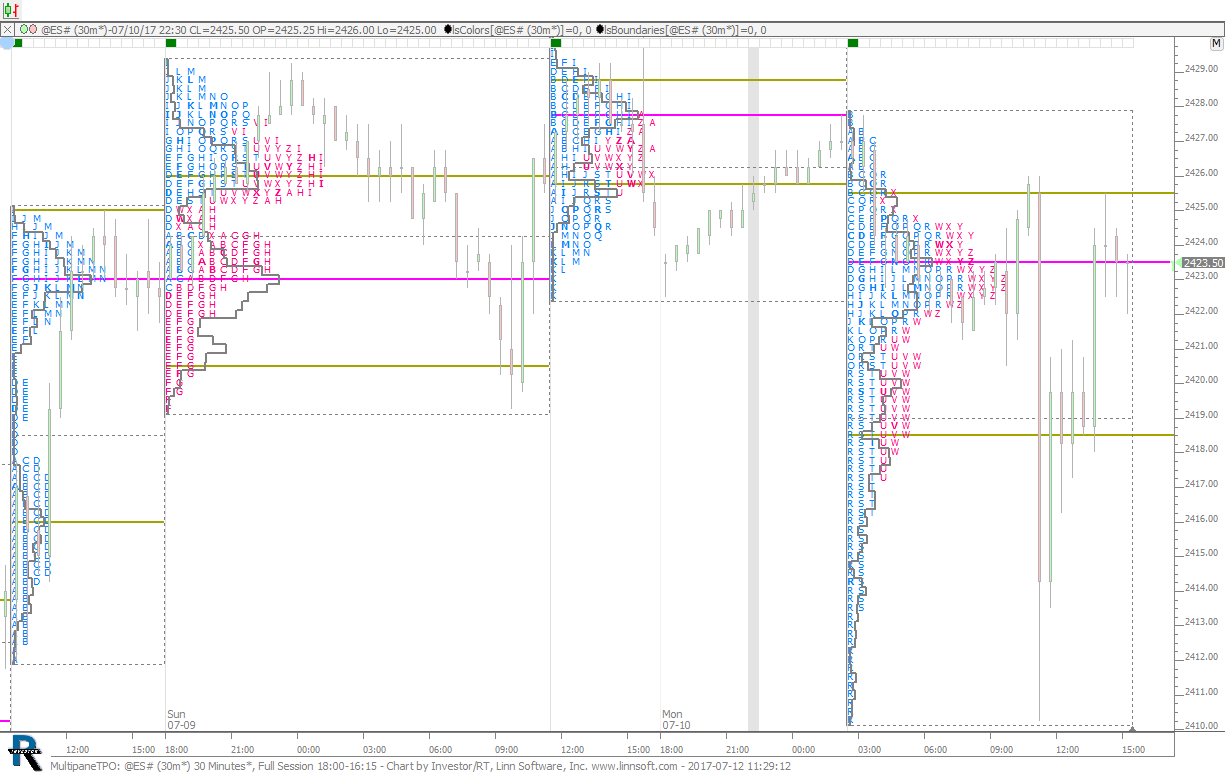 |
MultipaneTPO (@ES#) cpayne [totalcount]
9 years 4 days ago
TPO Candle Chart. This chart was uploaded by Investor/RT 12.7.7 showing symbol: @ES#. |
View |
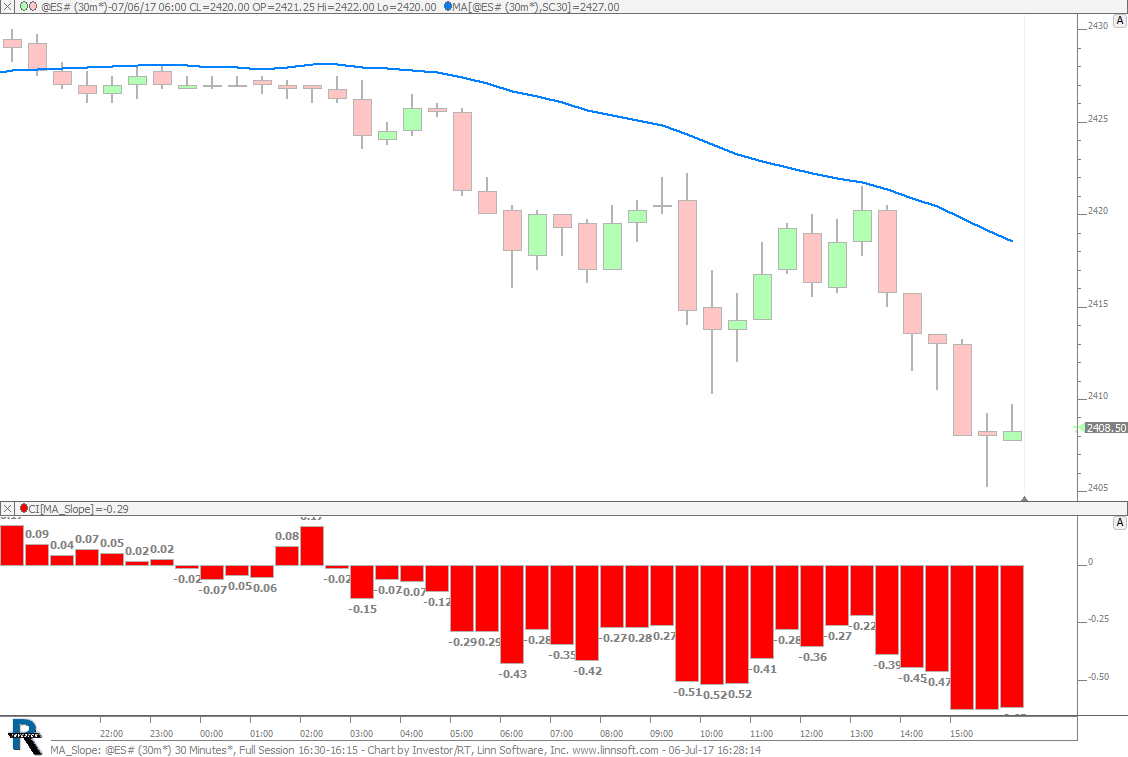 |
MA Slope (@ES#) cpayne [totalcount]
9 years 1 week ago
MA Slope. This chart was uploaded by Investor/RT 12.7.7 showing symbol: @ES#. |
View |
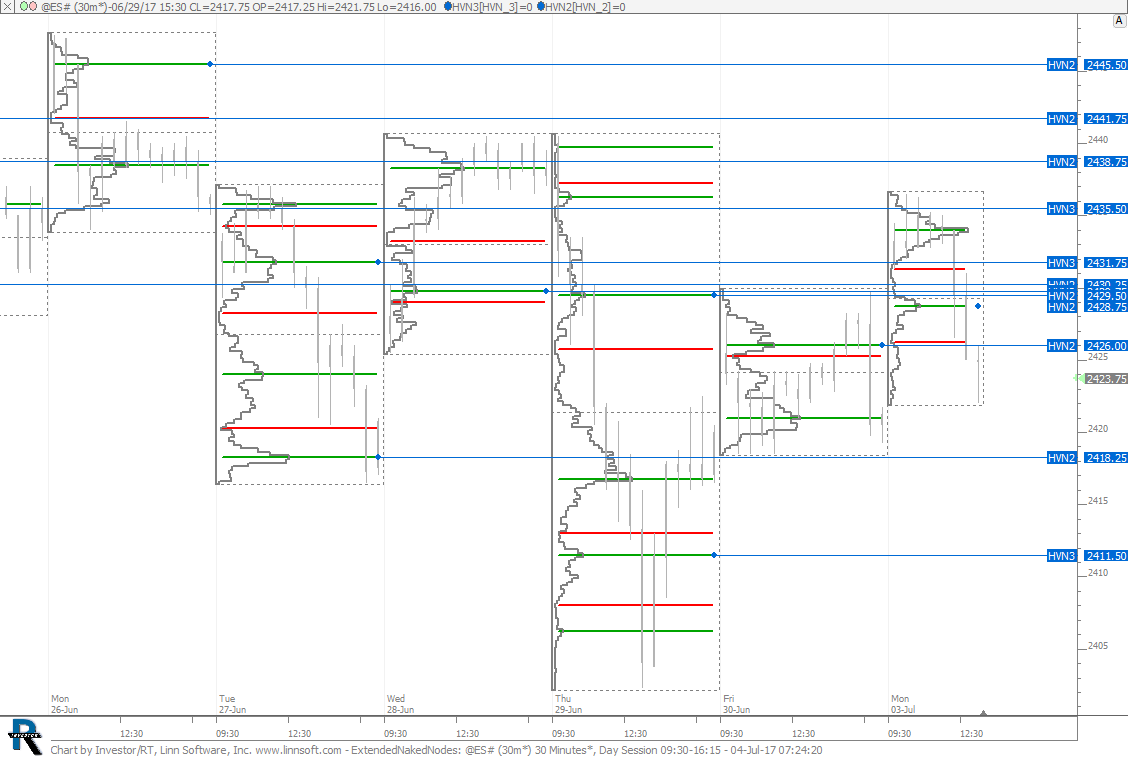 |
ExtendedNakedNodes (@ES#) cpayne [totalcount]
9 years 1 week ago
Extended Naked Nodes. This chart was uploaded by Investor/RT 12.7.6 showing symbol: @ES#. |
View |
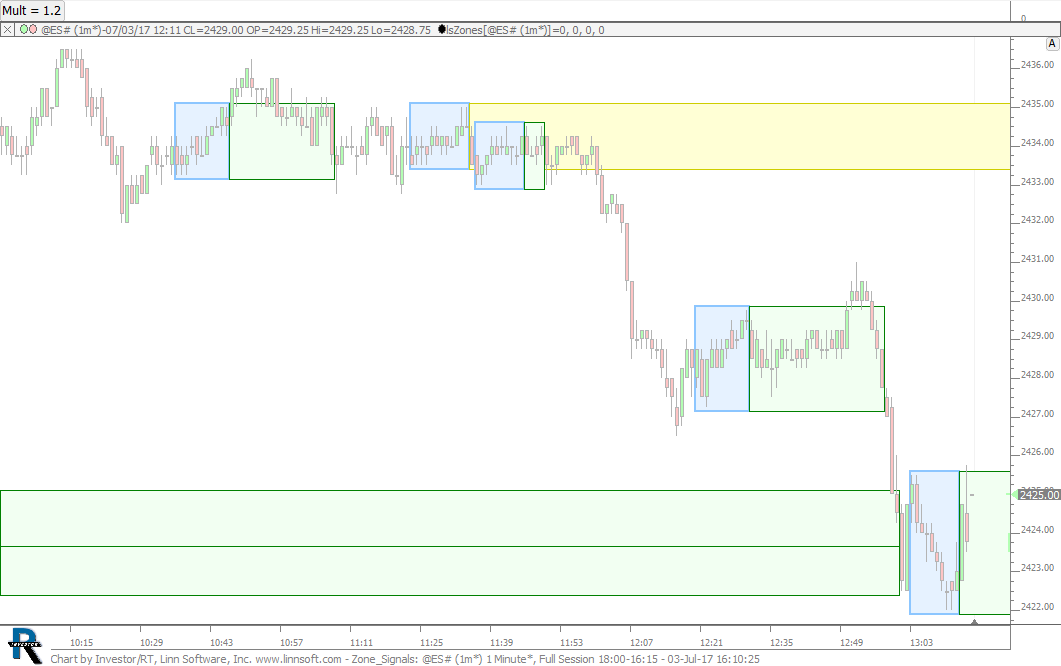 |
Zone Signals (@ES#) cpayne [totalcount]
9 years 1 week ago
Zones 2.6 with option to draw zones for consecutive signal bars. In chart above, the signal is "Range less than 1.2 * True Range" with 1.2 adjustable with button. |
View |
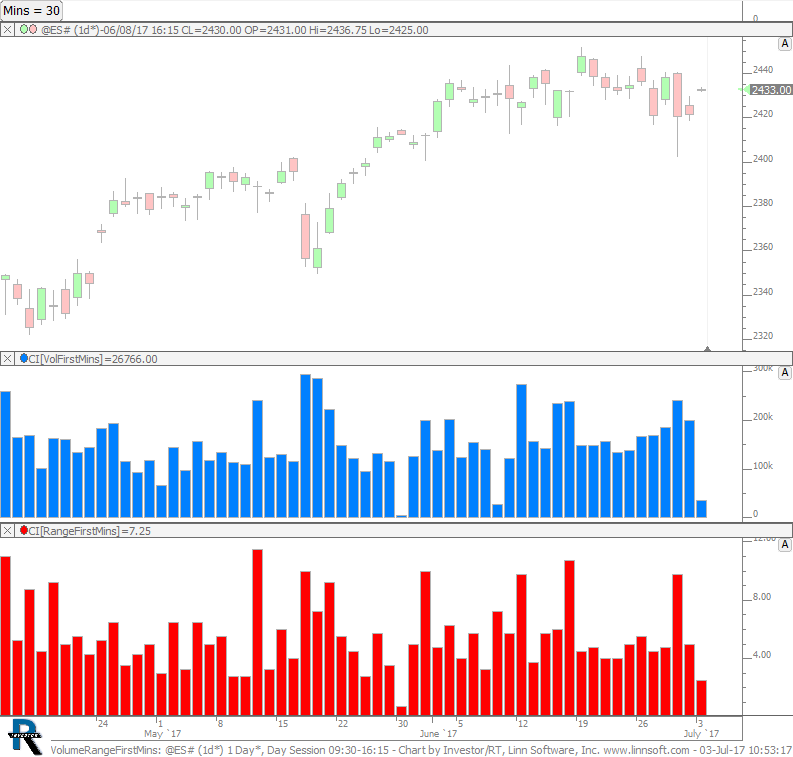 |
VolumeRangeFirstMins (@ES#) cpayne [totalcount]
9 years 1 week ago
Volume of Range of 1st X Minutes of Session - Controlled by Button. This chart was uploaded by Investor/RT 12.7.7 showing symbol: @ES#. |
View |
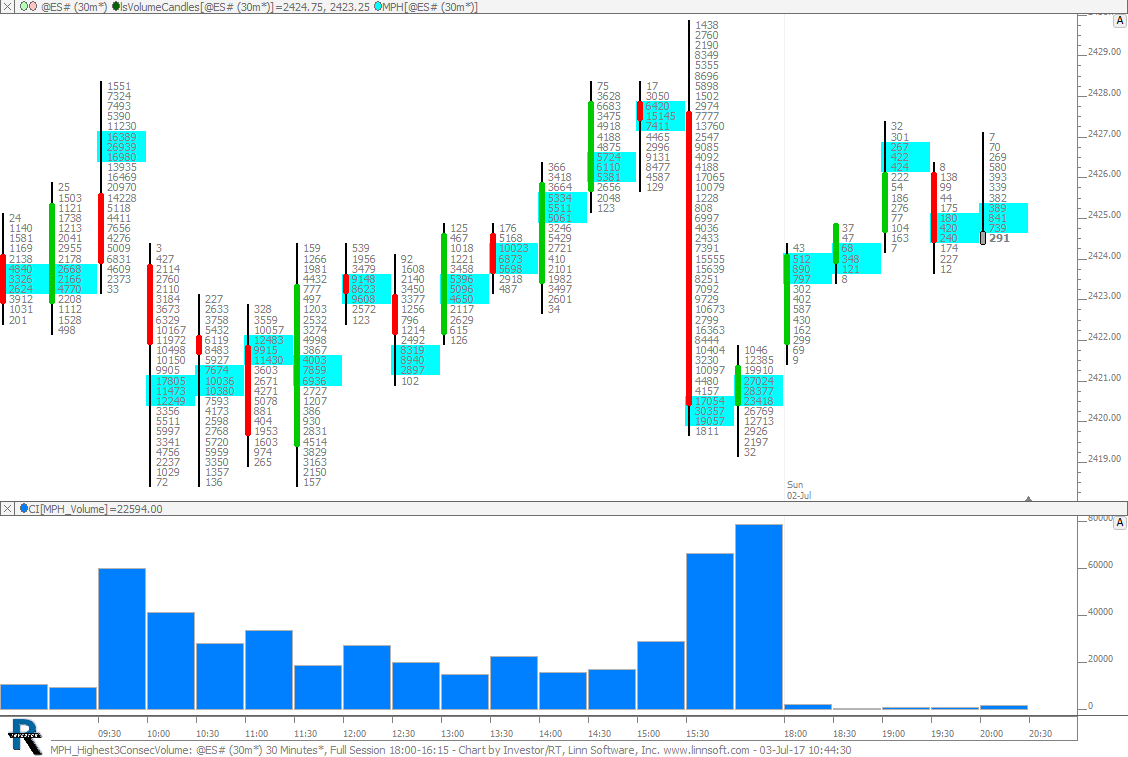 |
MPH Highest3ConsecVolume (@ES#) cpayne [totalcount]
9 years 1 week ago
Volume of Highest 3 Consecutive Volume Prices. This chart was uploaded by Investor/RT 12.7.7 showing symbol: @ES#. |
View |
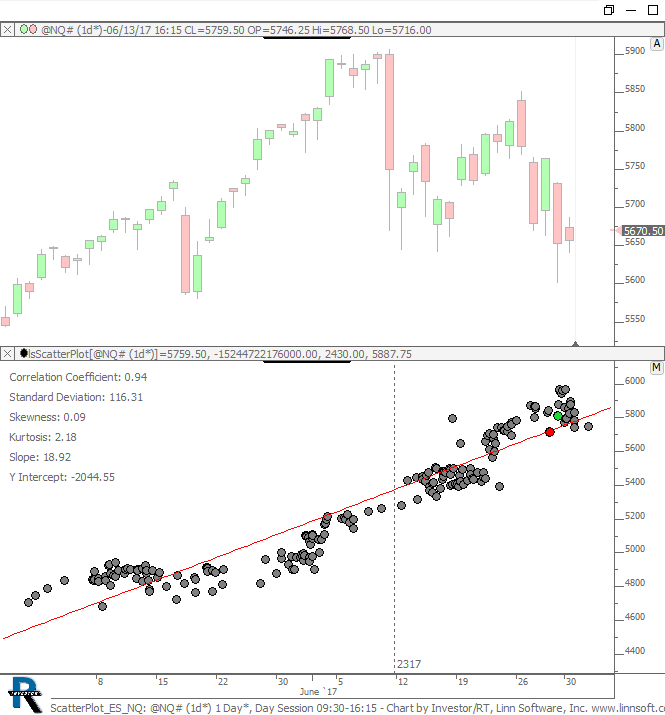 |
ScatterPlot ES NQ (@NQ#) cpayne [totalcount]
9 years 1 week ago
Scatter Plot NQ vs ES. This chart was uploaded by Investor/RT 12.7.7 showing symbol: @NQ#. |
View |
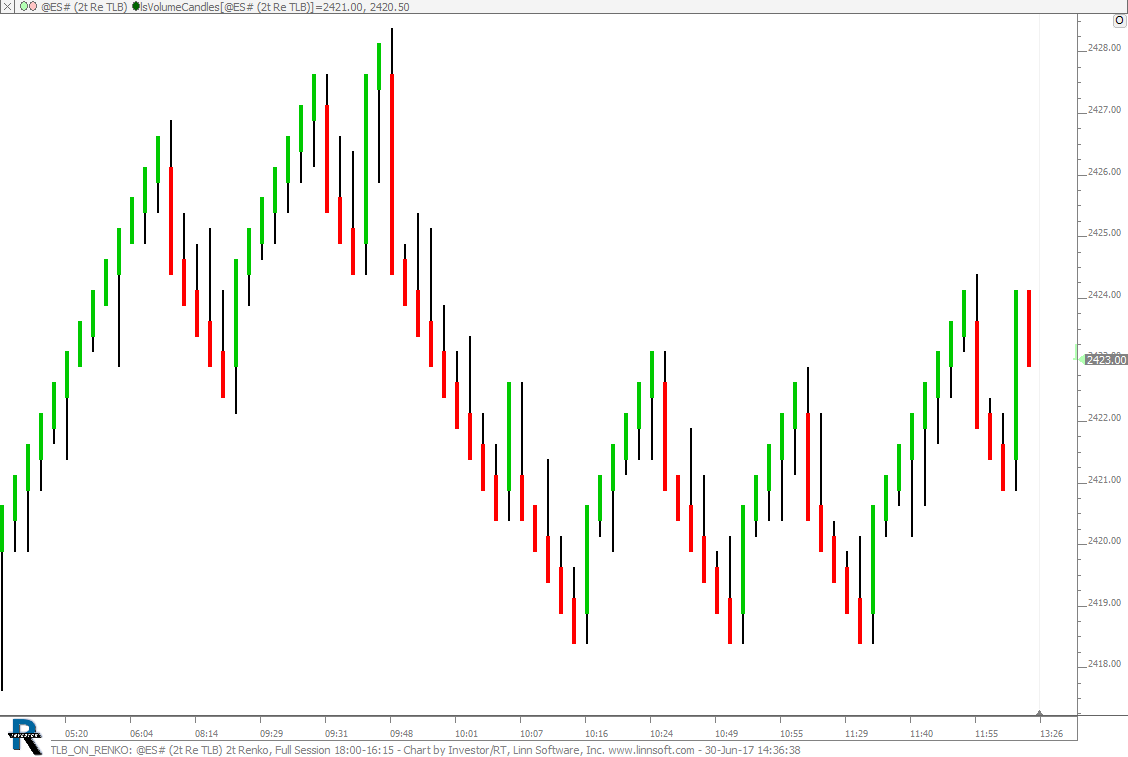 |
TLB ON RENKO (@ES#) cpayne [totalcount]
9 years 2 weeks ago
Three Line Break chart applied to Renko Data. This chart was uploaded by Investor/RT 12.7.7 showing symbol: @ES#. |
View |
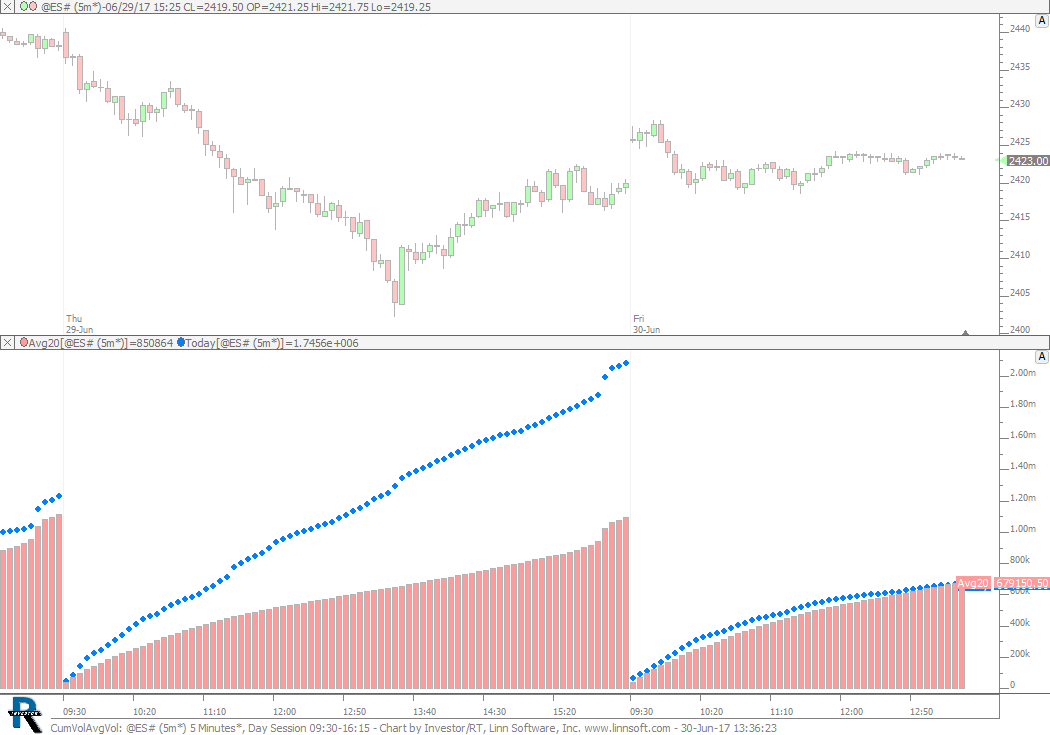 |
CumVolAvgVol (@ES#) cpayne [totalcount]
9 years 2 weeks ago
Todays Cumulative Volume Vs 20 Day Avg at Time of Day. This chart was uploaded by Investor/RT 12.7.7 showing symbol: @ES#. |
View |
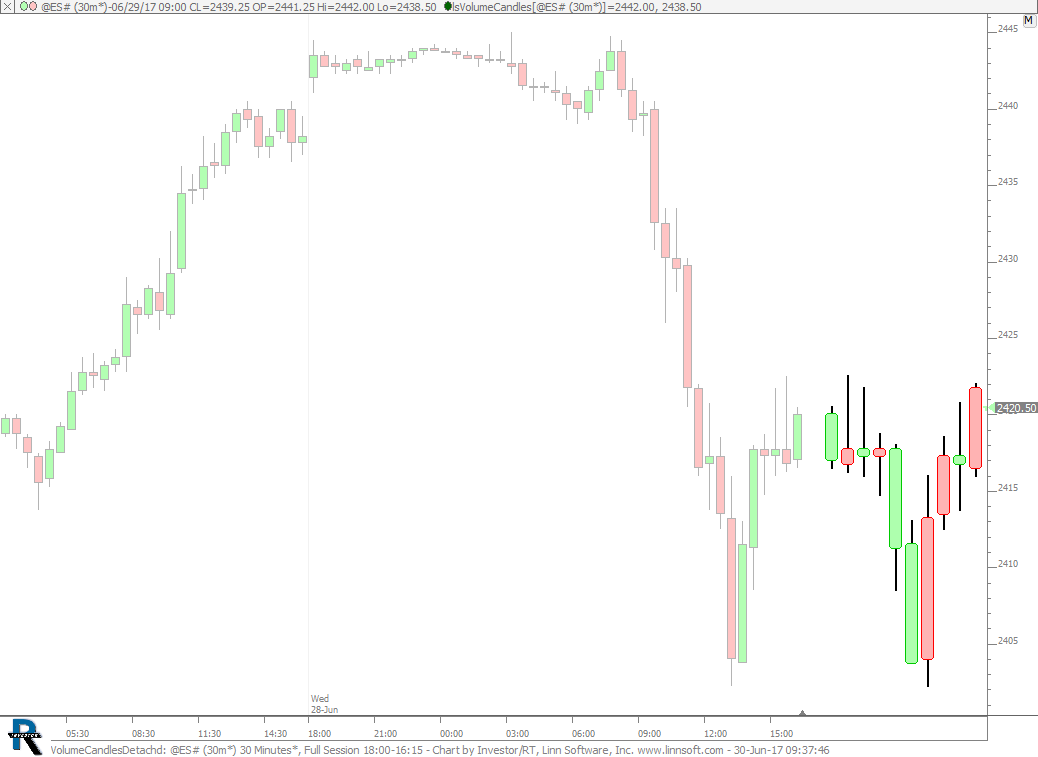 |
VolumeCandlesDetachd (@ES#) cpayne [totalcount]
9 years 2 weeks ago
Volume Candles - Detached Bars. This chart was uploaded by Investor/RT 12.7.7 showing symbol: @ES#. |
View |
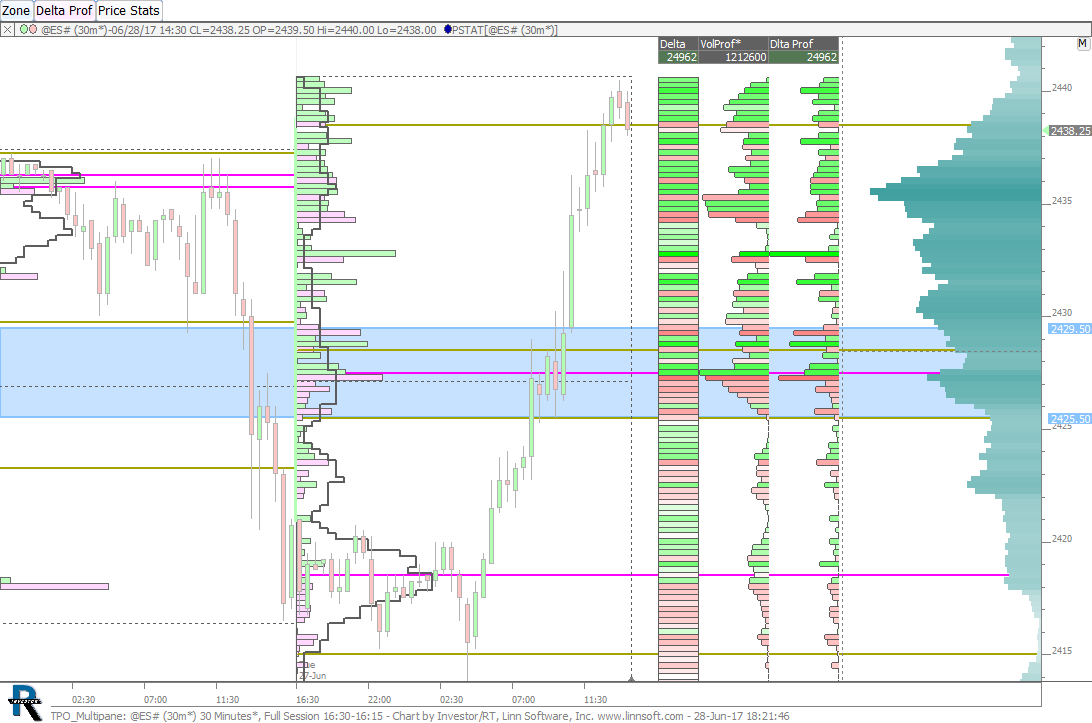 |
TPO MultiPane (@ES#) cpayne [totalcount]
9 years 2 weeks ago
TPO - MultiPane. This chart was uploaded by Investor/RT 12.7.2 showing symbol: @ES#. |
View |
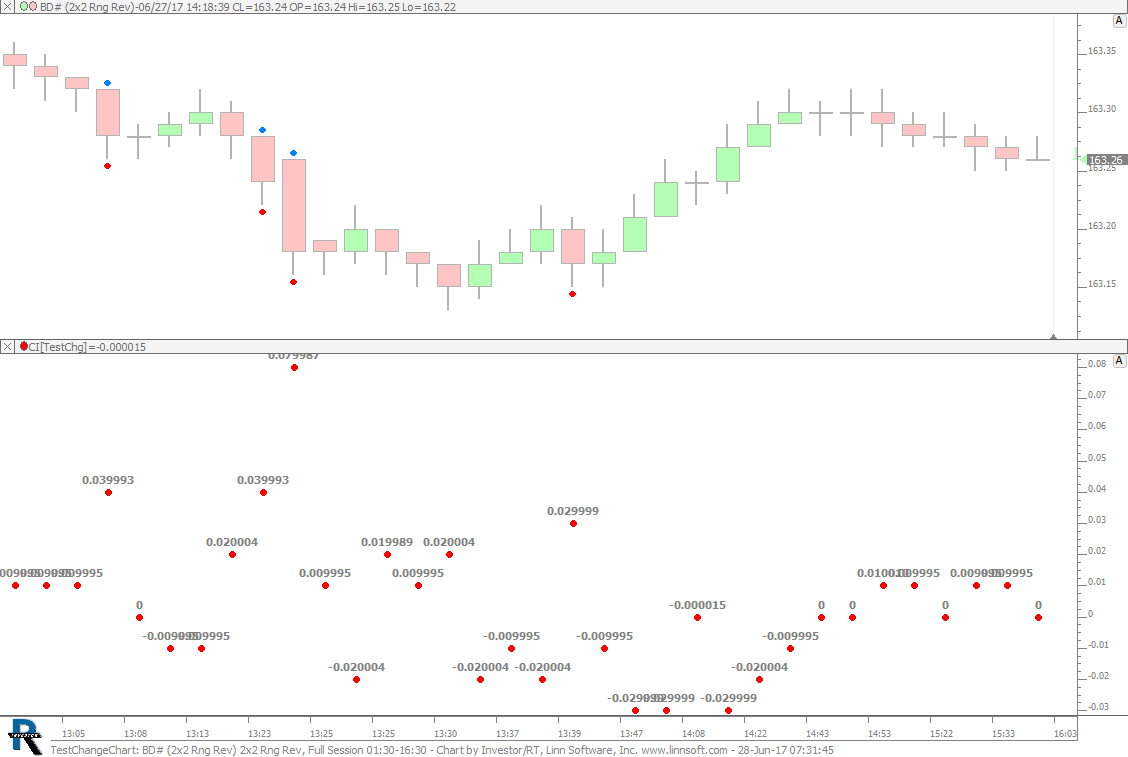 |
TestChangeChart (BD#) cpayne [totalcount]
9 years 2 weeks ago
This chart was uploaded by Investor/RT 12.7.7 showing symbol: BD#. |
View |
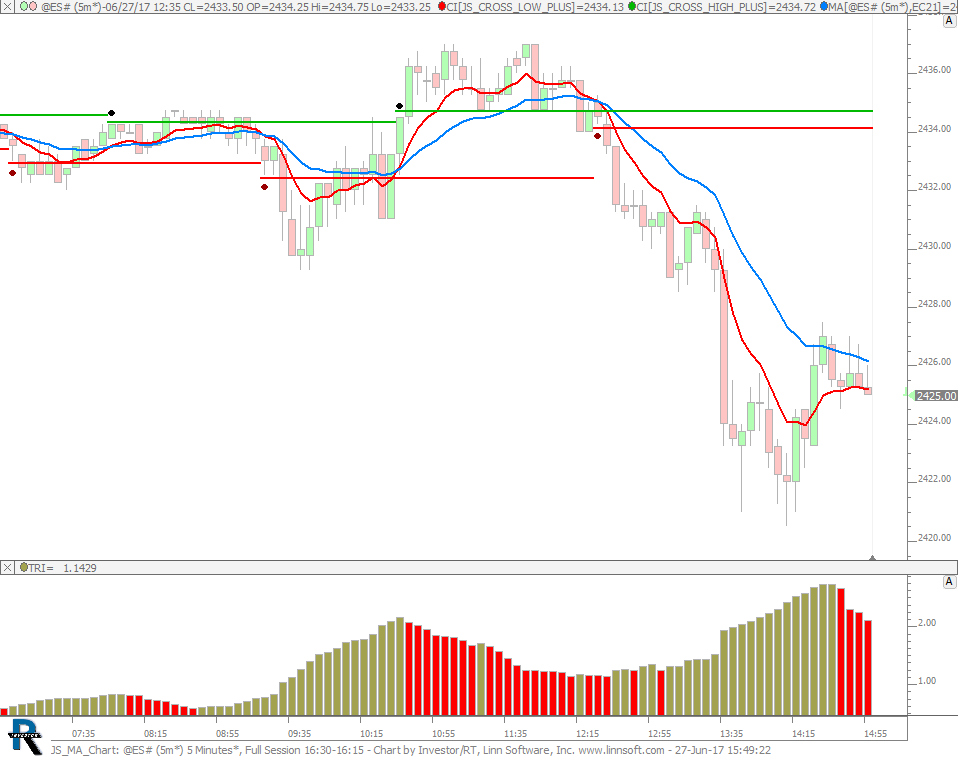 |
JS MA Chart (@ES#) cpayne [totalcount]
9 years 2 weeks ago
This chart was uploaded by Investor/RT 12.7.6 showing symbol: @ES#. |
View |
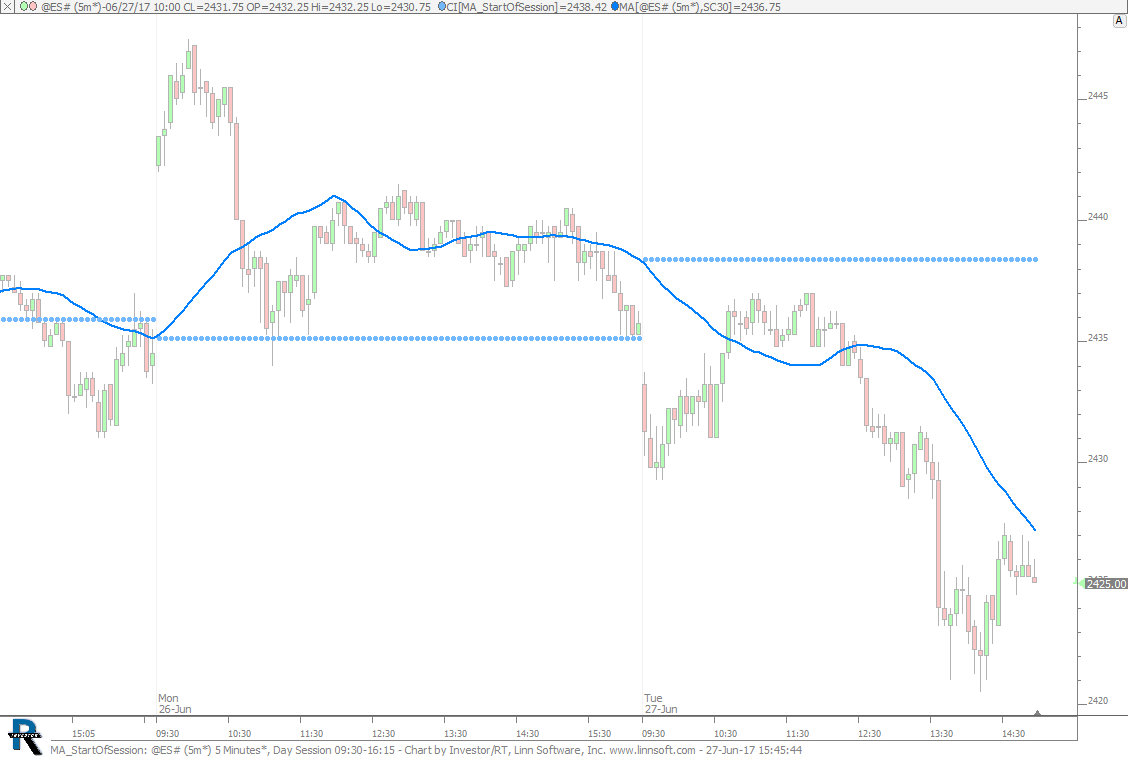 |
MA StartOfSession (@ES#) cpayne [totalcount]
9 years 2 weeks ago
Referencing Indicator Value at Start of Session. This chart was uploaded by Investor/RT 12.7.7 showing symbol: @ES#. |
View |
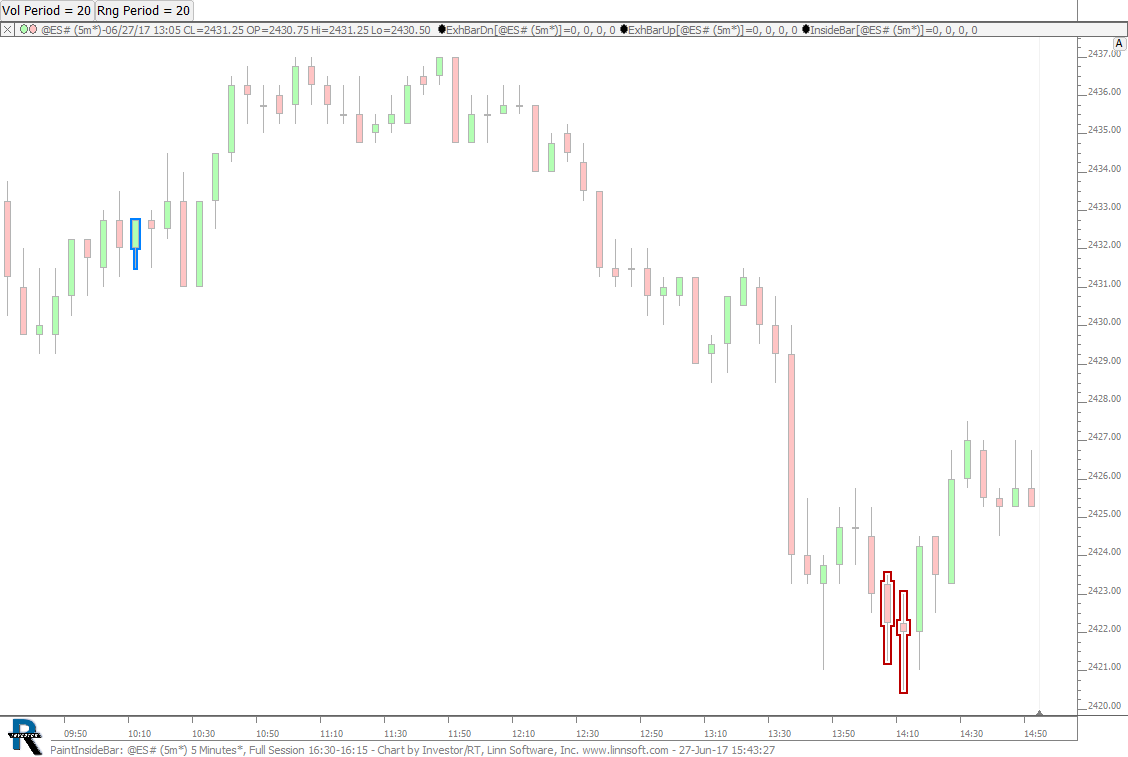 |
PaintInsideBar (@ES#) cpayne [totalcount]
9 years 2 weeks ago
Painted Candles - Inside Bar. This chart was uploaded by Investor/RT 12.7.7 showing symbol: @ES#. |
View |
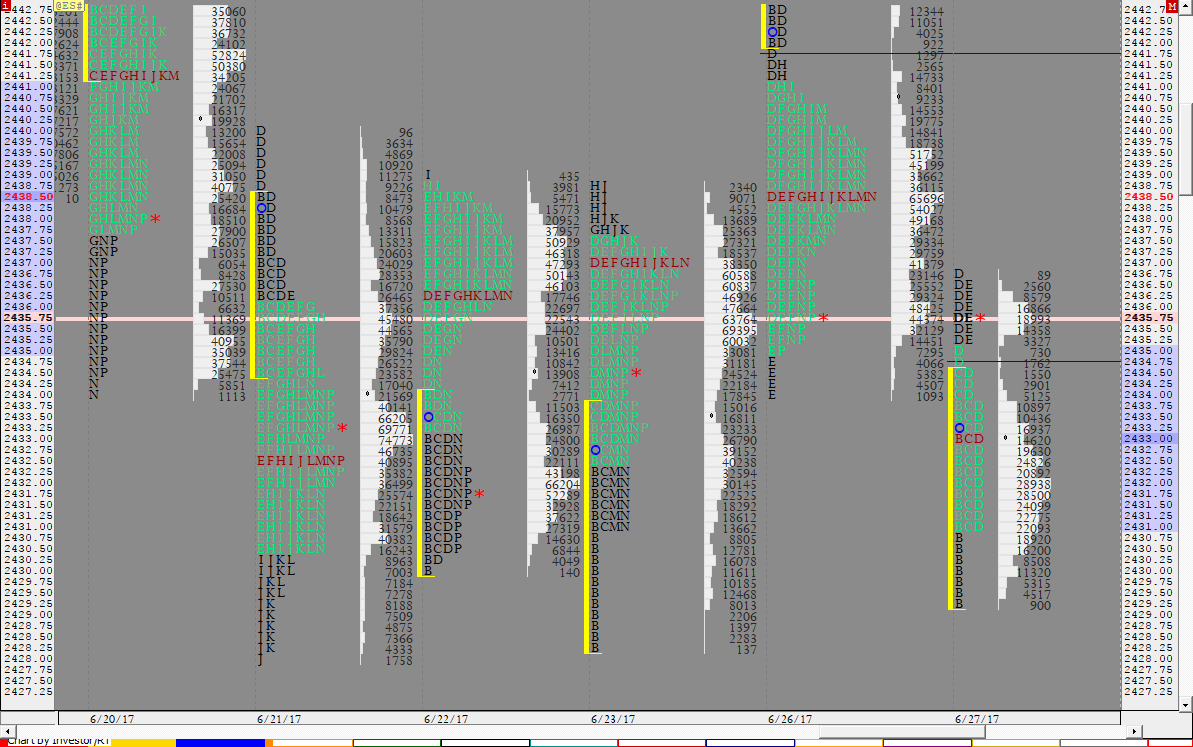 |
TPO CHART VOL TEXT (@ES#) cpayne [totalcount]
9 years 2 weeks ago
TPO Chart (Standalone). This chart was uploaded by Investor/RT 12.7.7 showing symbol: @ES#. |
View |
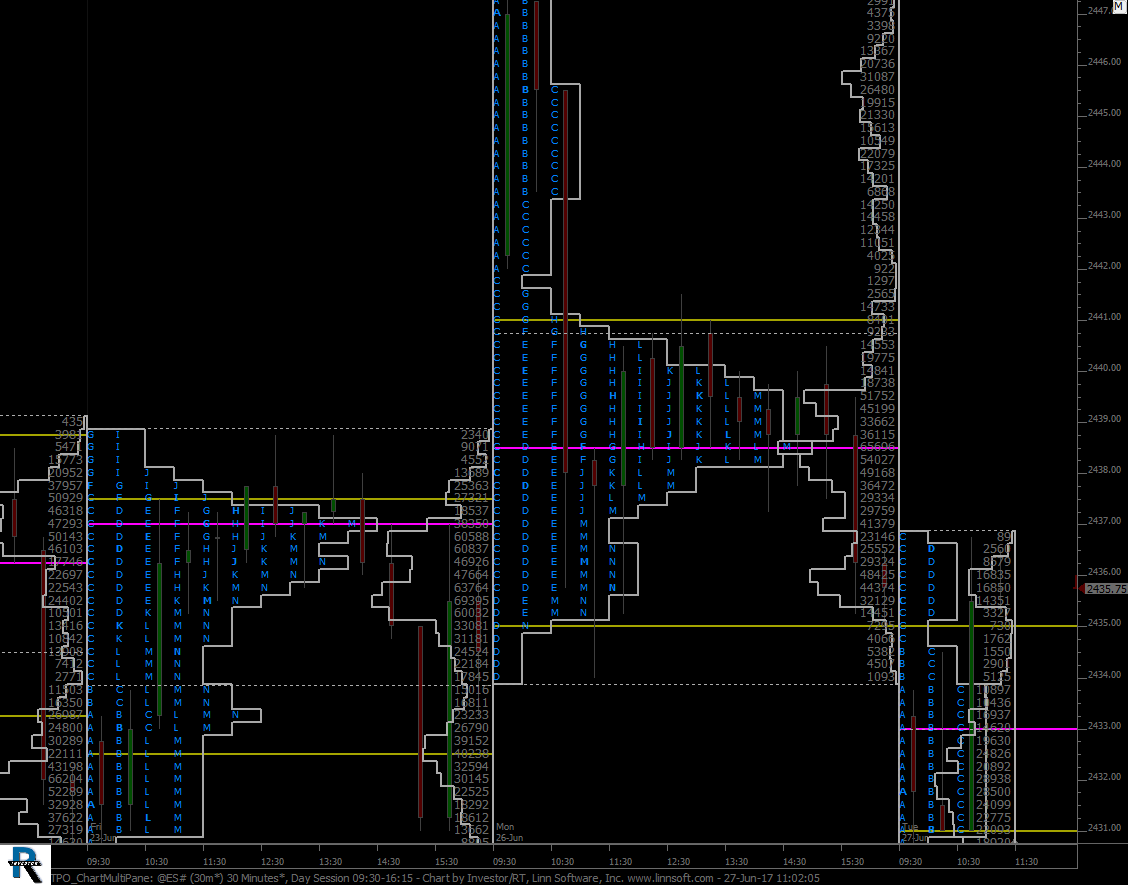 |
TPO ChartMultiPane (@ES#) cpayne [totalcount]
9 years 2 weeks ago
TPO Charts via Profile Indicator. This chart was uploaded by Investor/RT 12.7.7 showing symbol: @ES#. |
View |