 |
FT71 PivotStrategyAnalysis (@ES#) cpayne [totalcount]
9 years 1 month ago
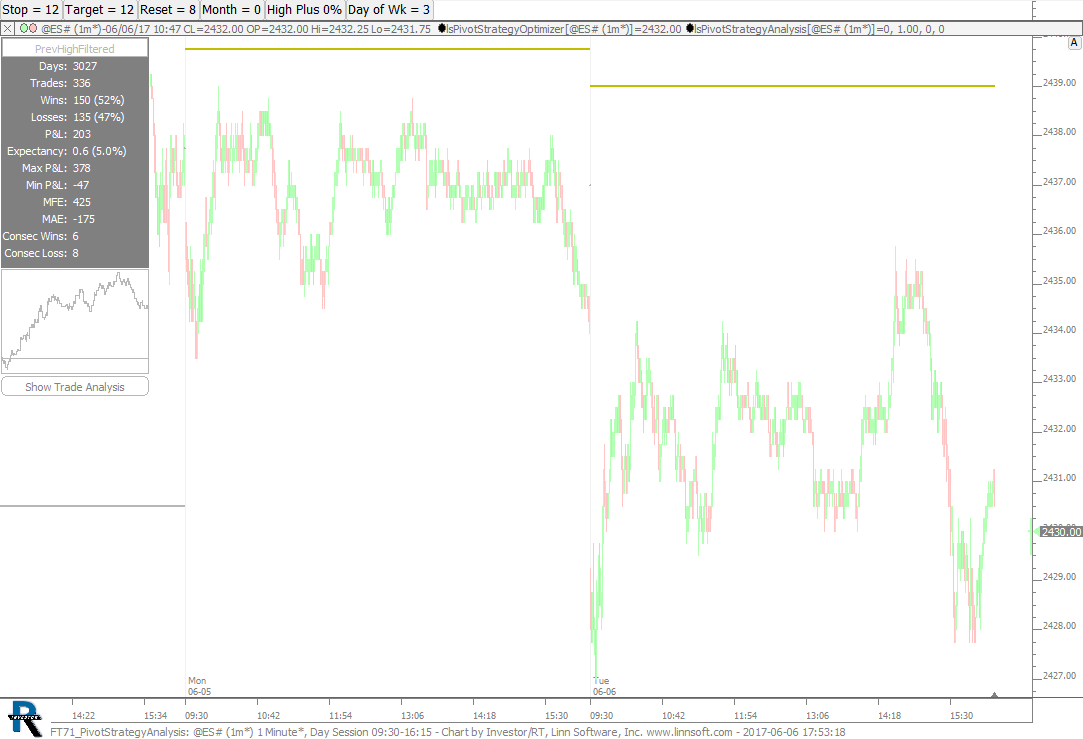
PivotStrategyAnalysis and PivotStrategyOptimizer chart used in FuturesTrader71 Webinar on June 6, 2017. This chart was uploaded by Investor/RT 12.7.5 showing symbol: @ES#. |
View |
 |
FT71 Colors (@ES#) cpayne [totalcount]
9 years 1 month ago
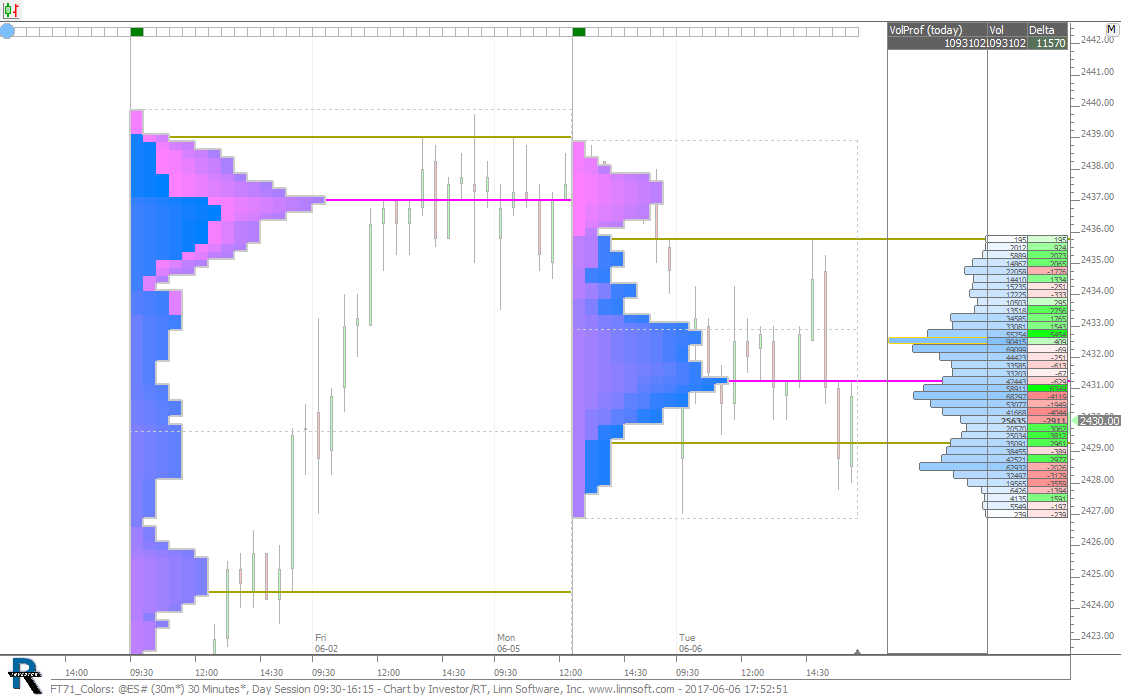
Colors chart used in FuturesTrader71 Webinar on June 6, 2017. This chart was uploaded by Investor/RT 12.7.5 showing symbol: @ES#. |
View |
 |
FT71 Boundaries (@ES#) cpayne [totalcount]
9 years 1 month ago
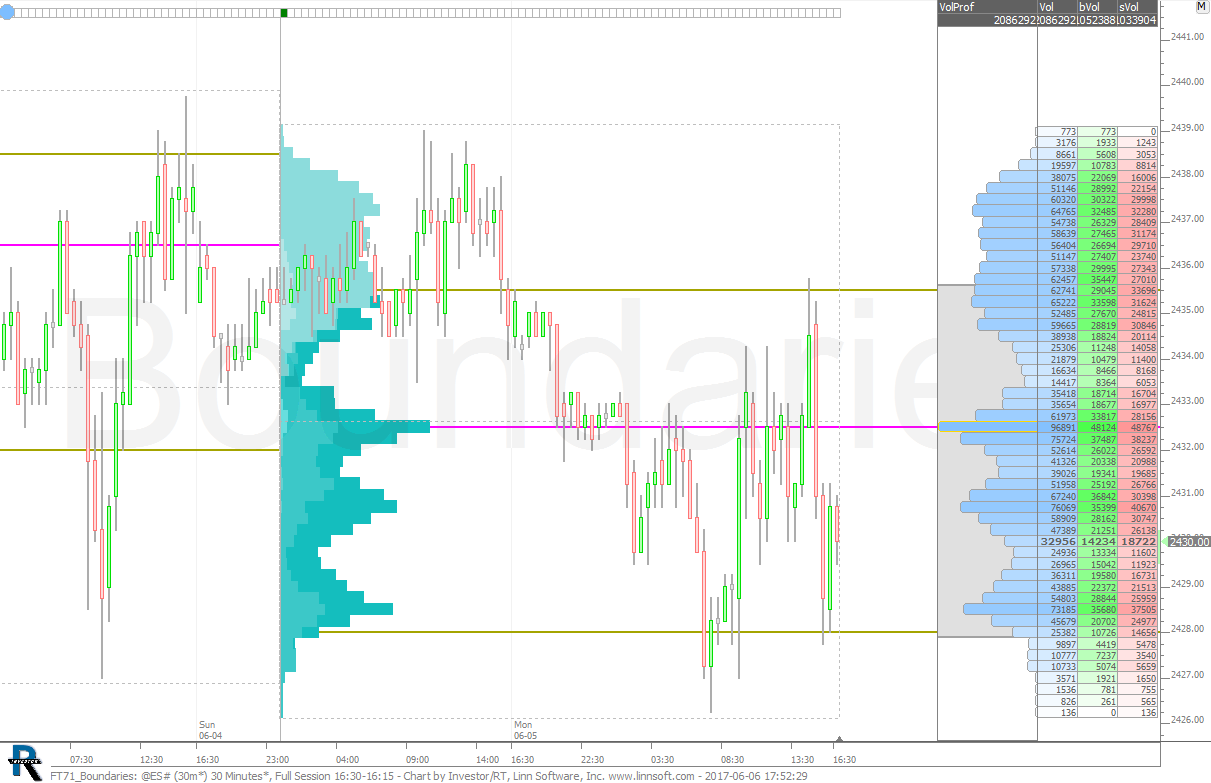
Boundaries chart used in FuturesTrader71 Webinar on June 6, 2017. This chart was uploaded by Investor/RT 12.7.5 showing symbol: @ES#. |
View |
 |
FT71 PaintIndicators (@ES#) cpayne [totalcount]
9 years 1 month ago
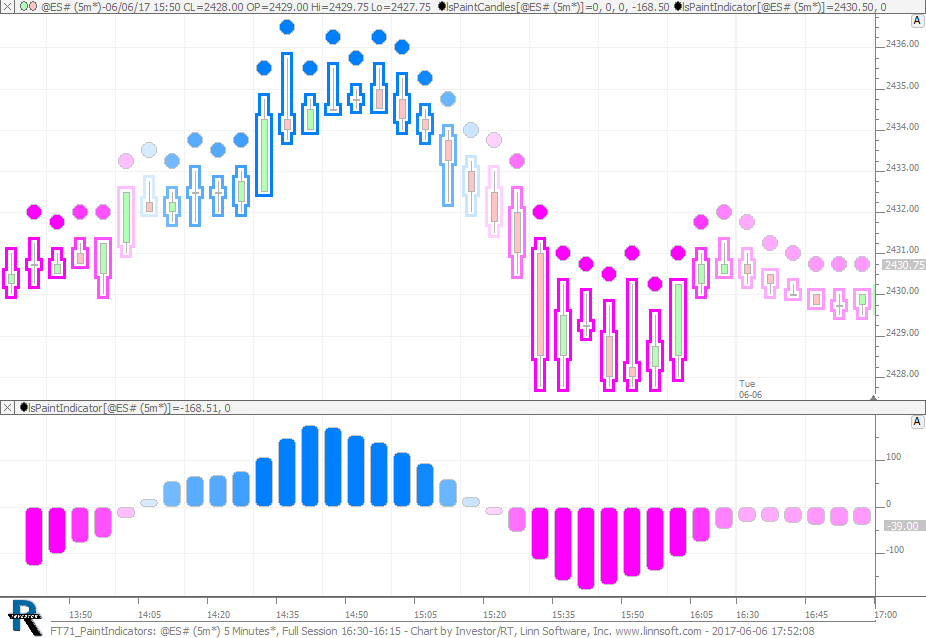
PaintCandle and PaintIndicator chart used in FuturesTrader71 Webinar on June 6, 2017. This chart was uploaded by Investor/RT 12.7.5 showing symbol: @ES#. |
View |
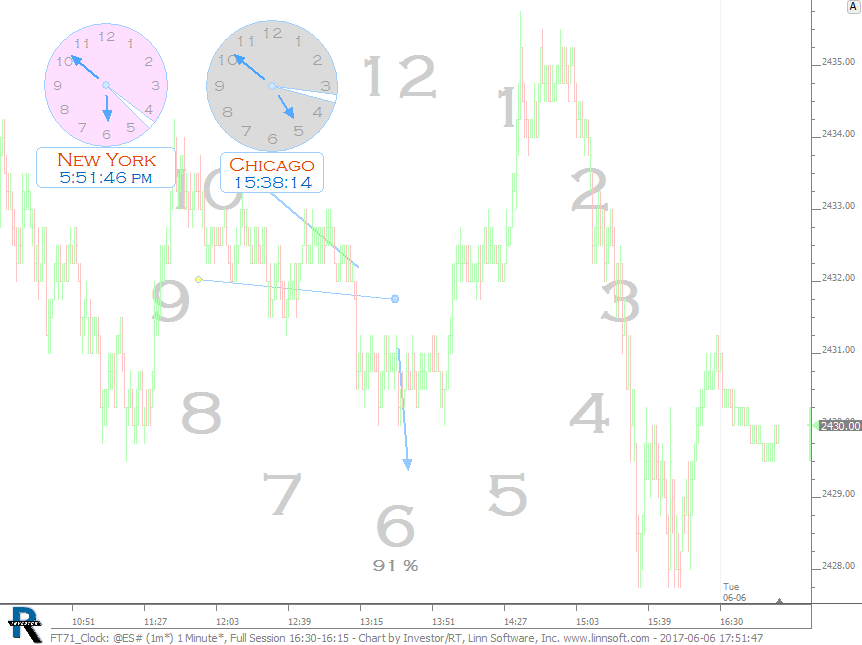 |
FT71 Clock (@ES#) cpayne [totalcount]
9 years 1 month ago
Clock chart used in FuturesTrader71 Webinar on June 6, 2017. This chart was uploaded by Investor/RT 12.7.5 showing symbol: @ES#. |
View |
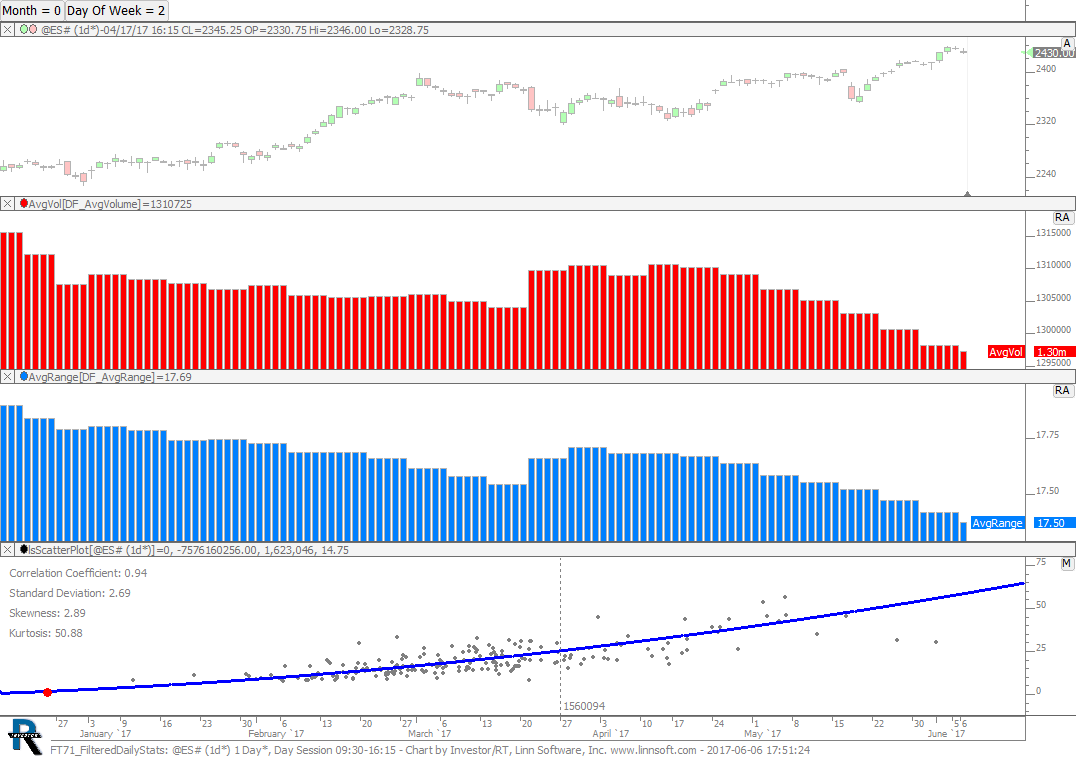 |
FT71 FilteredDailyStats (@ES#) cpayne [totalcount]
9 years 1 month ago
Filtered Data Statistics chart used in FuturesTrader71 Webinar on June 6, 2017. This chart was uploaded by Investor/RT 12.7.5 showing symbol: @ES#. |
View |
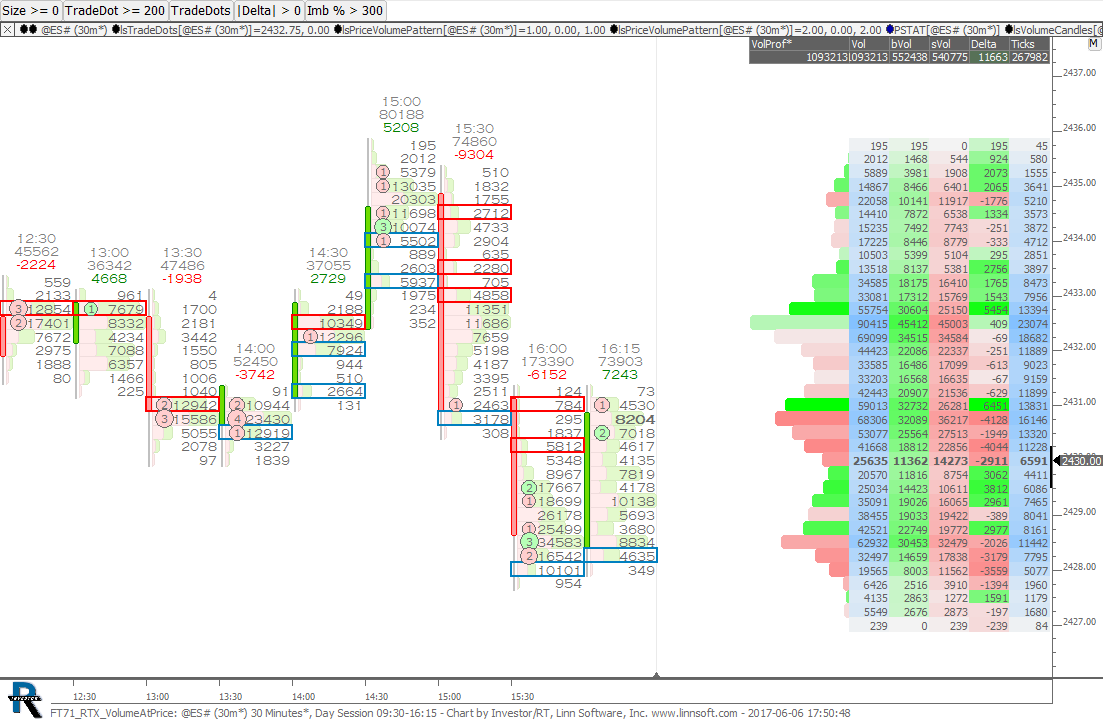 |
FT71 RTX VolumeAtPrice (@ES#) cpayne [totalcount]
9 years 1 month ago
VolumeAtPrice chart used in FuturesTrader71 Webinar on June 6, 2017. This chart was uploaded by Investor/RT 12.7.5 showing symbol: @ES#. |
View |
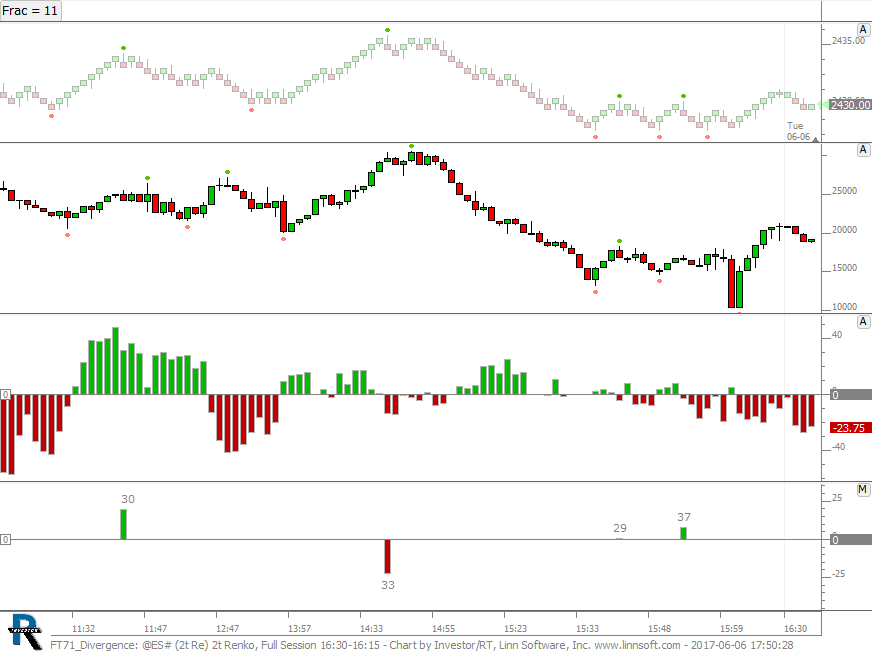 |
FT71 Divergence (@ES#) cpayne [totalcount]
9 years 1 month ago
Divergence chart used in FuturesTrader71 Webinar on June 6, 2017. This chart was uploaded by Investor/RT 12.7.5 showing symbol: @ES#. |
View |
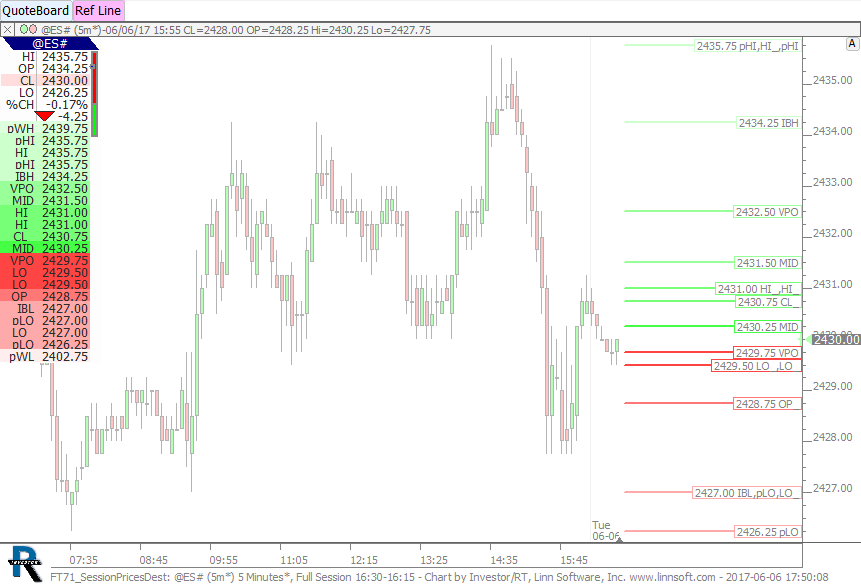 |
FT71 SessionPricesDest (@ES#) cpayne [totalcount]
9 years 1 month ago
SessionPrices Destination chart used in FuturesTrader71 Webinar on June 6, 2017. This chart was uploaded by Investor/RT 12.7.5 showing symbol: @ES#. |
View |
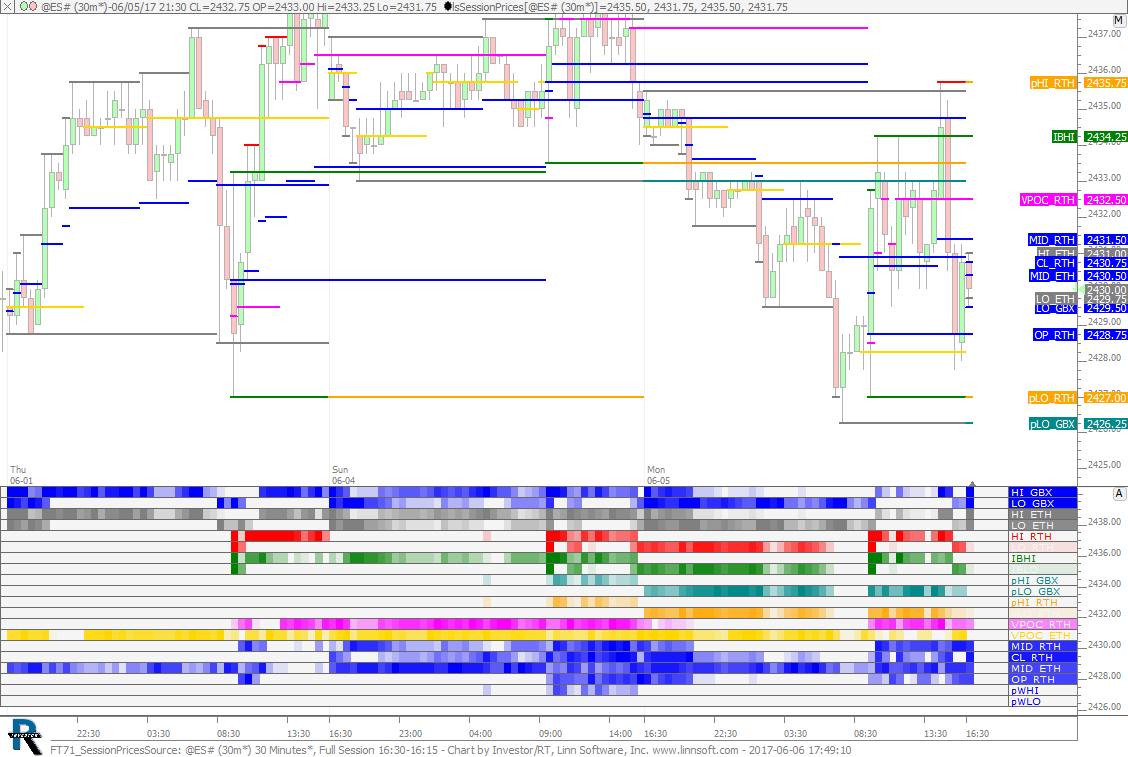 |
FT71 SessionPricesSource (@ES#) cpayne [totalcount]
9 years 1 month ago
SessionPrices chart used in FuturesTrader71 Webinar on June 6, 2017. This chart was uploaded by Investor/RT 12.7.5 showing symbol: @ES#. |
View |
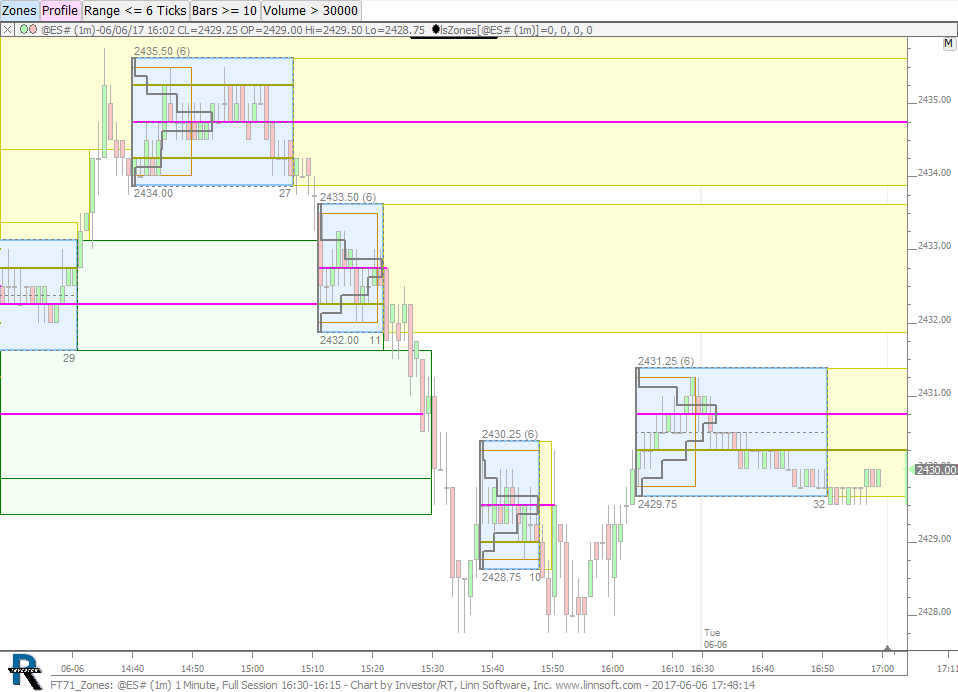 |
FT71 Zones (@ES#) cpayne [totalcount]
9 years 1 month ago
Zones chart used in FuturesTrader71 Webinar on June 6, 2017. This chart was uploaded by Investor/RT 12.7.5 showing symbol: @ES#. |
View |
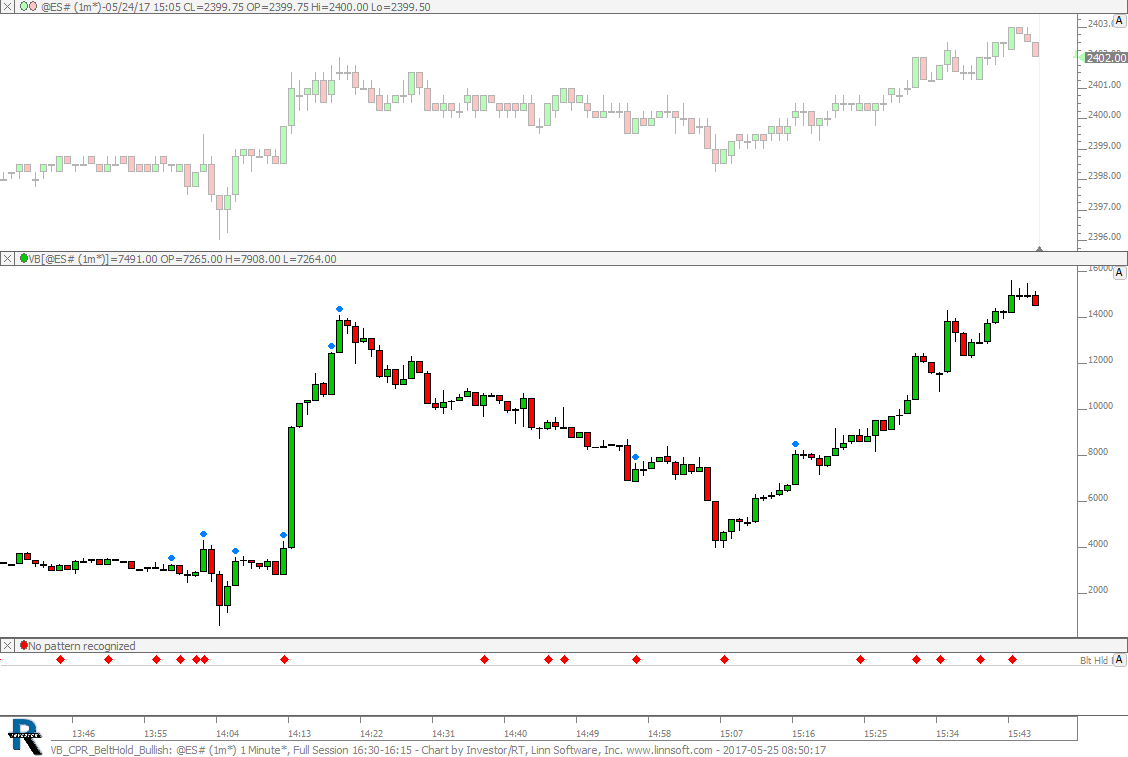 |
VB CPR BeltHold Bullish (@ES#) cpayne [totalcount]
9 years 1 month ago
Candlestick Pattern Recognition on Volume Breakdown. This chart was uploaded by Investor/RT 12.7.3 showing symbol: @ES#. |
View |
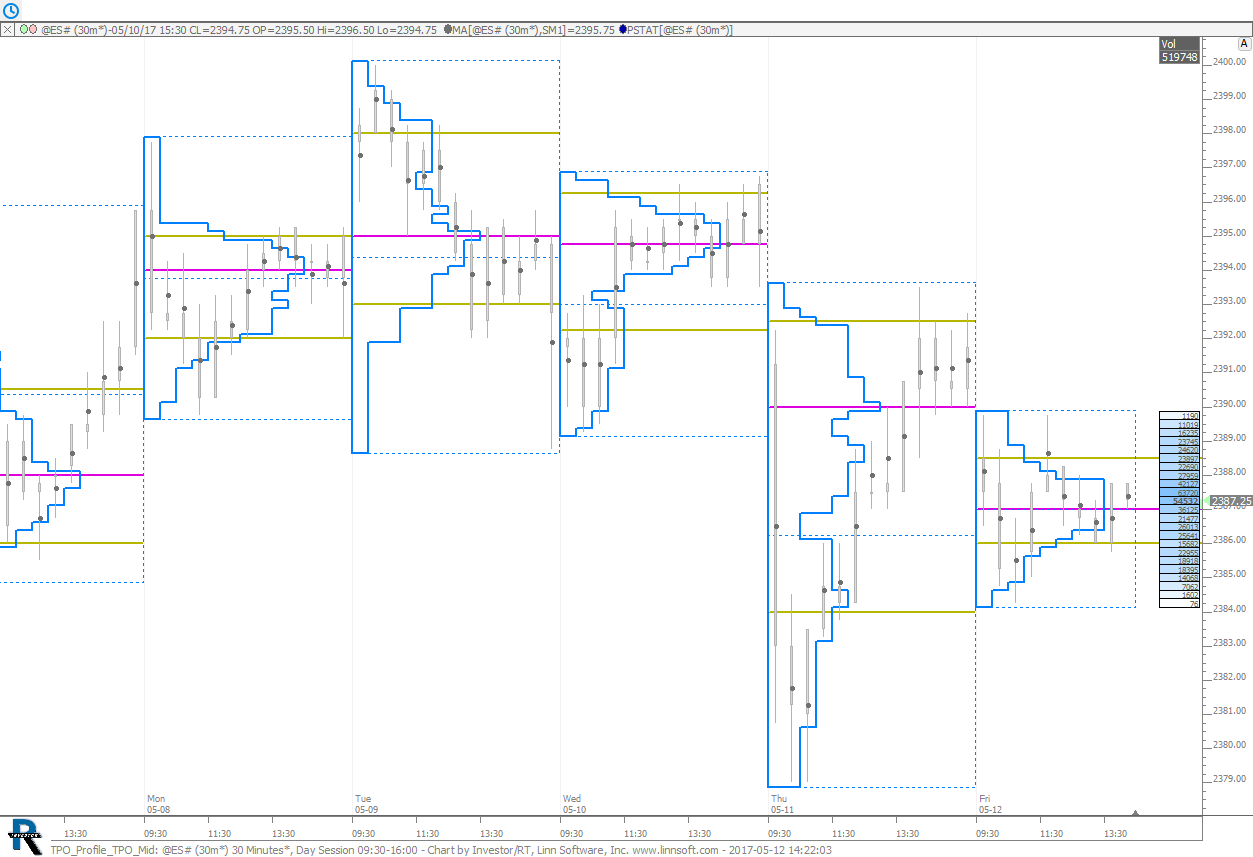 |
TPO Profile TPO Mid (@ES#) cpayne [totalcount]
9 years 2 months ago
TPO Profile with mid of each bracket marked. This chart was uploaded by Investor/RT 12.7.3 showing symbol: @ES#. |
View |
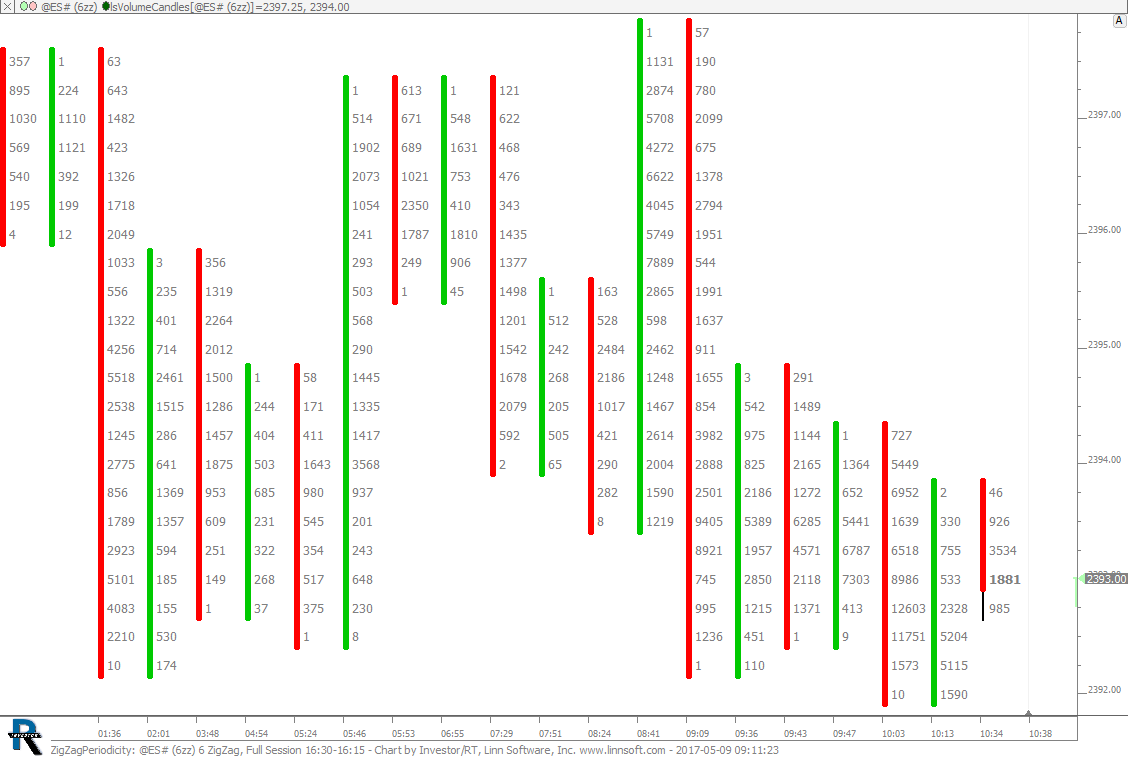 |
ZigZagPeriodicity (@ES#) cpayne [totalcount]
9 years 2 months ago
Zig Zag Periodicity. This chart was uploaded by Investor/RT 12.7.3 showing symbol: @ES#. |
View |
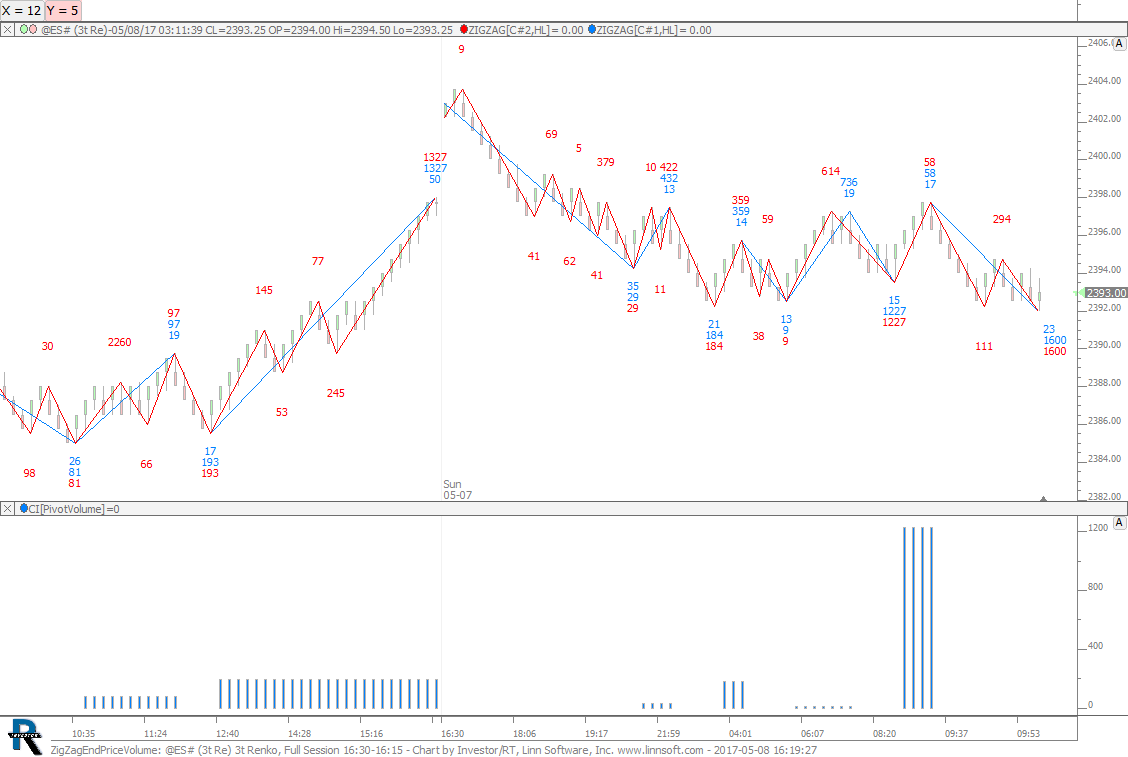 |
ZigZagEndPriceVolume (@ES#) cpayne [totalcount]
9 years 2 months ago
End Price Volume. This chart was uploaded by Investor/RT 12.7.3 showing symbol: @ES#. |
View |
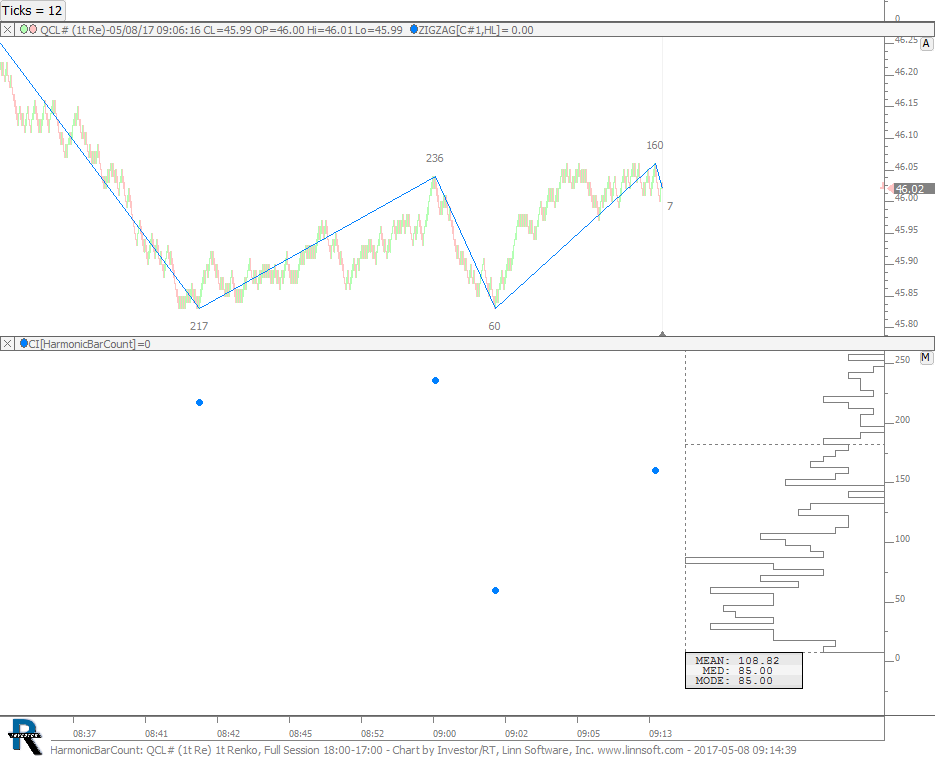 |
HarmonicBarCount (QCL#) cpayne [totalcount]
9 years 2 months ago
Harmonic Bar Count. This chart was uploaded by Investor/RT 12.7.3 showing symbol: QCL#. |
View |
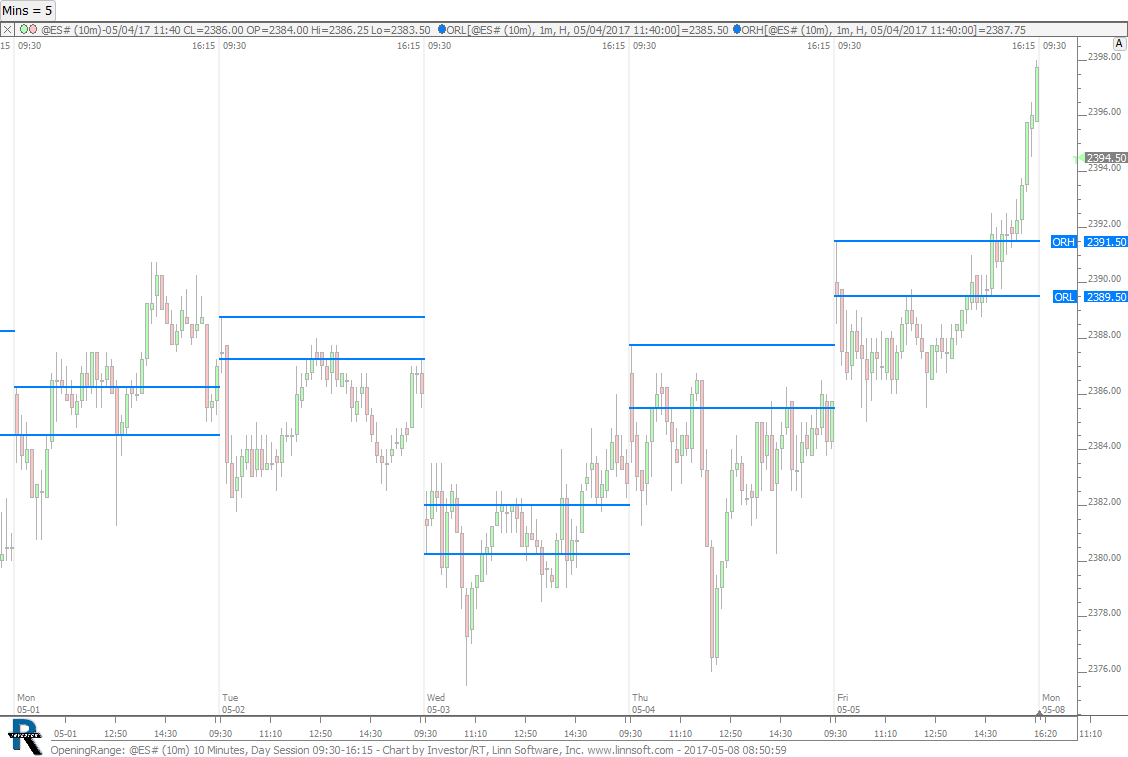 |
OpeningRange (@ES#) cpayne [totalcount]
9 years 2 months ago
Opening Range System. This chart was uploaded by Investor/RT 12.6.1 showing symbol: @ES#. |
View |
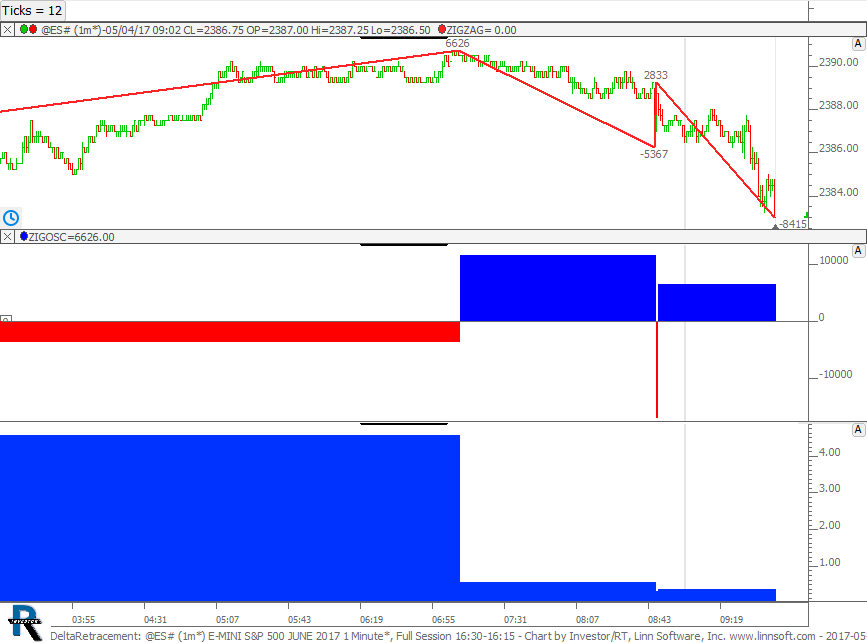 |
DeltaRetracement (@ES#) cpayne [totalcount]
9 years 2 months ago
Delta Retracement. This chart was uploaded by Investor/RT 12.7.2 showing symbol: @ES#. |
View |
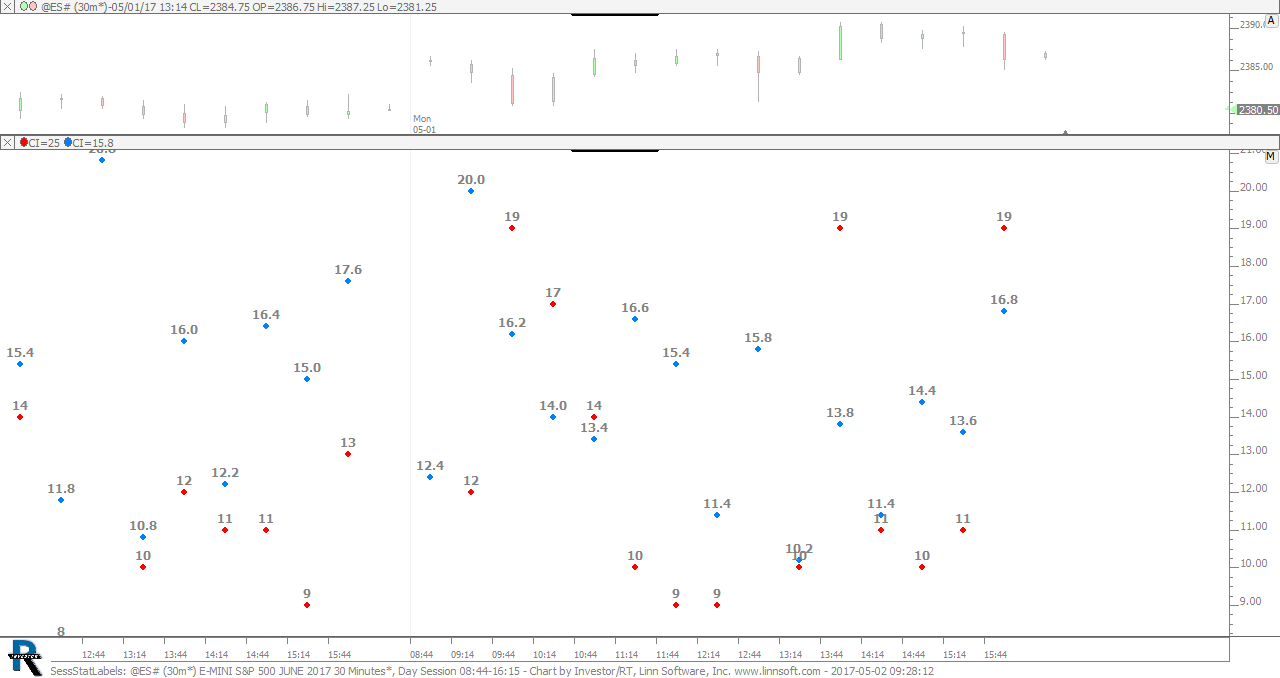 |
SessStatLabels (@ES#) cpayne [totalcount]
9 years 2 months ago
Average Range at Time of Day - Labeled with Text. This chart was uploaded by Investor/RT 12.7.2 showing symbol: @ES#. |
View |
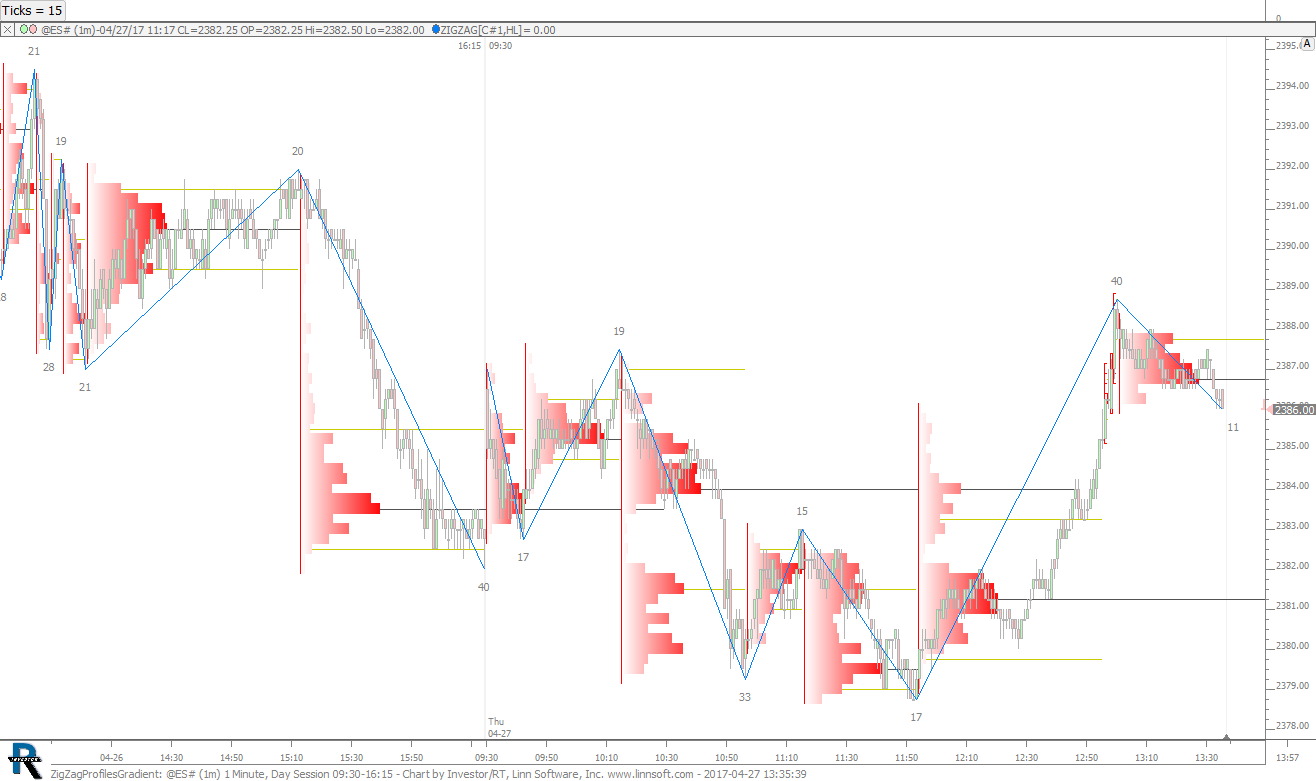 |
ZigZagProfilesGradient (@ES#) cpayne [totalcount]
9 years 2 months ago
Profiles of each move using the Zig Zag indicator to identify moves. This chart was uploaded by Investor/RT 12.7.2 showing symbol: @ES#. |
View |
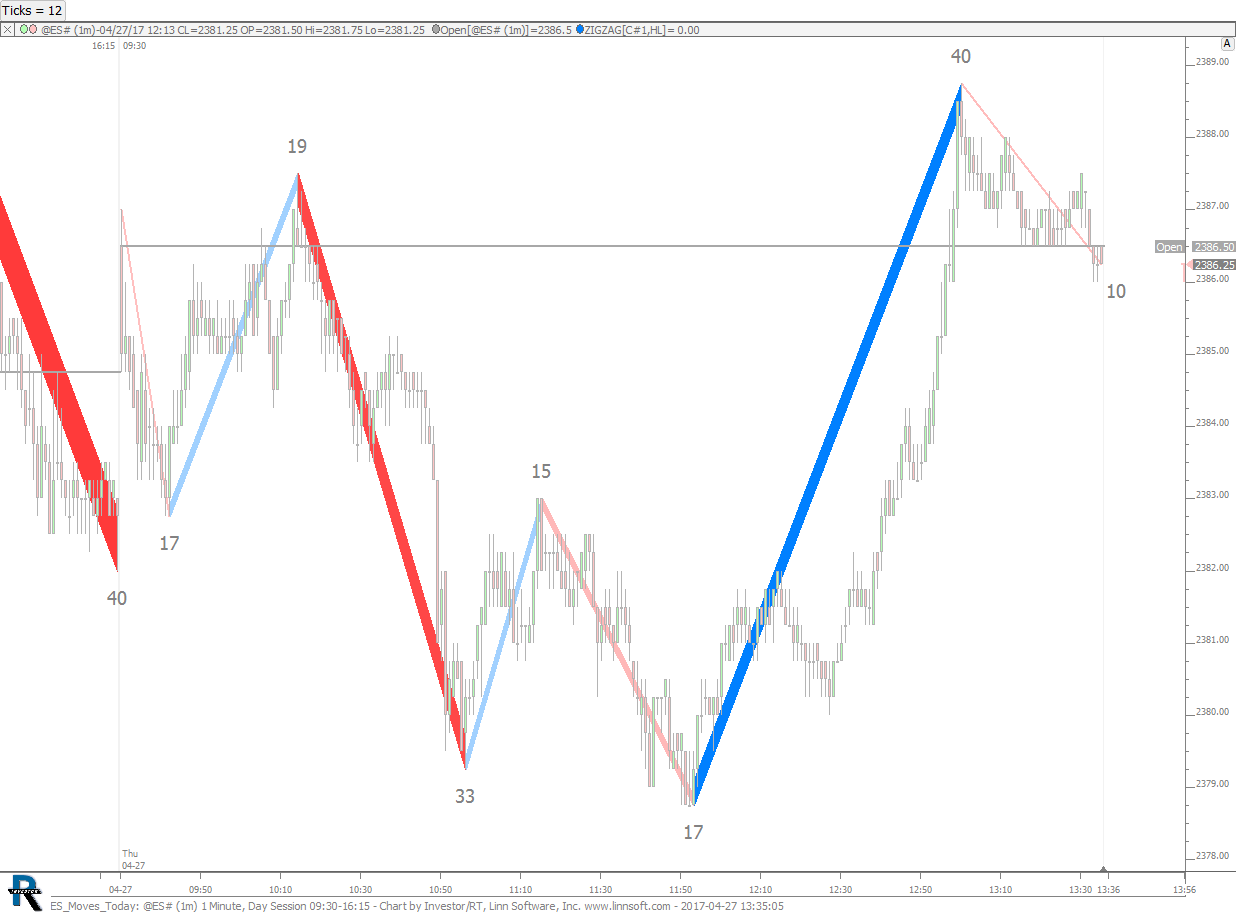 |
ES Moves Today (@ES#) cpayne [totalcount]
9 years 2 months ago
Chart identifies daily moves with width relative to volume of move and color relative to delta of move. This chart was uploaded by Investor/RT 12.7.2 showing symbol: @ES#. |
View |
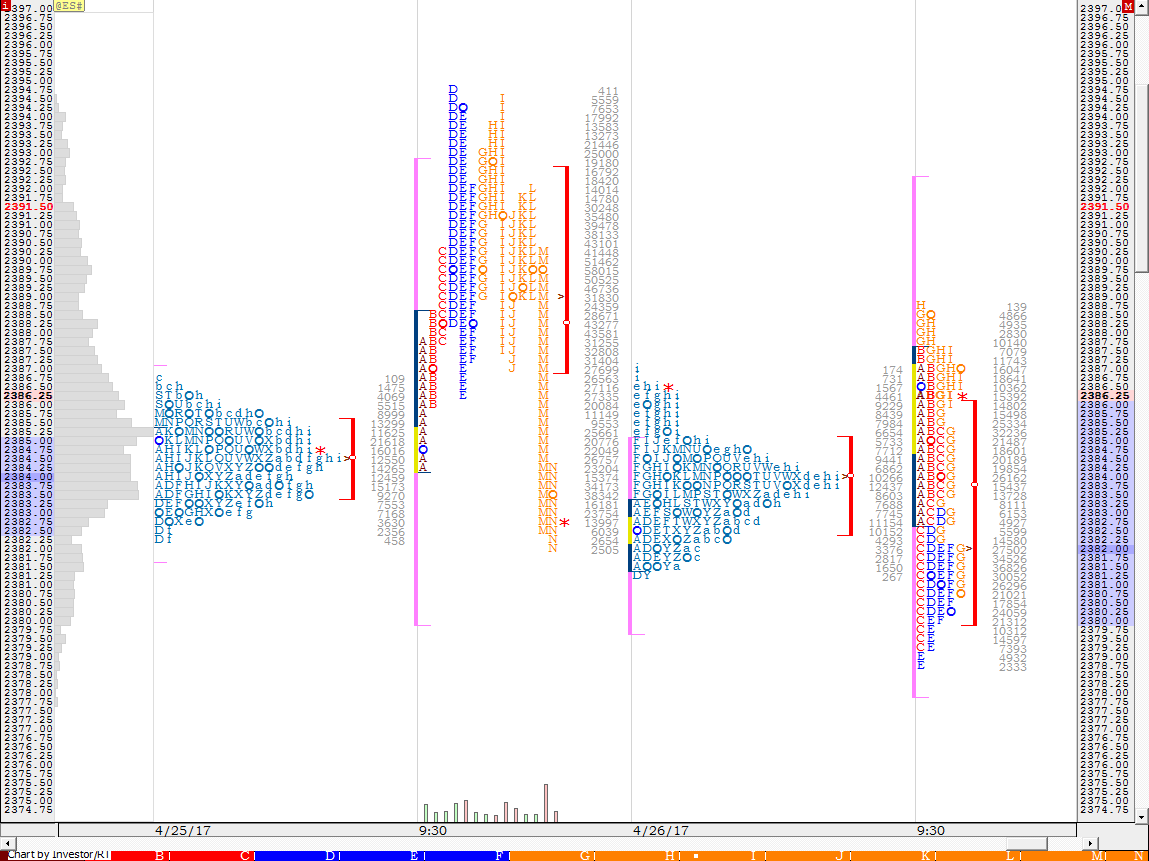 |
TPO Profile Chart (@ES#) cpayne [totalcount]
9 years 2 months ago
TPO Profile Chart that splits overnight and day session and custom color for each bracket during day session. |
View |
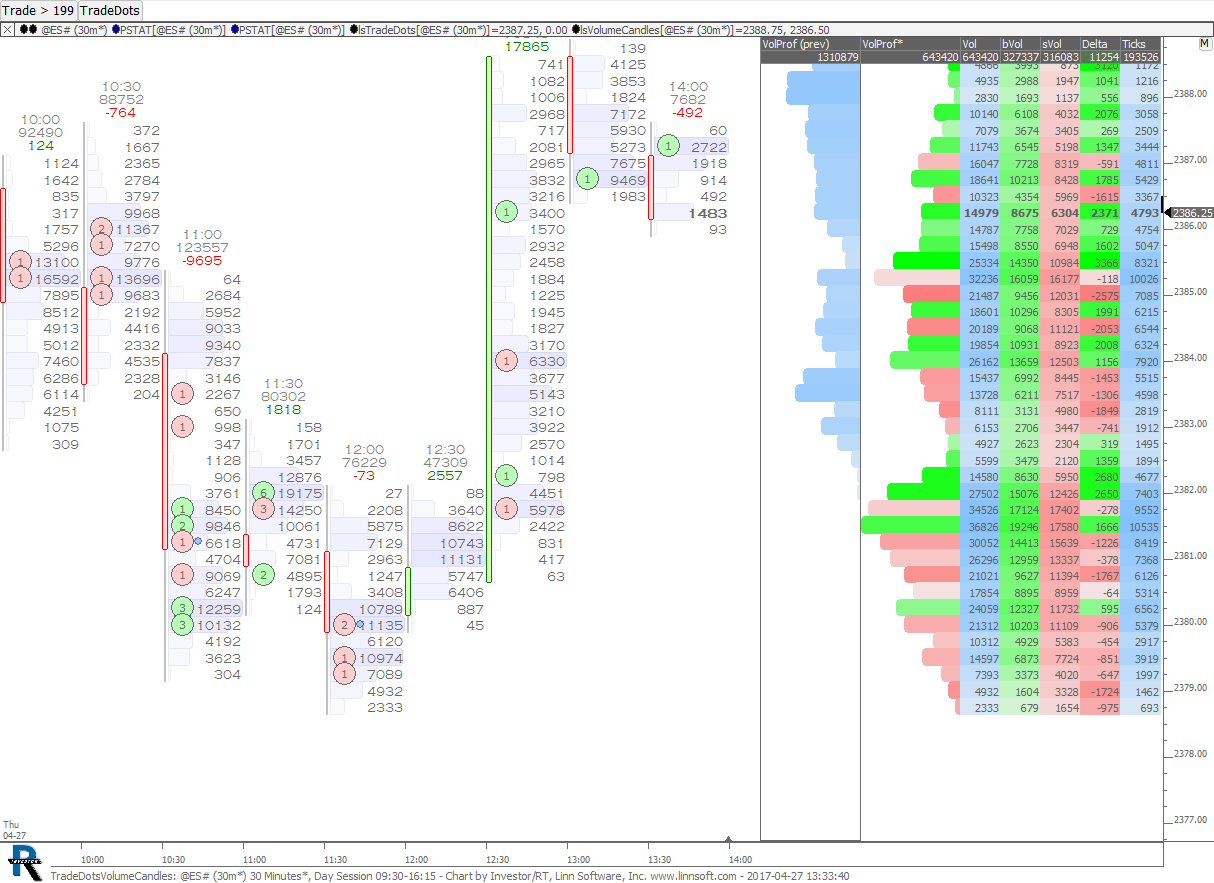 |
TradeDotsVolumeCandles (@ES#) cpayne [totalcount]
9 years 2 months ago
Trade Dots Volume Candles. This chart was uploaded by Investor/RT 12.6.6 showing symbol: @ES#. |
View |
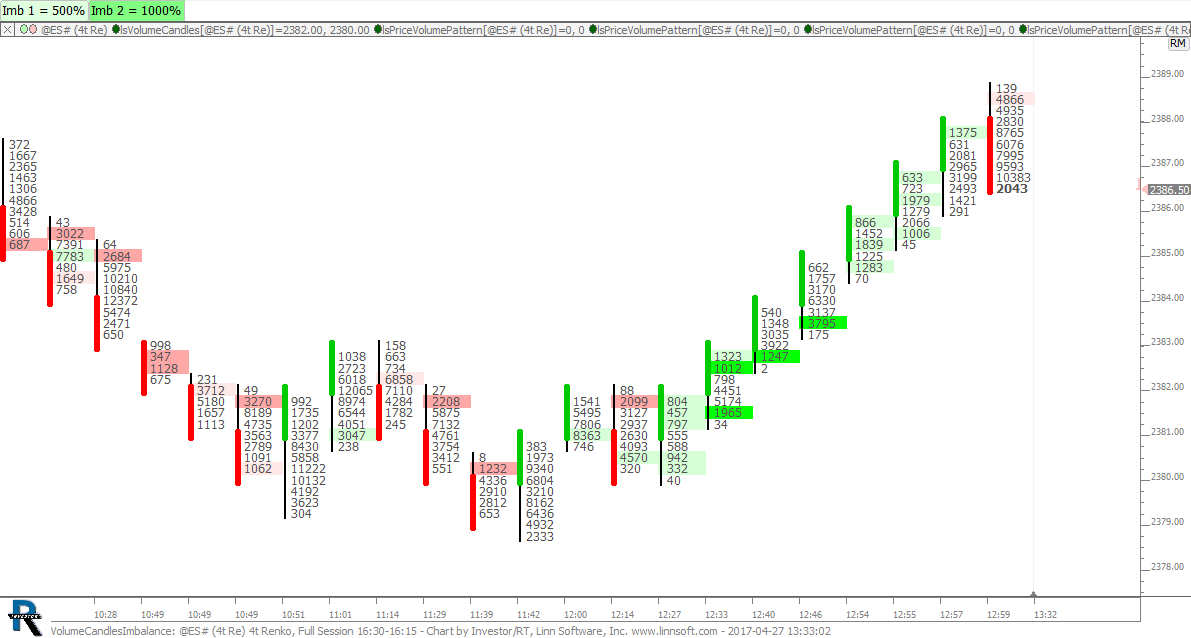 |
VolumeCandlesImbalance (@ES#) cpayne [totalcount]
9 years 2 months ago
Volume Candles with Extreme Imbalance (Controlled by Button at Top). This chart was uploaded by Investor/RT 12.7.1 showing symbol: @ES#. |
View |
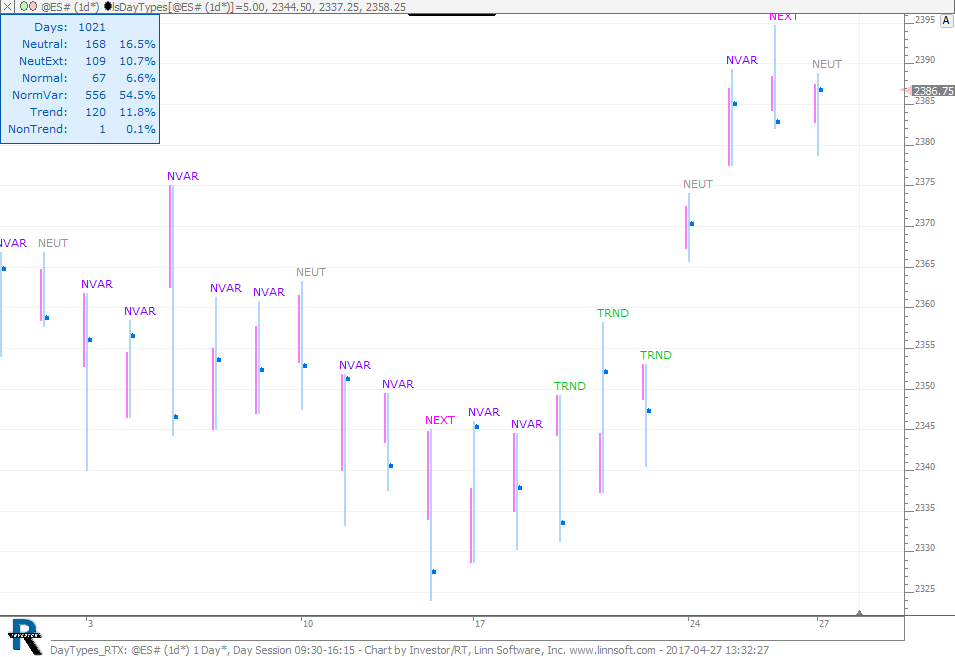 |
DayTypes RTX (@ES#) cpayne [totalcount]
9 years 2 months ago
Day Types - Neutral Extreme, Normal Variation, Trend. This chart was uploaded by Investor/RT 12.7.2 showing symbol: @ES#. |
View |