 |
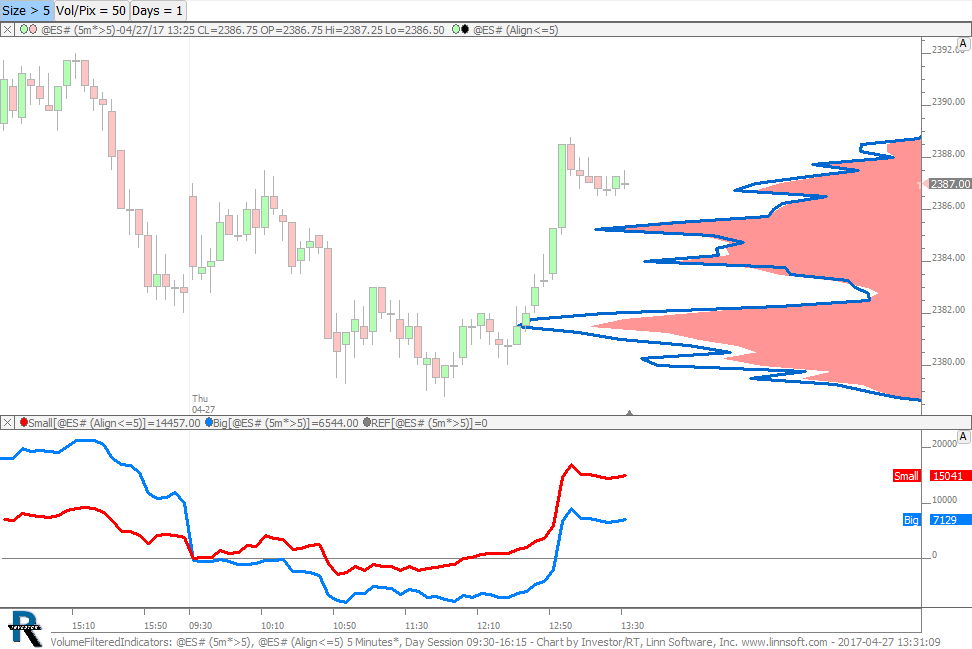
VolumeFilteredIndicators (@ES#) cpayne [totalcount]
9 years 2 months ago
Volume Filtered Profiles and Cumulative Delta. This chart was uploaded by Investor/RT 12.7.2 showing symbol: @ES#. |
View |
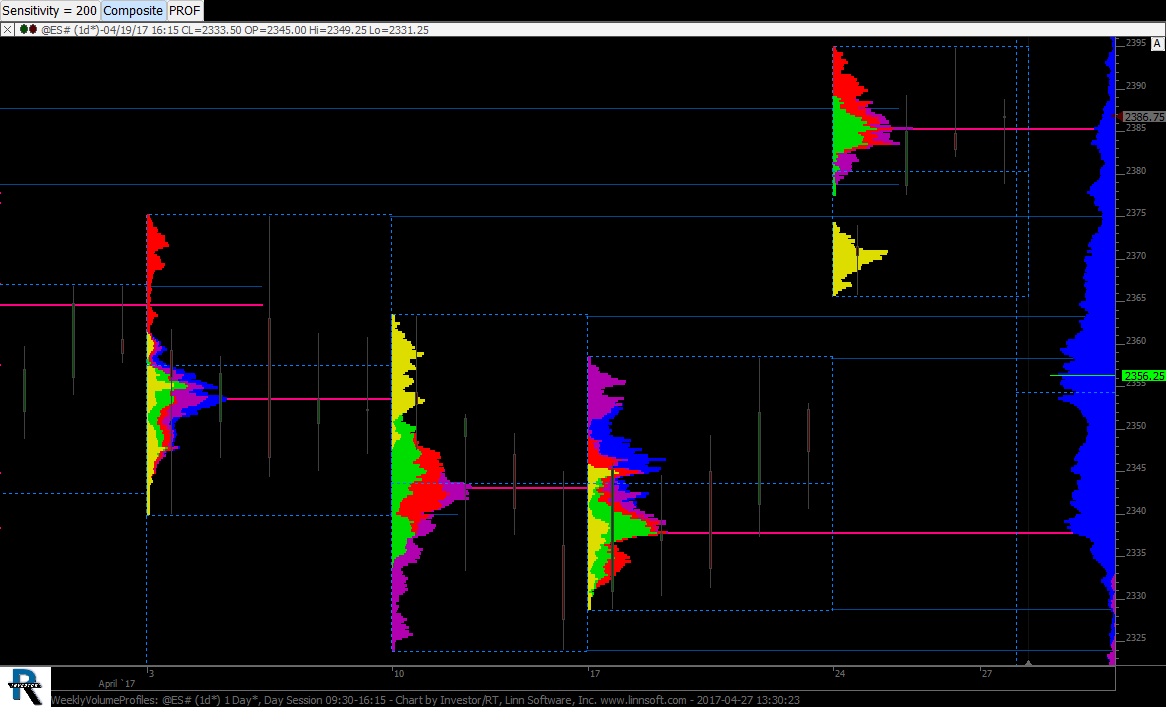 |
WeeklyVolumeProfiles (@ES#) cpayne [totalcount]
9 years 2 months ago
Weekly Profiles with each day different color - composite profile on right. This chart was uploaded by Investor/RT 12.7.2 showing symbol: @ES#. |
View |
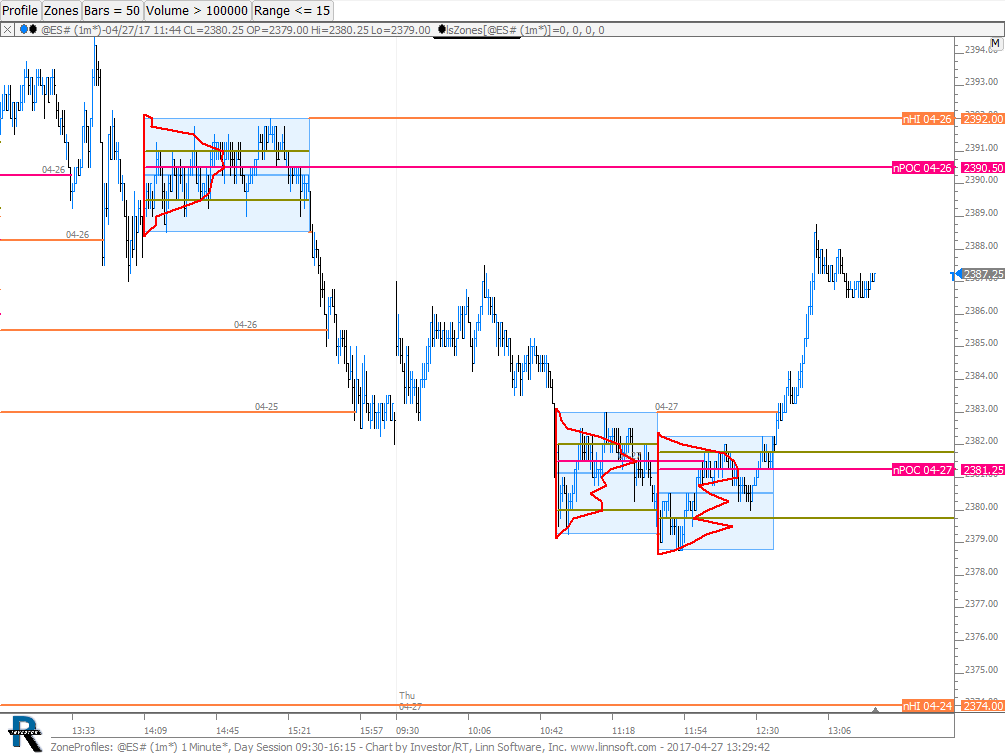 |
ZoneProfiles (@ES#) cpayne [totalcount]
9 years 2 months ago
Zones auto-idenfies areas of consolidation and Profile Indicator profiles these areas. This chart was uploaded by Investor/RT 12.7.2 showing symbol: @ES#. |
View |
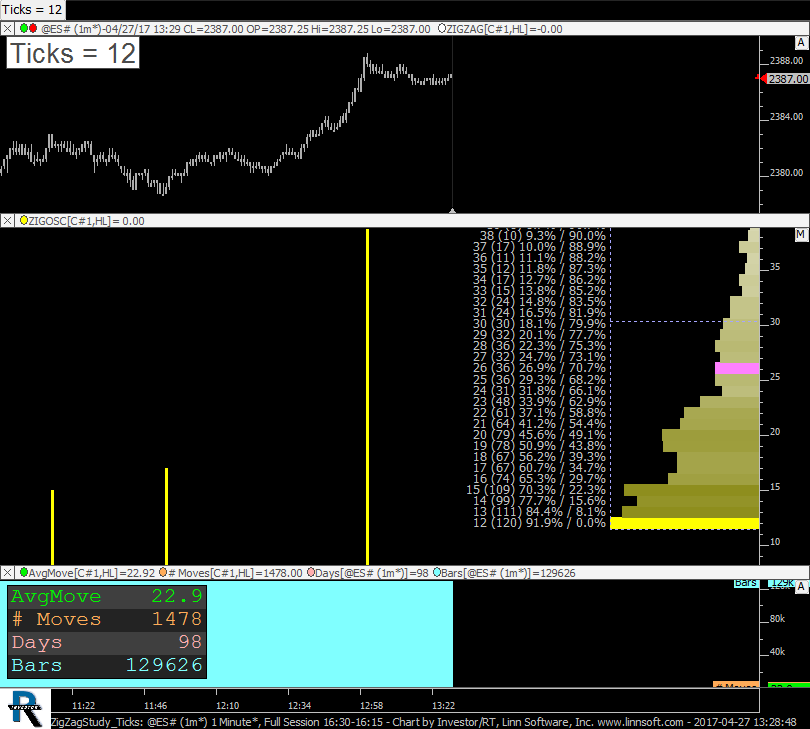 |
ZigZagStudy Ticks (@ES#) cpayne [totalcount]
9 years 2 months ago
Average Rotation Size, Number of Moves. This chart was uploaded by Investor/RT 12.7.1 showing symbol: @ES#. |
View |
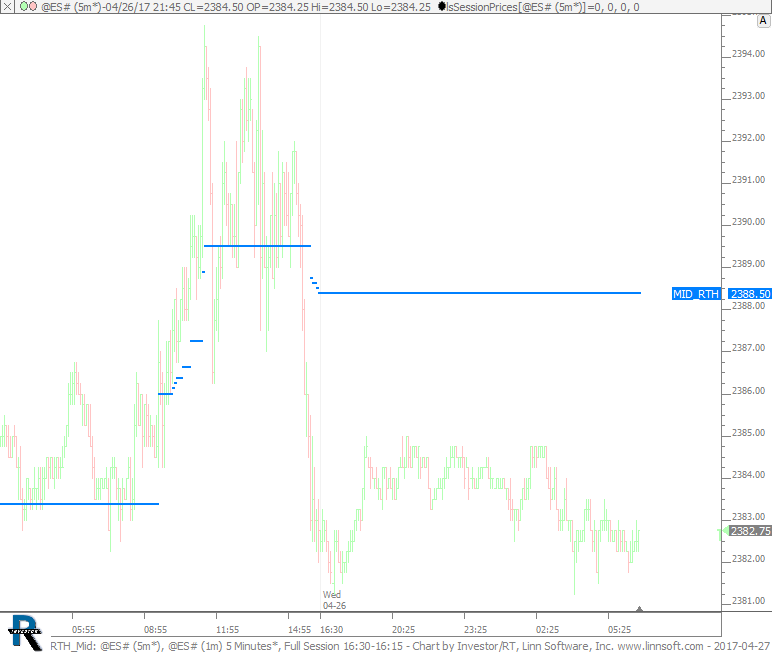 |
RTH Mid (@ES#) cpayne [totalcount]
9 years 2 months ago
SessionPrices - RTH Mid. This chart was uploaded by Investor/RT 12.7.2 showing symbol: @ES#. |
View |
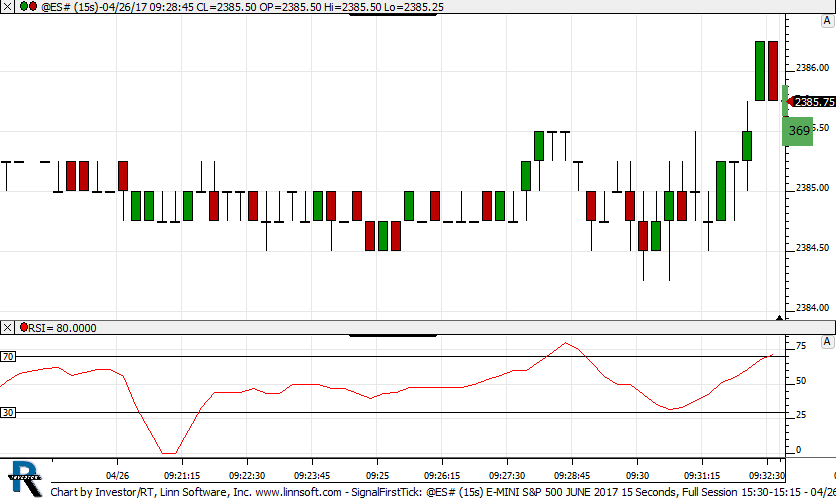 |
SignalFirstTick (@ES#) cpayne [totalcount]
9 years 2 months ago
Signal First Tick of each Bar. This chart was uploaded by Investor/RT 12.6.9 showing symbol: @ES#. |
View |
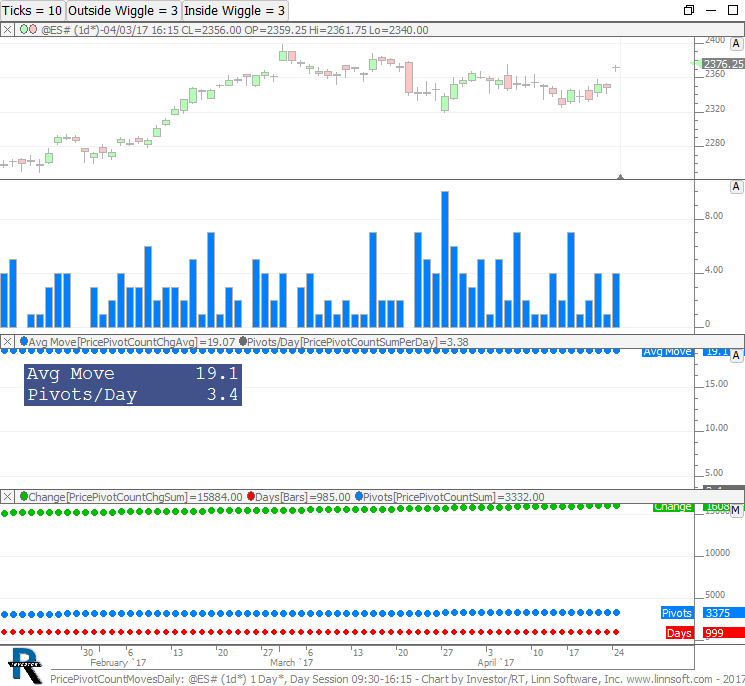 |
PricePivotCountMovesDaily (@ES#) cpayne [totalcount]
9 years 2 months ago
Avg move after pivoting off key price levels. Number of pivots off key price level per day. This chart was uploaded by Investor/RT 12.7.2 showing symbol: @ES#. |
View |
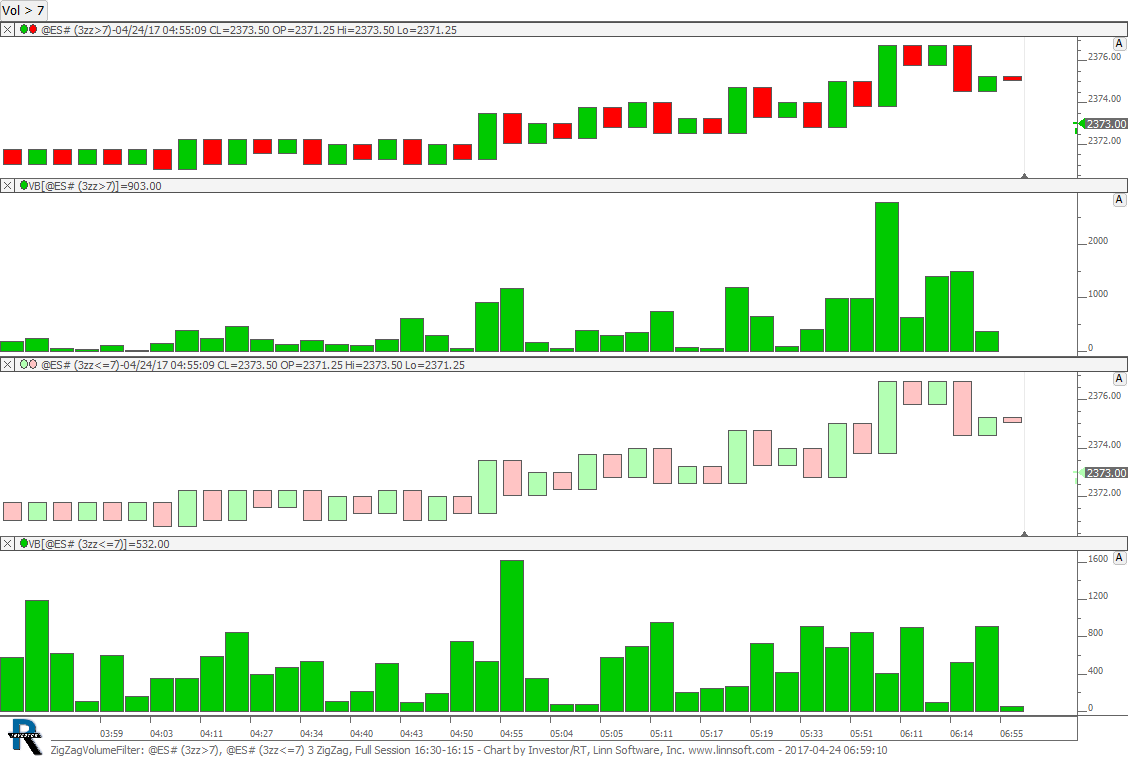 |
ZigZagVolumeFilter (@ES#) cpayne [totalcount]
9 years 2 months ago
Zig Zag Periodicity with Volume Filter. This chart was uploaded by Investor/RT 12.7.1 showing symbol: @ES#. |
View |
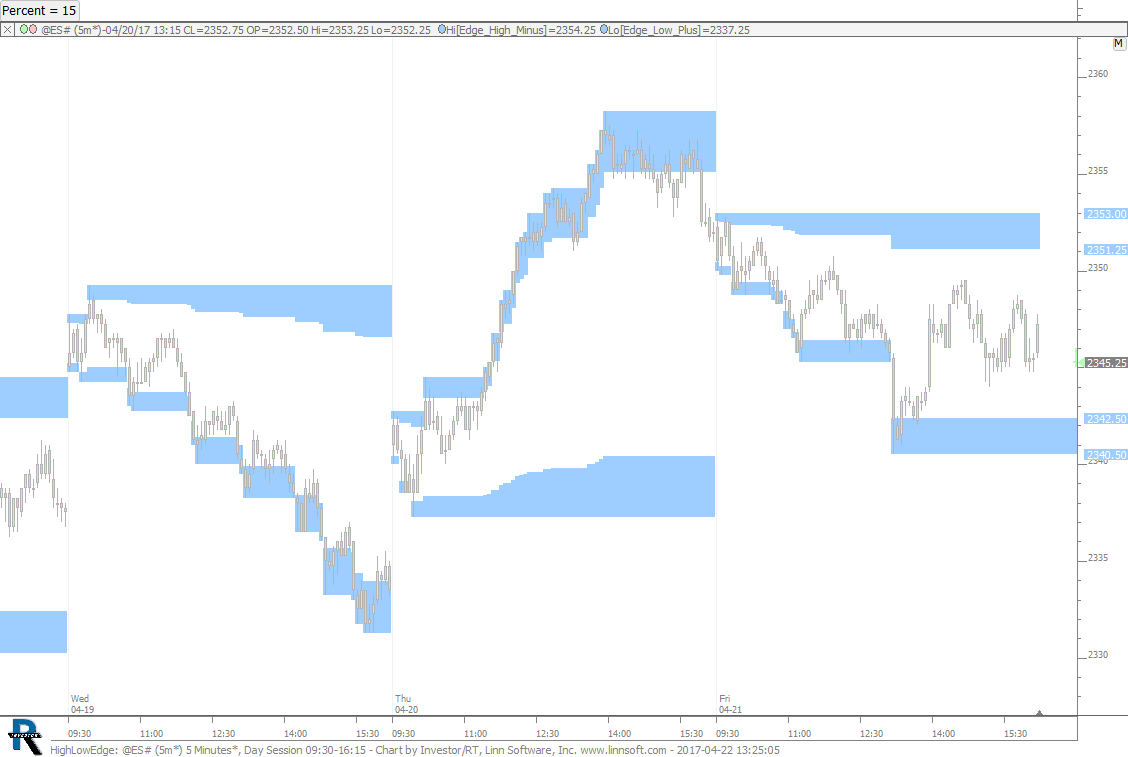 |
HighLowEdge (@ES#) cpayne [totalcount]
9 years 2 months ago
High Low 15% Edge. This chart was uploaded by Investor/RT 12.7.1 showing symbol: @ES#. |
View |
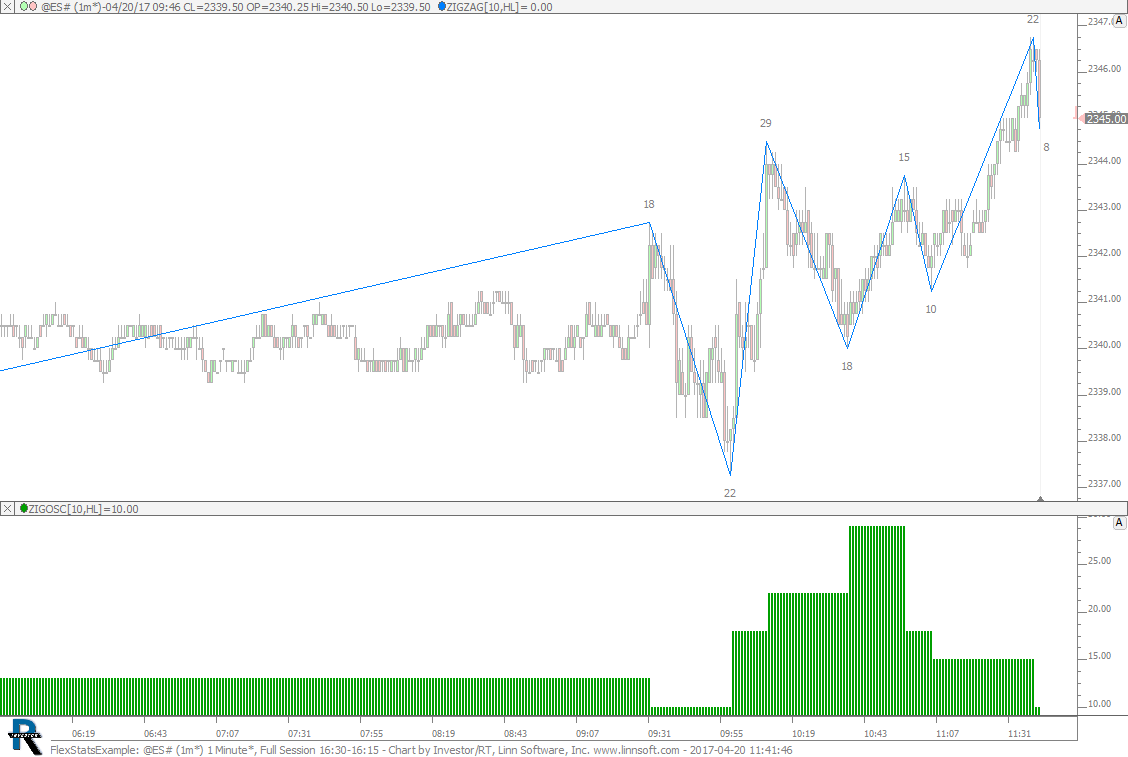 |
FlexStatsExample (@ES#) cpayne [totalcount]
9 years 2 months ago
This chart was uploaded by Investor/RT 12.7.1 showing symbol: @ES#. |
View |
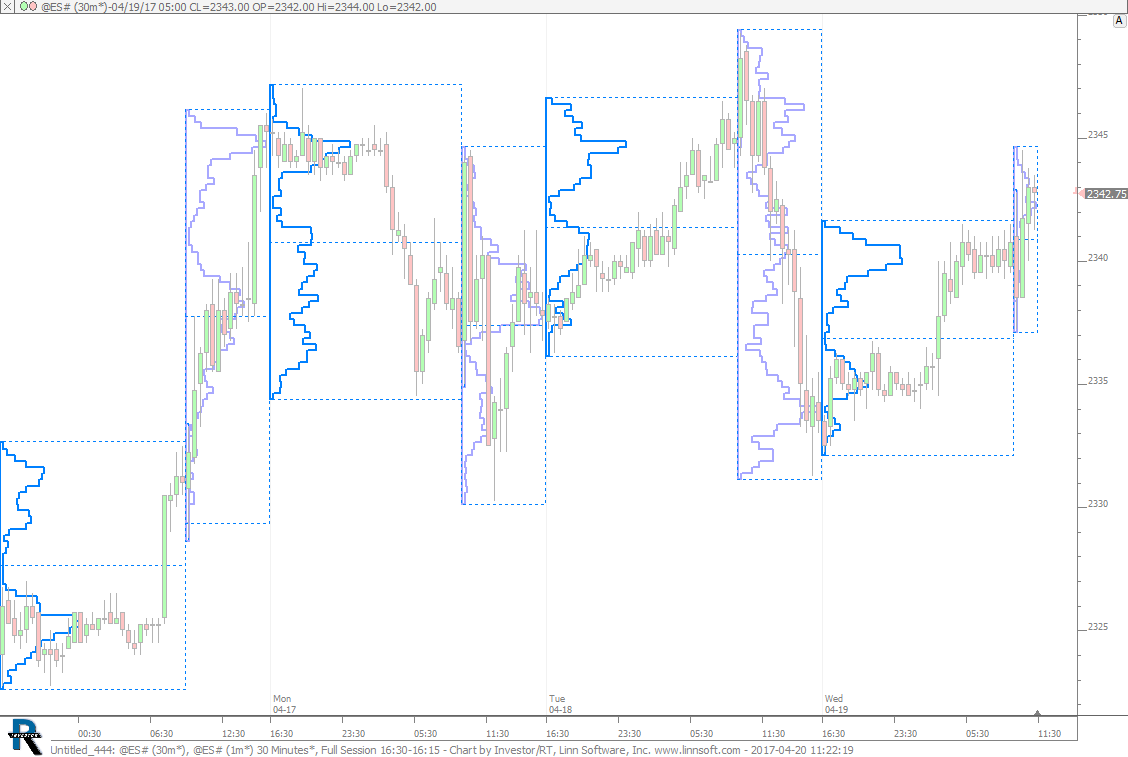 |
Untitled 444 (@ES#) cpayne [totalcount]
9 years 2 months ago
This chart was uploaded by Investor/RT 12.7.1 showing symbol: @ES#. |
View |
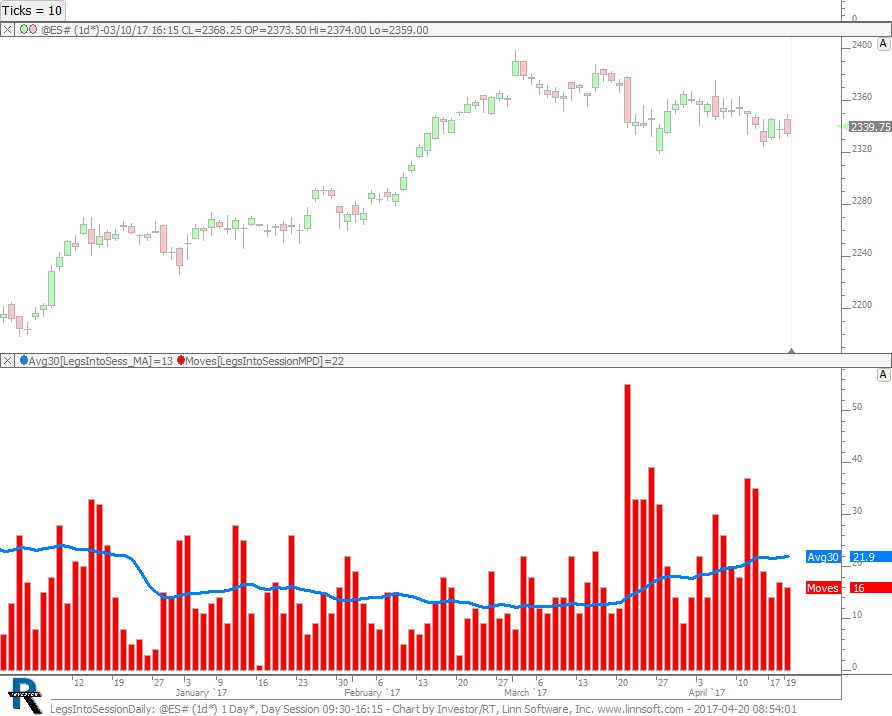 |
LegsIntoSessionDaily (@ES#) cpayne [totalcount]
9 years 2 months ago
Legs Into Session - Daily with Average. This chart was uploaded by Investor/RT 12.7.1 showing symbol: @ES#. |
View |
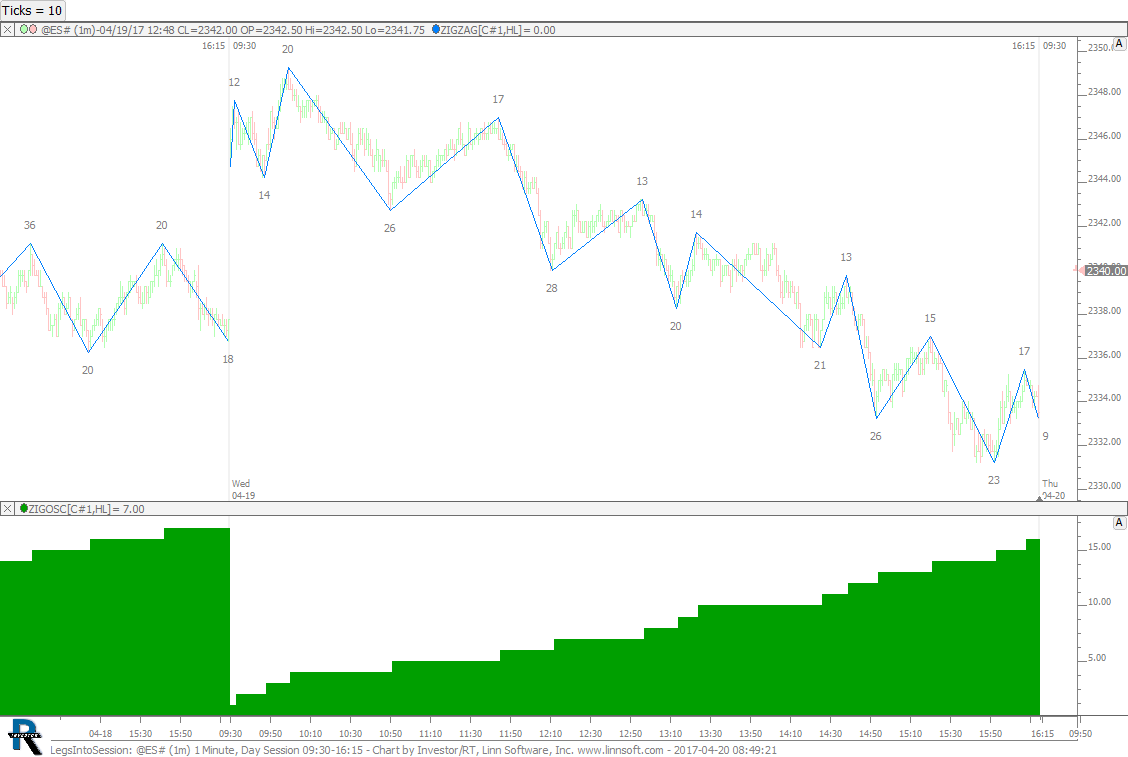 |
LegsIntoSession (@ES#) cpayne [totalcount]
9 years 2 months ago
Legs Into Session - Intraday. This chart was uploaded by Investor/RT 12.7.1 showing symbol: @ES#. |
View |
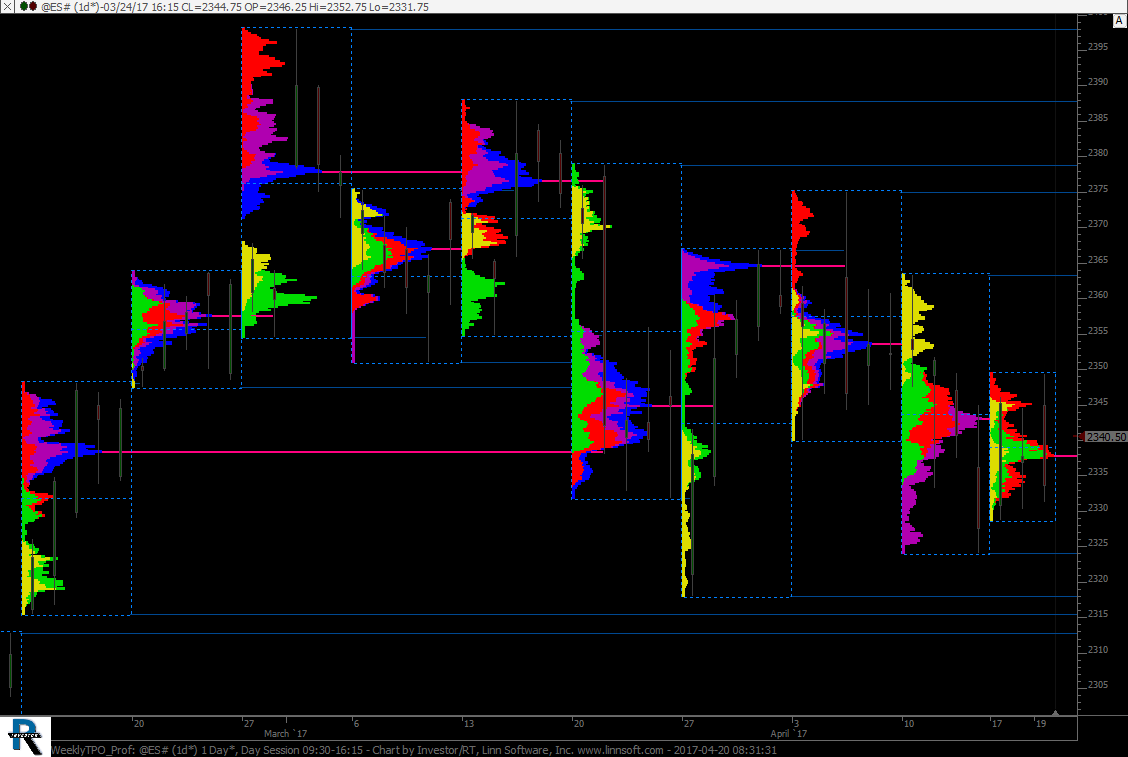 |
WeeklyTPO Prof (@ES#) cpayne [totalcount]
9 years 2 months ago
Weekly Volume Profile Chart using Profile Indicator. This chart was uploaded by Investor/RT 12.7.1 showing symbol: @ES#. |
View |
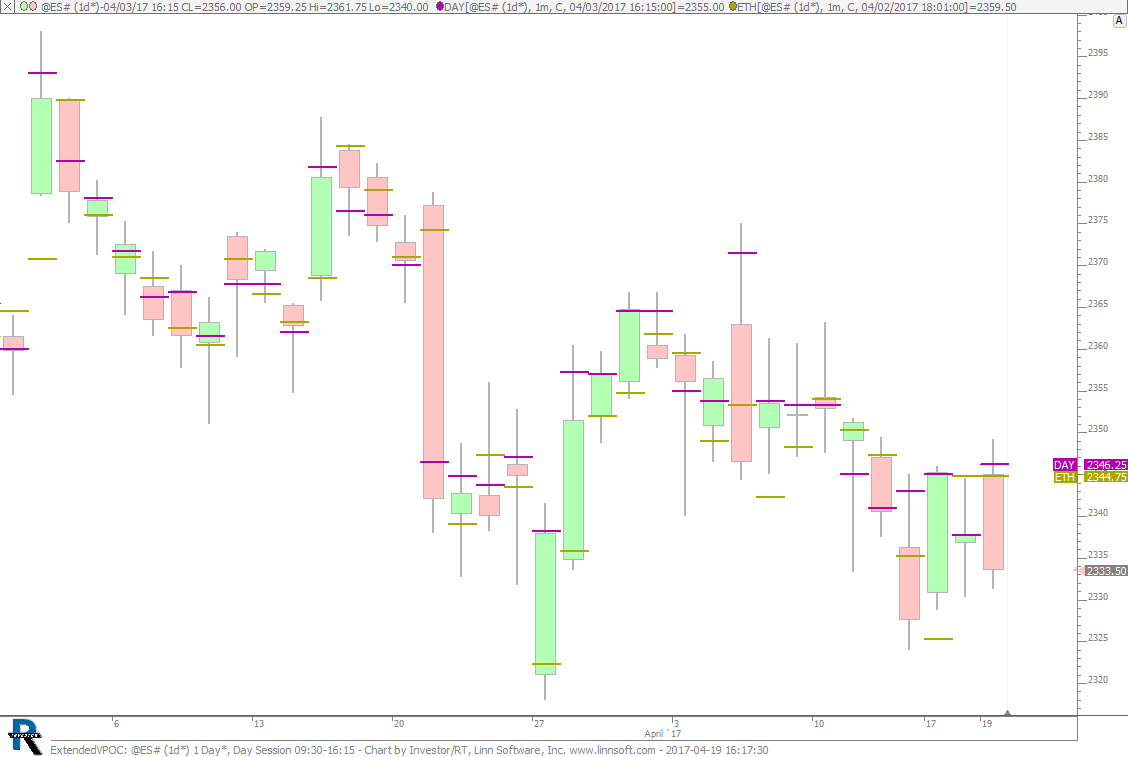 |
ExtendedVPOC (@ES#) cpayne [totalcount]
9 years 2 months ago
Day and Overnight Session VPOC. This chart was uploaded by Investor/RT 12.7.1 showing symbol: @ES#. |
View |
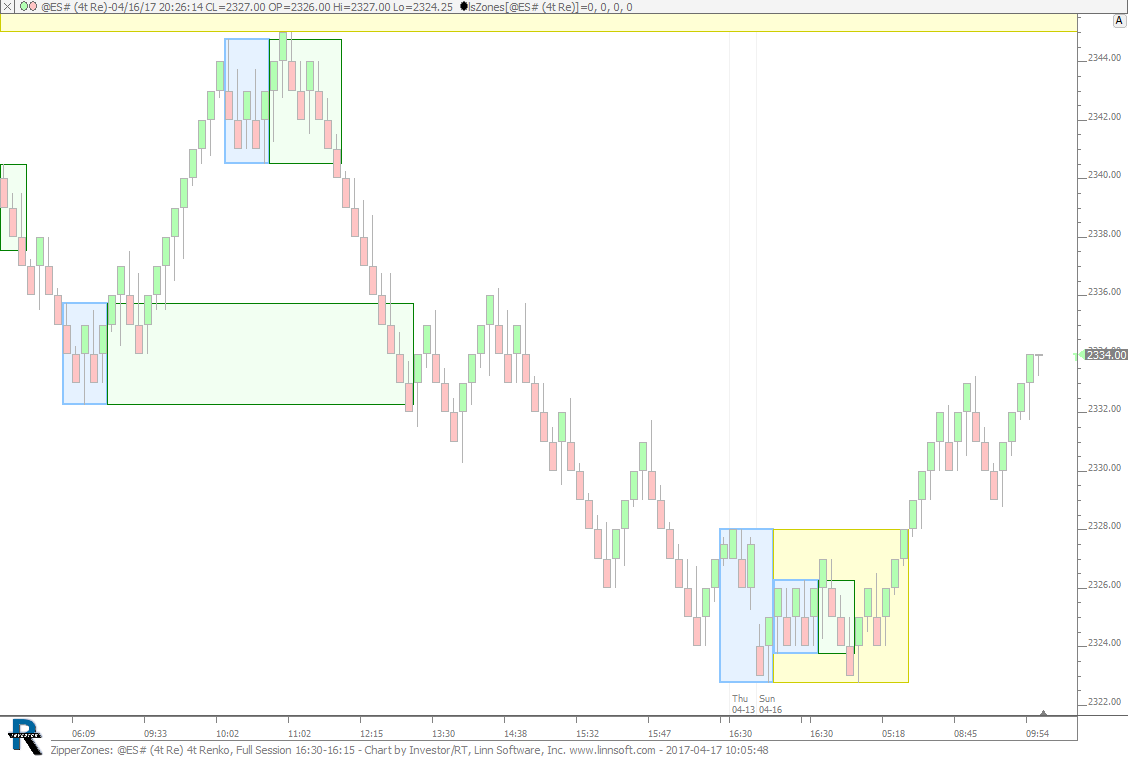 |
ZipperZones (@ES#) cpayne [totalcount]
9 years 3 months ago
Zipper Zones. This chart was uploaded by Investor/RT 12.7.1 showing symbol: @ES#. |
View |
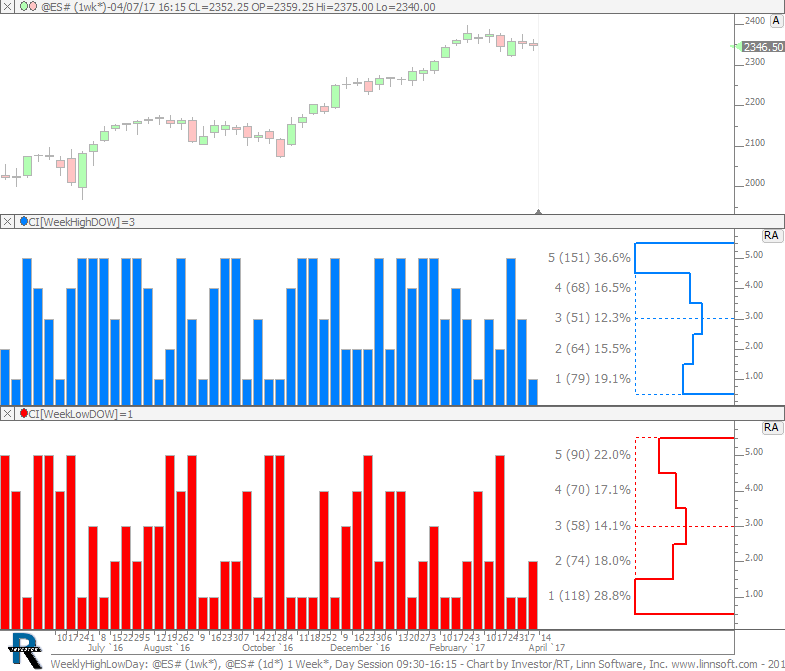 |
WeeklyHighLowDay (@ES#) cpayne [totalcount]
9 years 3 months ago
Day of Week that makes Weekly High and Low. This chart was uploaded by Investor/RT 12.7.1 showing symbol: @ES#. |
View |
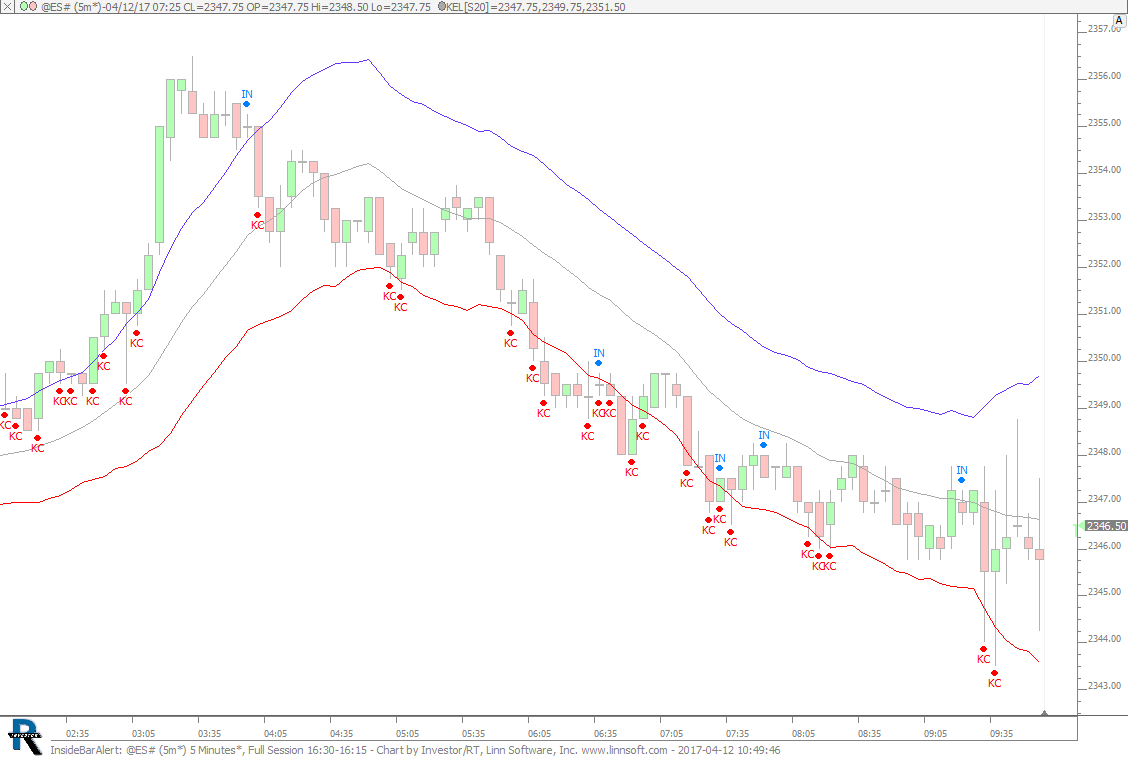 |
InsideBarAlert (@ES#) cpayne [totalcount]
9 years 3 months ago
Inside Bar with Alert. This chart was uploaded by Investor/RT 12.7.1 showing symbol: @ES#. |
View |
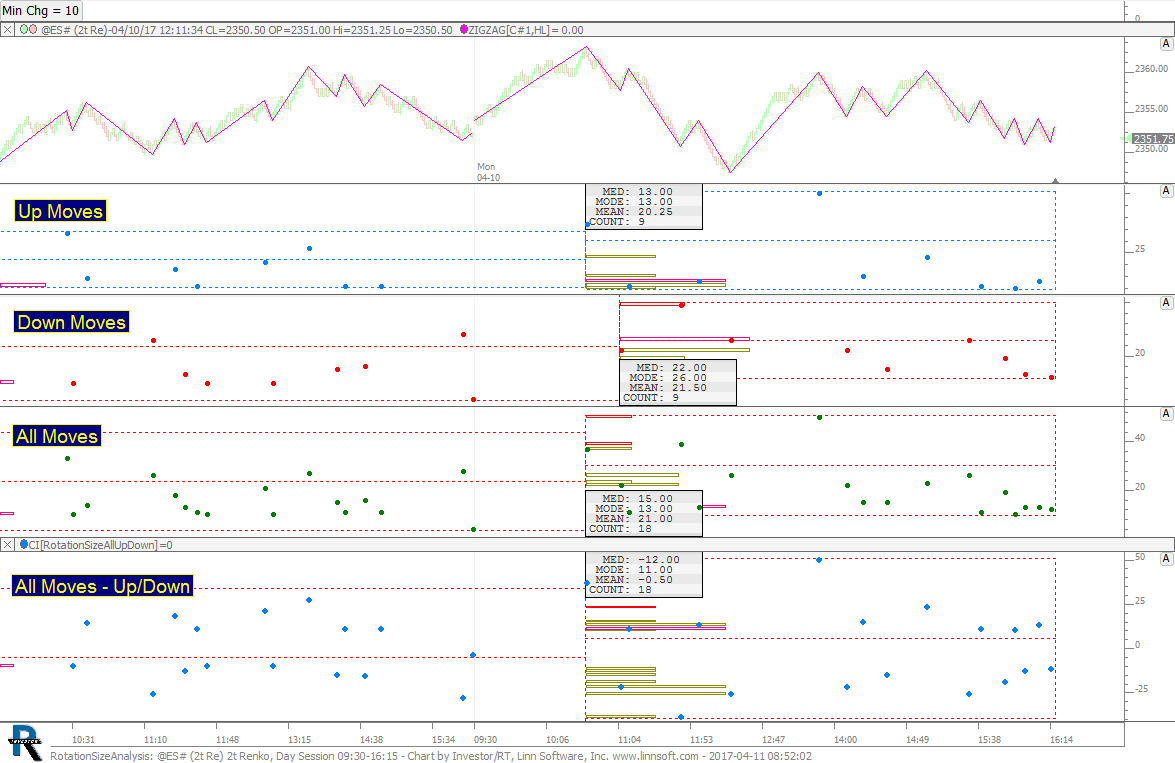 |
RotationSizeAnalysis (@ES#) cpayne [totalcount]
9 years 3 months ago
Rotation Size Analysis. This chart was uploaded by Investor/RT 12.5.5 showing symbol: @ES#. |
View |
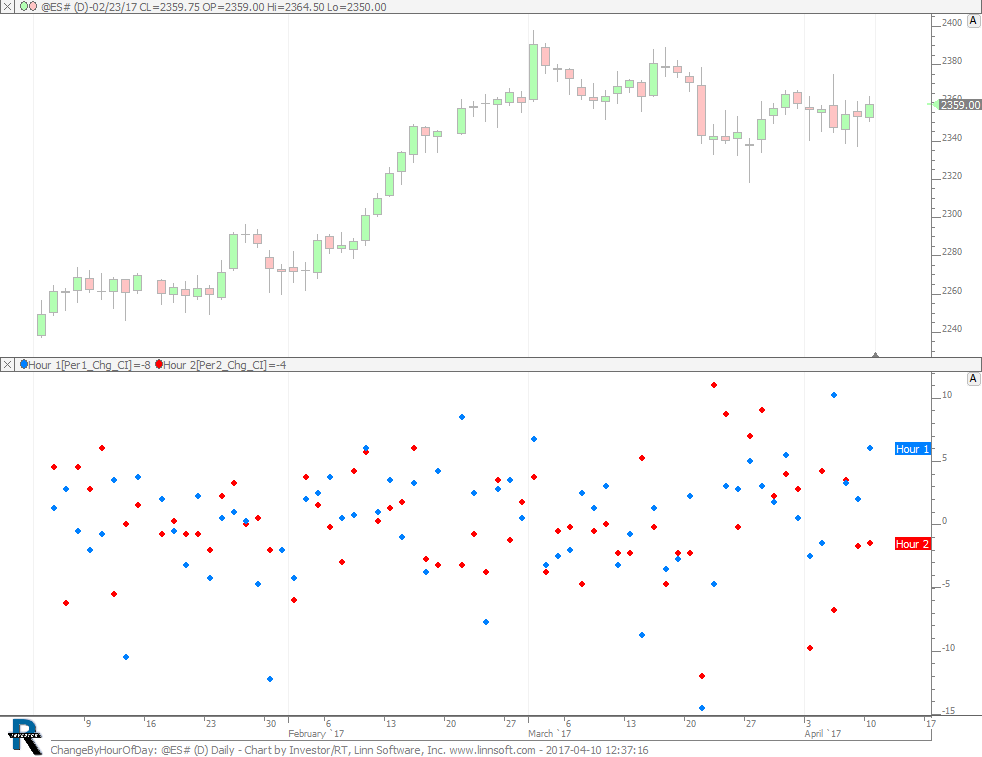 |
ChangeByHourOfDay (@ES#) cpayne [totalcount]
9 years 3 months ago
Change by Hour of Day. This chart was uploaded by Investor/RT 12.7.1 showing symbol: @ES#. |
View |
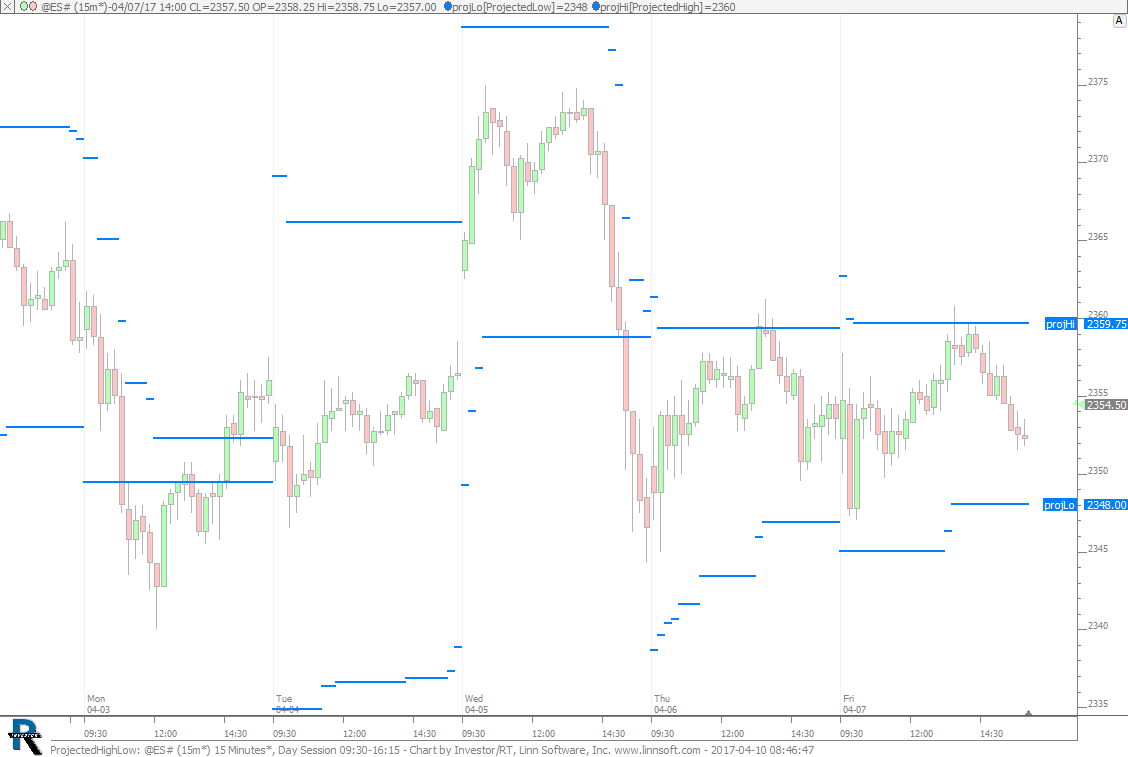 |
ProjectedHighLow (@ES#) cpayne [totalcount]
9 years 3 months ago
Projected High and Low of Session. This chart was uploaded by Investor/RT 12.7.1 showing symbol: @ES#. |
View |
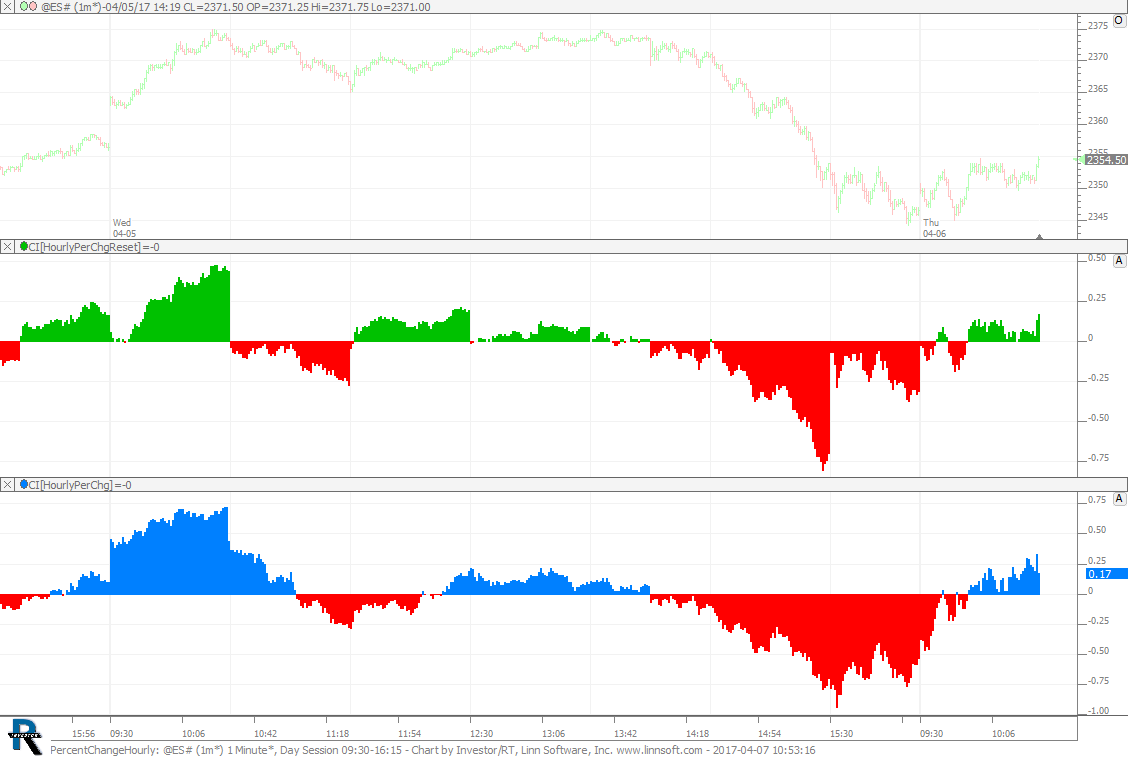 |
PercentChangeHourly (@ES#) cpayne [totalcount]
9 years 3 months ago
Percent Change Hourly. This chart was uploaded by Investor/RT 12.7.1 showing symbol: @ES#. |
View |
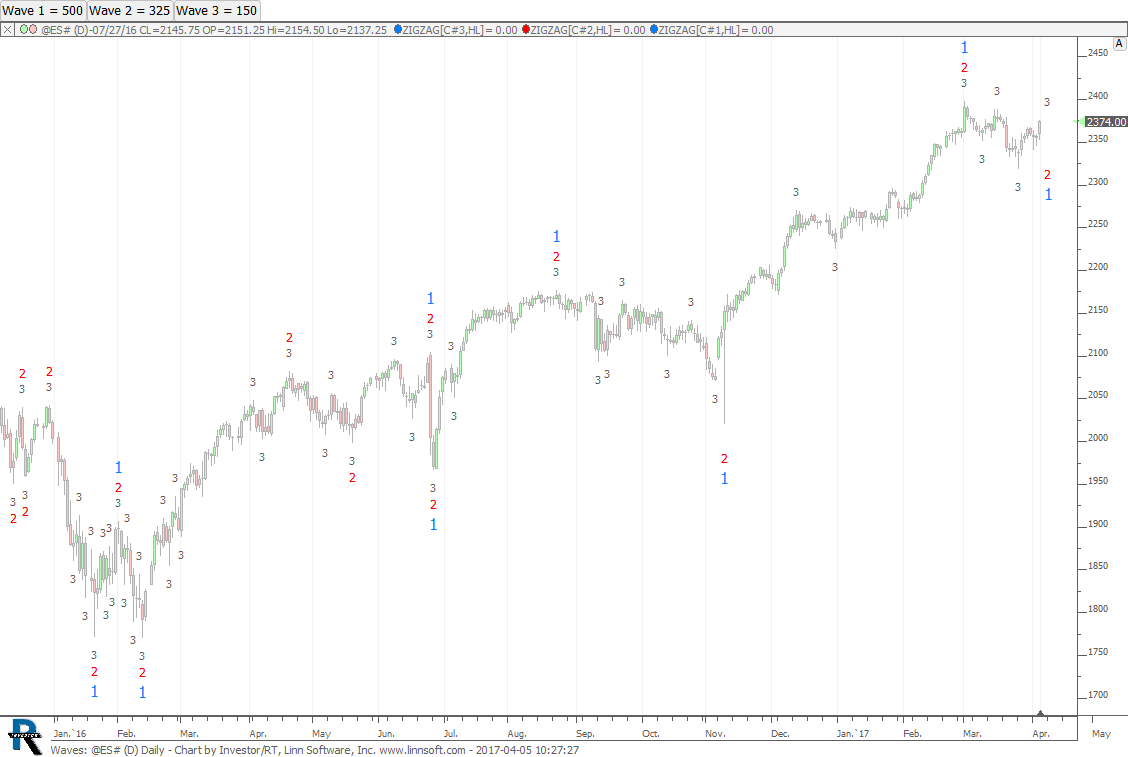 |
Waves (@ES#) cpayne [totalcount]
9 years 3 months ago
Waves. This chart was uploaded by Investor/RT 12.7.1 showing symbol: @ES#. |
View |
 |
PriceStatsVolumeCandles (@ES#) cpayne [totalcount]
9 years 3 months ago
Price Statistic and Volume Candles. This chart was uploaded by Investor/RT 12.7.1 showing symbol: @ES#. |
View |
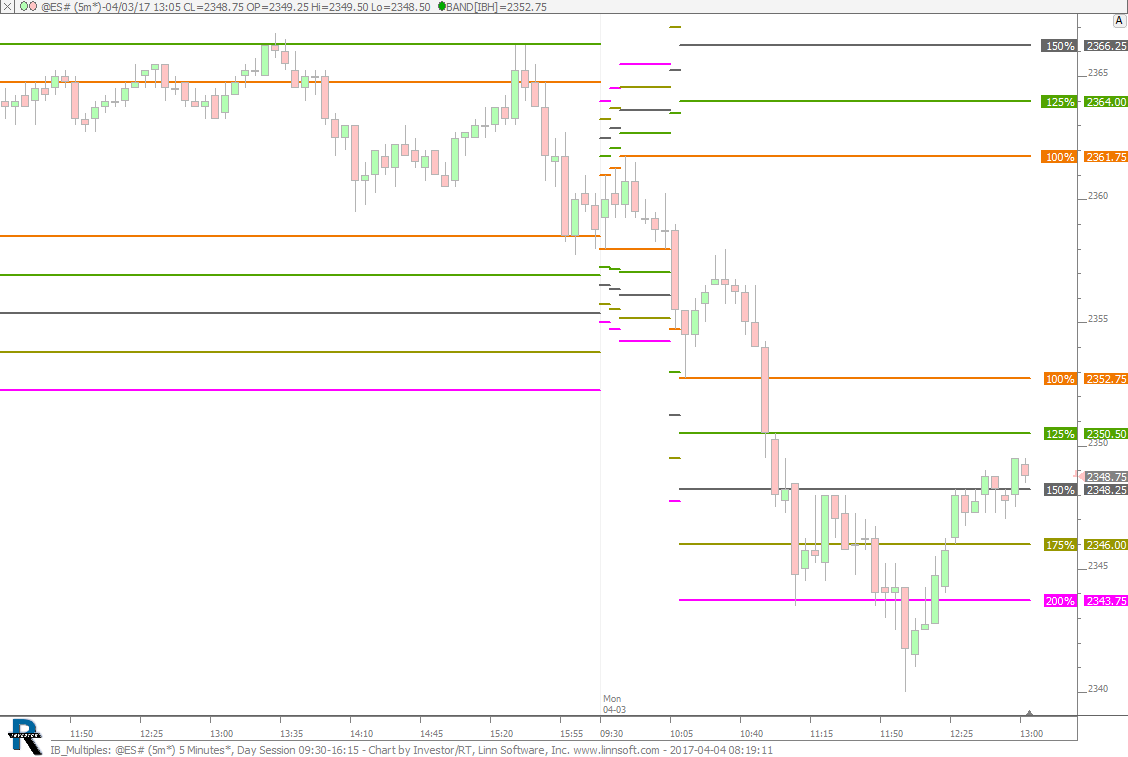 |
IB Multiples (@ES#) cpayne [totalcount]
9 years 3 months ago
Initial Balance Multiples using Bands Indicator. This chart was uploaded by Investor/RT 12.7.1 showing symbol: @ES#. |
View |