 |
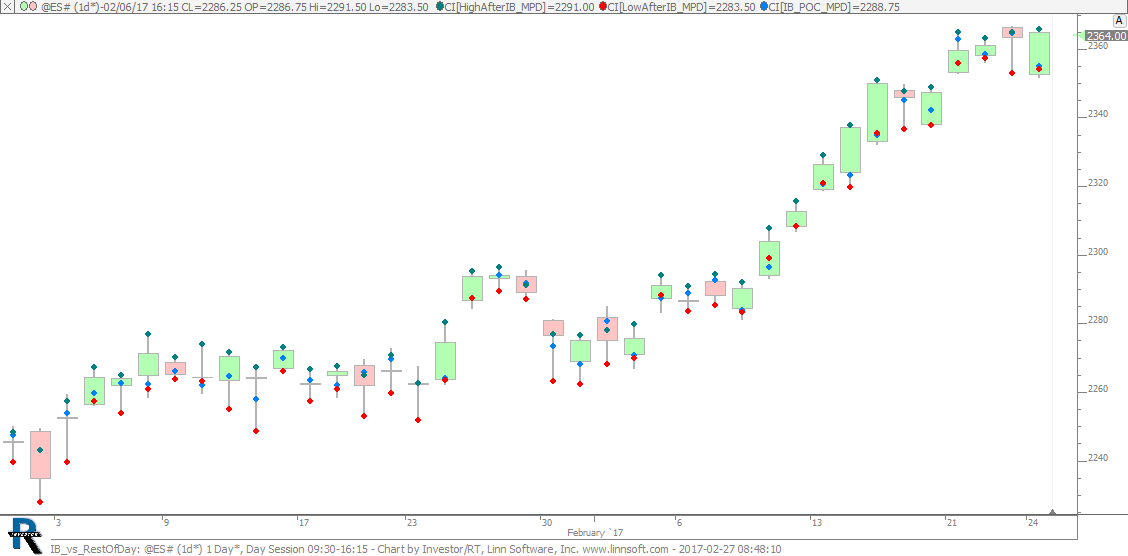
IB vs RestOfDay (@ES#) cpayne [totalcount]
9 years 4 months ago
Red Dot = IB POC. This chart was uploaded by Investor/RT 12.7.1 showing symbol: @ES#. |
View |
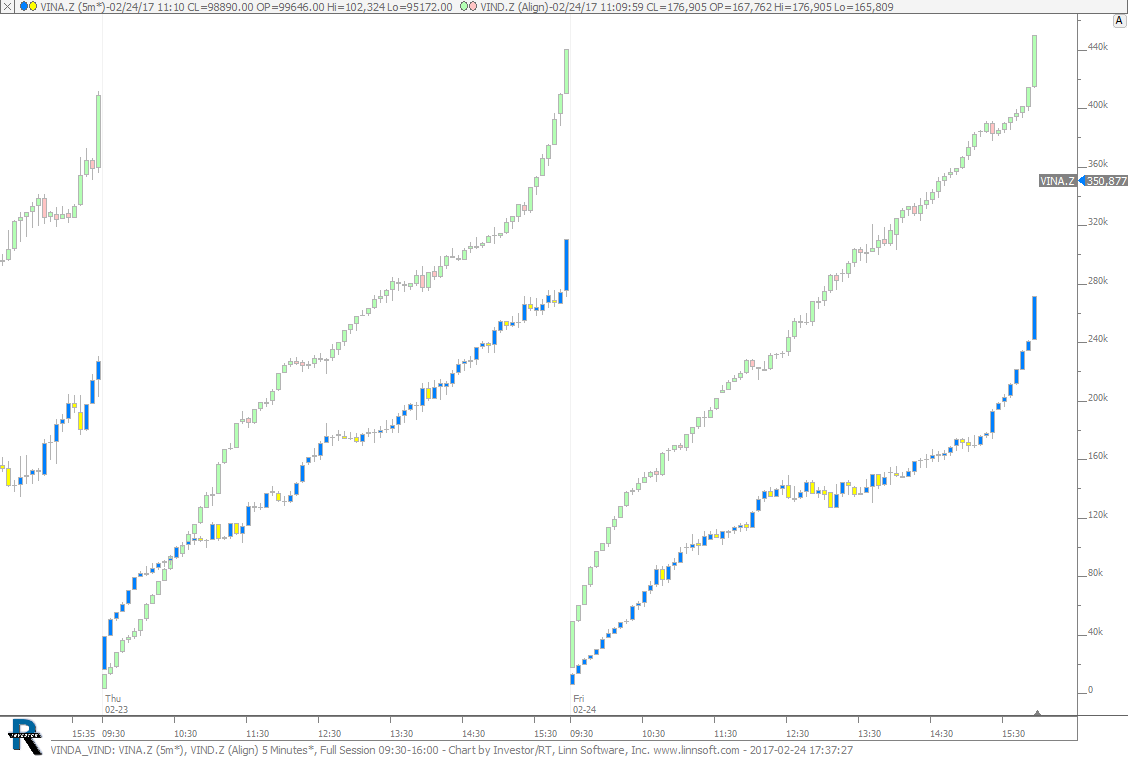 |
VINDA VIND (VINA.Z) cpayne [totalcount]
9 years 4 months ago
VIND VIND. This chart was uploaded by Investor/RT 12.7.1 showing symbol: VINA.Z. |
View |
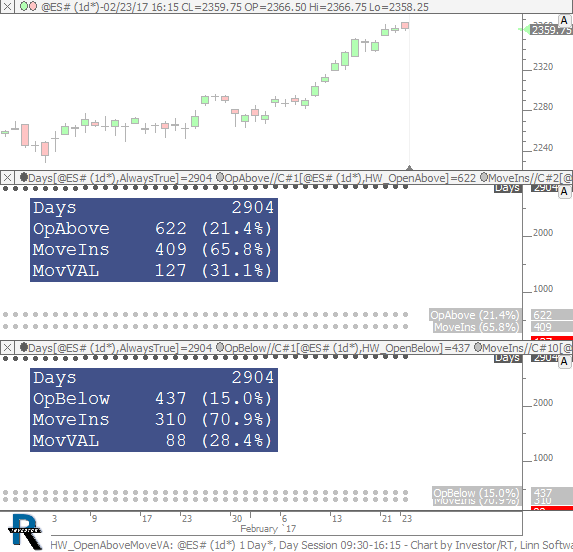 |
HW OpenAboveMoveVA (@ES#) cpayne [totalcount]
9 years 4 months ago
Open Above - Move Inside - Move VAL. This chart was uploaded by Investor/RT 12.7.1 showing symbol: @ES#. |
View |
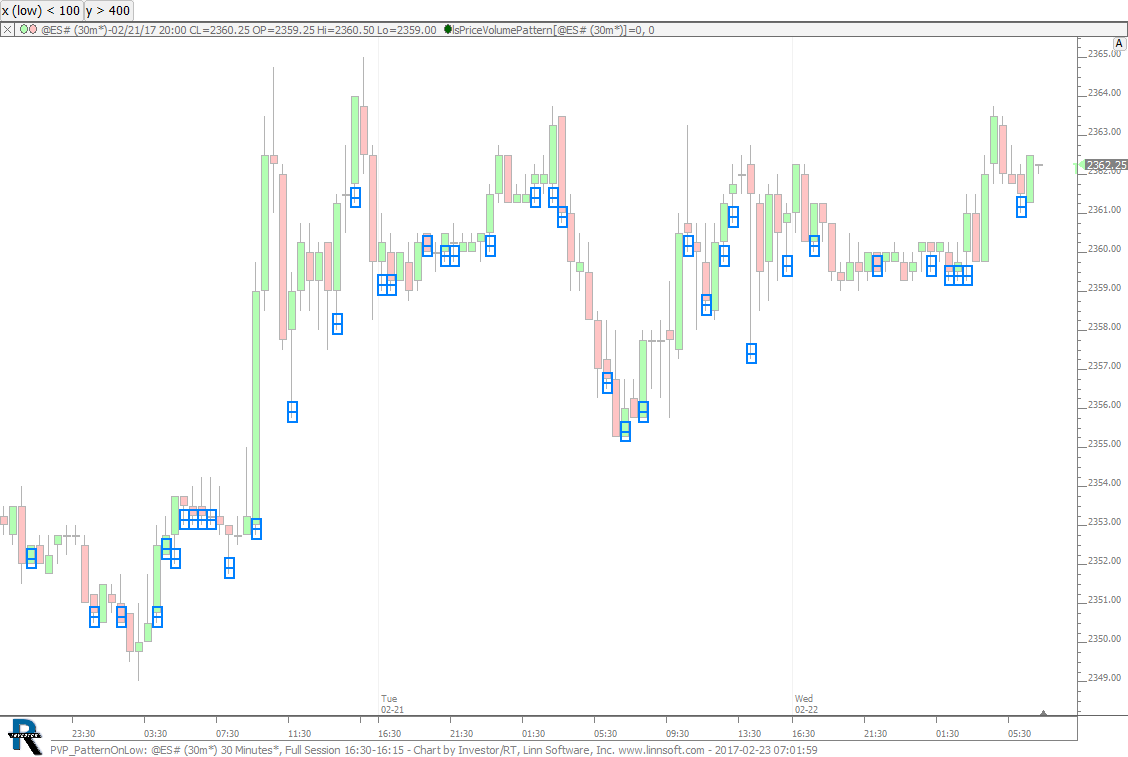 |
PVP PatternOnLow (@ES#) cpayne [totalcount]
9 years 4 months ago
PVP - Pattern on Low - volume of low < x and volume of price above low > y. This chart was uploaded by Investor/RT 12.7.1 showing symbol: @ES#. |
View |
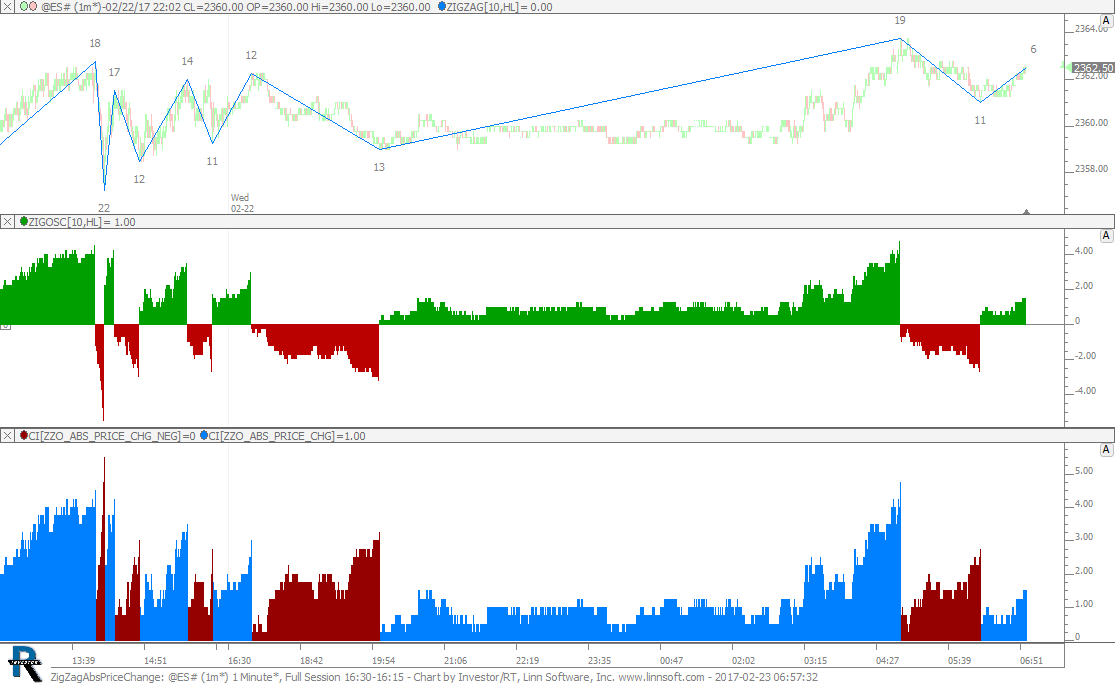 |
ZigZagAbsPriceChange (@ES#) cpayne [totalcount]
9 years 4 months ago
Zig Zag - Absolute Value of Price Change. This chart was uploaded by Investor/RT 12.7.1 showing symbol: @ES#. |
View |
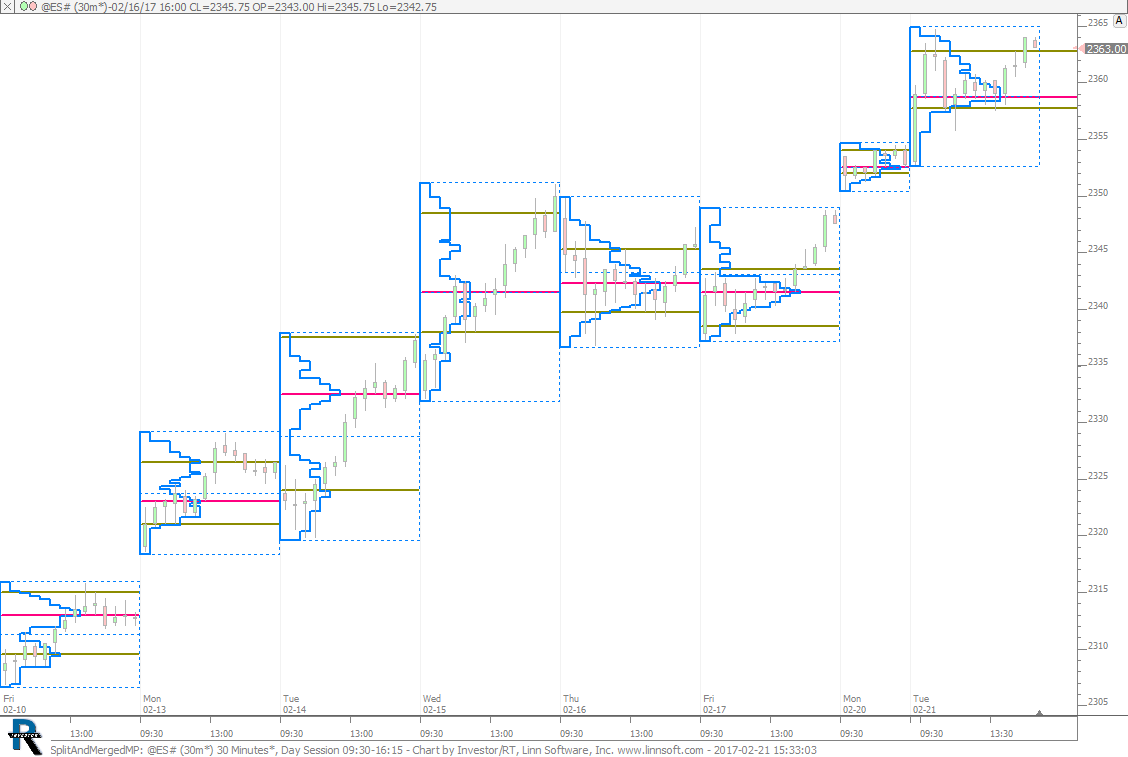 |
SplitAndMergedMP (@ES#) cpayne [totalcount]
9 years 4 months ago
This chart was uploaded by Investor/RT 12.7.1 showing symbol: @ES#. |
View |
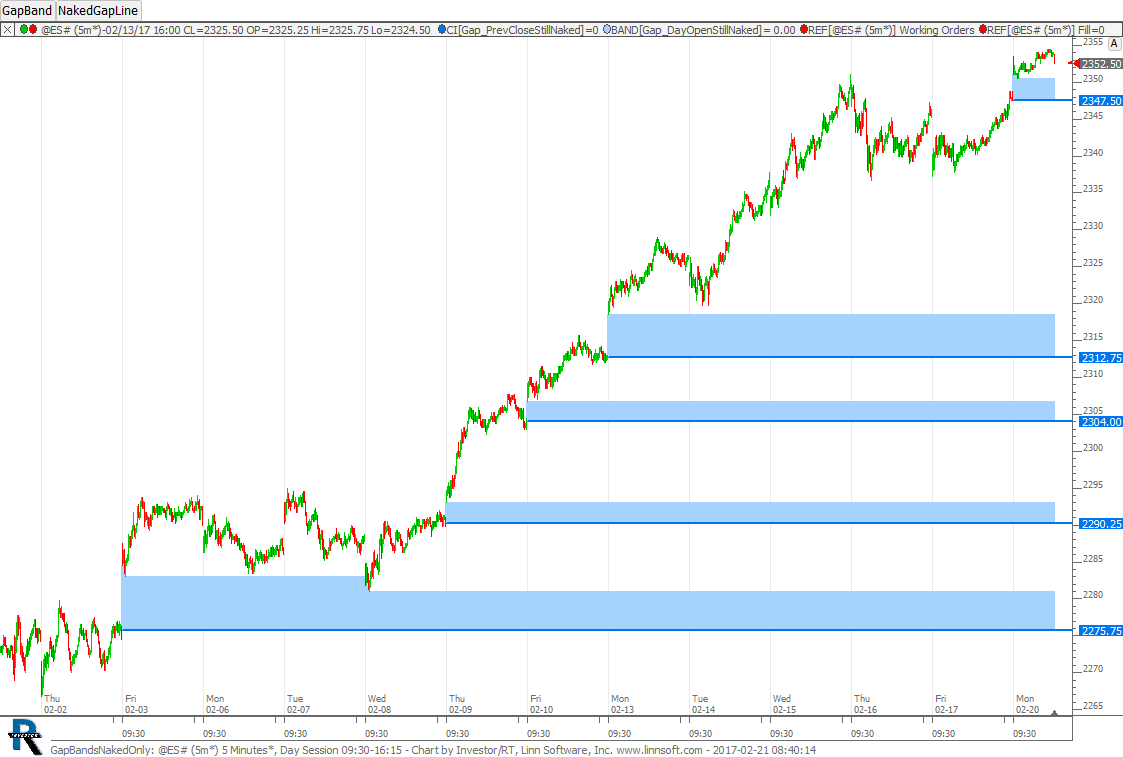 |
GapBandsNakedOnly (@ES#) cpayne [totalcount]
9 years 4 months ago
Gaps between sessions extended while naked and only shows the bands that are STILL naked. |
View |
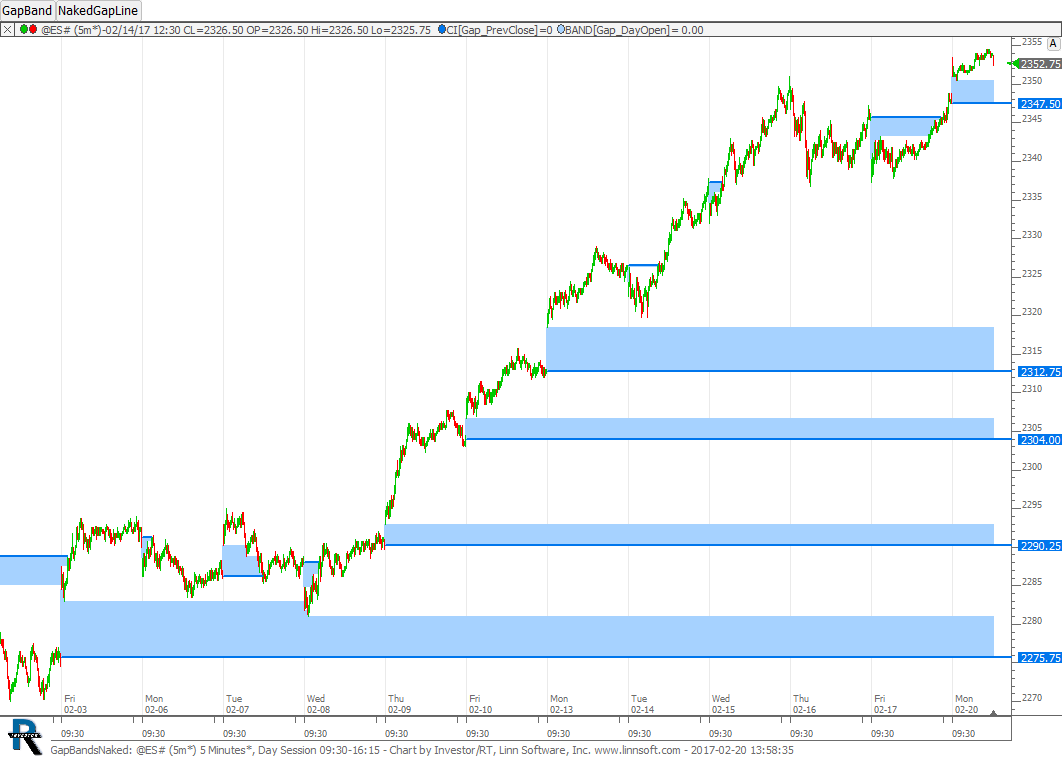 |
GapBandsNaked (@ES#) cpayne [totalcount]
9 years 4 months ago
Naked Gap Bands - Extends the gap between sessions until filled. This chart was uploaded by Investor/RT 12.7.1 showing symbol: @ES#. |
View |
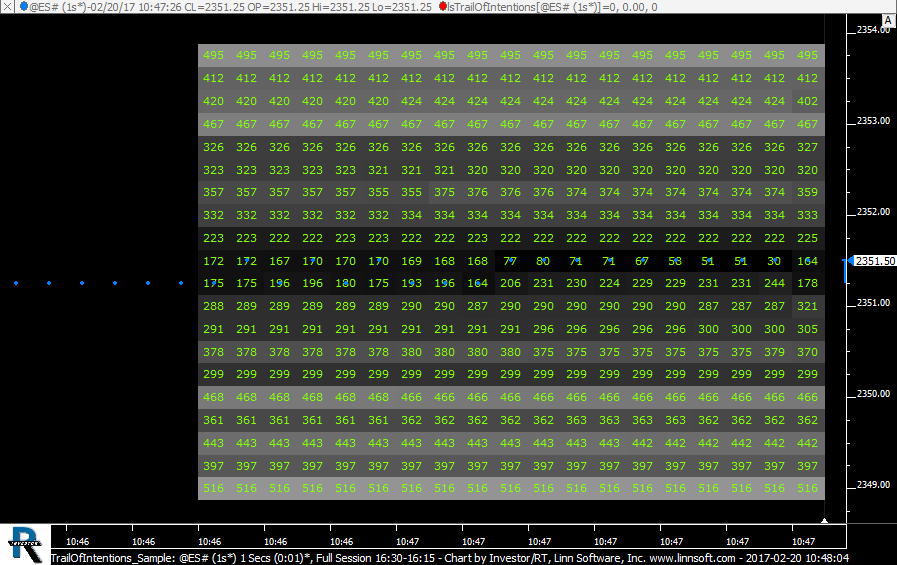 |
TrailOfIntentions Sample (@ES#) cpayne [totalcount]
9 years 4 months ago
TINT Sample. This chart was uploaded by Investor/RT 12.7.1 showing symbol: @ES#. |
View |
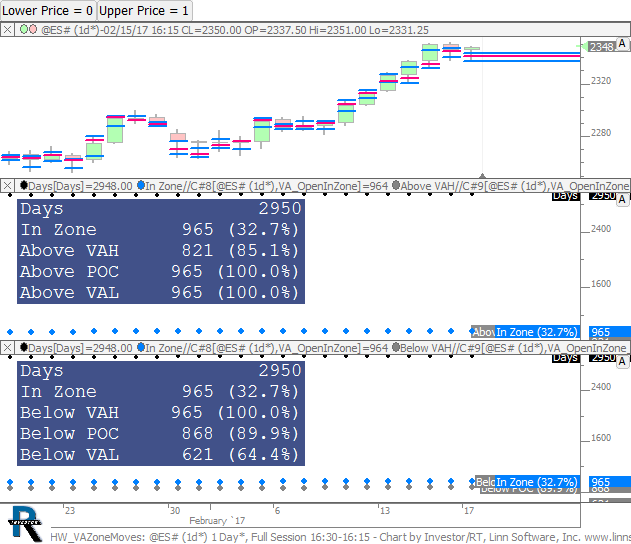 |
HW VAZoneMoves (@ES#) cpayne [totalcount]
9 years 4 months ago
Value Area Zone Move Analysis. This chart was uploaded by Investor/RT 12.7.1 showing symbol: @ES#. |
View |
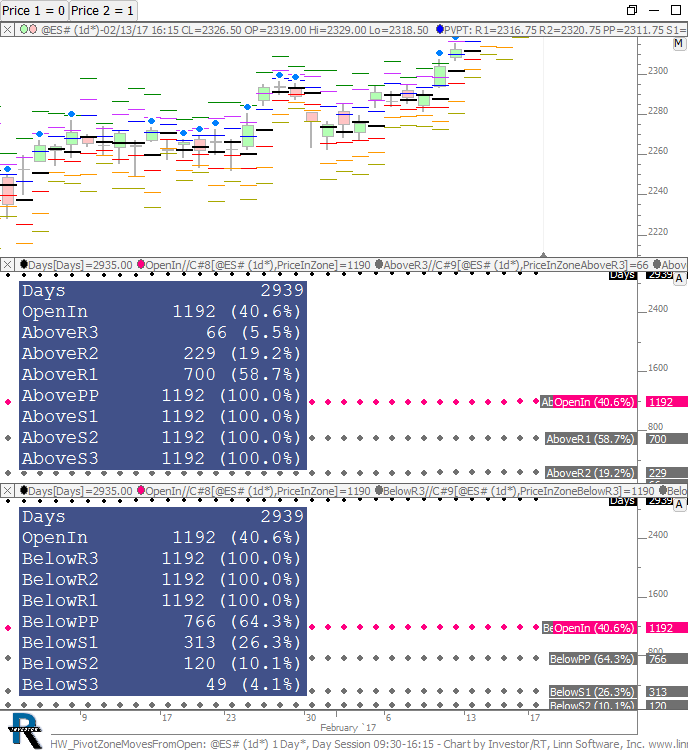 |
HW PivotZoneMovesFromOpen (@ES#) cpayne [totalcount]
9 years 4 months ago
Analyzes moves from opening pivot zone to each pivot level. This chart was uploaded by Investor/RT 12.7.1 showing symbol: @ES#. |
View |
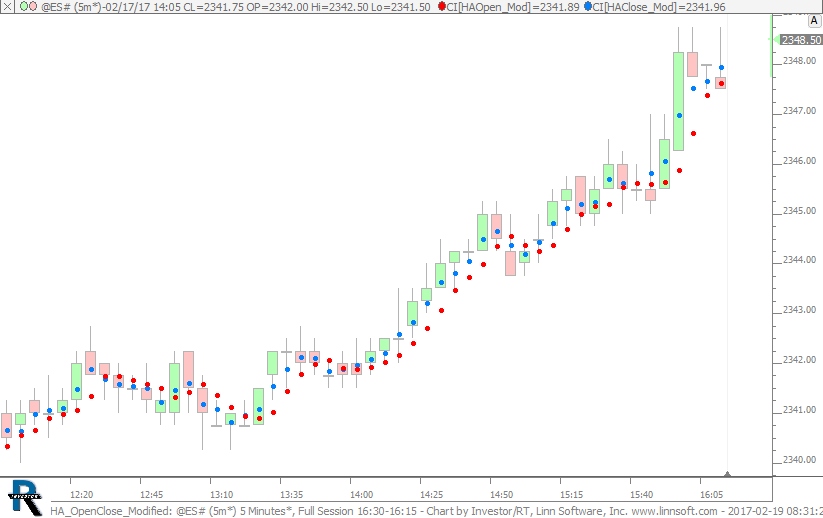 |
HA OpenClose Modified (@ES#) cpayne [totalcount]
9 years 4 months ago
Modified Heiken Ashii Open and Close. This chart was uploaded by Investor/RT 12.7.1 showing symbol: @ES#. |
View |
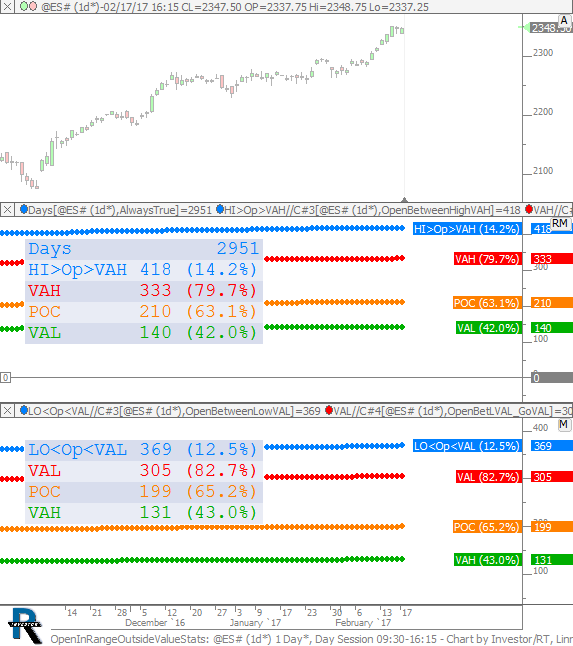 |
OpenInRangeOutsideValueStats (@ES#) cpayne [totalcount]
9 years 4 months ago
Open Inside Range and Outside Value Statistics. This chart was uploaded by Investor/RT 12.7.1 showing symbol: @ES#. |
View |
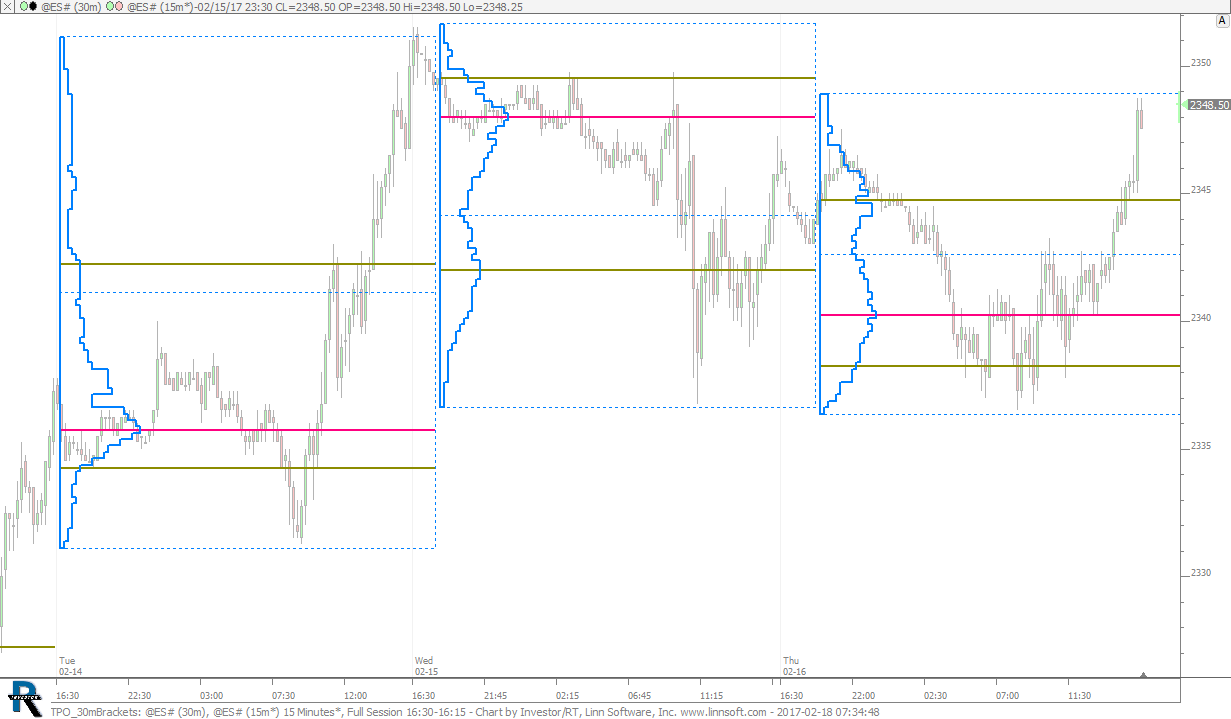 |
TPO 30mBrackets (@ES#) cpayne [totalcount]
9 years 4 months ago
30m Bracket TPO plotted on 15 minute bars. This chart was uploaded by Investor/RT 12.7.1 showing symbol: @ES#. |
View |
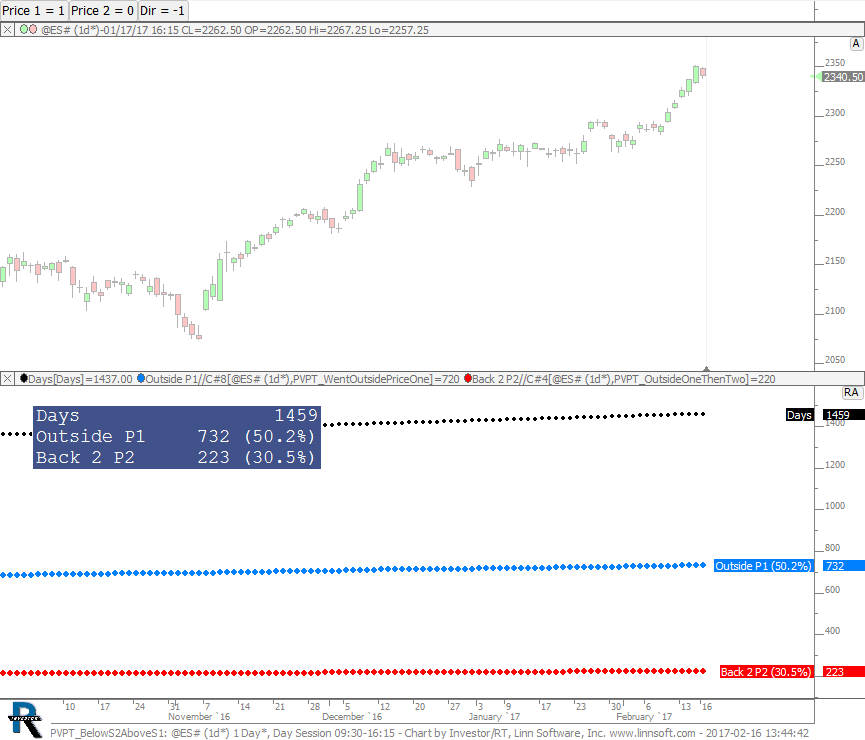 |
PVPT BelowS2AboveS1 (@ES#) cpayne [totalcount]
9 years 4 months ago
Pivot Point - Below S2 then Above S1. This chart was uploaded by Investor/RT 12.7.1 showing symbol: @ES#. |
View |
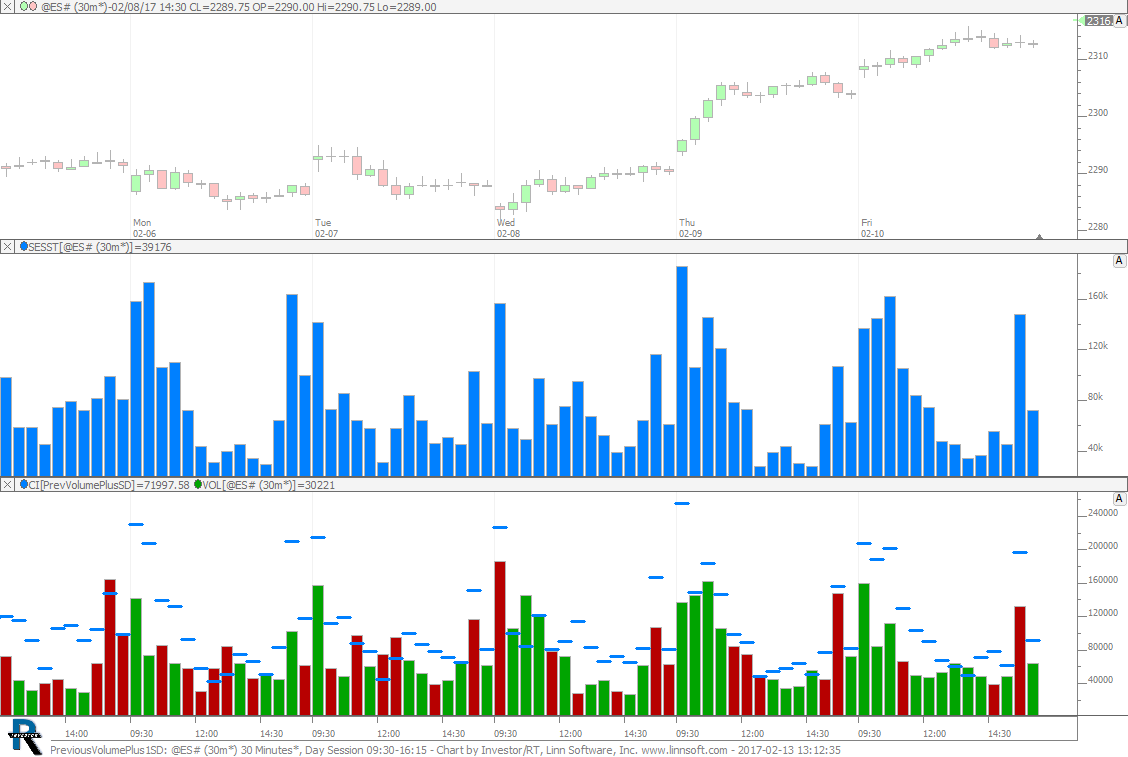 |
PreviousVolumePlus1SD (@ES#) cpayne [totalcount]
9 years 5 months ago
Previous Volume (Time of Day) Plus One Standard Deviation. This chart was uploaded by Investor/RT 12.7.1 showing symbol: @ES#. |
View |
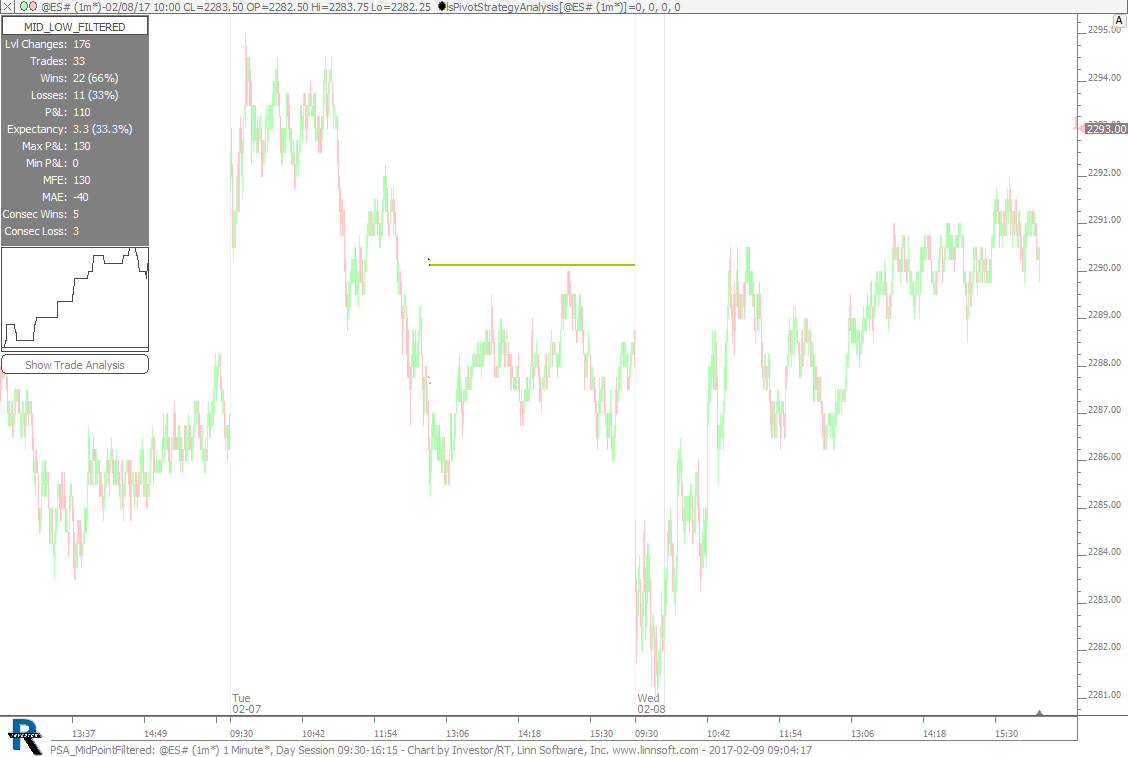 |
PSA MidPointFiltered (@ES#) cpayne [totalcount]
9 years 5 months ago
PSA - Midpoint approached from 2xIBL. This chart was uploaded by Investor/RT 12.7.1 showing symbol: @ES#. |
View |
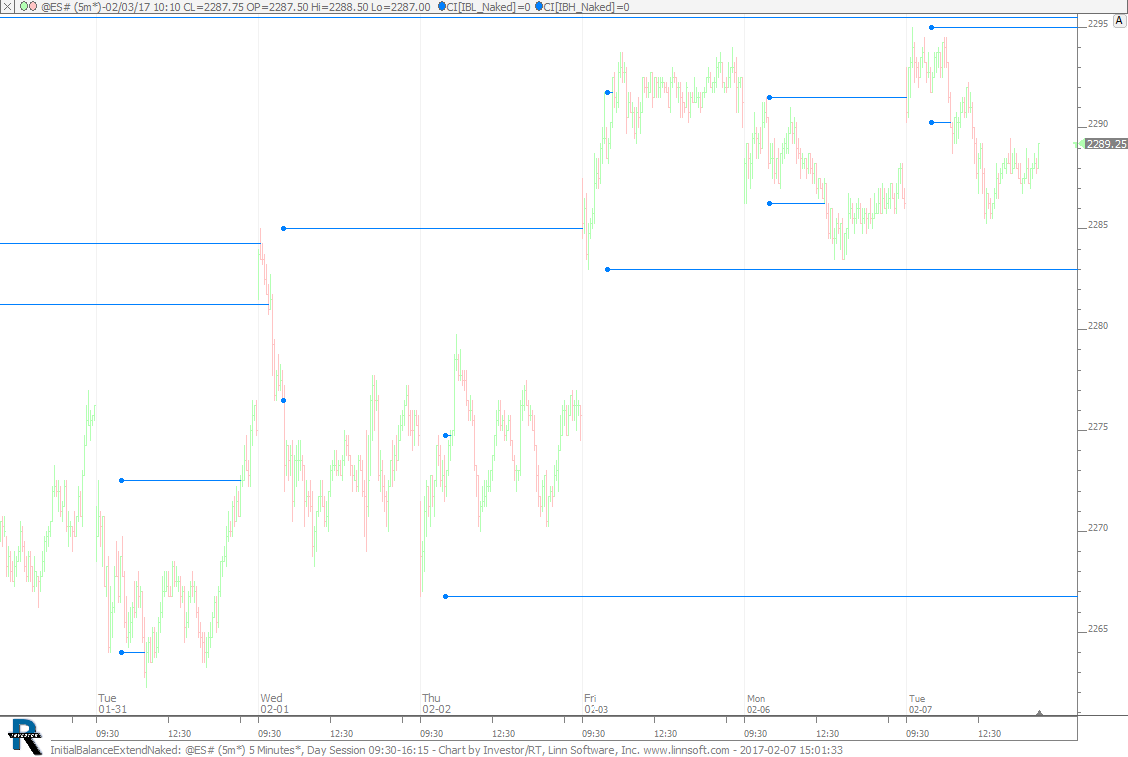 |
InitialBalanceExtendNaked (@ES#) cpayne [totalcount]
9 years 5 months ago
Naked Initial Balance Extension. This chart was uploaded by Investor/RT 12.7.1 showing symbol: @ES#. |
View |
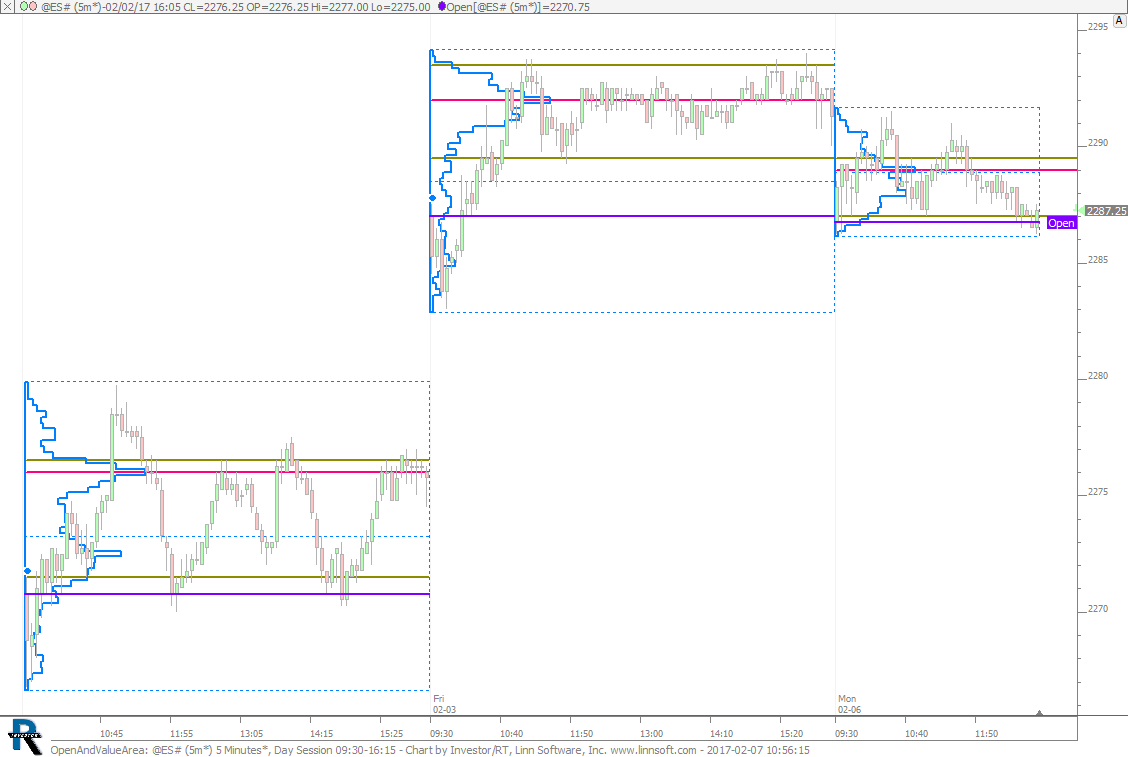 |
OpenAndValueArea (@ES#) cpayne [totalcount]
9 years 5 months ago
Open Relative to VAH / VAL. This chart was uploaded by Investor/RT 12.7.1 showing symbol: @ES#. |
View |
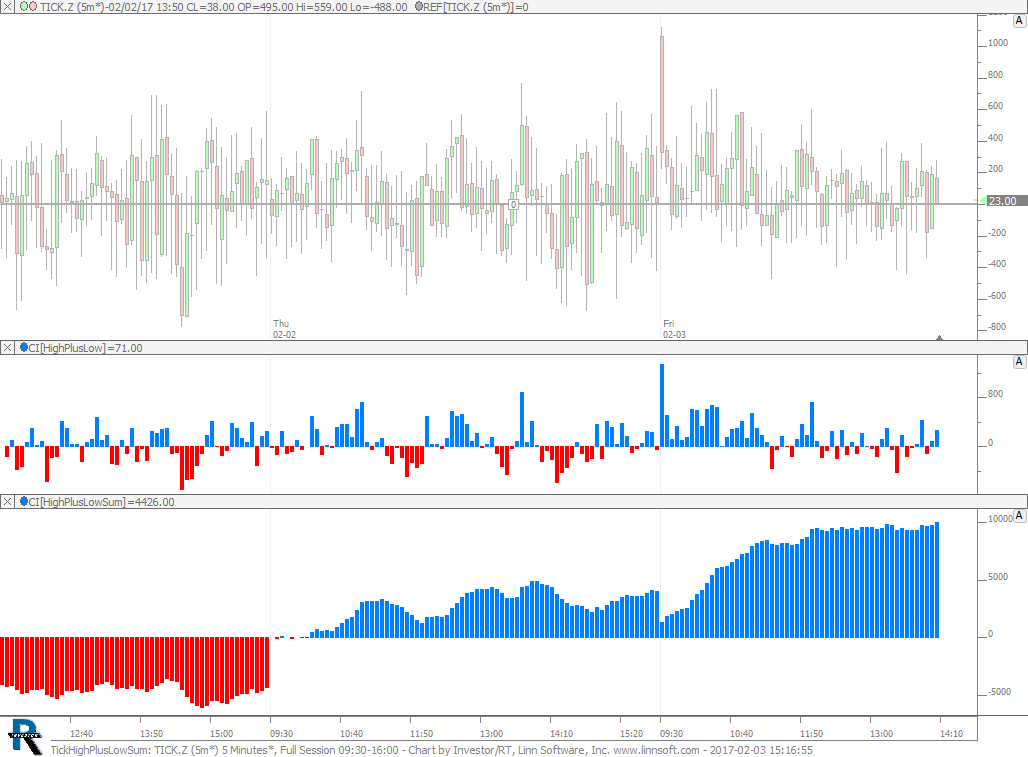 |
TickHighPlusLowSum (TICK.Z) cpayne [totalcount]
9 years 5 months ago
Tick High Plus Low Summed. This chart was uploaded by Investor/RT 12.7.1 showing symbol: TICK.Z. |
View |
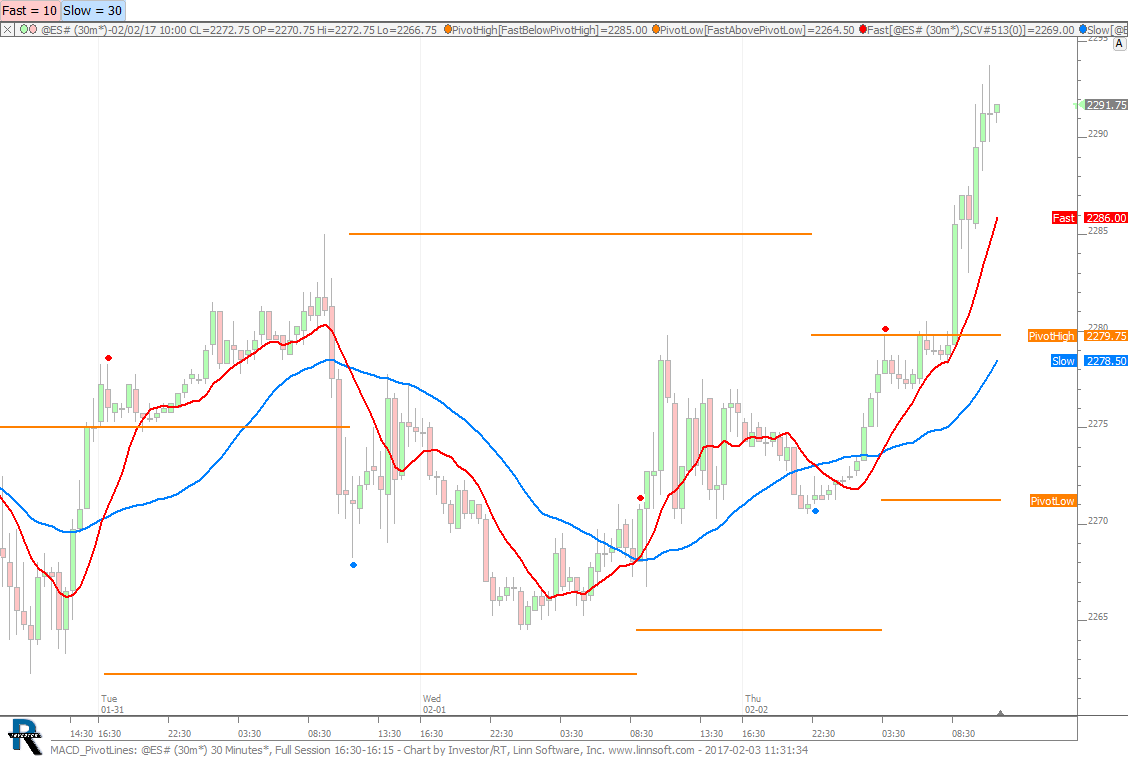 |
MACD PivotLines (@ES#) cpayne [totalcount]
9 years 5 months ago
MACD Pivot Lines. This chart was uploaded by Investor/RT 12.7.1 showing symbol: @ES#. |
View |
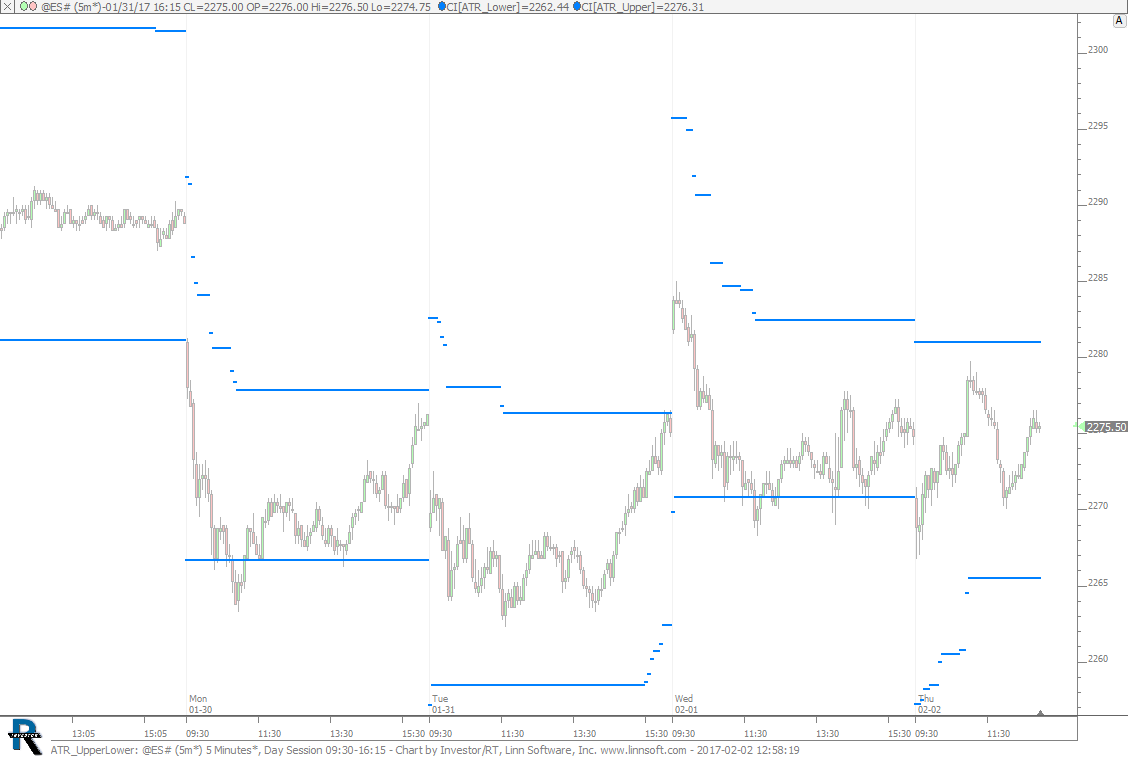 |
ATR UpperLower (@ES#) cpayne [totalcount]
9 years 5 months ago
ATR Upper and Lower Bands. This chart was uploaded by Investor/RT 12.7.1 showing symbol: @ES#. |
View |
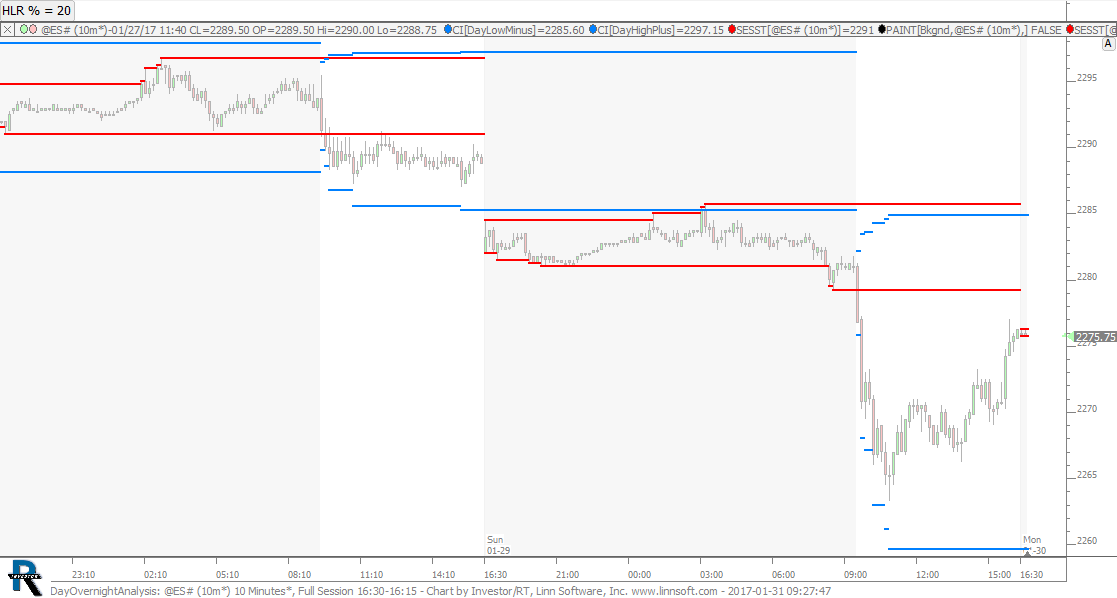 |
DayOvernightAnalysis (@ES#) cpayne [totalcount]
9 years 5 months ago
Day and Overnight Analysis. This chart was uploaded by Investor/RT 12.7.1 showing symbol: @ES#. |
View |
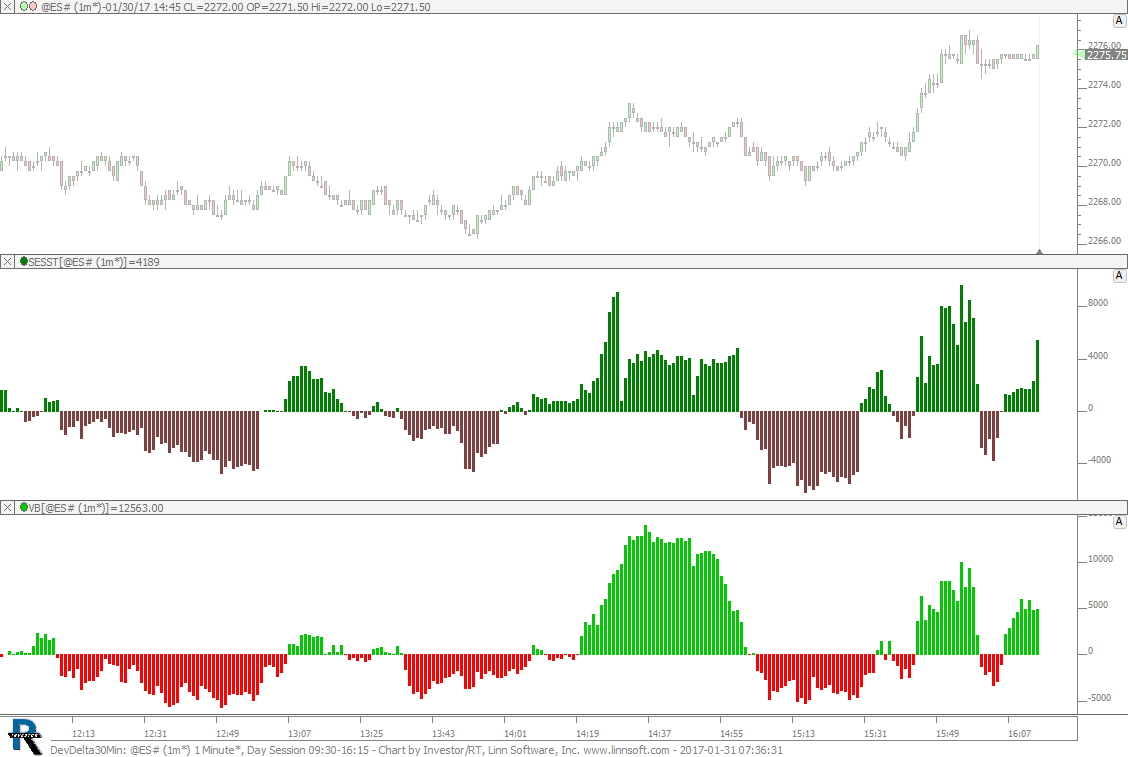 |
DevDelta30Min (@ES#) cpayne [totalcount]
9 years 5 months ago
Developing Delta 30 Minute Periods. This chart was uploaded by Investor/RT 12.7.1 showing symbol: @ES#. |
View |
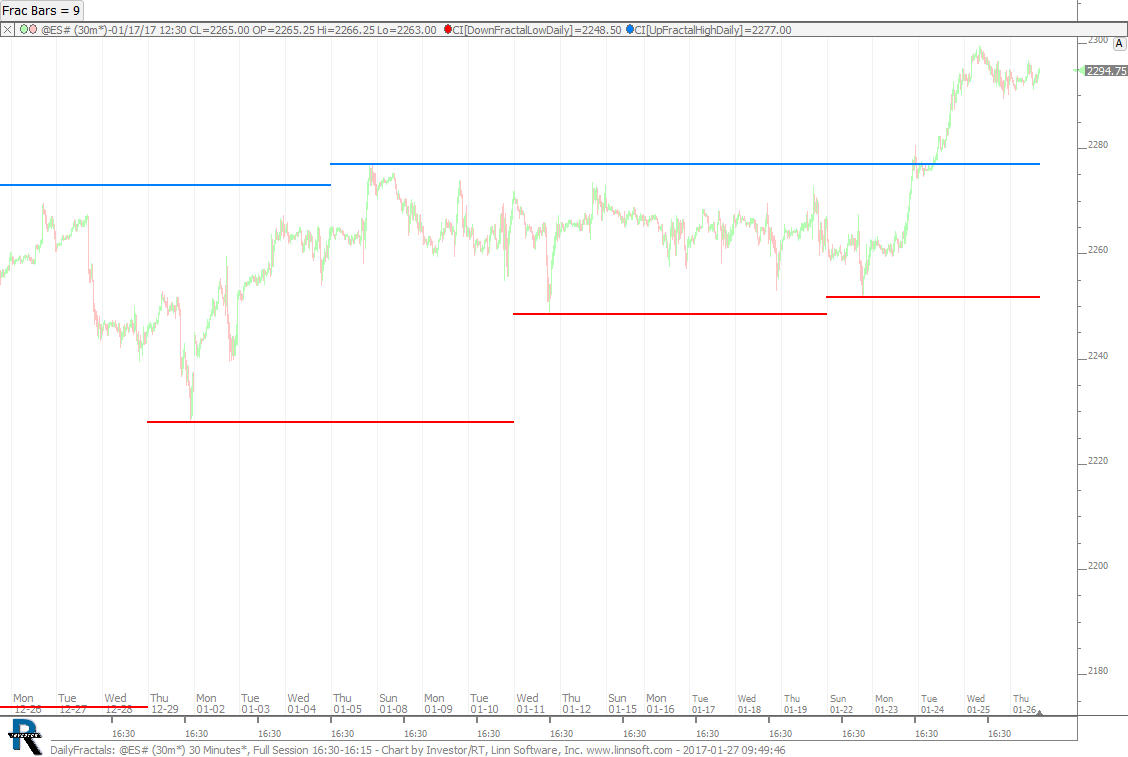 |
DailyFractals (@ES#) cpayne [totalcount]
9 years 5 months ago
Daily Fractals on Intraday Chart. This chart was uploaded by Investor/RT 12.7.1 showing symbol: @ES#. |
View |