 |
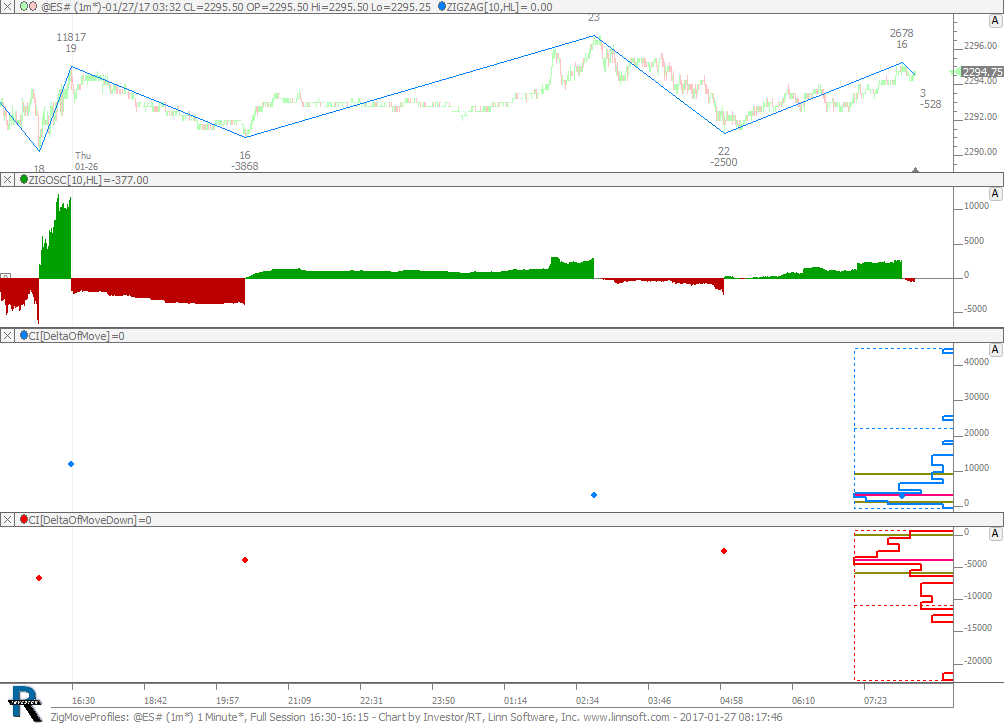
ZigMoveProfiles (@ES#) cpayne [totalcount]
9 years 5 months ago
Zig Zag Moves Profiled. This chart was uploaded by Investor/RT 12.7.1 showing symbol: @ES#. |
View |
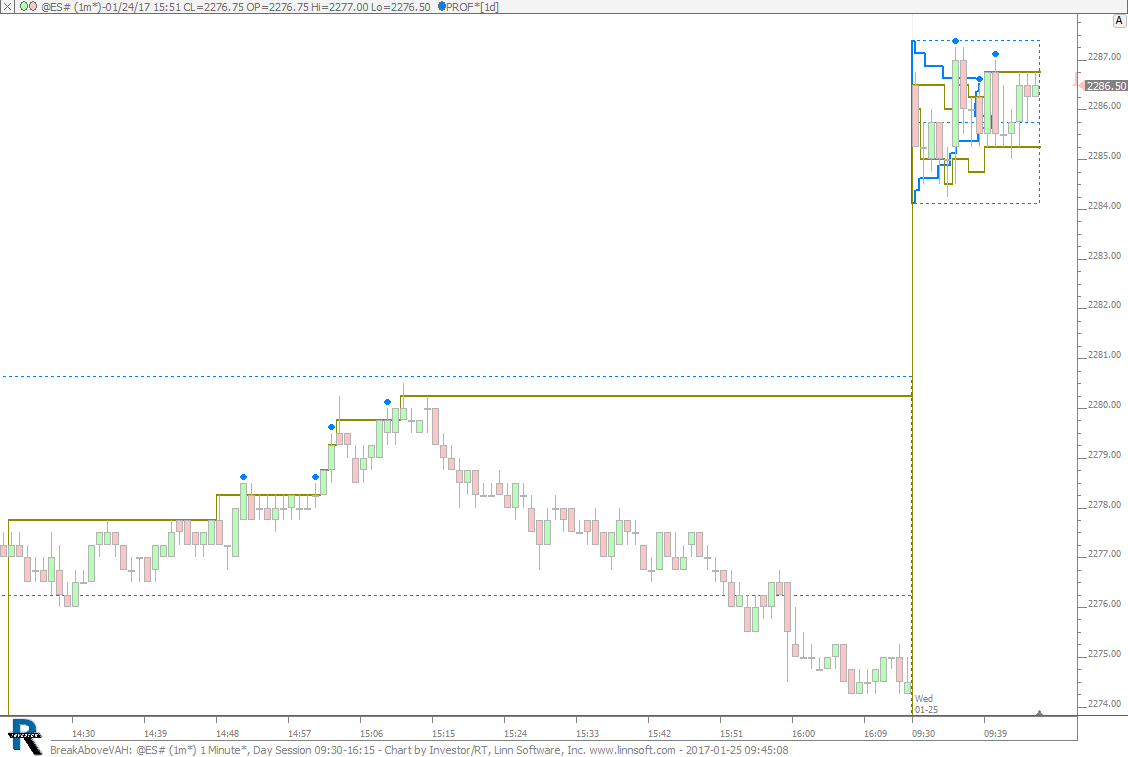 |
BreakAboveVAH (@ES#) cpayne [totalcount]
9 years 5 months ago
Break Above VAH. This chart was uploaded by Investor/RT 12.7.1 showing symbol: @ES#. |
View |
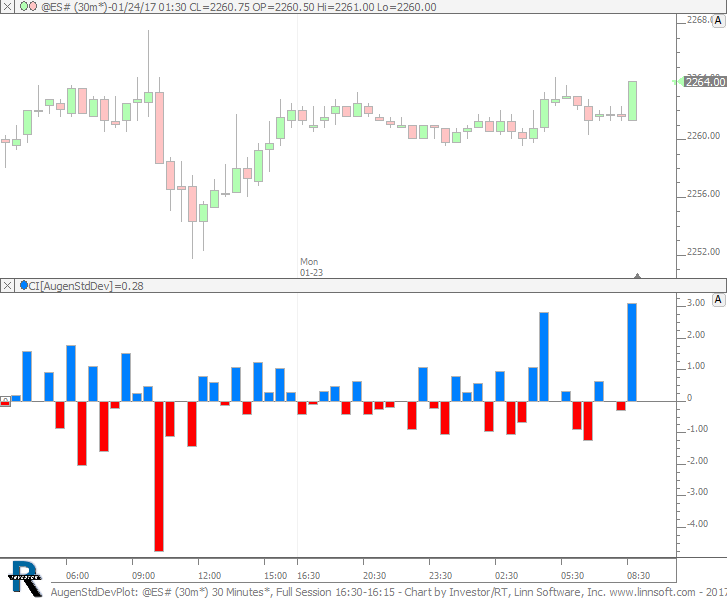 |
AugenStdDevPlot (@ES#) cpayne [totalcount]
9 years 5 months ago
Augen Standard Deviation Plot. This chart was uploaded by Investor/RT 12.7.1 showing symbol: @ES#. |
View |
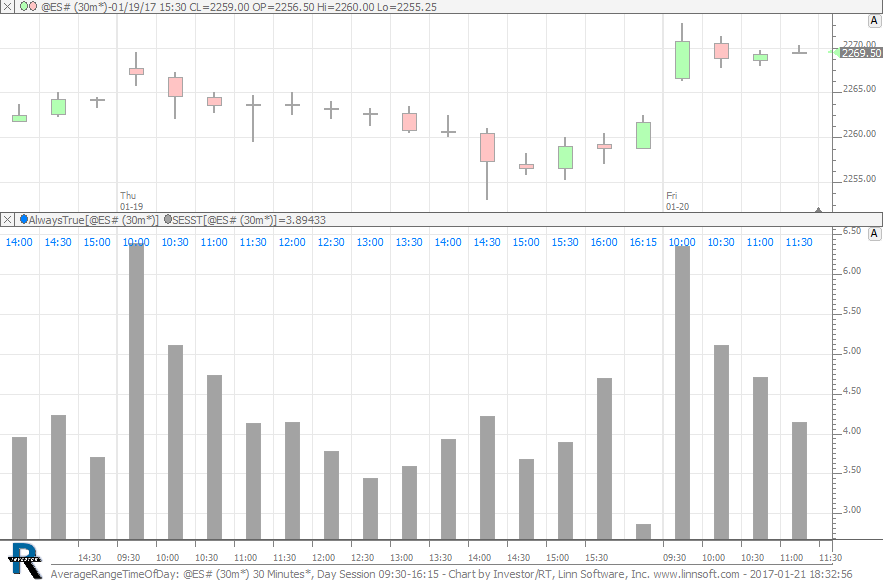 |
AverageRangeTimeOfDay (@ES#) cpayne [totalcount]
9 years 5 months ago
Average Range - Time of Day. This chart was uploaded by Investor/RT 12.7.1 showing symbol: @ES#. |
View |
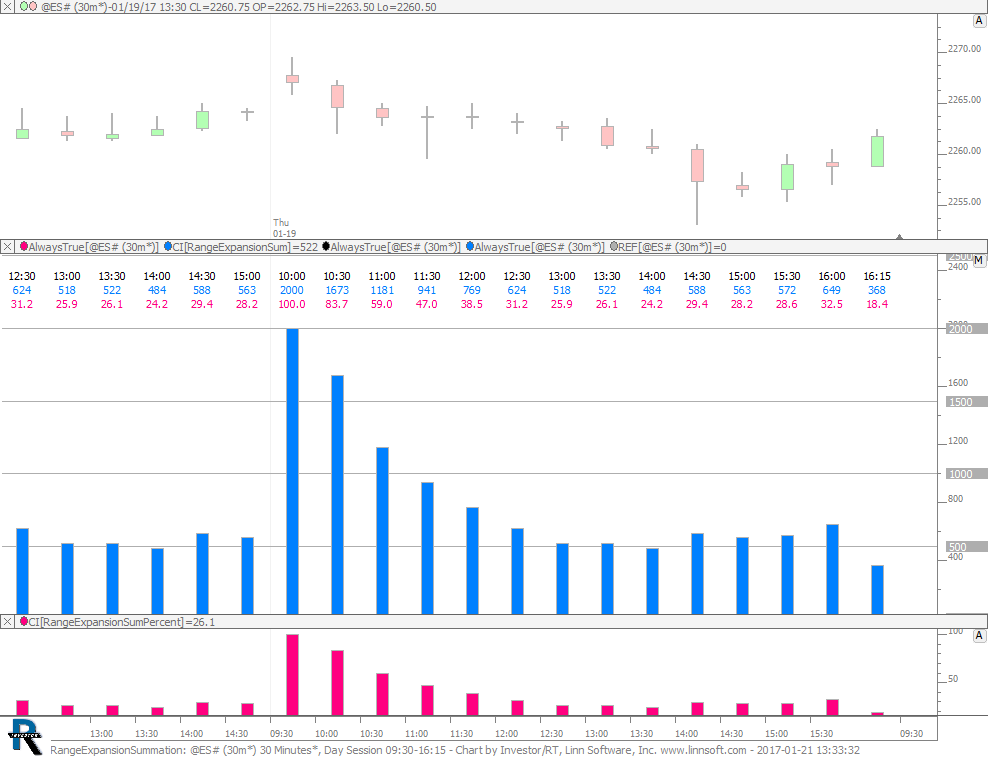 |
RangeExpansionSummation (@ES#) cpayne [totalcount]
9 years 5 months ago
Range Expansion Summation. This chart was uploaded by Investor/RT 12.7.1 showing symbol: @ES#. |
View |
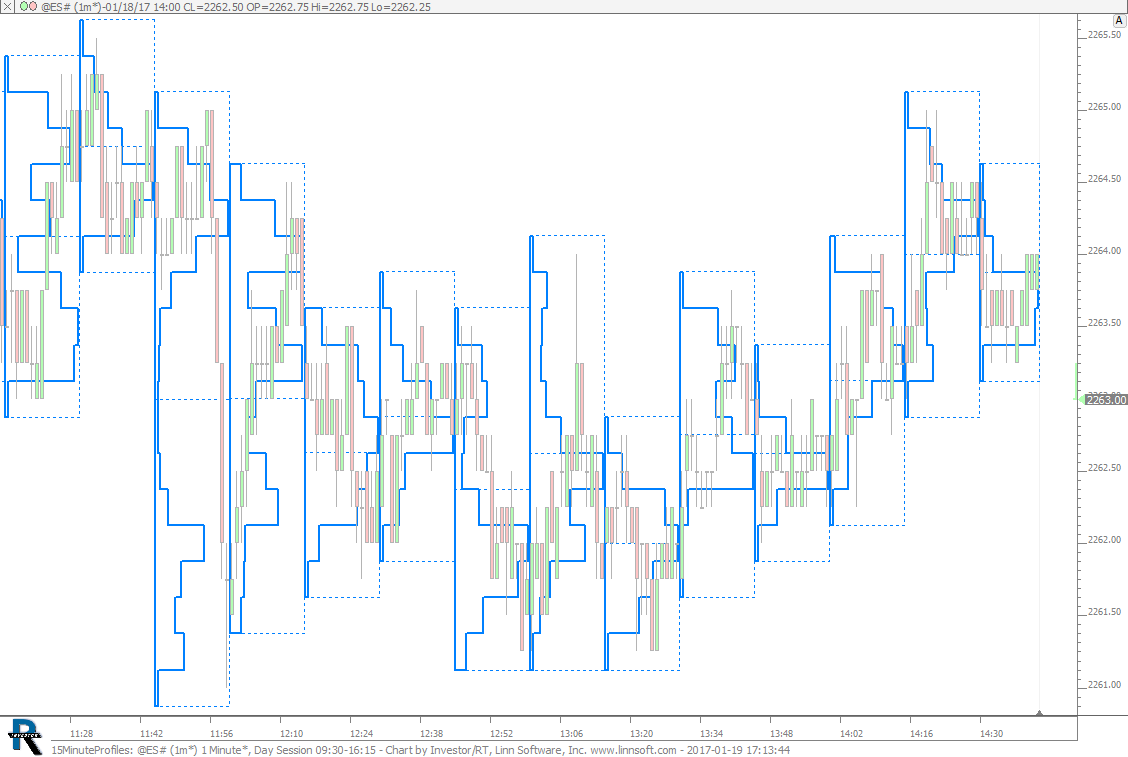 |
15MinuteProfiles (@ES#) cpayne [totalcount]
9 years 5 months ago
15 Minute Profiles. This chart was uploaded by Investor/RT 12.7.1 showing symbol: @ES#. |
View |
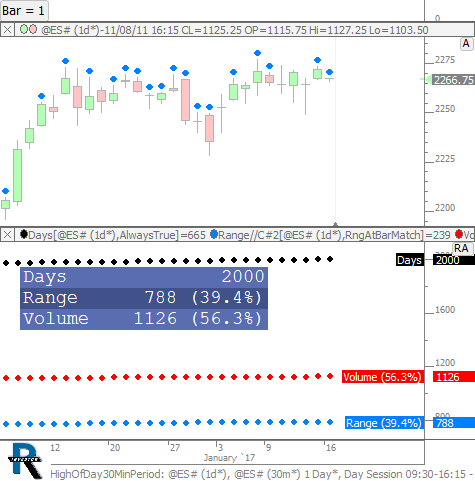 |
HighOfDay30MinPeriod (@ES#) cpayne [totalcount]
9 years 6 months ago
30 Minute Period with Max Range and Volume. This chart was uploaded by Investor/RT 12.7.1 showing symbol: @ES#. |
View |
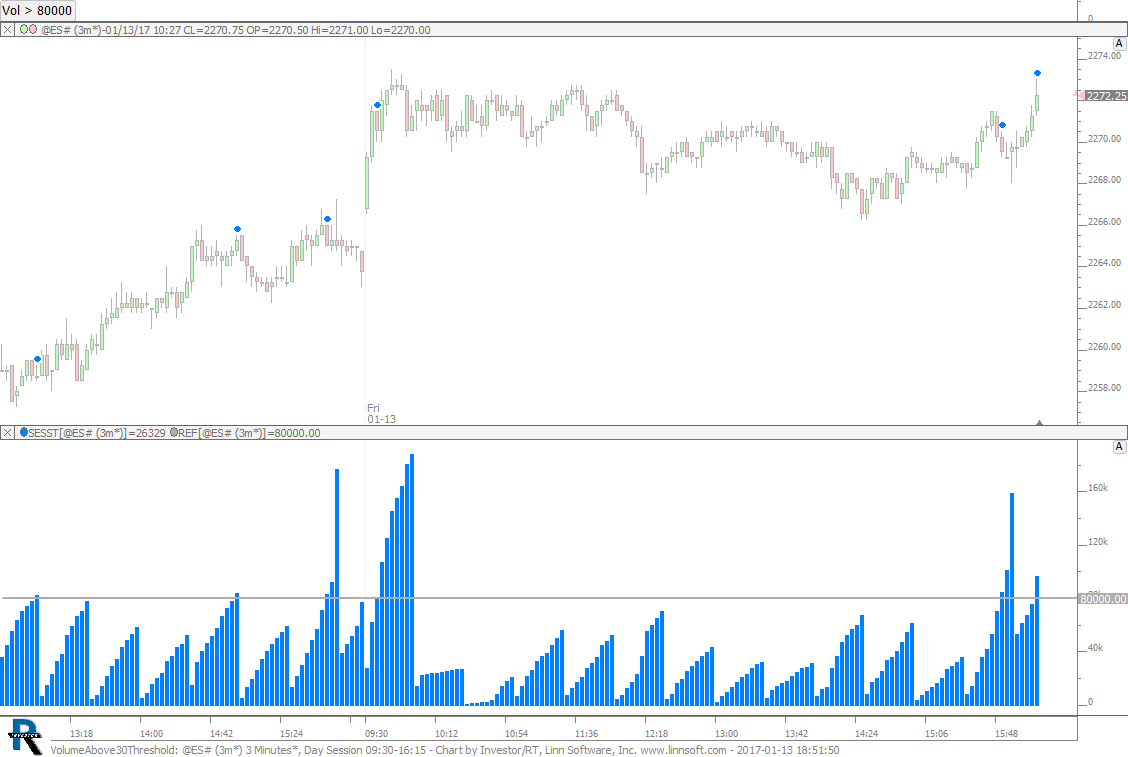 |
VolumeAbove30Threshold (@ES#) cpayne [totalcount]
9 years 6 months ago
Volume Above Threshold on 30 Minute Bars. This chart was uploaded by Investor/RT 12.7.1 showing symbol: @ES#. |
View |
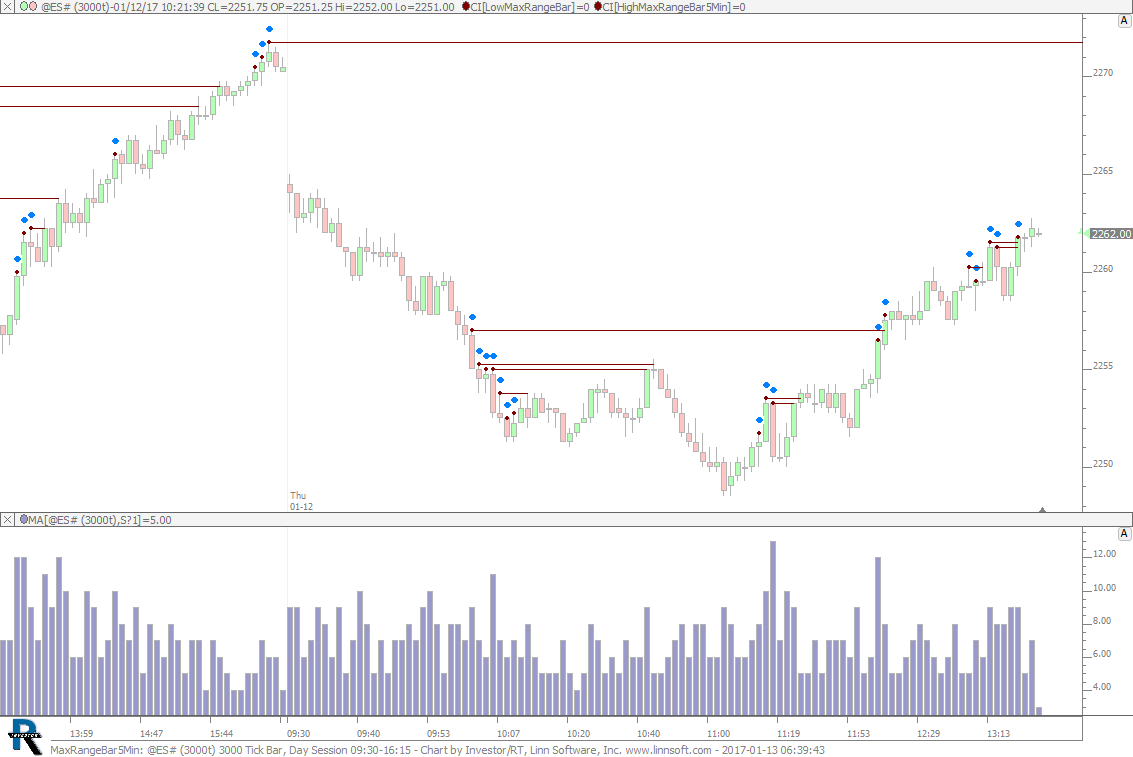 |
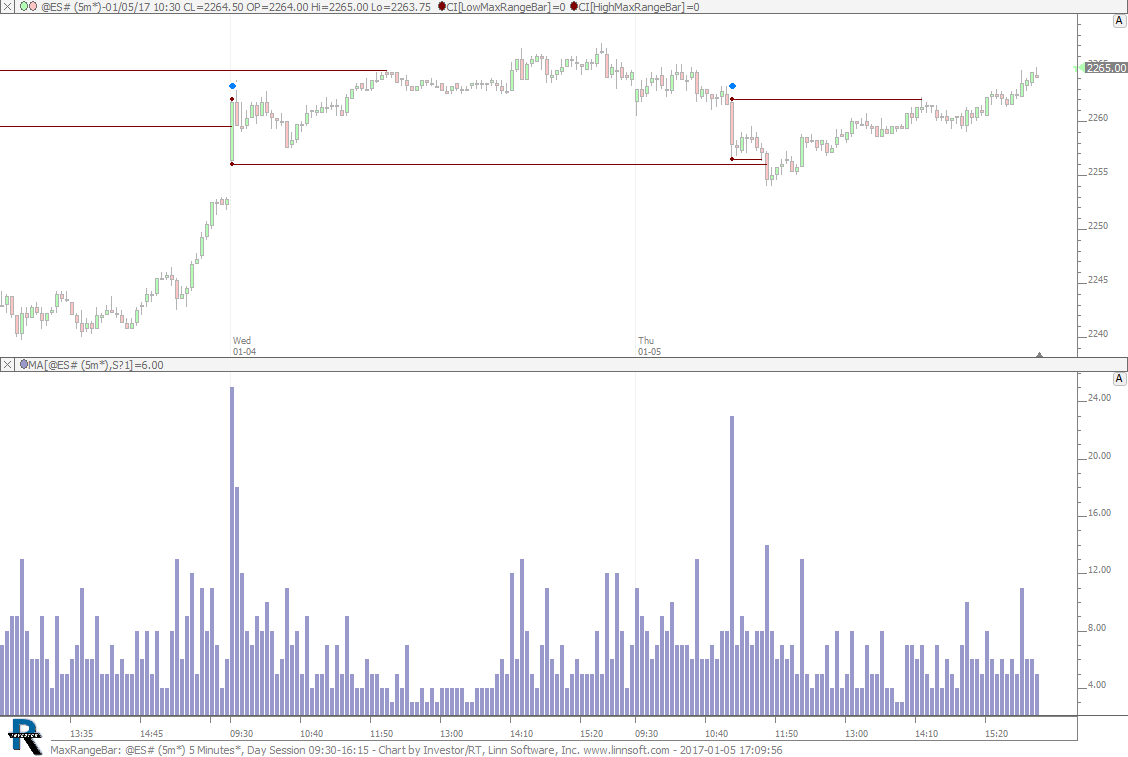
MaxRangeBar5Min (@ES#) cpayne [totalcount]
9 years 6 months ago
Max Range Bar - 5 Min. This chart was uploaded by Investor/RT 12.7.1 showing symbol: @ES#. |
View |
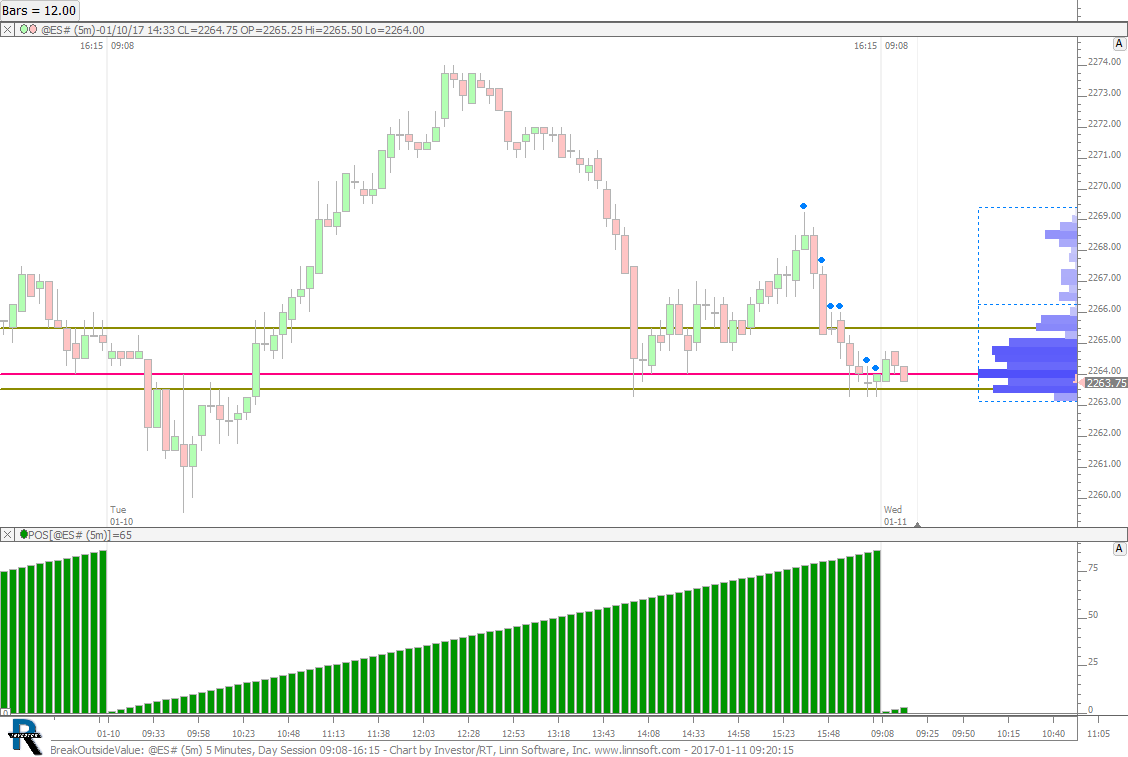 |
BreakOutsideValue (@ES#) cpayne [totalcount]
9 years 6 months ago
Price Breaking Outside of Value Area. This chart was uploaded by Investor/RT 12.7.1 showing symbol: @ES#. |
View |
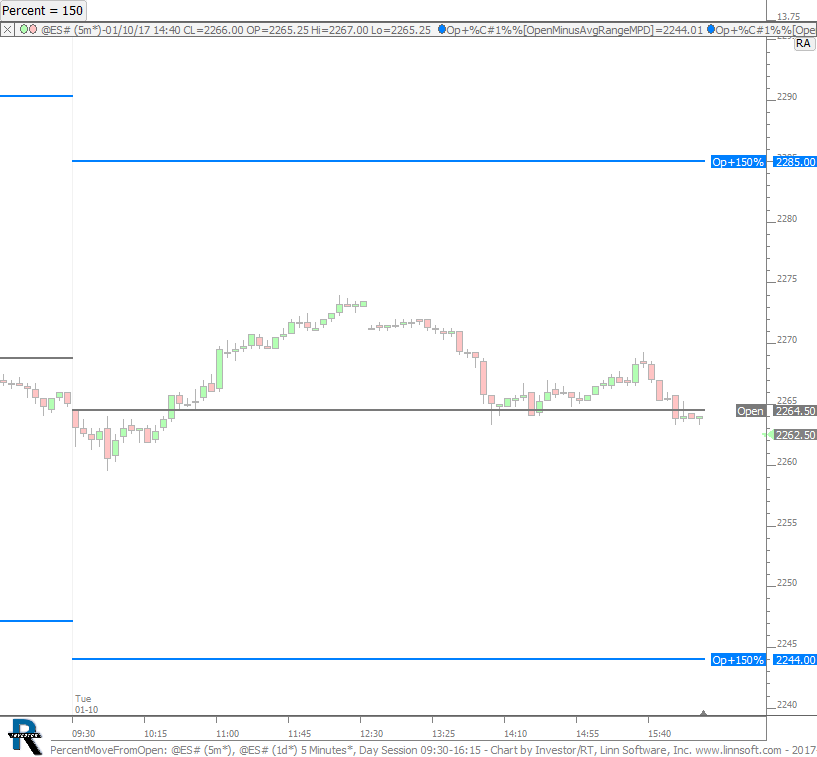 |
PercentMoveFromOpen (@ES#) cpayne [totalcount]
9 years 6 months ago
Open and Open Percent Bands. This chart was uploaded by Investor/RT 12.7.1 showing symbol: @ES#. |
View |
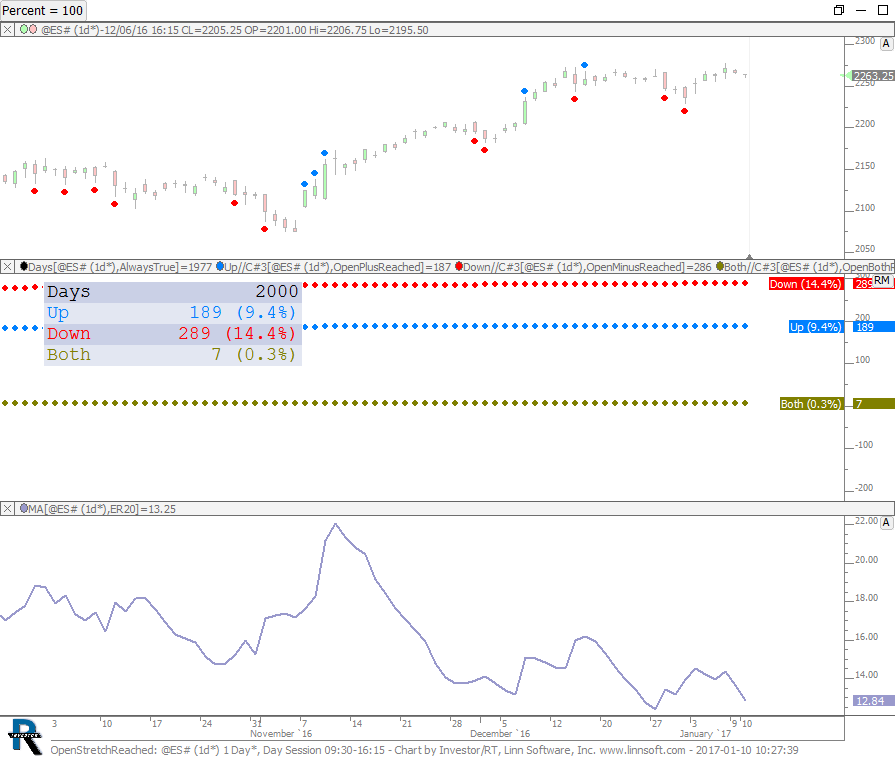 |
OpenStretchReached (@ES#) cpayne [totalcount]
9 years 6 months ago
Open Stretch - Moves from Open by Percent of Daily Range. This chart was uploaded by Investor/RT 12.7.1 showing symbol: @ES#. |
View |
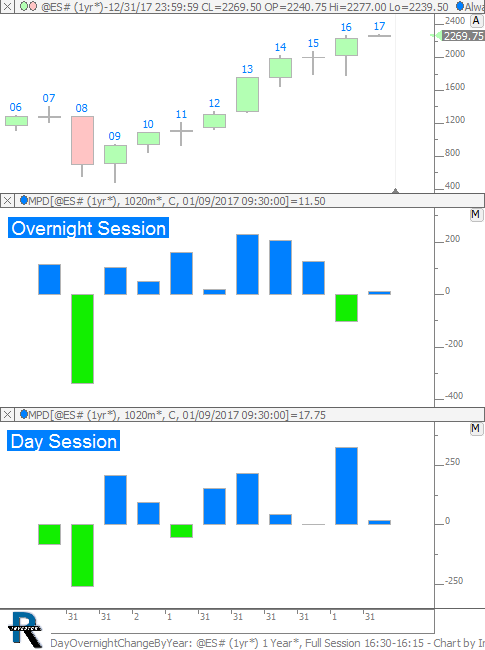 |
DayOvernightChangeByYear (@ES#) cpayne [totalcount]
9 years 6 months ago
Change of Year broken down by Day and Overnight Sessions. This chart was uploaded by Investor/RT 12.7.1 showing symbol: @ES#. |
View |
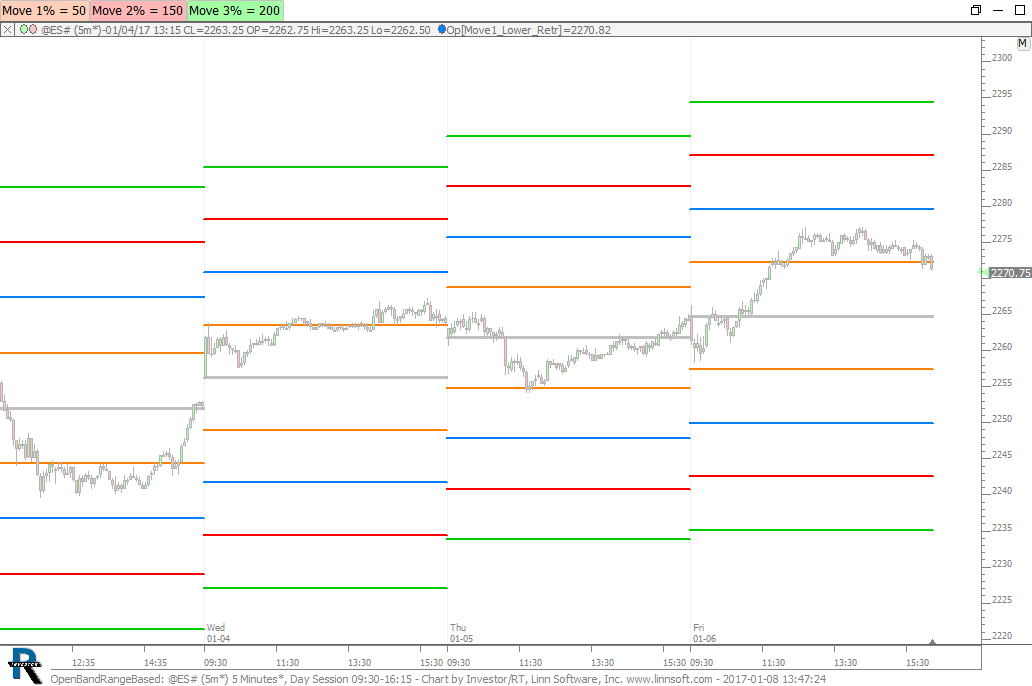 |
OpenBandRangeBased (@ES#) cpayne [totalcount]
9 years 6 months ago
Open Bands based on Percent of Average Daily Range. This chart was uploaded by Investor/RT 12.7.1 showing symbol: @ES#. |
View |
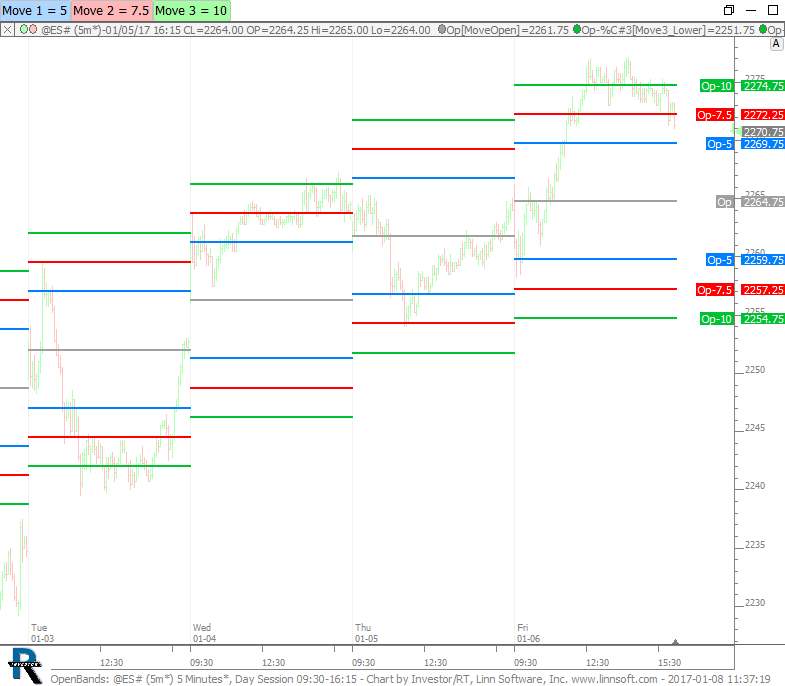 |
OpenBands (@ES#) cpayne [totalcount]
9 years 6 months ago
Measured bands from open. Control move magnitude with buttons. This chart was uploaded by Investor/RT 12.7.1 showing symbol: @ES#. |
View |
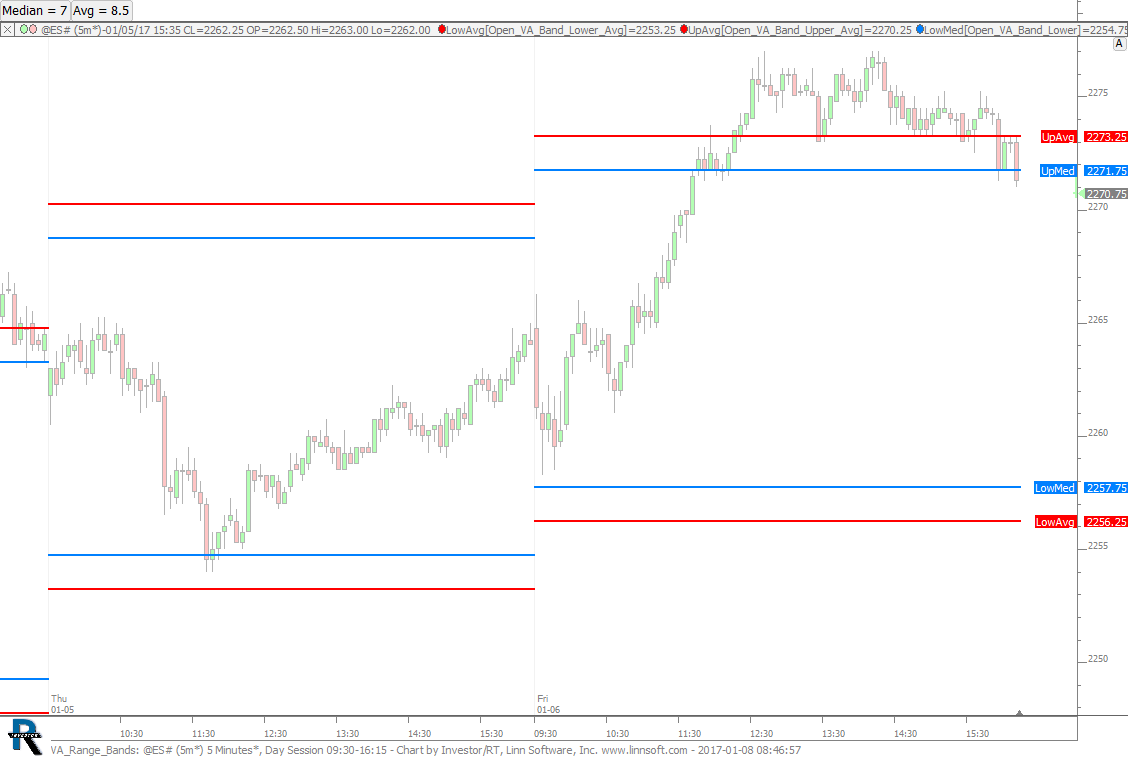 |
VA Range Bands (@ES#) cpayne [totalcount]
9 years 6 months ago
VA Range Bands. This chart was uploaded by Investor/RT 12.7.1 showing symbol: @ES#. |
View |
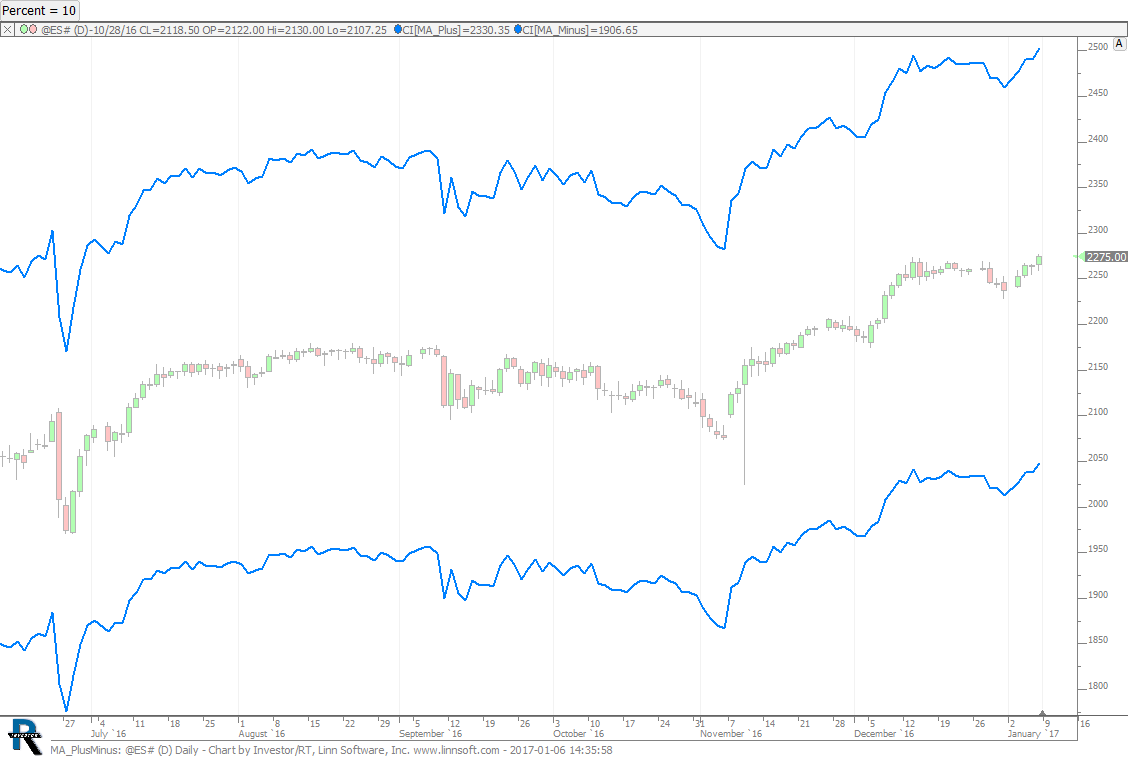 |
MA PlusMinus (@ES#) cpayne [totalcount]
9 years 6 months ago
Close Plus/Minus Percent. This chart was uploaded by Investor/RT 12.7.1 showing symbol: @ES#. |
View |
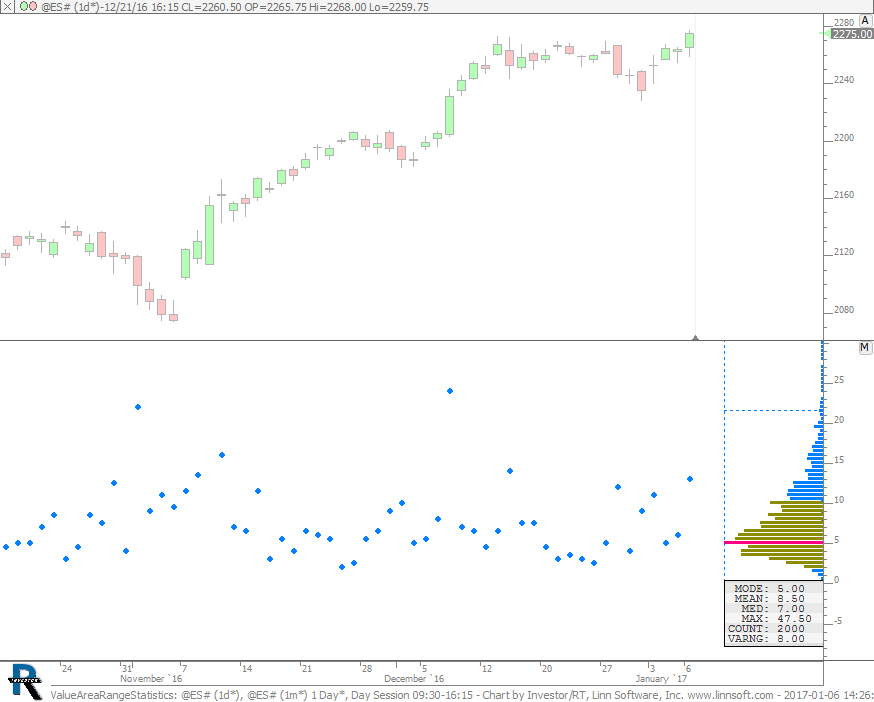 |
ValueAreaRangeStatistics (@ES#) cpayne [totalcount]
9 years 6 months ago
Value Area Range Statistics. This chart was uploaded by Investor/RT 12.7.1 showing symbol: @ES#. |
View |
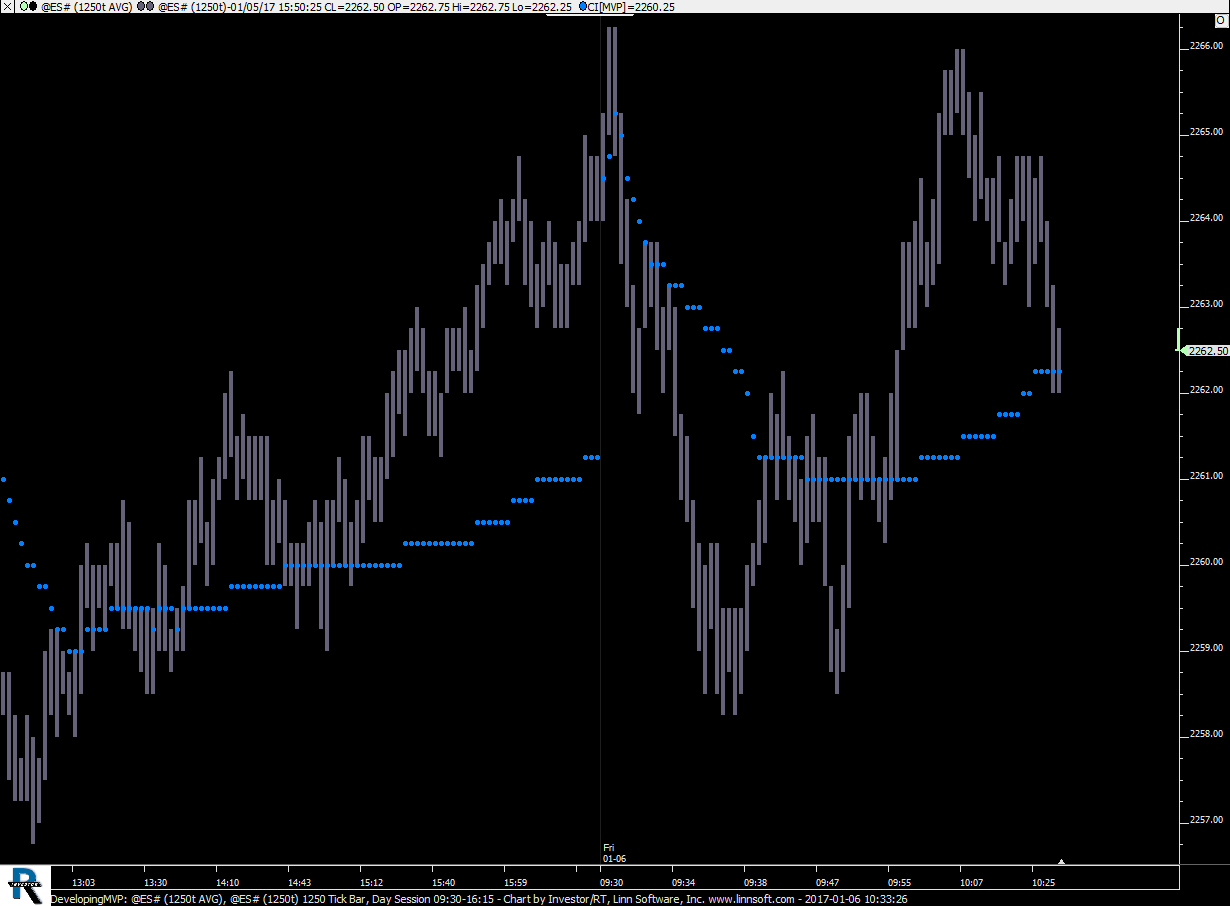 |
DevelopingMVP (@ES#) cpayne [totalcount]
9 years 6 months ago
Developing Mid Volume Price (Using Layered - Average Bars). This chart was uploaded by Investor/RT 12.7.1 showing symbol: @ES#. |
View |
 |
MaxRangeBar (@ES#) cpayne [totalcount]
9 years 6 months ago
Max Range Bar of Session. This chart was uploaded by Investor/RT 12.7.1 showing symbol: @ES#. |
View |
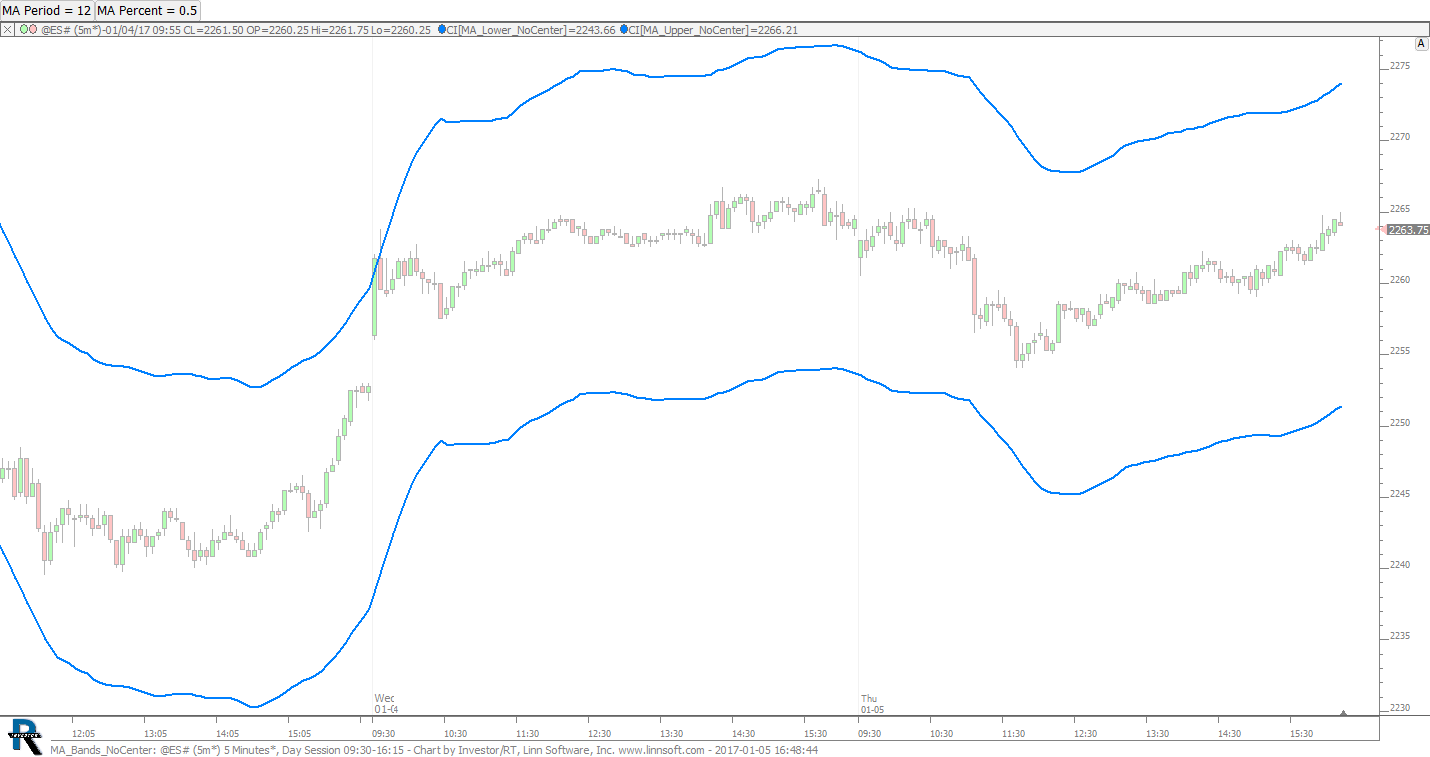 |
MA Bands NoCenter (@ES#) cpayne [totalcount]
9 years 6 months ago
Moving Average Percent Bands - No Center Band. This chart was uploaded by Investor/RT 12.7.1 showing symbol: @ES#. |
View |
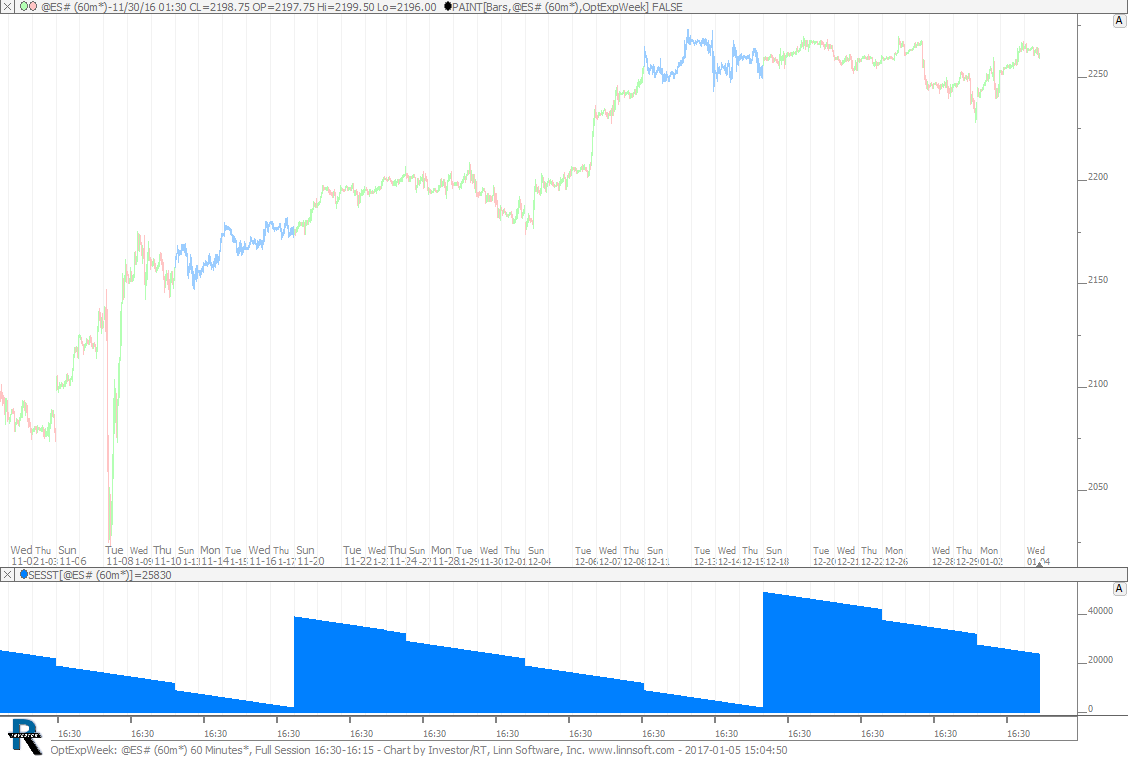 |
OptExpWeek (@ES#) cpayne [totalcount]
9 years 6 months ago
Painted Expiration Week. This chart was uploaded by Investor/RT 12.7.1 showing symbol: @ES#. |
View |
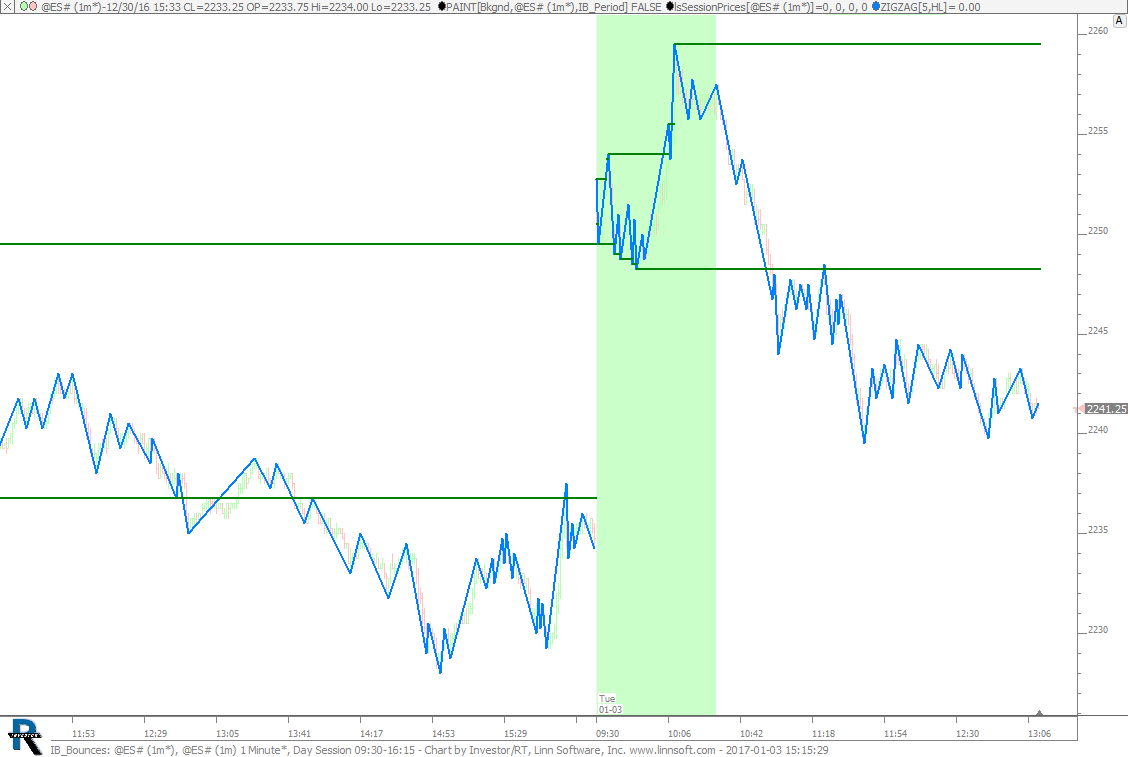 |
IB Bounces (@ES#) cpayne [totalcount]
9 years 6 months ago
IB Bounces. This chart was uploaded by Investor/RT 12.7.1 showing symbol: @ES#. |
View |
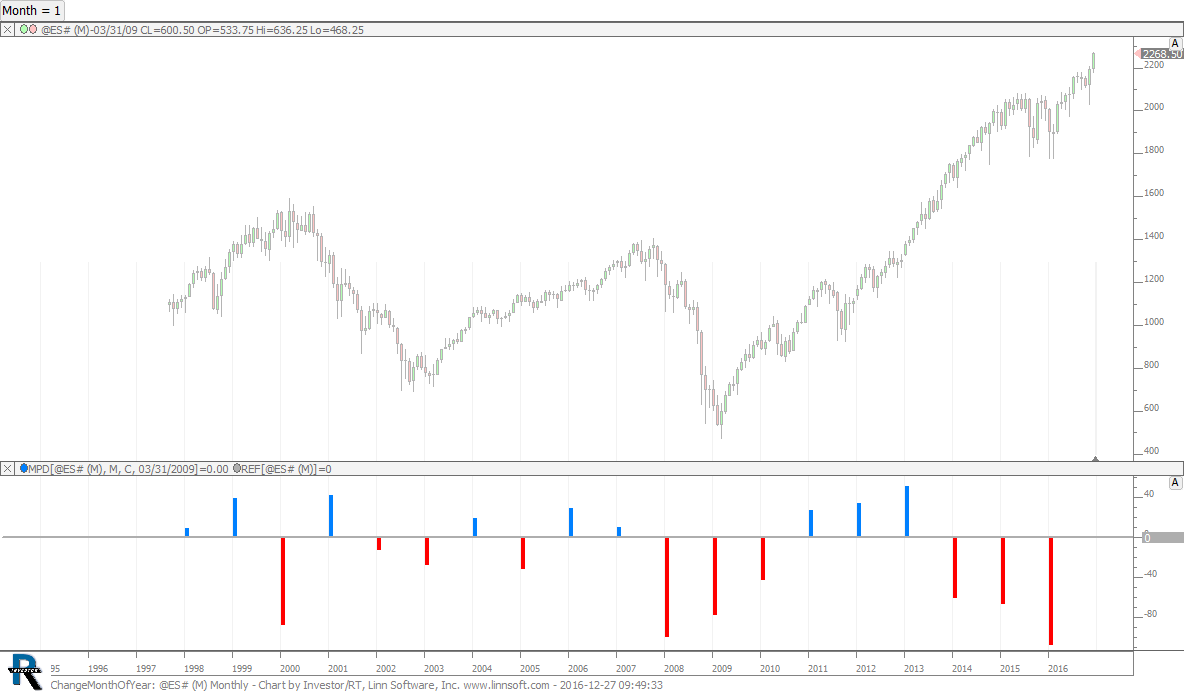 |
ChangeMonthOfYear (@ES#) cpayne [totalcount]
9 years 6 months ago
Change by Month. Use button at top to choose the month (1 for Jan, 2 for Feb, etc). This chart was uploaded by Investor/RT 12.7.1 showing symbol: @ES#. |
View |
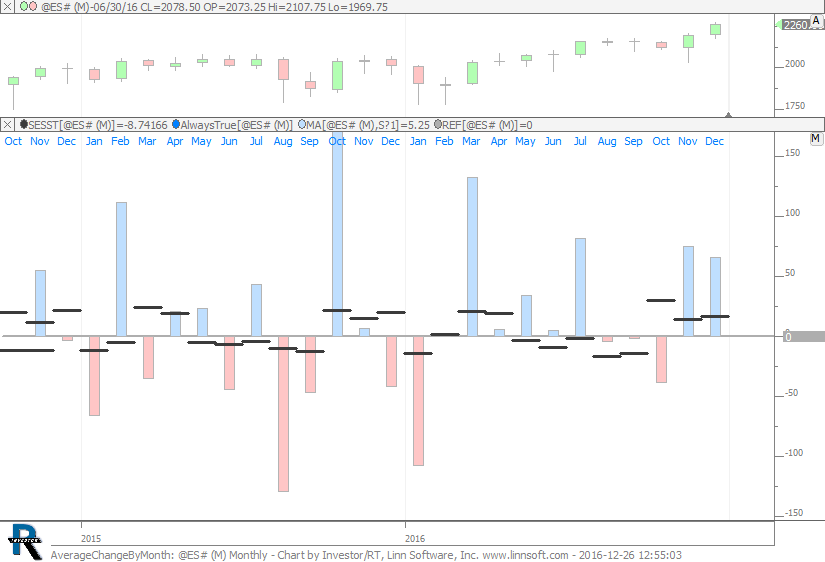 |
AverageChangeByMonth (@ES#) cpayne [totalcount]
9 years 6 months ago
Average Change By Month - Black is Average since 1998. Histogram is change of that month. This chart was uploaded by Investor/RT 12.7.1 showing symbol: @ES#. |
View |