 |
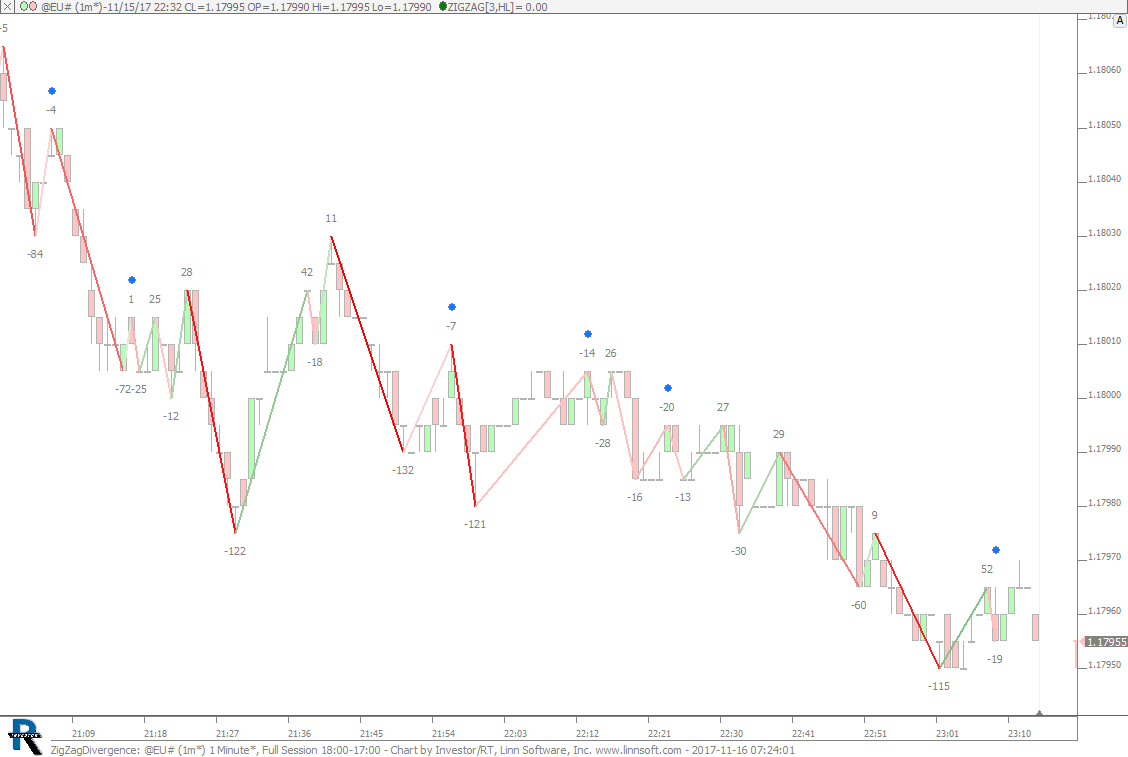
ZigZagDivergence (@EU#) cpayne [totalcount]
8 years 8 months ago
Zig Zag Divergence. This chart was uploaded by Investor/RT 13.1.1 showing symbol: @EU#. |
View |
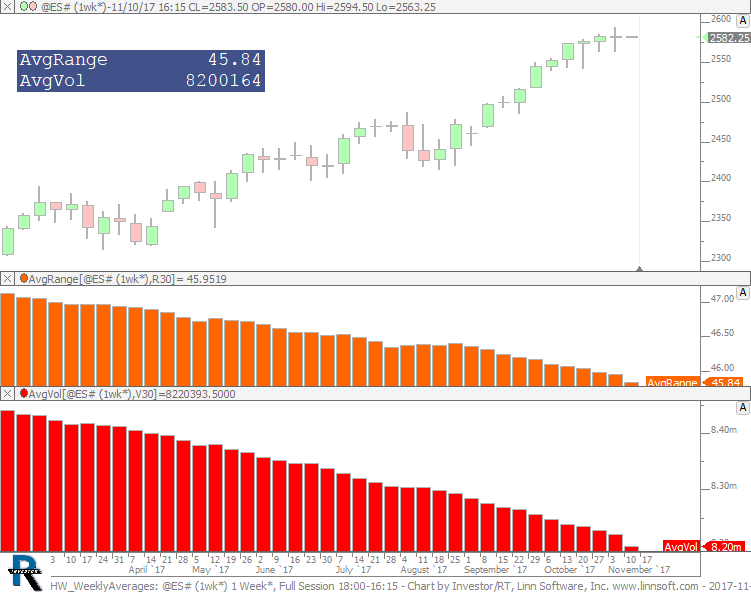 |
HW WeeklyAverages (@ES#) cpayne [totalcount]
8 years 8 months ago
Weekly Averages. This chart was uploaded by Investor/RT 13.1.1 showing symbol: @ES#. |
View |
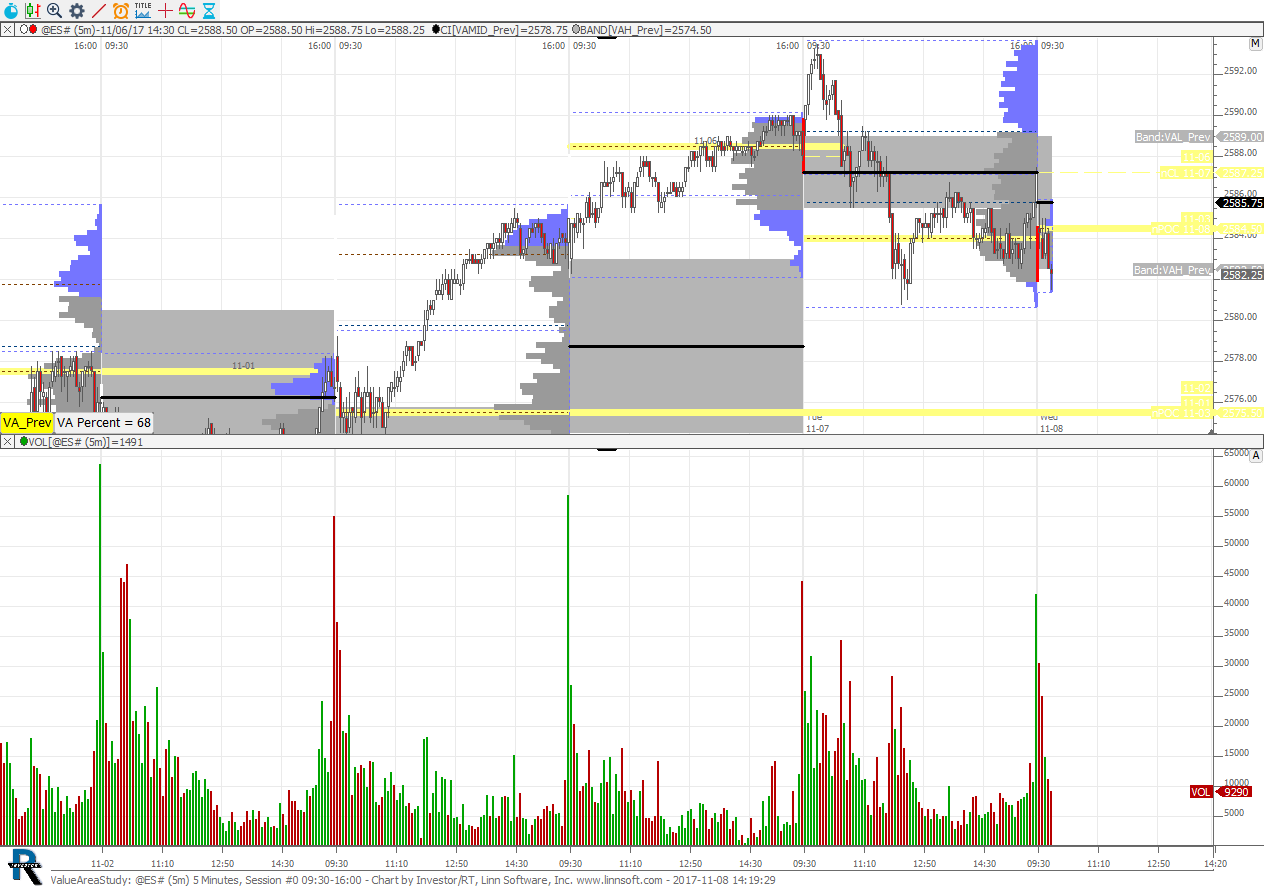 |
ValueAreaStudy (@ES#) cpayne [totalcount]
8 years 8 months ago
This chart was uploaded by Investor/RT 13.1.1 showing symbol: @ES#. |
View |
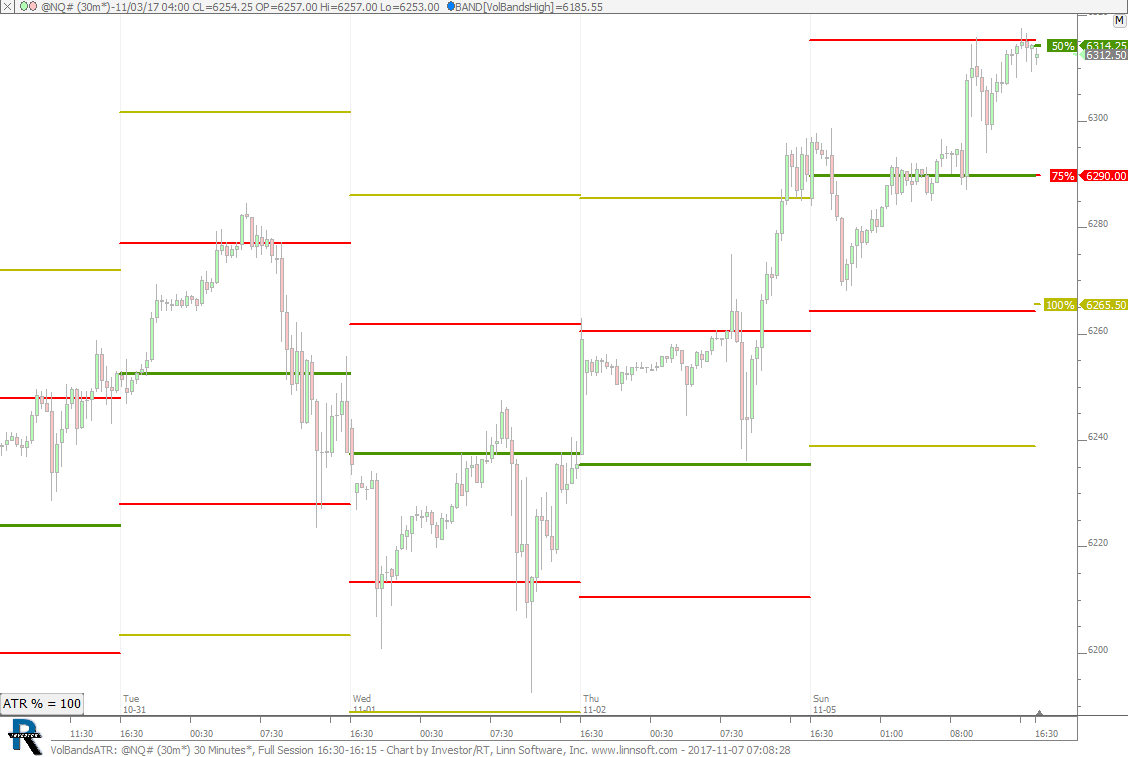 |
VolBandsATR (@NQ#) cpayne [totalcount]
8 years 8 months ago
Volatility Bands ATR. This chart was uploaded by Investor/RT 13.1.1 showing symbol: @NQ#. |
View |
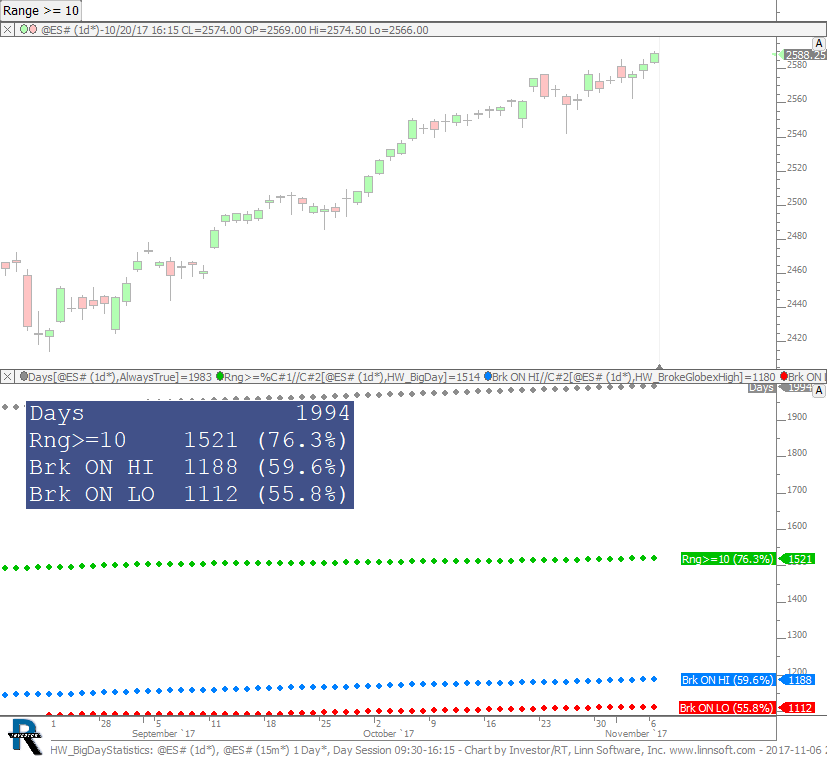 |
HW BigDayStatistics (@ES#) cpayne [totalcount]
8 years 8 months ago
Homework. Number of Big Days (Use Button For Min Range), and Number of Days we break overnight high and low (with percentages). |
View |
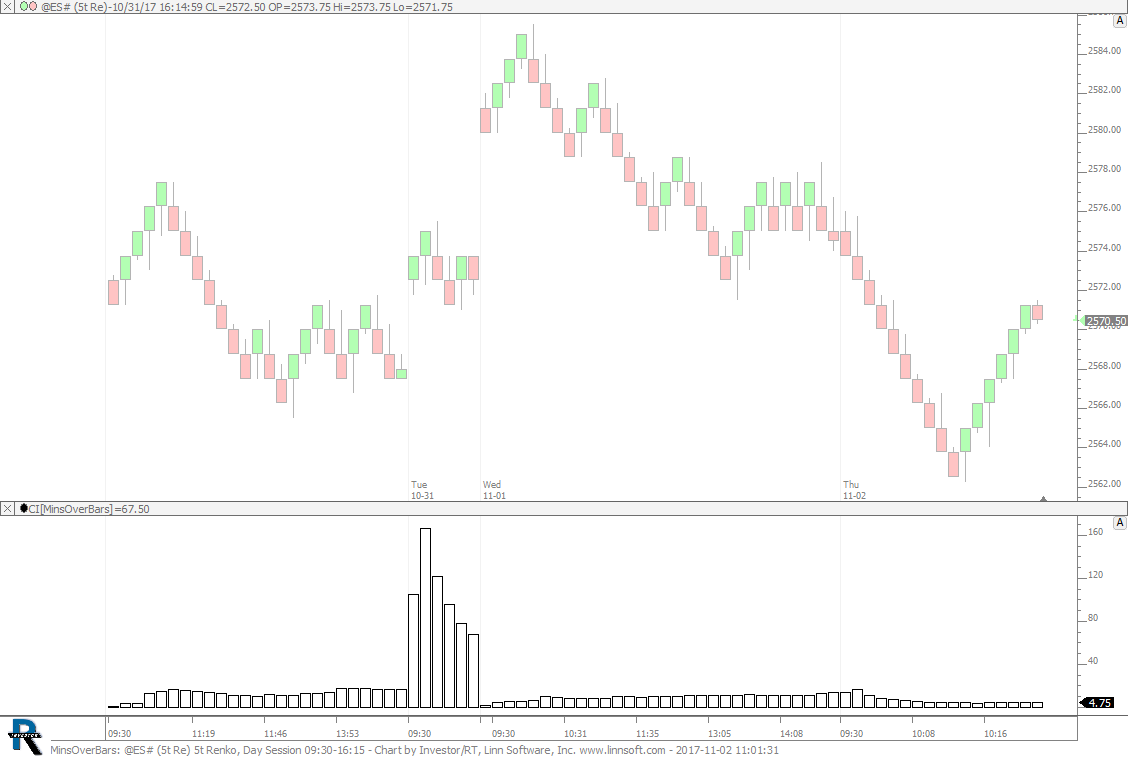 |
MinsOverBars (@ES#) cpayne [totalcount]
8 years 8 months ago
Minutes Into Session Divided by Bars Into Session. This chart was uploaded by Investor/RT 13.1.1 showing symbol: @ES#. |
View |
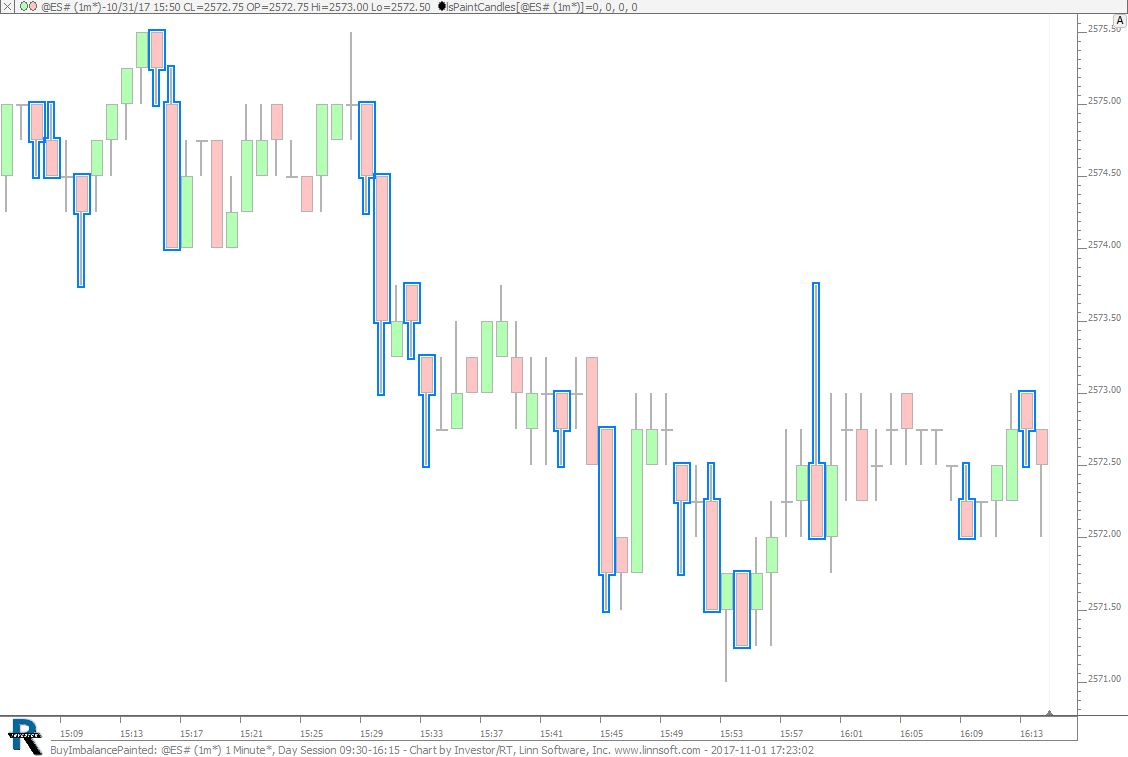 |
BuyImbalancePainted (@ES#) cpayne [totalcount]
8 years 8 months ago
Buy Imbalance Painted. This chart was uploaded by Investor/RT 13.1.1 showing symbol: @ES#. |
View |
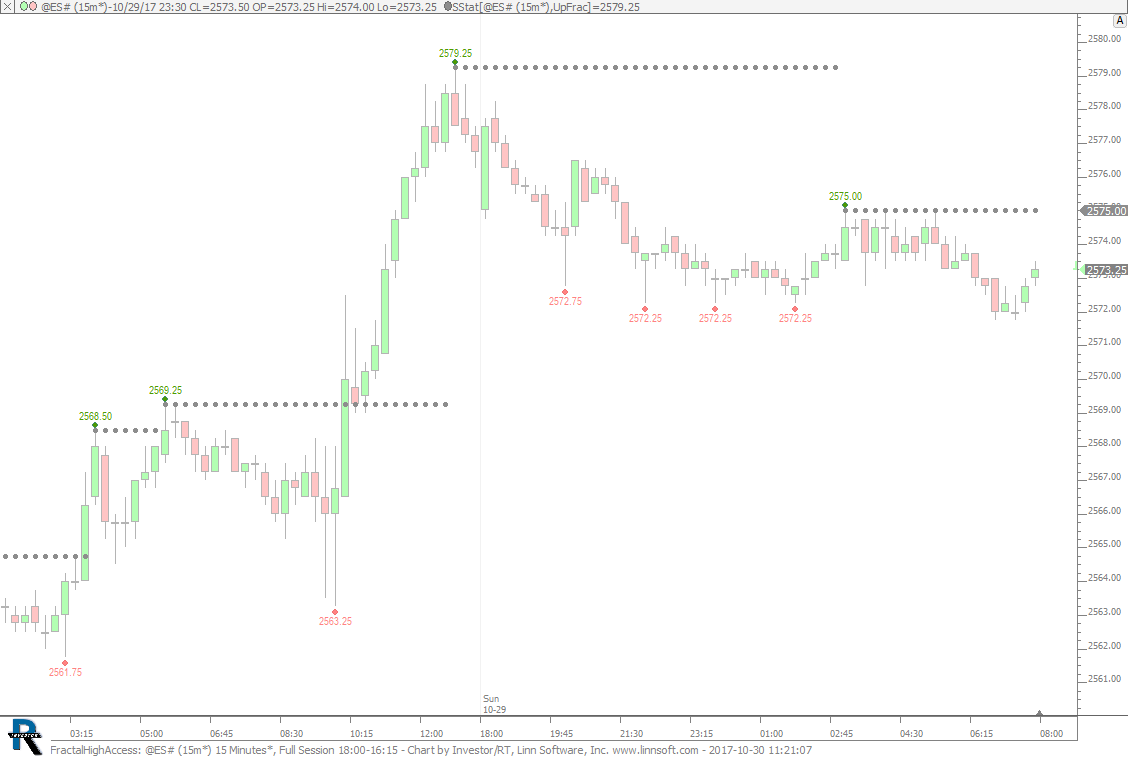 |
FractalHighAccess (@ES#) cpayne [totalcount]
8 years 8 months ago
Accessing the High of Up Fractal. This chart was uploaded by Investor/RT 13.1.1 showing symbol: @ES#. |
View |
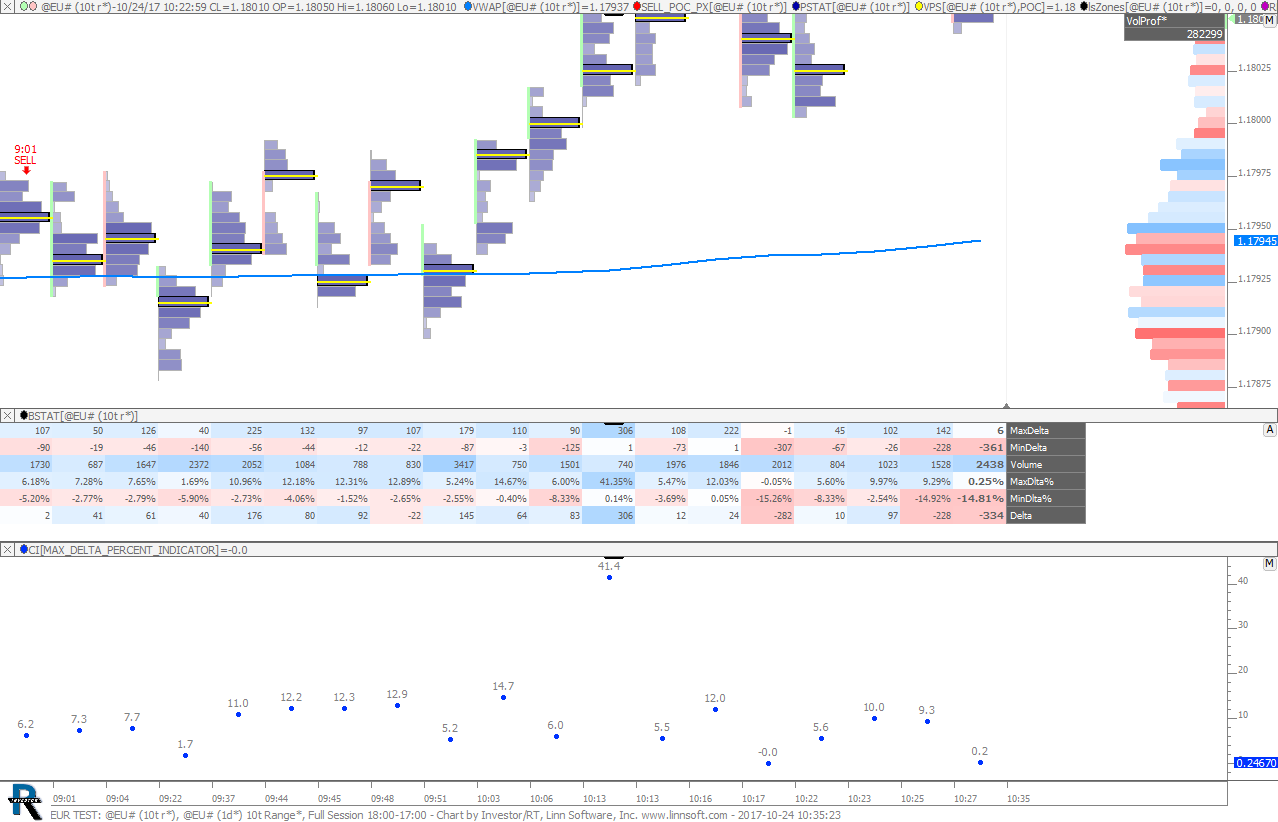 |
EUR TEST (@EU#) 2 cpayne [totalcount]
8 years 8 months ago
Max Delta Percent. This chart was uploaded by Investor/RT 13.1.1 showing symbol: @EU#. |
View |
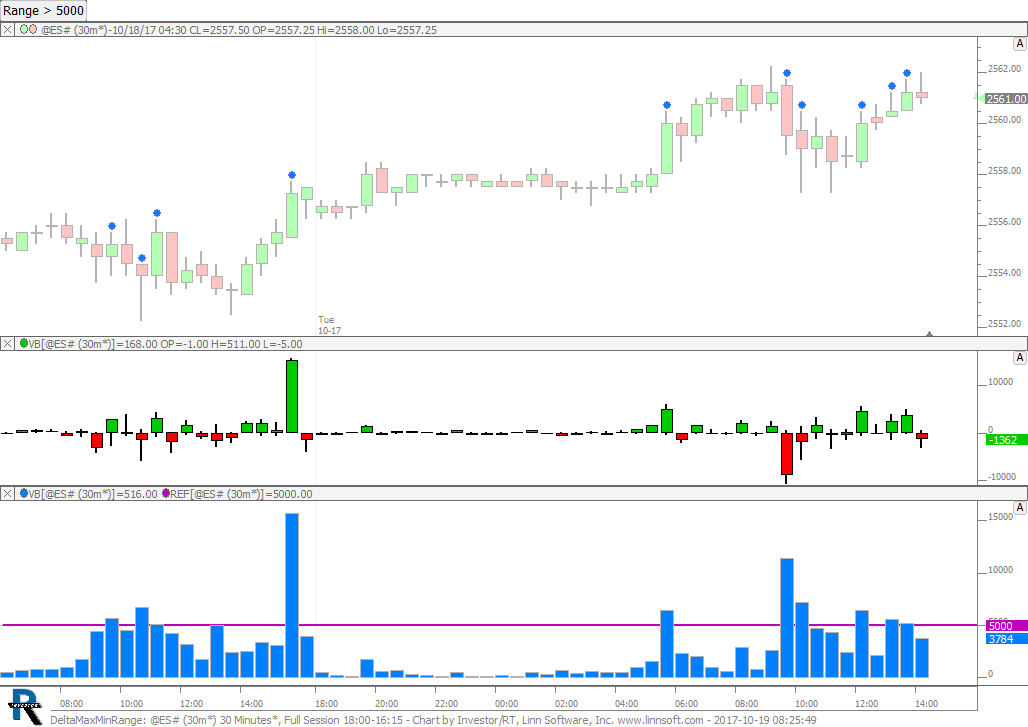 |
DeltaMaxMinRange (@ES#) cpayne [totalcount]
8 years 9 months ago
Delta Min Max and Range in Signals. This chart was uploaded by Investor/RT 13.1.1 showing symbol: @ES#. |
View |
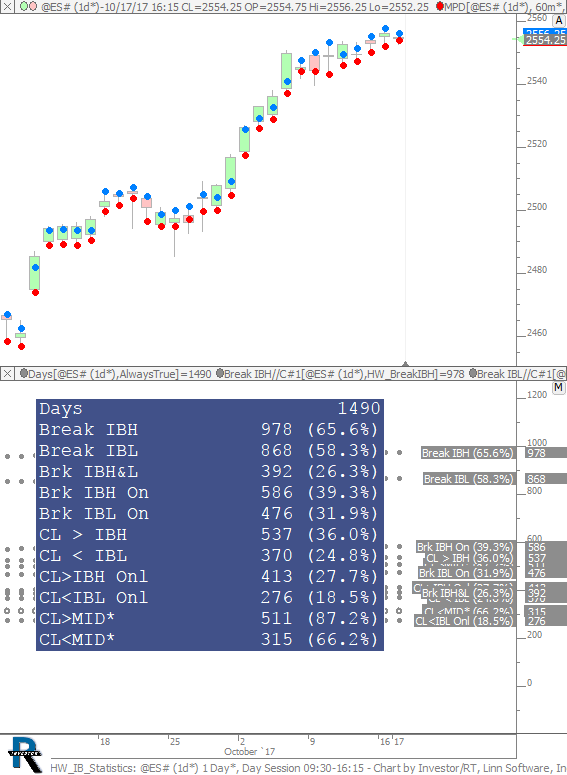 |
HW IB Statistics (@ES#) cpayne [totalcount]
8 years 9 months ago
IB and Mid Break and Close Statistics. This chart was uploaded by Investor/RT 13.1.1 showing symbol: @ES#. |
View |
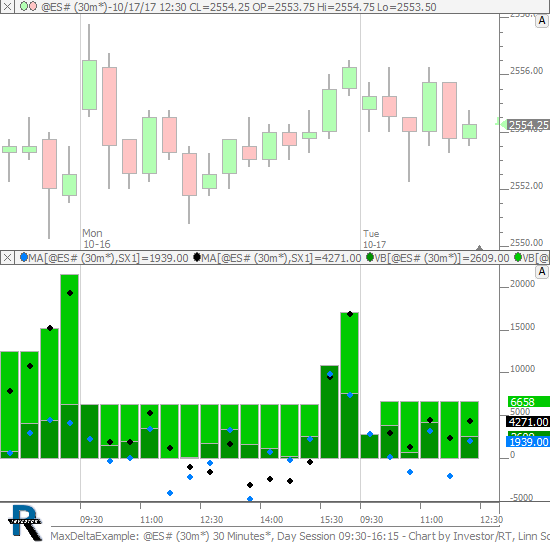 |
MaxDeltaExample (@ES#) cpayne [totalcount]
8 years 9 months ago
Max Delta Examples. This chart was uploaded by Investor/RT 13.1.1 showing symbol: @ES#. |
View |
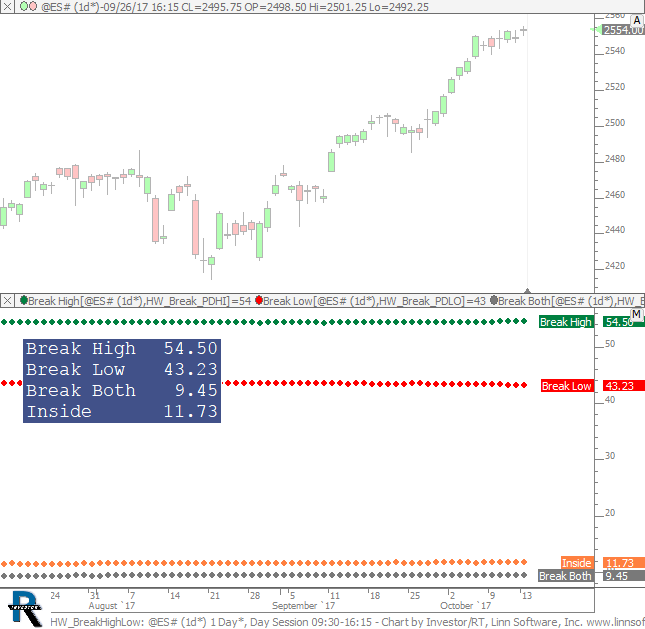 |
HW BreakHighLow (@ES#) cpayne [totalcount]
8 years 9 months ago
How Often Does Price Break Previous Day Session High and Low. This chart was uploaded by Investor/RT 13.1.1 showing symbol: @ES#. |
View |
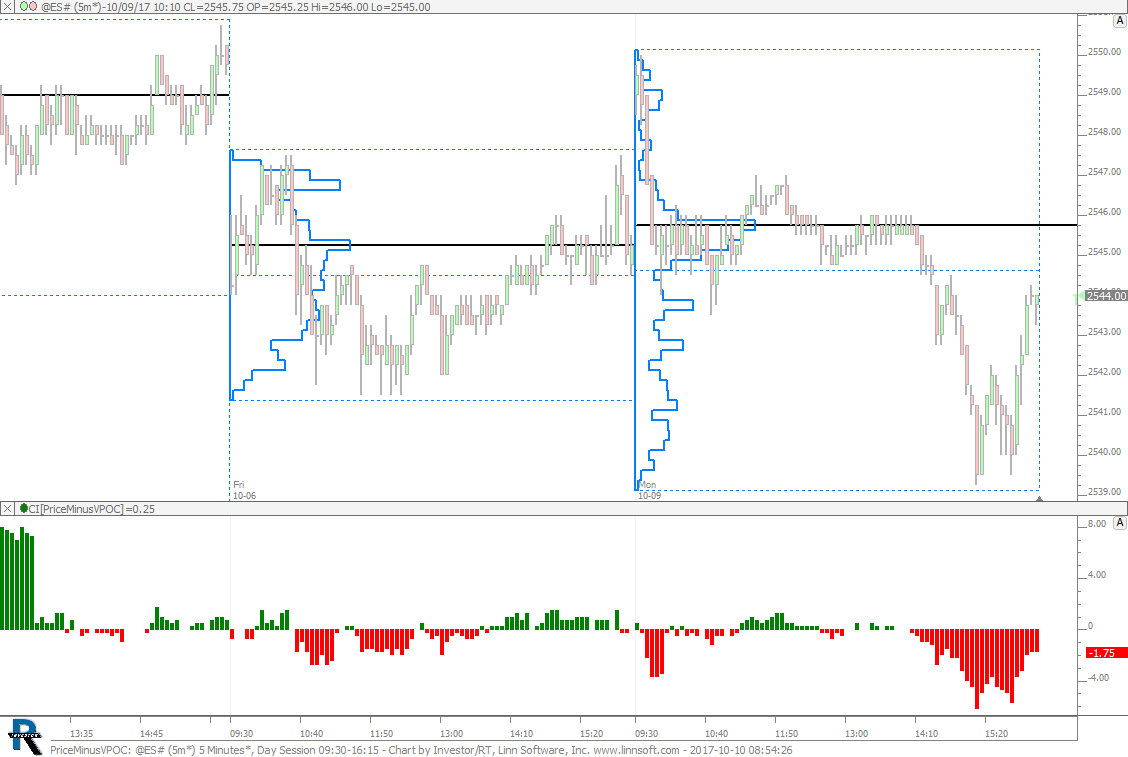 |
PriceMinusVPOC (@ES#) cpayne [totalcount]
8 years 9 months ago
Price Minus Developing VPOC. This chart was uploaded by Investor/RT 13.1.1 showing symbol: @ES#. |
View |
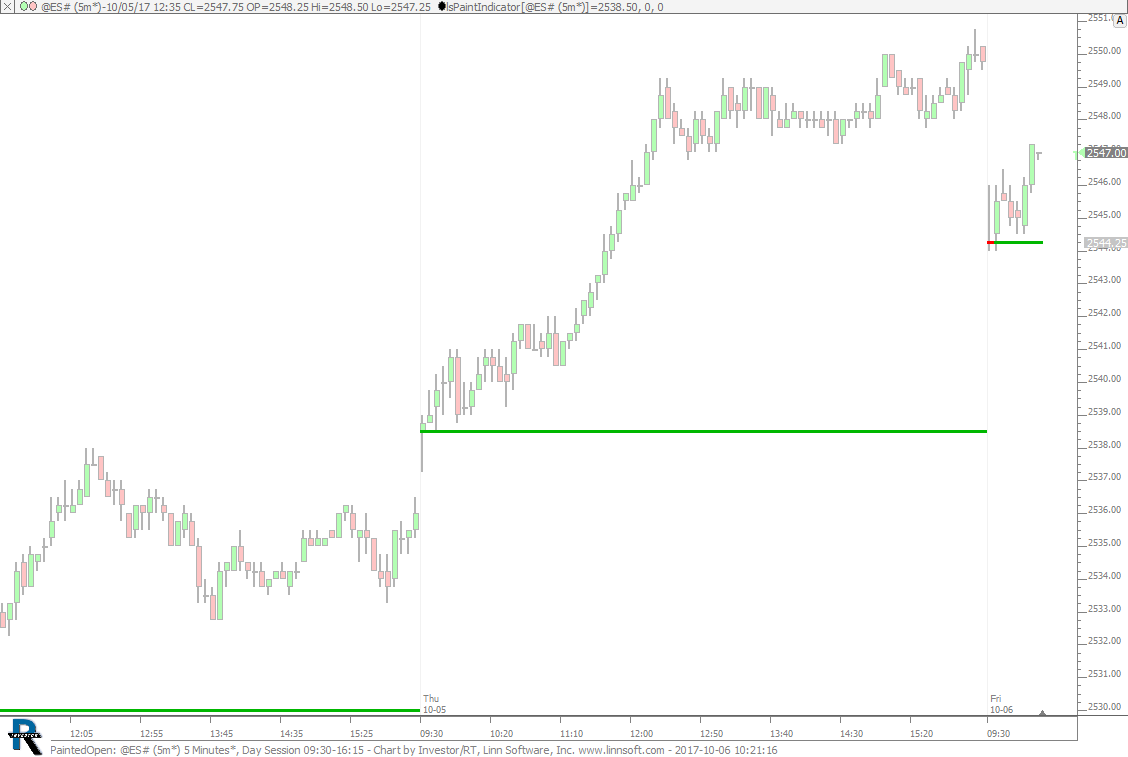 |
PaintedOpen (@ES#) cpayne [totalcount]
8 years 9 months ago
Painted Open Line using Paint Indicator. This chart was uploaded by Investor/RT 13.1.1 showing symbol: @ES#. |
View |
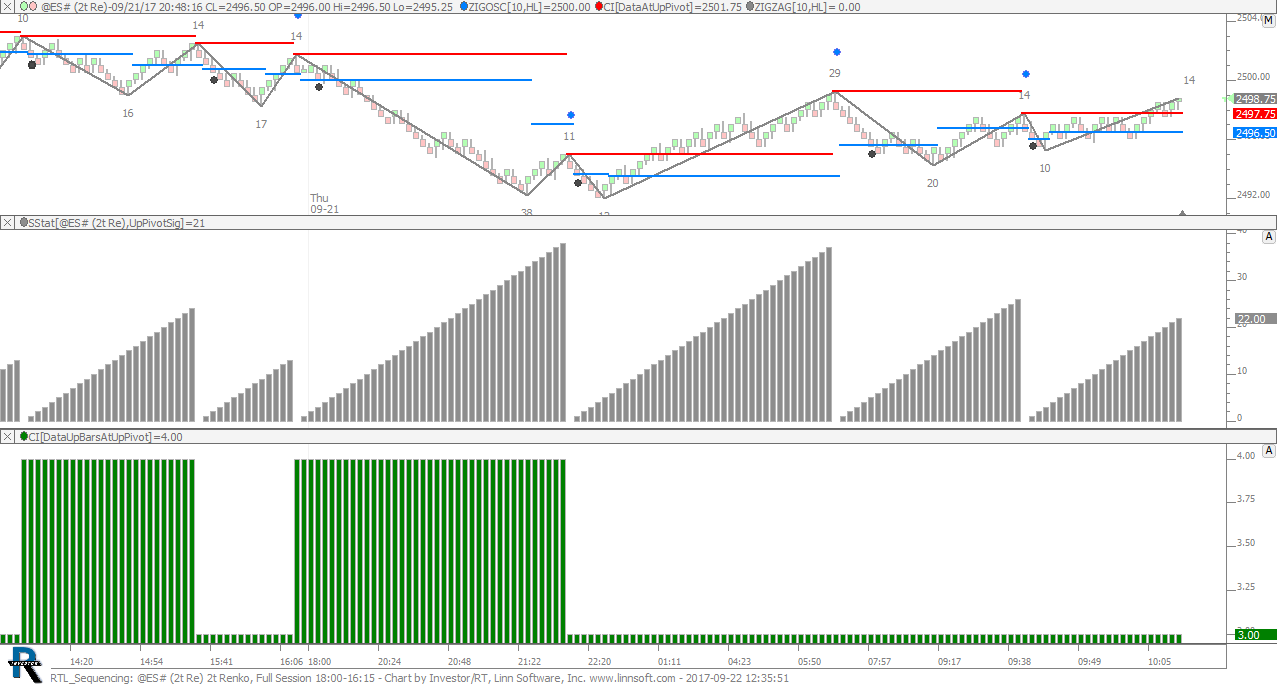 |
RTL Sequencing (@ES#) cpayne [totalcount]
8 years 9 months ago
Advanced RTL - Sequencing Events. This chart was uploaded by Investor/RT 13.1.1 showing symbol: @ES#. |
View |
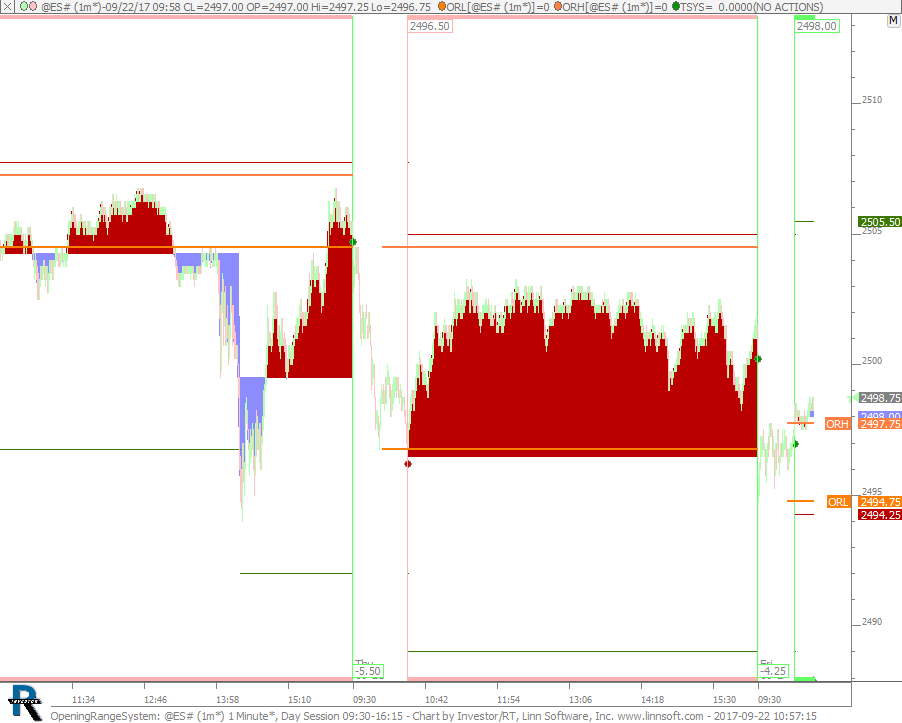 |
OpeningRangeSystem (@ES#) cpayne [totalcount]
8 years 9 months ago
Opening Range Trading System. This chart was uploaded by Investor/RT 13.1.1 showing symbol: @ES#. |
View |
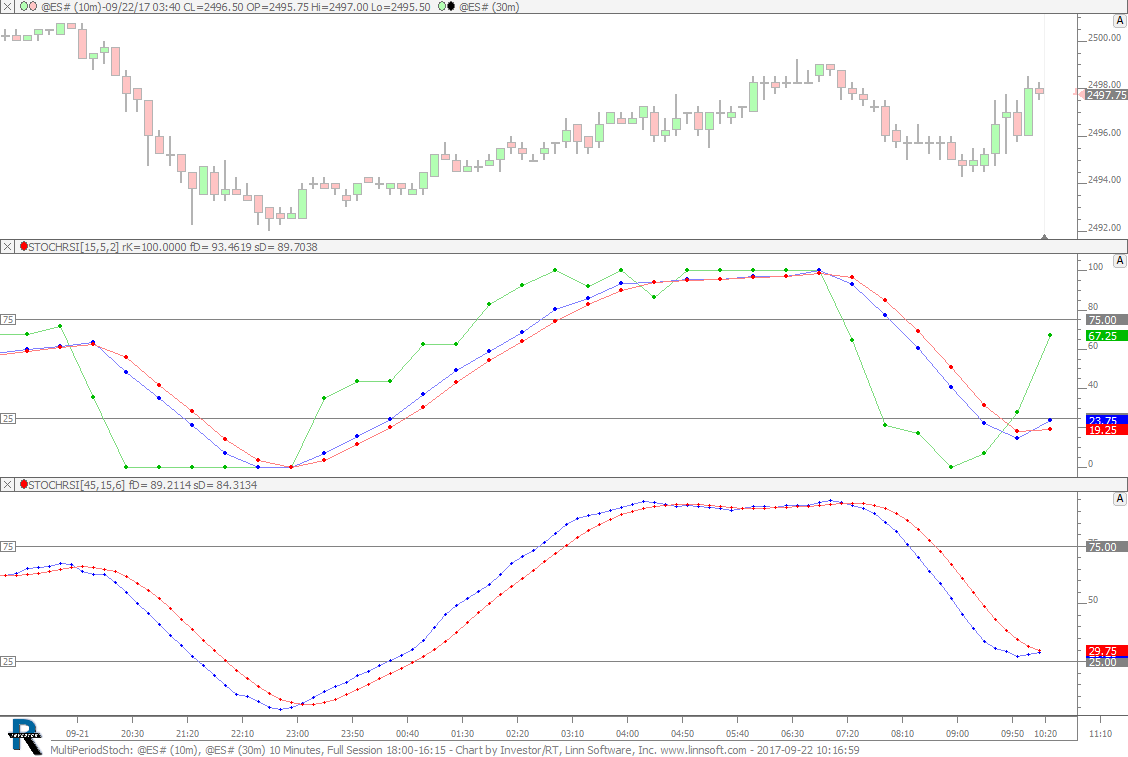 |
MultiPeriodStoch (@ES#) cpayne [totalcount]
8 years 9 months ago
Multi-Period Stochastics Options. This chart was uploaded by Investor/RT 13.1.1 showing symbol: @ES#. |
View |
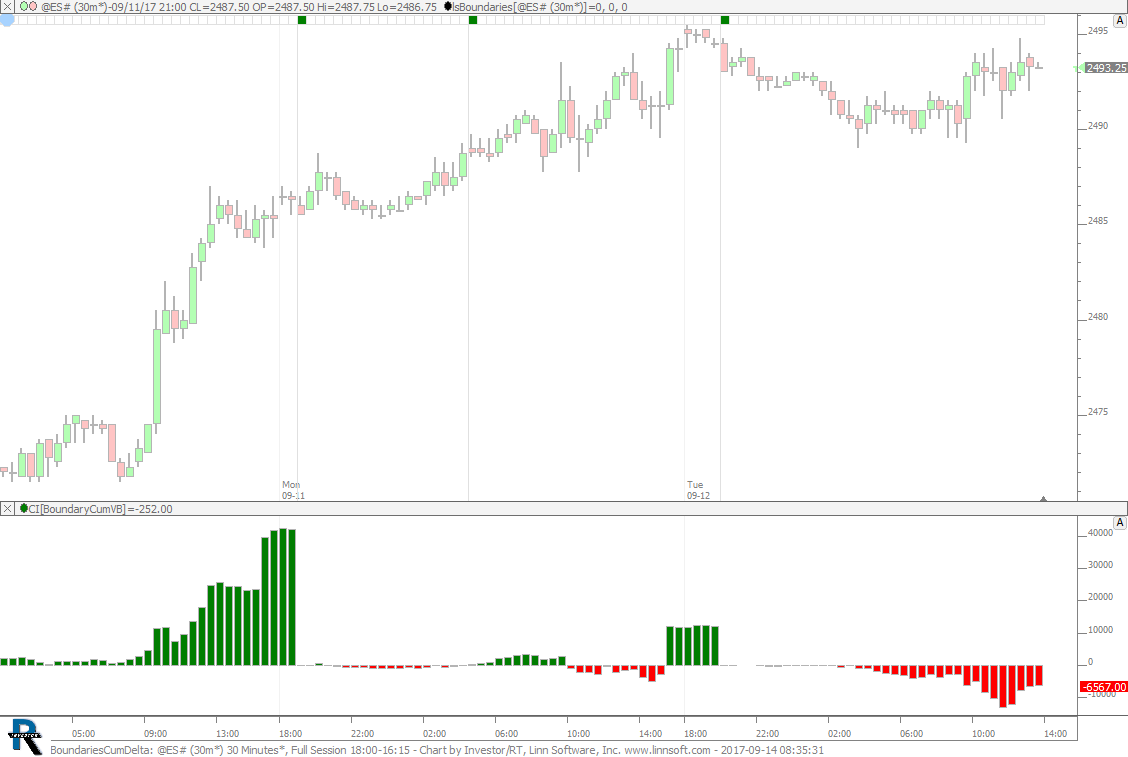 |
BoundariesCumDelta (@ES#) cpayne [totalcount]
8 years 10 months ago
Boundaries Cumulative Delta. This chart was uploaded by Investor/RT 13.1.1 showing symbol: @ES#. |
View |
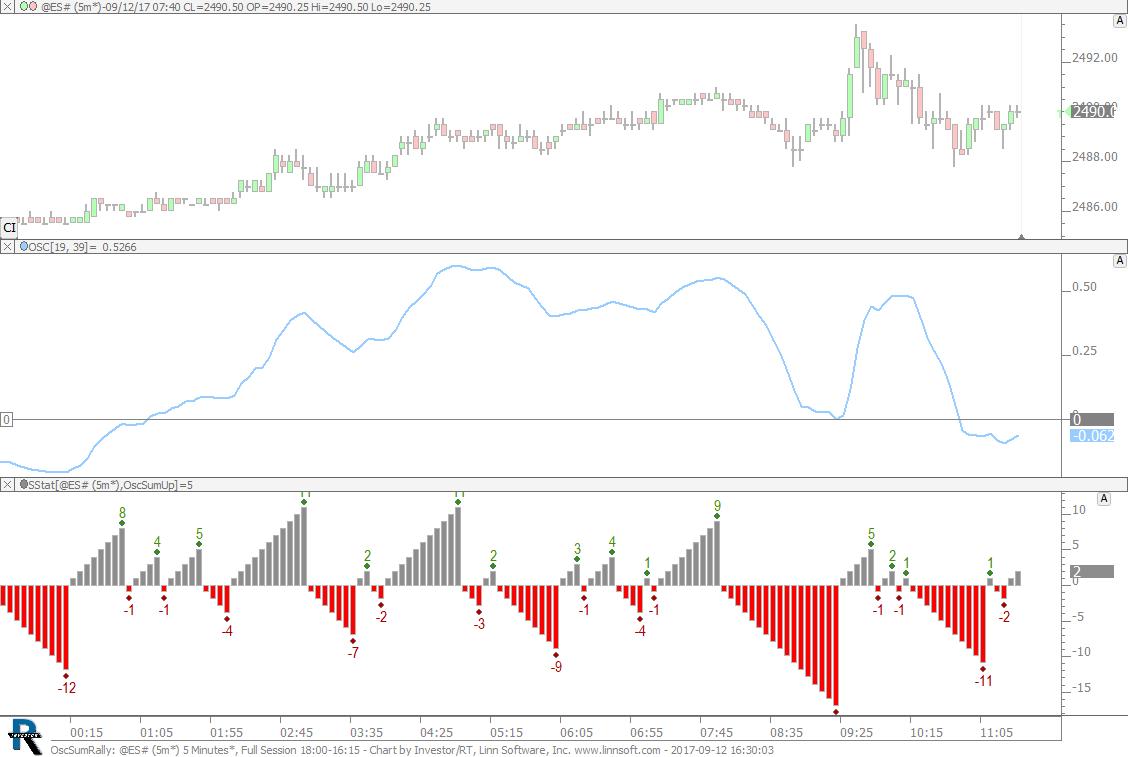 |
OscSumRally (@ES#) cpayne [totalcount]
8 years 10 months ago
Oscillator Summation Rally. This chart was uploaded by Investor/RT 13.1.1 showing symbol: @ES#. |
View |
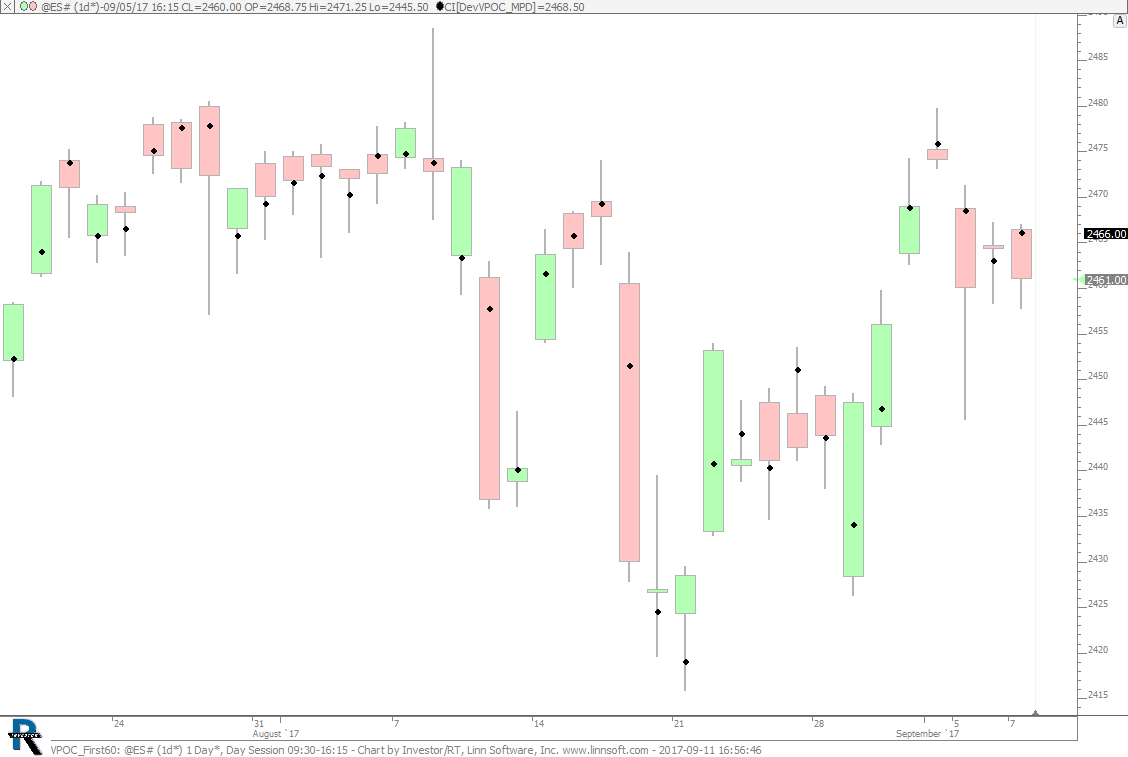 |
VPOC First60 (@ES#) cpayne [totalcount]
8 years 10 months ago
VPOC of 1st 60 Minutes of Session. This chart was uploaded by Investor/RT 13.1.1 showing symbol: @ES#. |
View |
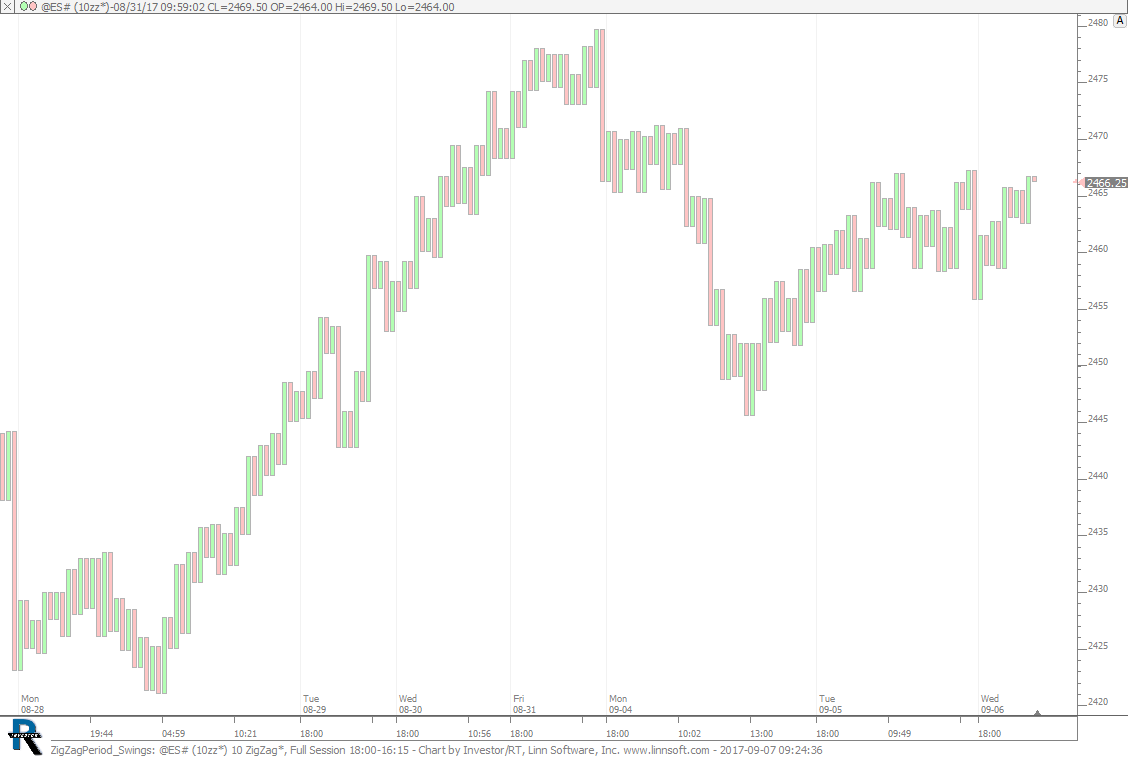 |
ZigZagPeriod Swings (@ES#) cpayne [totalcount]
8 years 10 months ago
Zig Zag Periodicity - Swing Highs/Lows. This chart was uploaded by Investor/RT 13.1.1 showing symbol: @ES#. |
View |
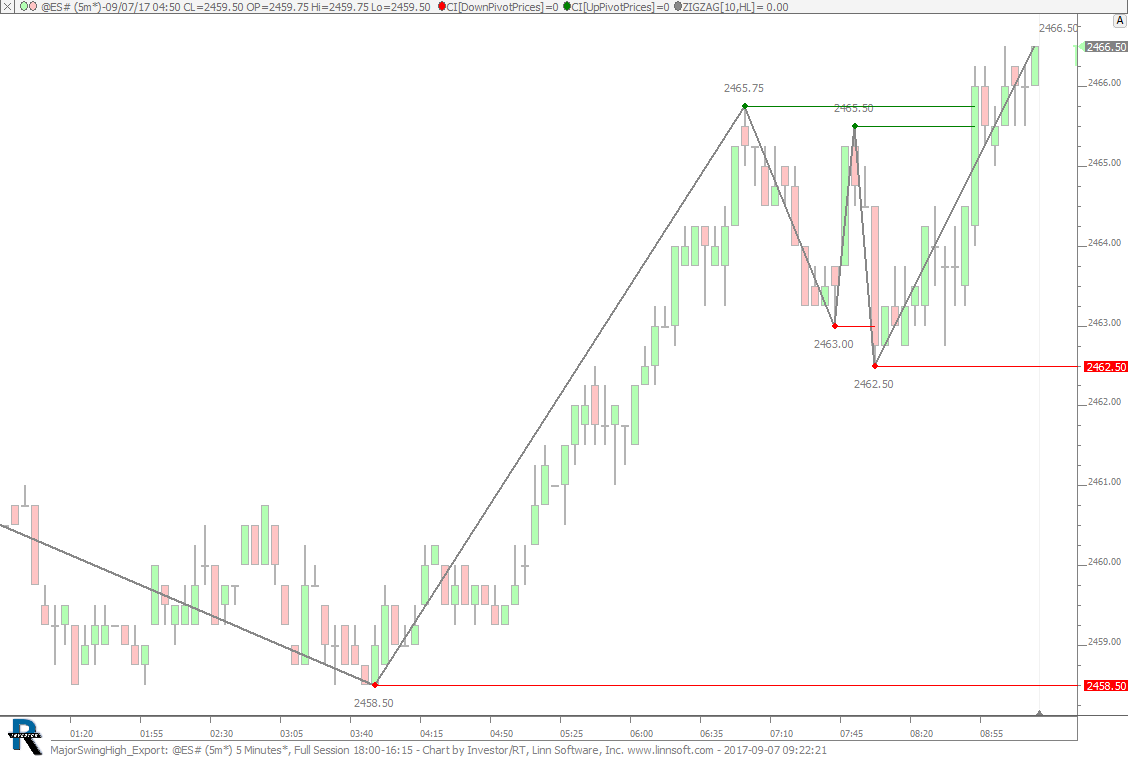 |
MajorSwingHigh Export (@ES#) cpayne [totalcount]
8 years 10 months ago
Up and Down Pivots for Export. This chart was uploaded by Investor/RT 13.1.1 showing symbol: @ES#. |
View |
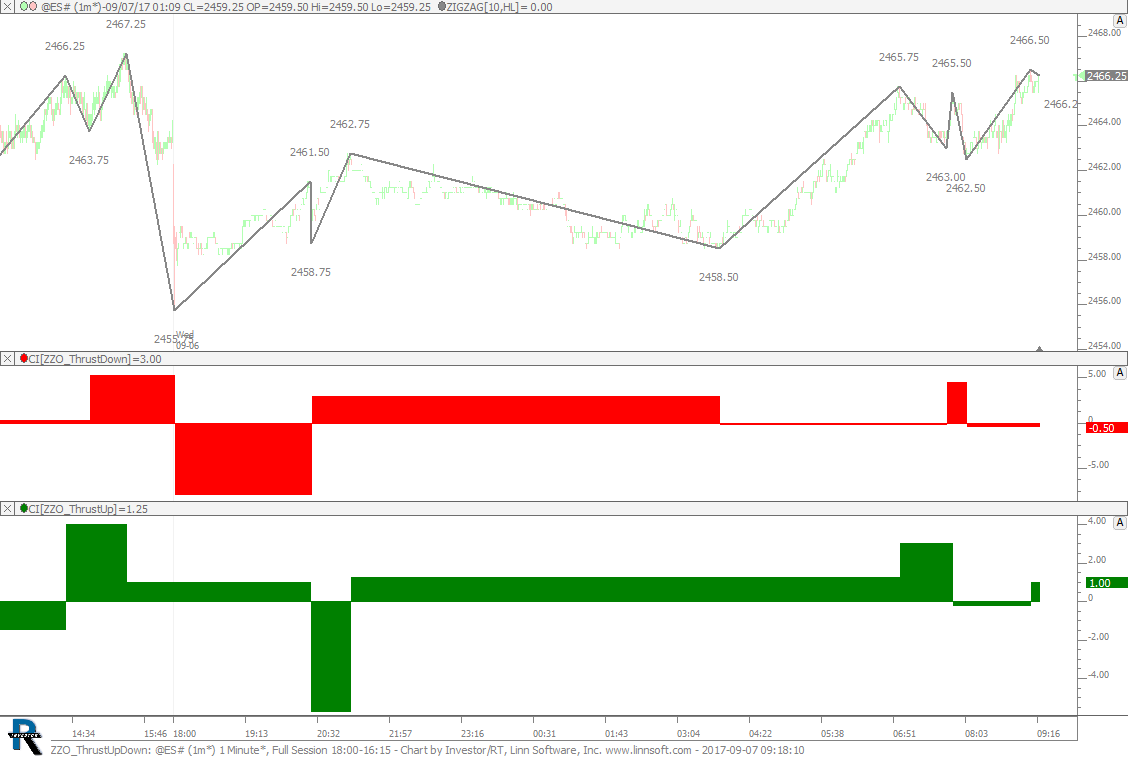 |
ZZO ThrustUpDown (@ES#) cpayne [totalcount]
8 years 10 months ago
ZZO - Thrust Up and Down. This chart was uploaded by Investor/RT 13.1.1 showing symbol: @ES#. |
View |
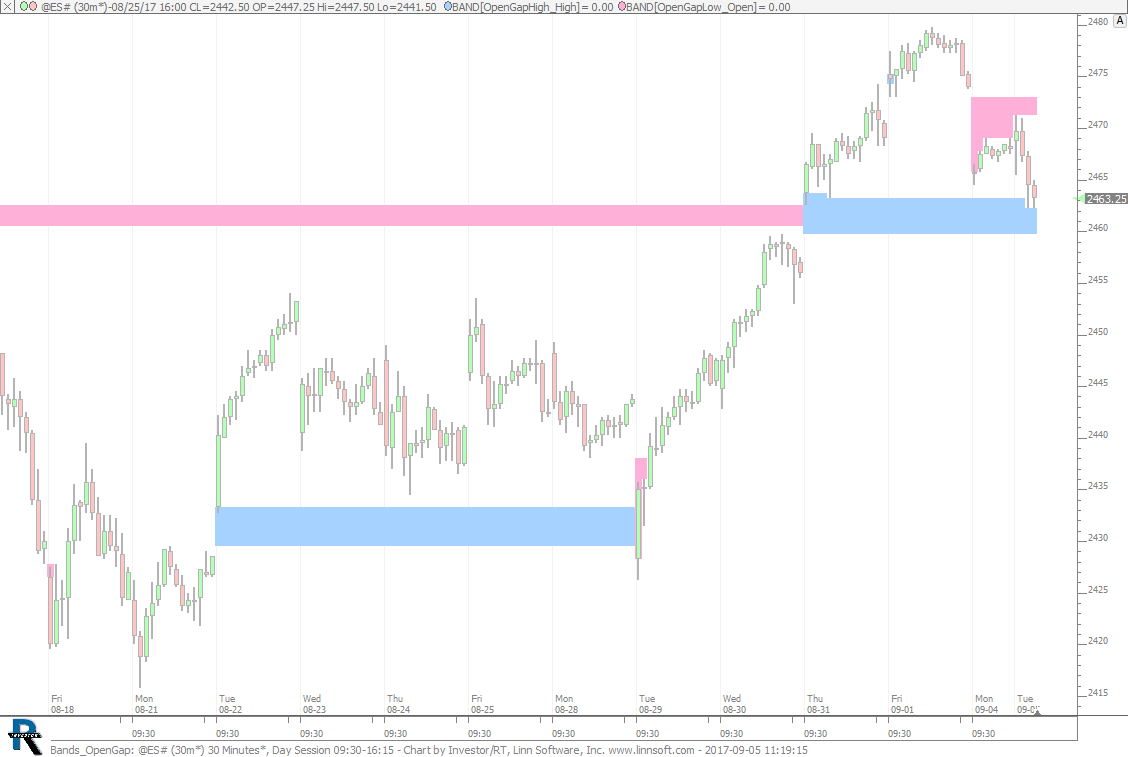 |
Bands OpenGap (@ES#) cpayne [totalcount]
8 years 10 months ago
Bands - Open Gap Yesterdays Range. This chart was uploaded by Investor/RT 13.1.1 showing symbol: @ES#. |
View |