 |
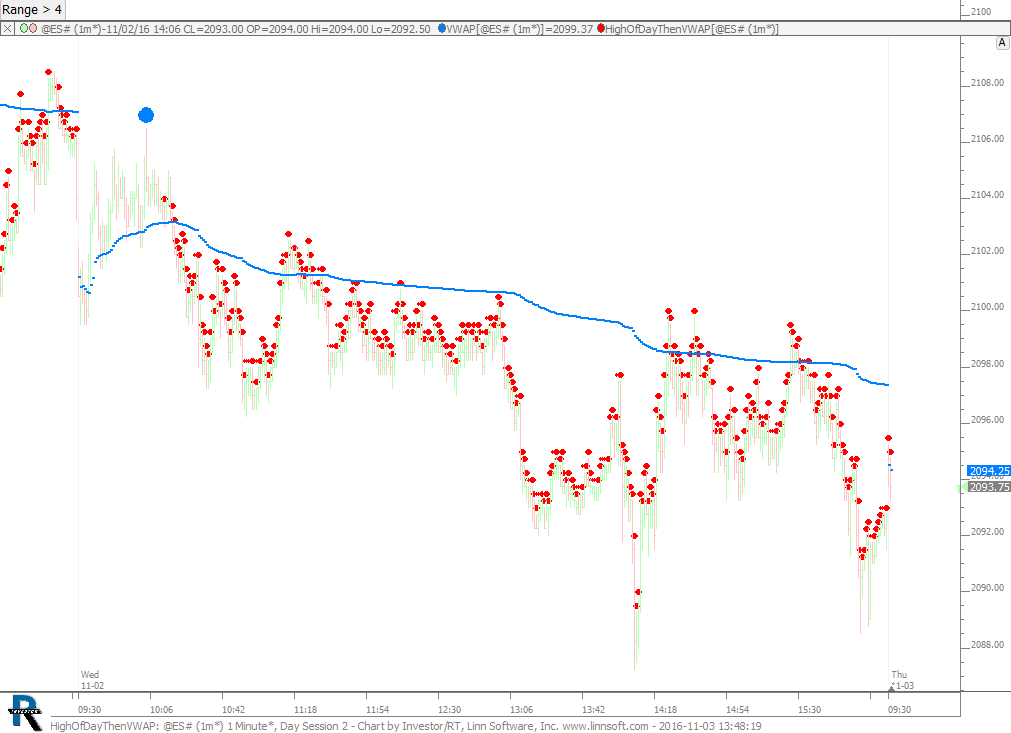
HighOfDayThenVWAP (@ES#) 2 cpayne [totalcount]
9 years 8 months ago
High Of Day Then VWAP. This chart was uploaded by Investor/RT 12.6.7 showing symbol: @ES#. |
View |
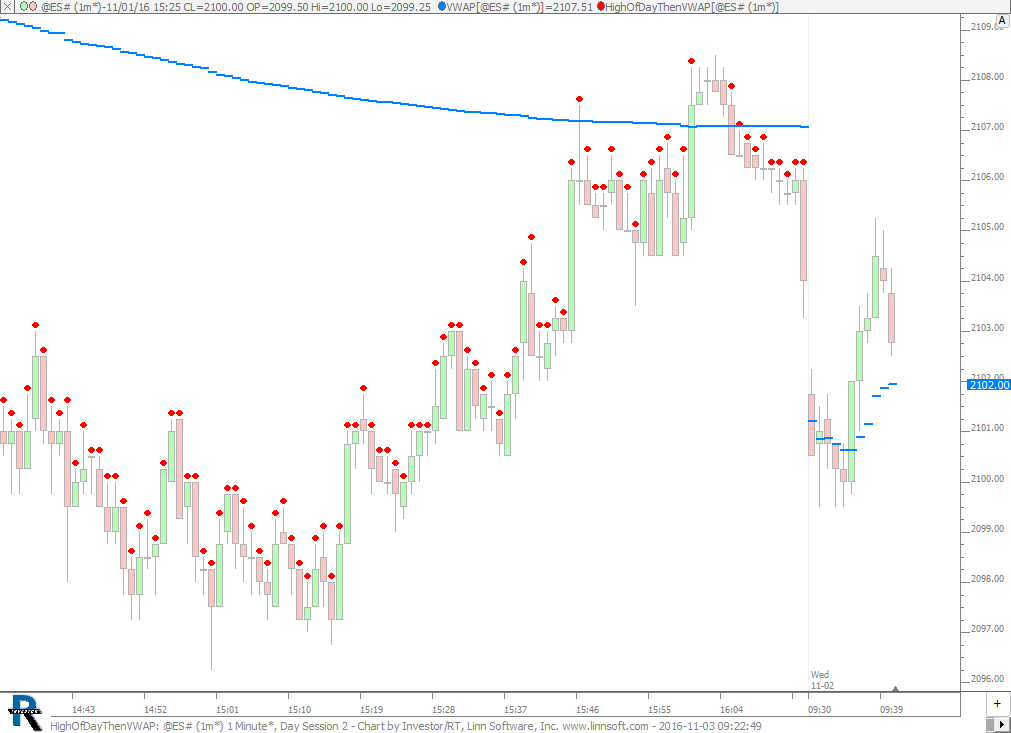 |
HighOfDayThenVWAP (@ES#) cpayne [totalcount]
9 years 8 months ago
High Of Day Then VWAP. This chart was uploaded by Investor/RT 12.6.7 showing symbol: @ES#. |
View |
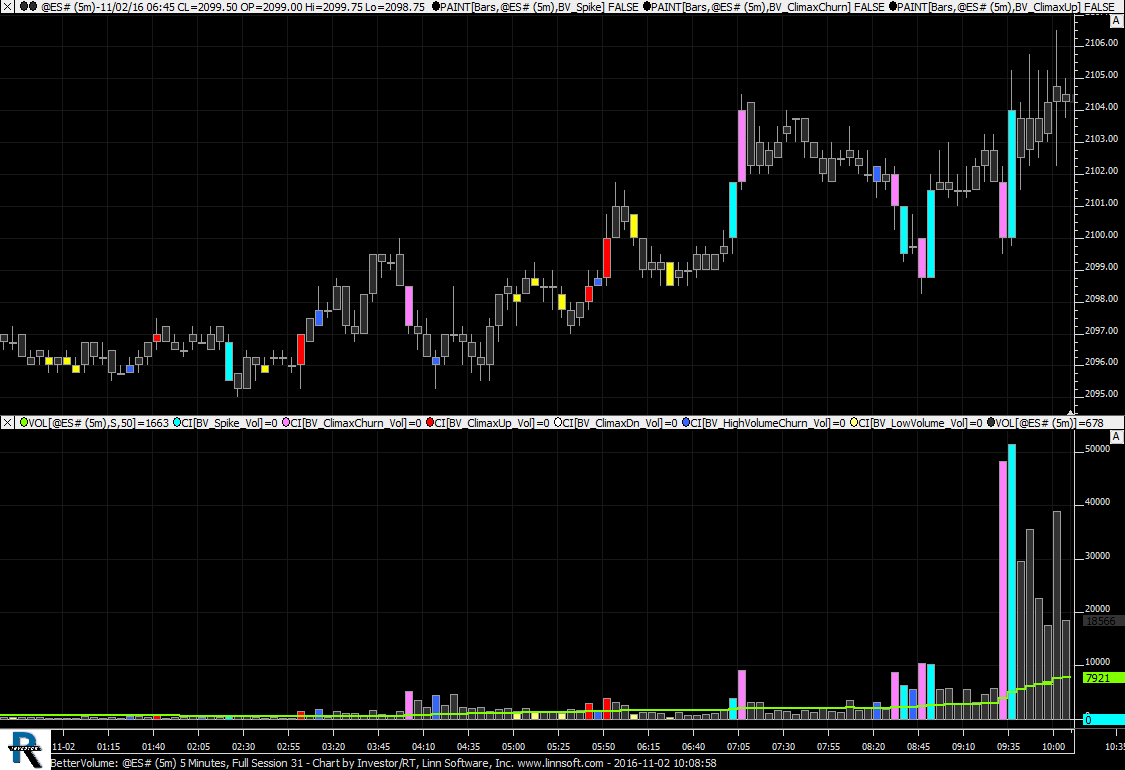 |
BetterVolume (@ES#) cpayne [totalcount]
9 years 8 months ago
Better Volume. This chart was uploaded by Investor/RT 12.6.7 showing symbol: @ES#. |
View |
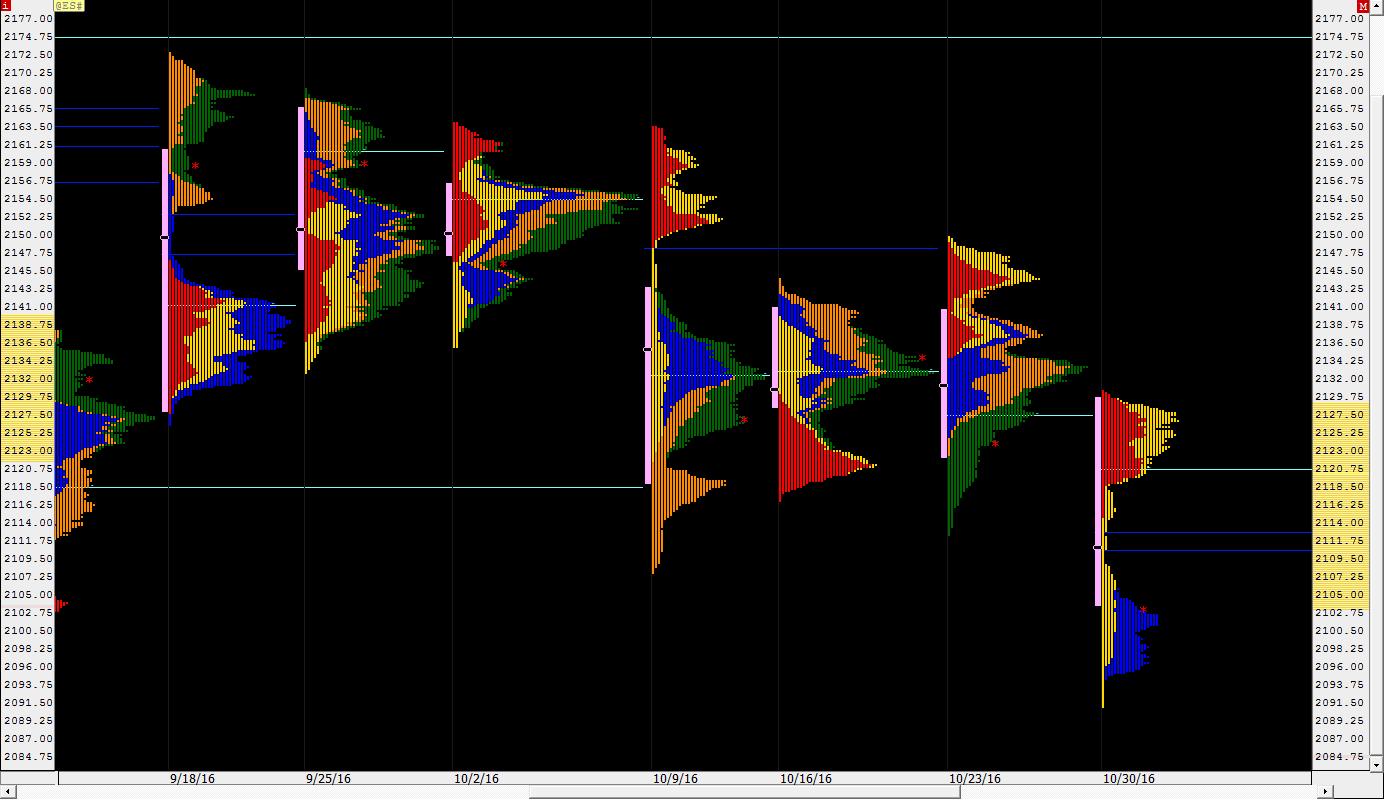 |
WeeklyTPO (@ES#) cpayne [totalcount]
9 years 8 months ago
Weekly TPO Chart of ES. Each Day shaded different colors. This chart was uploaded by Investor/RT 12.6.7 showing symbol: @ES#. |
View |
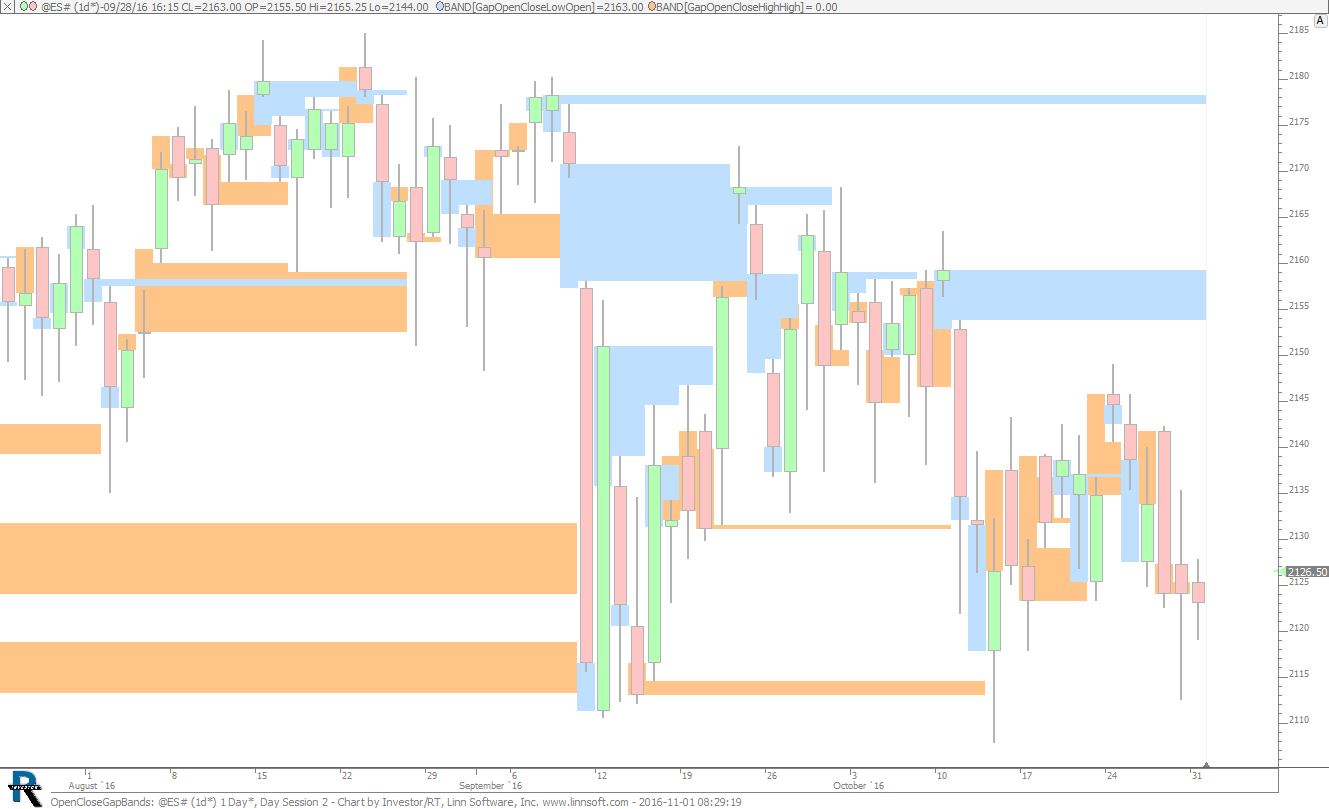 |
OpenCloseGapBands (@ES#) cpayne [totalcount]
9 years 8 months ago
Gap Bands for gaps between previous close and open of day. This chart was uploaded by Investor/RT 12.6.7 showing symbol: @ES#. |
View |
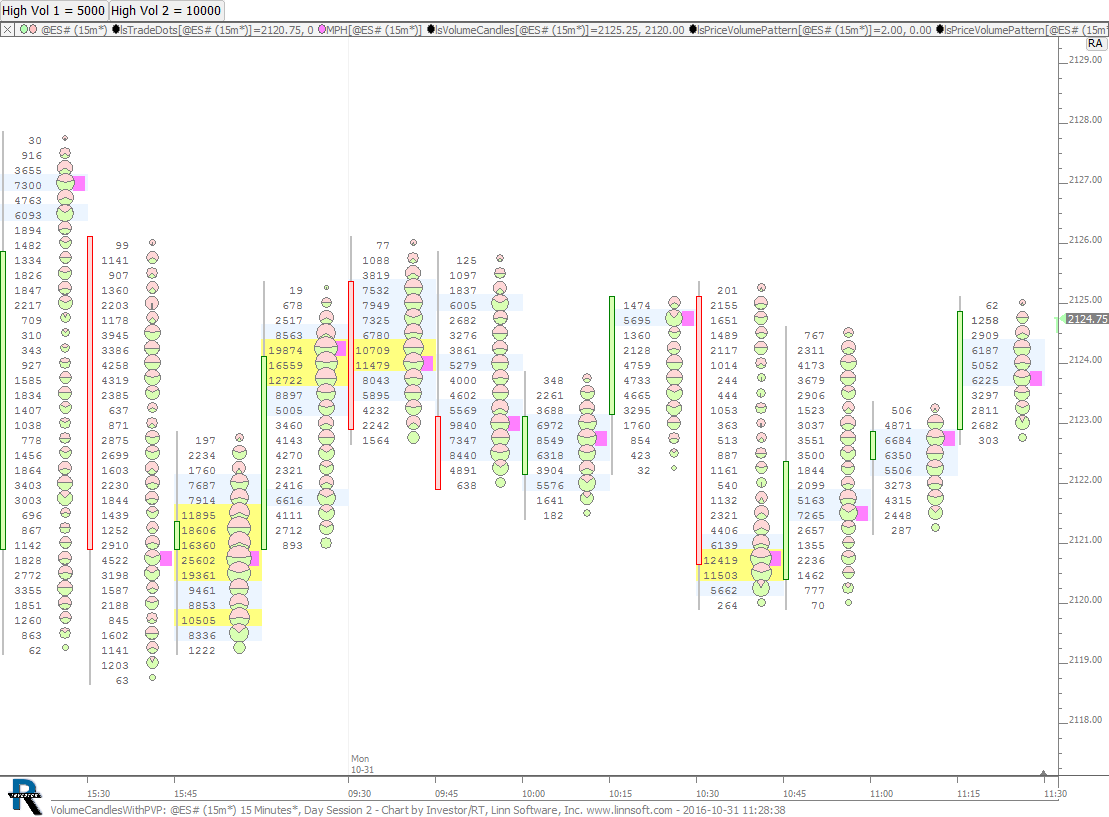 |
VolumeCandlesWithPVP (@ES#) 2 cpayne [totalcount]
9 years 8 months ago
Volume Candles with Trade Dots, PVP, and MPH. Use the buttons at top to adjust the high volume at price filters (blue and yellow highlighting). |
View |
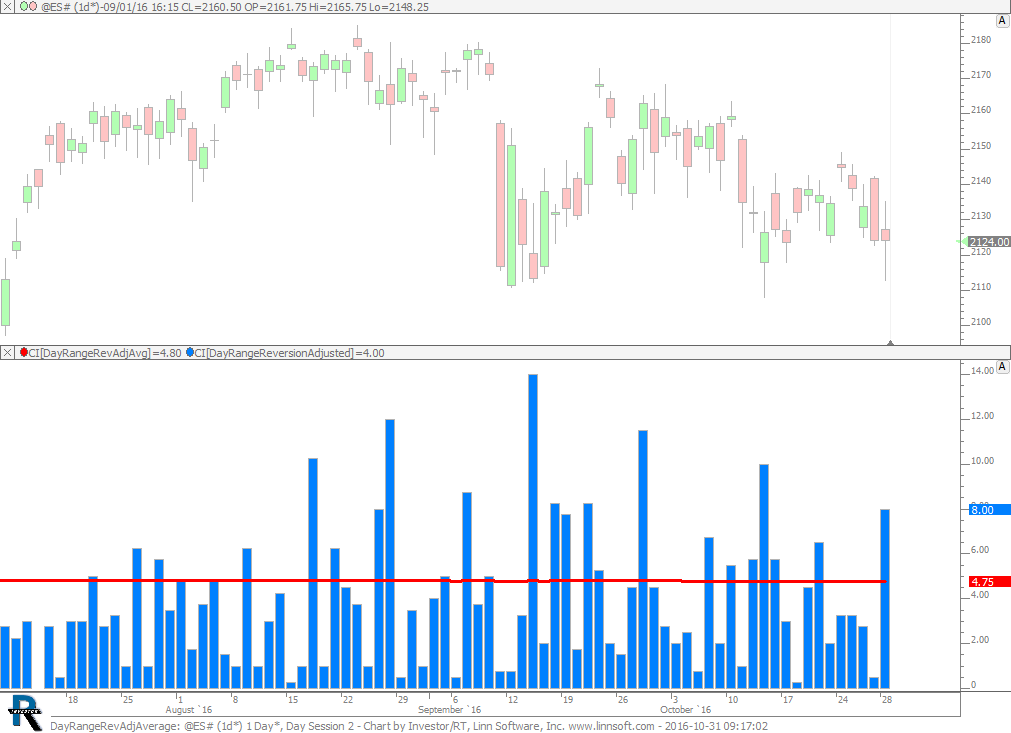 |
DayRangeRevAdjAverage (@ES#) cpayne [totalcount]
9 years 8 months ago
Day Range Average - Reversion Adjusted. This chart was uploaded by Investor/RT 12.6.7 showing symbol: @ES#. |
View |
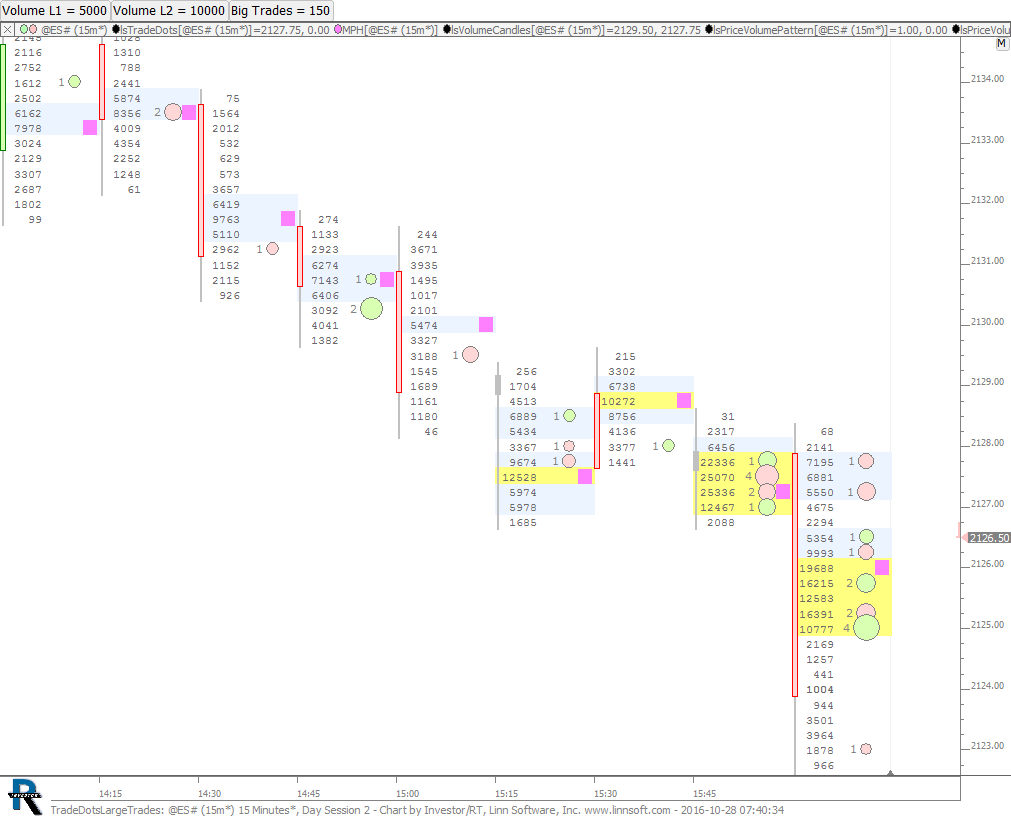 |
TradeDotsLargeTrades (@ES#) cpayne [totalcount]
9 years 8 months ago
Big Trades using Trade Dots. This chart was uploaded by Investor/RT 12.6.7 showing symbol: @ES#. |
View |
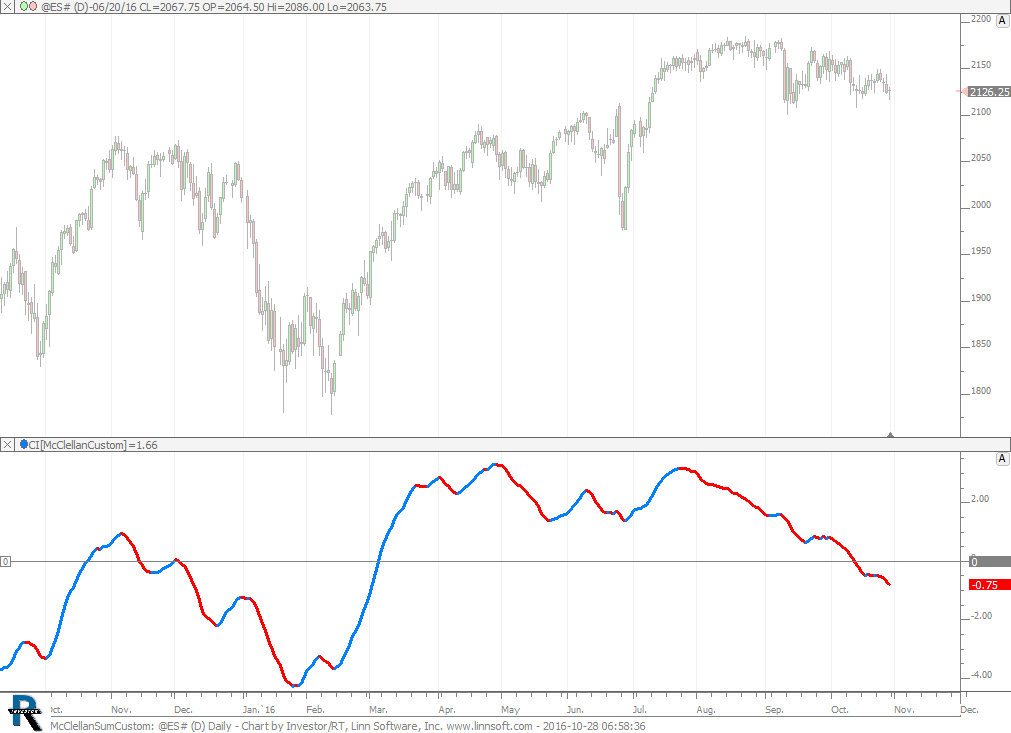 |
McClellanSumCustom (@ES#) cpayne [totalcount]
9 years 8 months ago
Custom McClellan Summation. This chart was uploaded by Investor/RT 12.6.7 showing symbol: @ES#. |
View |
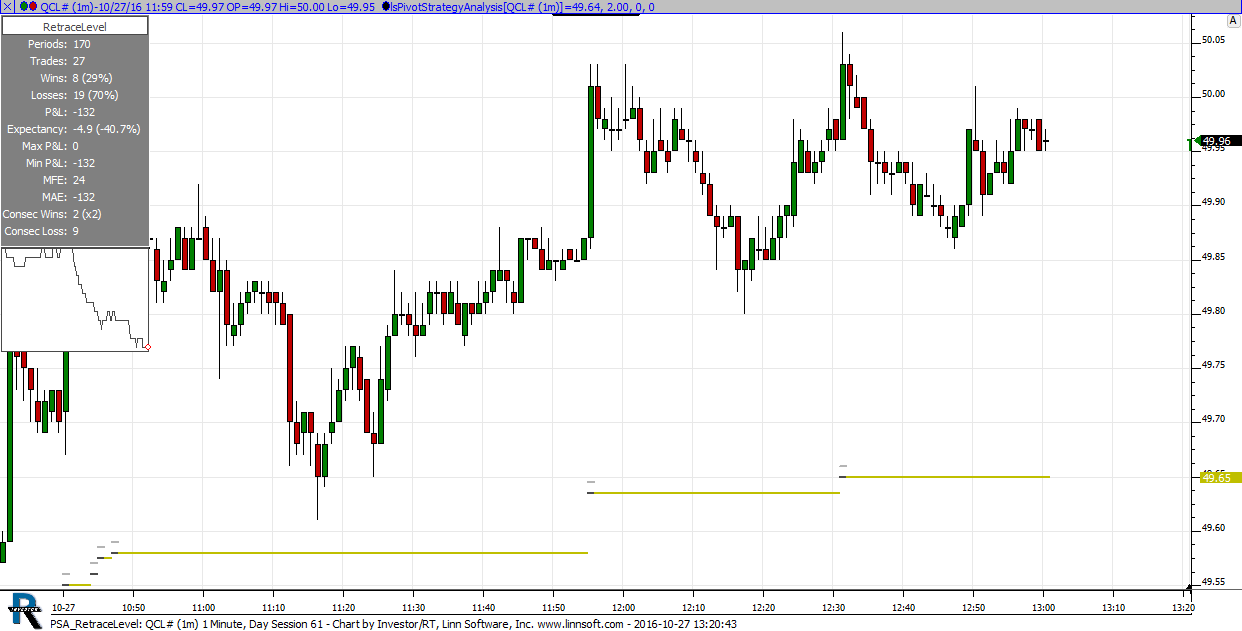 |
PSA RetraceLevel (QCL#) cpayne [totalcount]
9 years 8 months ago
PSA with Retracement Level. This chart was uploaded by Investor/RT 12.6.7 showing symbol: QCL#. |
View |
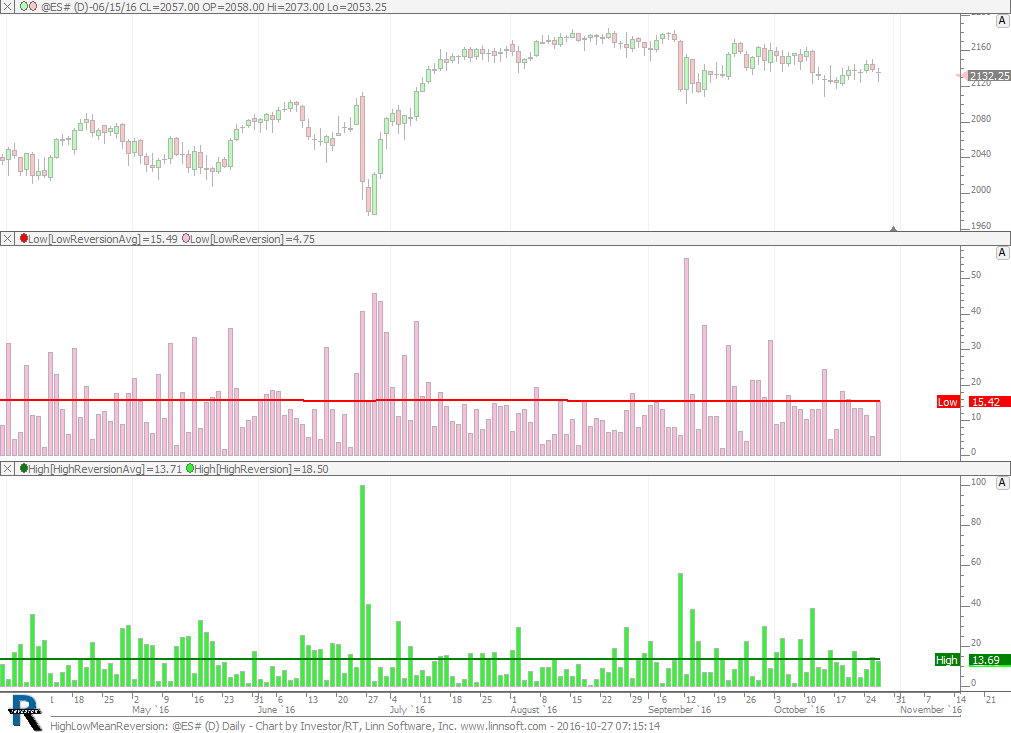 |
HighLowMeanReversion (@ES#) cpayne [totalcount]
9 years 8 months ago
Mean Reversion from both the High and Low. This chart was uploaded by Investor/RT 12.6.7 showing symbol: @ES#. |
View |
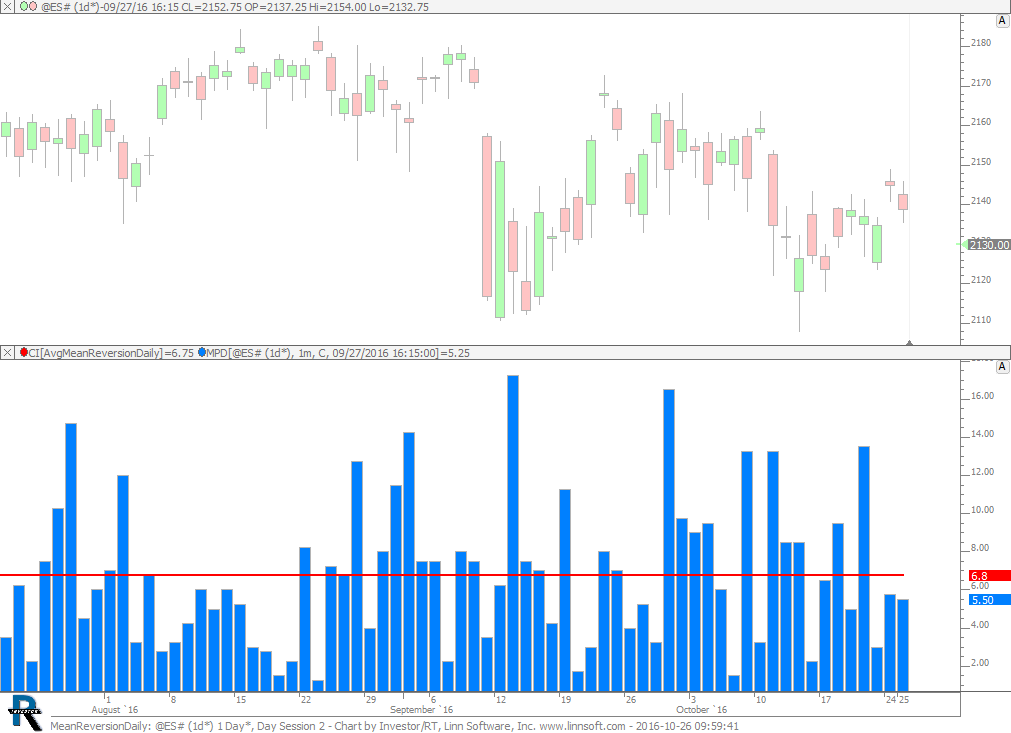 |
MeanReversionDaily (@ES#) cpayne [totalcount]
9 years 8 months ago
Mean Reversion - Daily. This chart was uploaded by Investor/RT 12.6.7 showing symbol: @ES#. |
View |
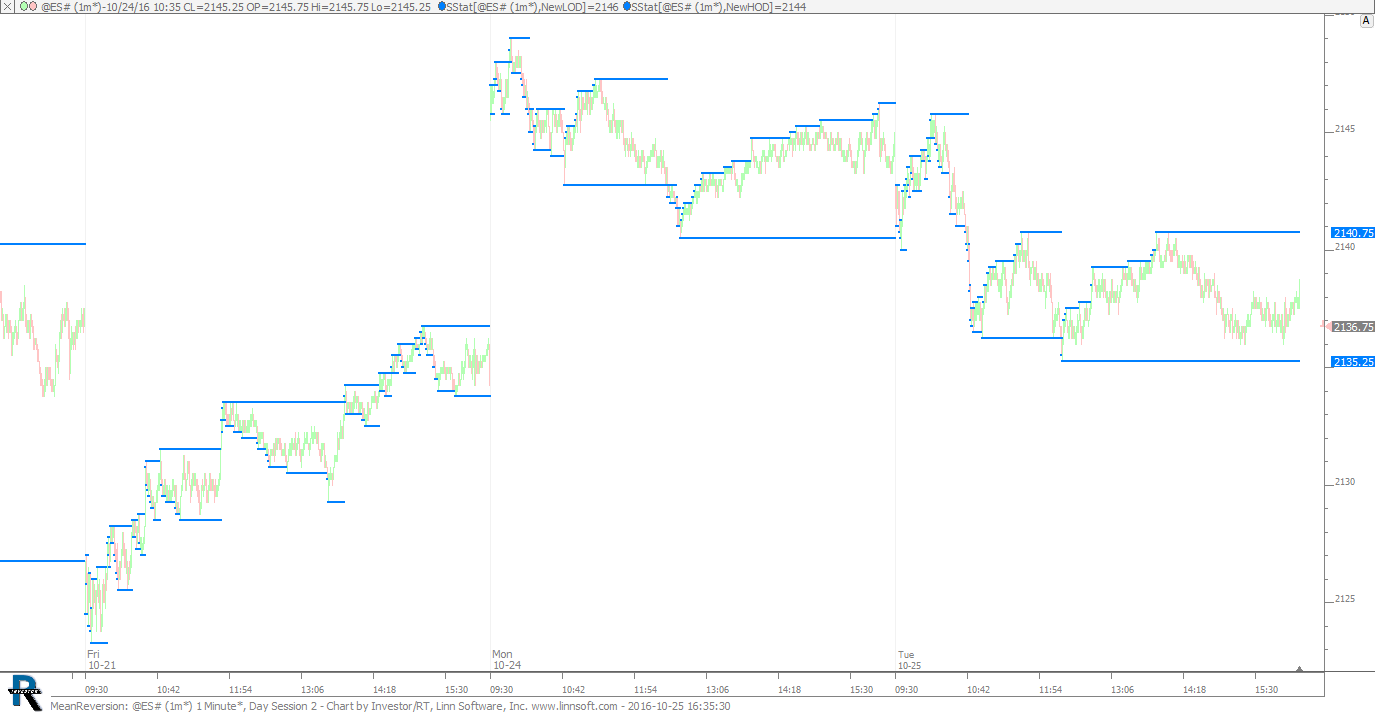 |
MeanReversion (@ES#) cpayne [totalcount]
9 years 8 months ago
Mean Reversion. This chart was uploaded by Investor/RT 12.6.7 showing symbol: @ES#. |
View |
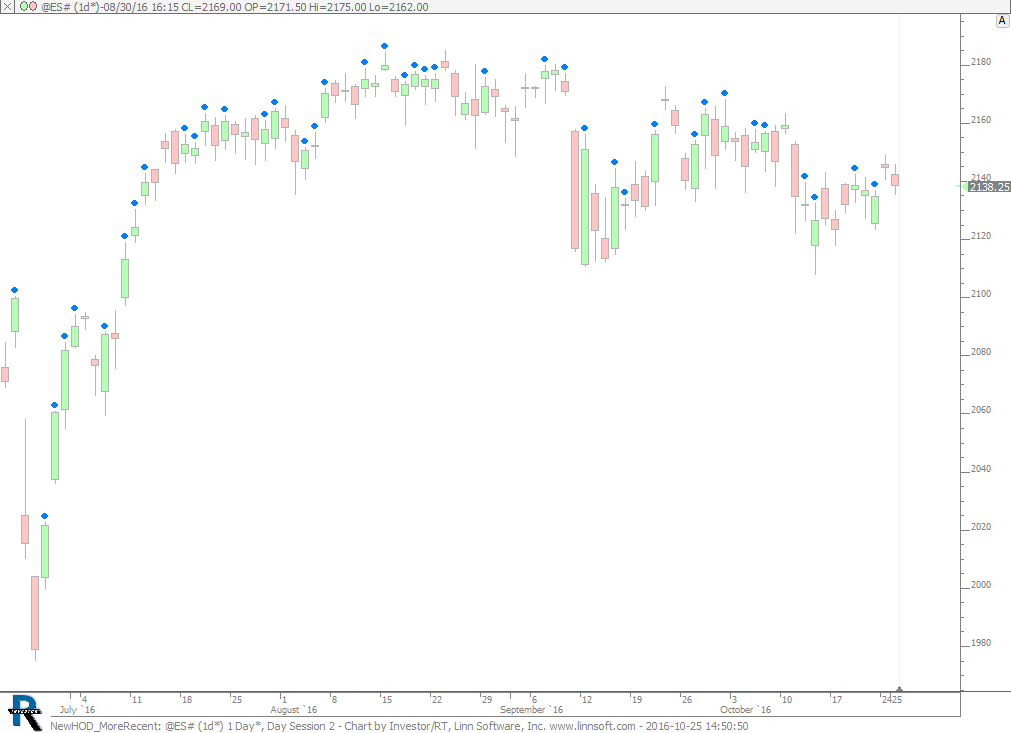 |
NewHOD MoreRecent (@ES#) cpayne [totalcount]
9 years 8 months ago
New HOD More Recent than New LOD. This chart was uploaded by Investor/RT 12.6.7 showing symbol: @ES#. |
View |
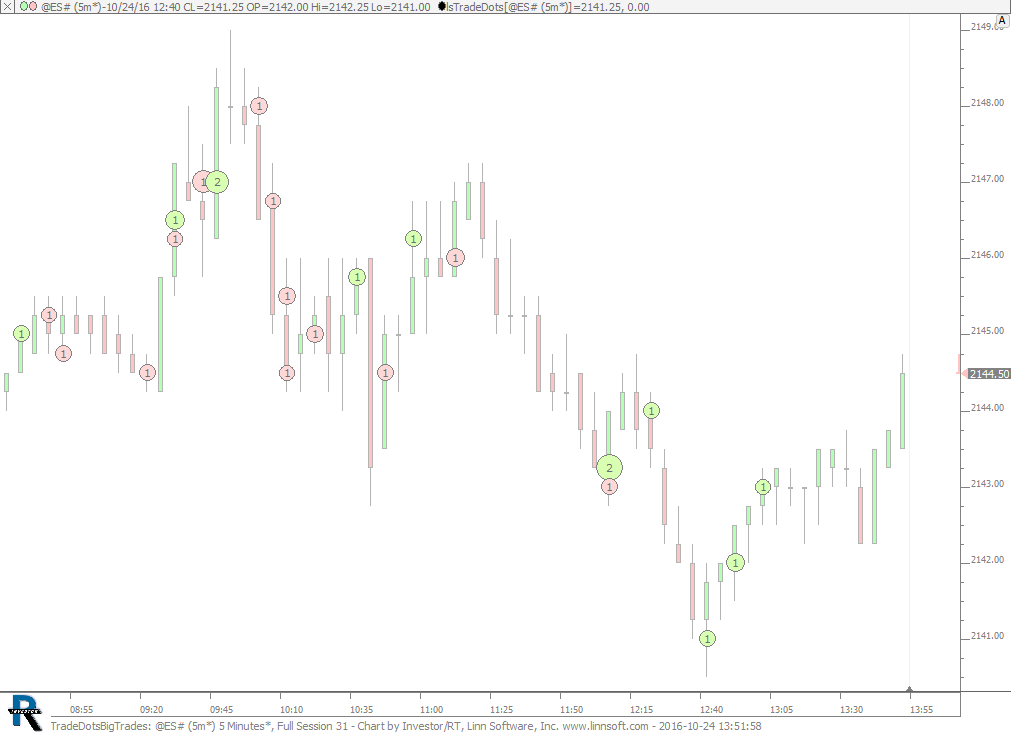 |
TradeDotsBigTrades (@ES#) cpayne [totalcount]
9 years 8 months ago
Trade Dots Highlighting Big Trades. This chart was uploaded by Investor/RT 12.6.7 showing symbol: @ES#. |
View |
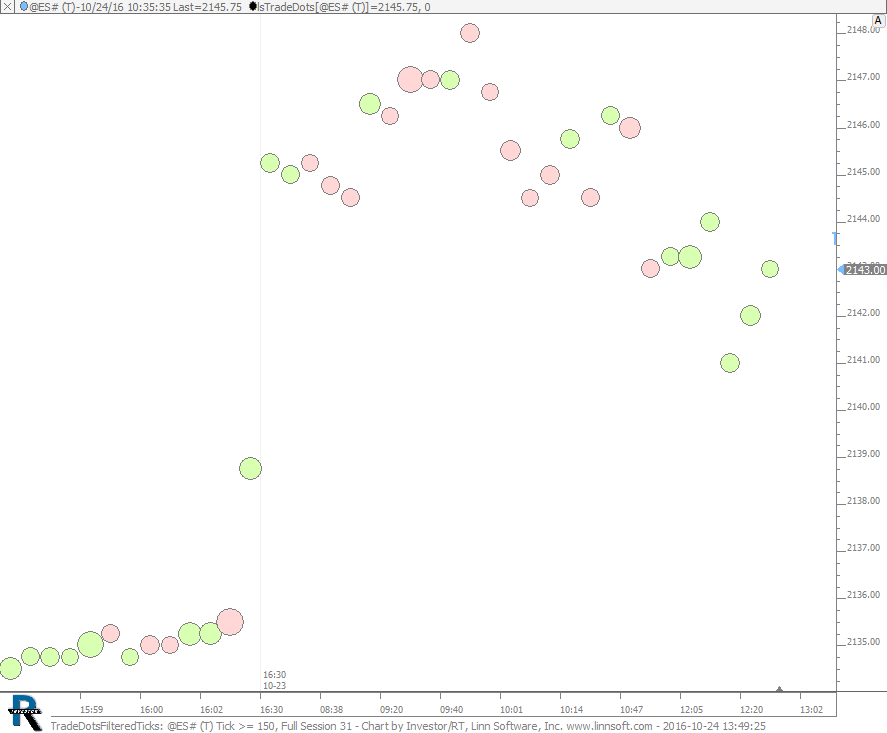 |
TradeDotsFilteredTicks (@ES#) cpayne [totalcount]
9 years 8 months ago
Trade Dots Filtered Ticks. This chart was uploaded by Investor/RT 12.6.7 showing symbol: @ES#. |
View |
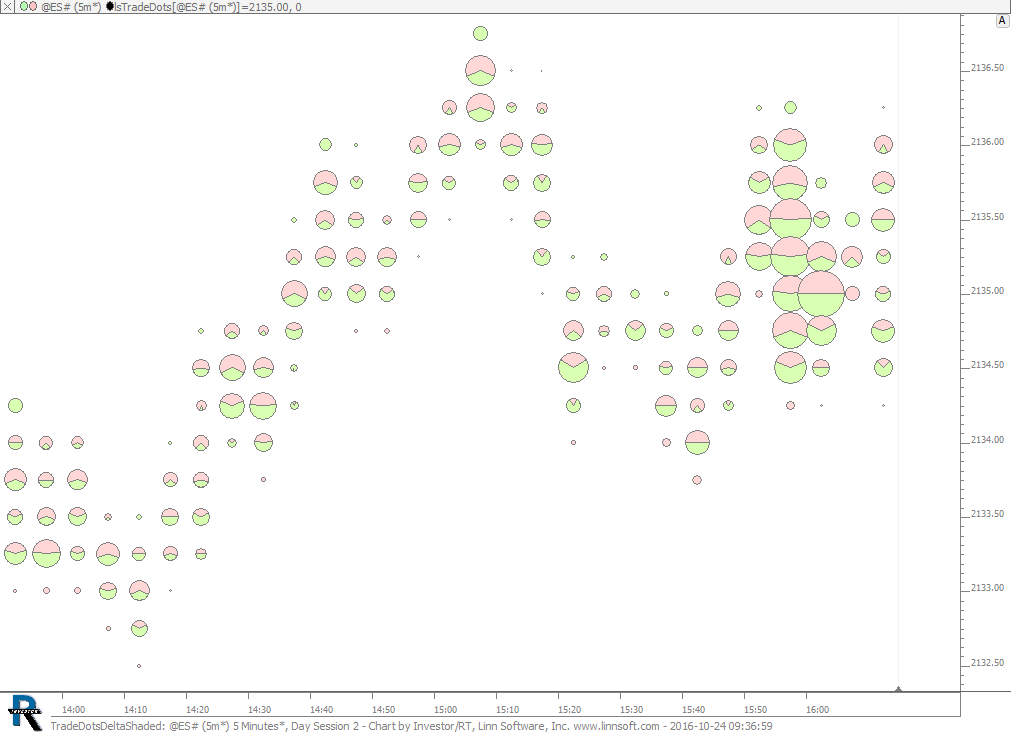 |
TradeDotsDeltaShaded (@ES#) cpayne [totalcount]
9 years 8 months ago
Trade Dots Delta Pie. This chart was uploaded by Investor/RT 12.6.7 showing symbol: @ES#. |
View |
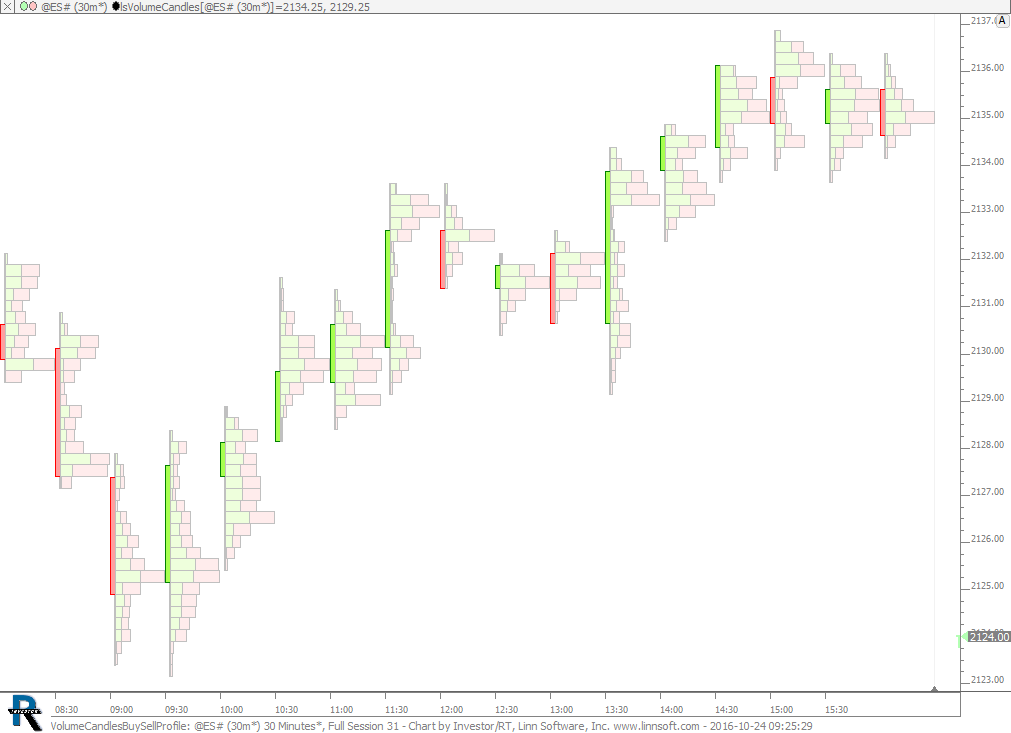 |
VolumeCandlesBuySellProfile (@ES#) cpayne [totalcount]
9 years 8 months ago
Volume Candles with Buy/Sell Profile. This chart was uploaded by Investor/RT 12.6.7 showing symbol: @ES#. |
View |
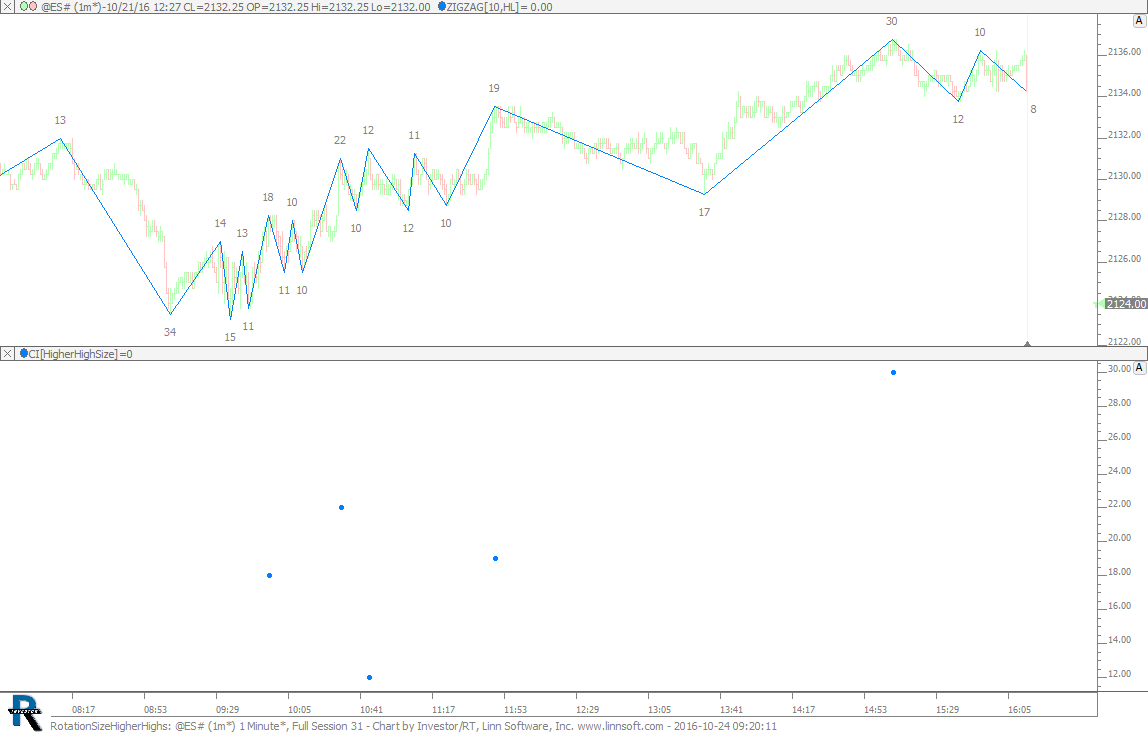 |
RotationSizeHigherHighs (@ES#) cpayne [totalcount]
9 years 8 months ago
Rotation Size of Higher Highs. This chart was uploaded by Investor/RT 12.6.7 showing symbol: @ES#. |
View |
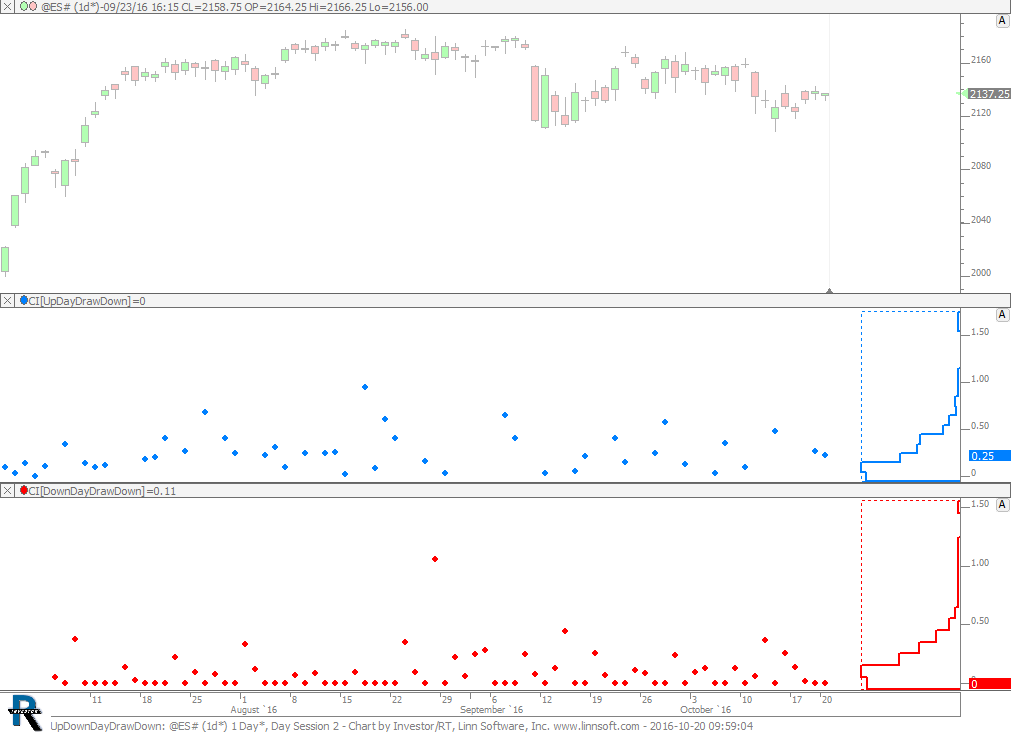 |
UpDownDayDrawDown (@ES#) cpayne [totalcount]
9 years 8 months ago
Up and Down Day Drop Down. This chart was uploaded by Investor/RT 12.6.6 showing symbol: @ES#. |
View |
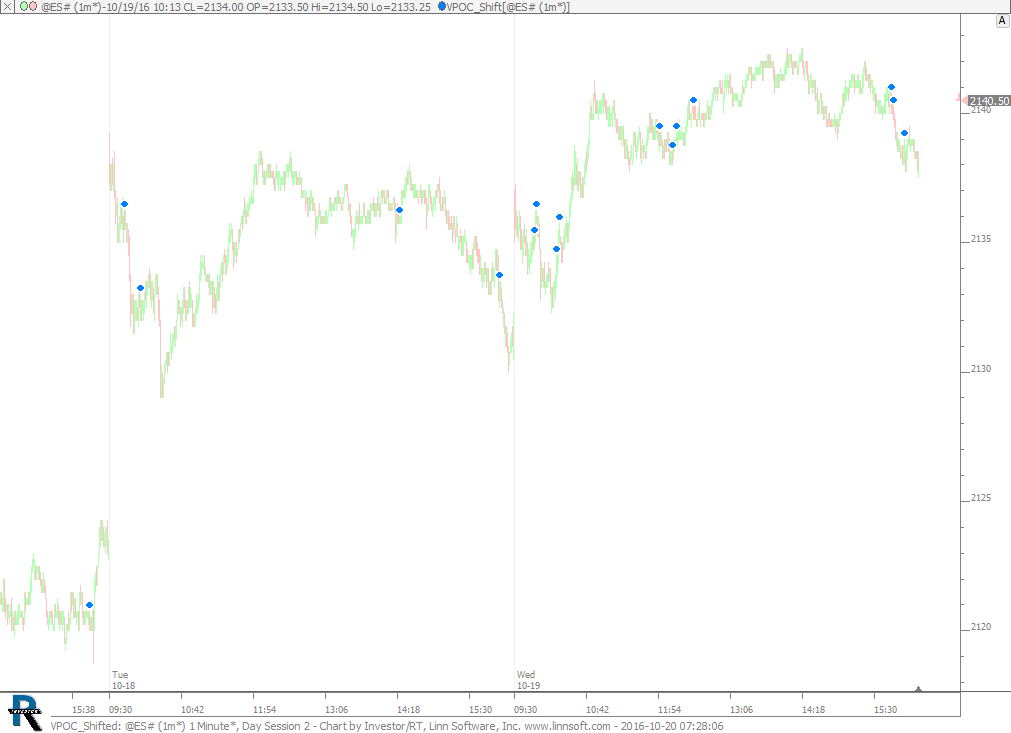 |
VPOC Shifted (@ES#) cpayne [totalcount]
9 years 8 months ago
VPOC Shift Alert. This chart was uploaded by Investor/RT 12.6.6 showing symbol: @ES#. |
View |
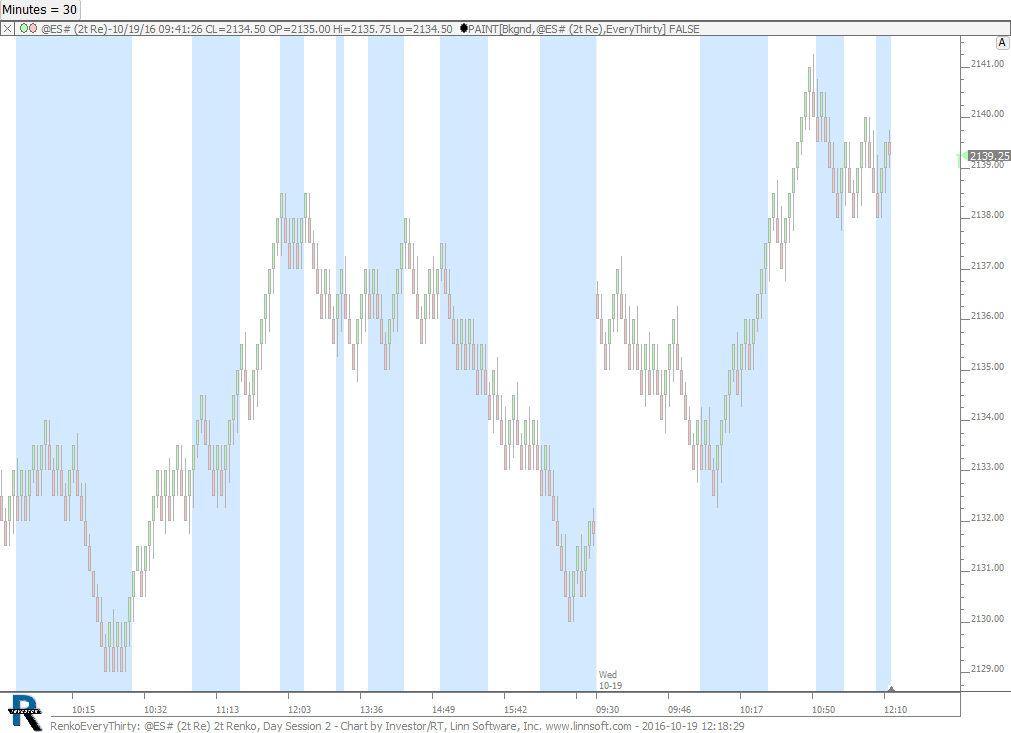 |
RenkoEveryThirty (@ES#) cpayne [totalcount]
9 years 8 months ago
Renko Chart With Every 30 Minute Period Painted. This chart was uploaded by Investor/RT 12.6.6 showing symbol: @ES#. |
View |
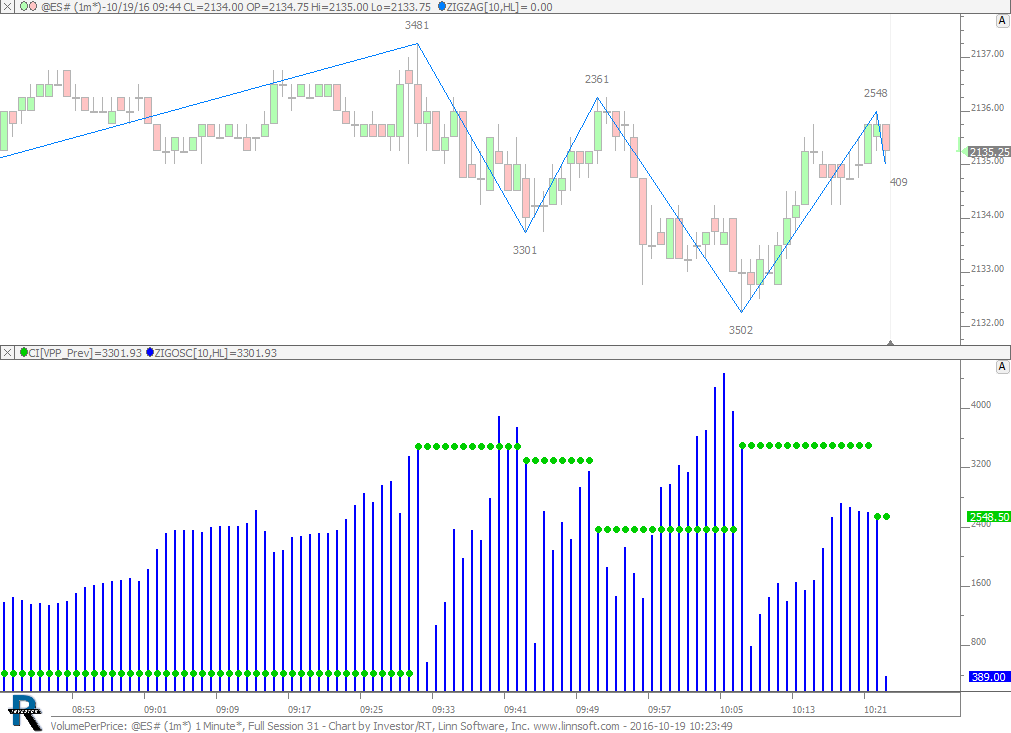 |
VolumePerPrice (@ES#) cpayne [totalcount]
9 years 8 months ago
Volume Per Price of Previous Leg. This chart was uploaded by Investor/RT 12.6.6 showing symbol: @ES#. |
View |
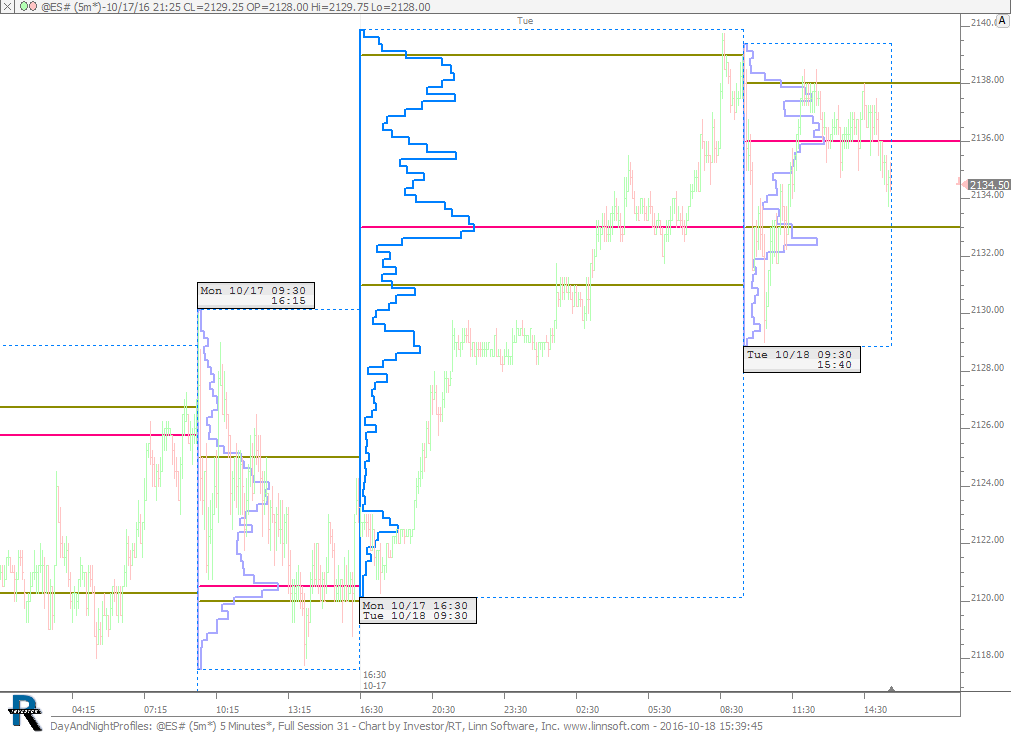 |
DayAndNightProfiles (@ES#) cpayne [totalcount]
9 years 9 months ago
Split Profile - Day and ON Session. This chart was uploaded by Investor/RT 12.6.6 showing symbol: @ES#. |
View |
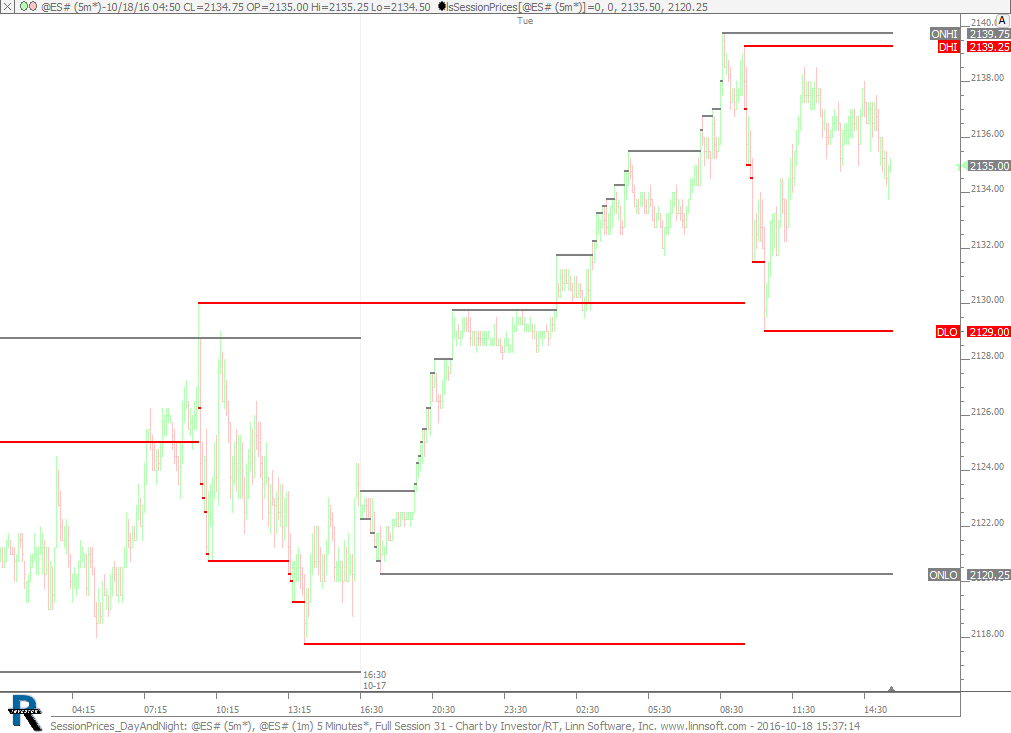 |
SessionPrices DayAndNight (@ES#) cpayne [totalcount]
9 years 9 months ago
Session Prices - Day and Overnight High / Low. This chart was uploaded by Investor/RT 12.6.6 showing symbol: @ES#. |
View |