 |
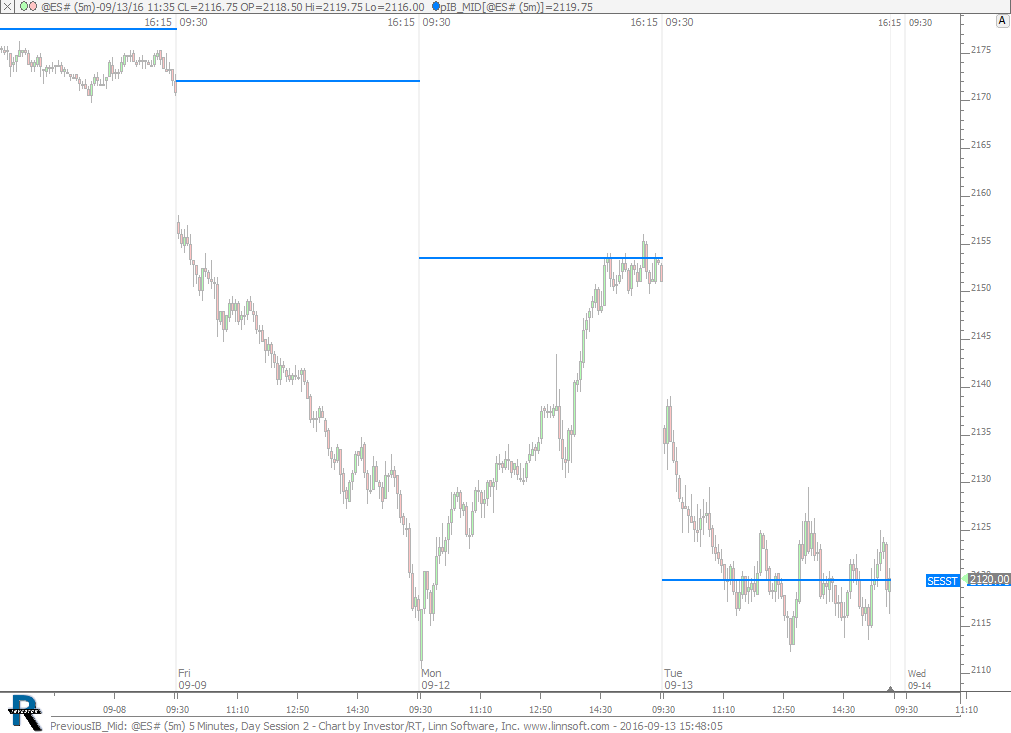
PreviousIB Mid (@ES#) cpayne [totalcount]
9 years 10 months ago
Previous IB Mid. This chart was uploaded by Investor/RT 12.6.2 showing symbol: @ES#. |
View |
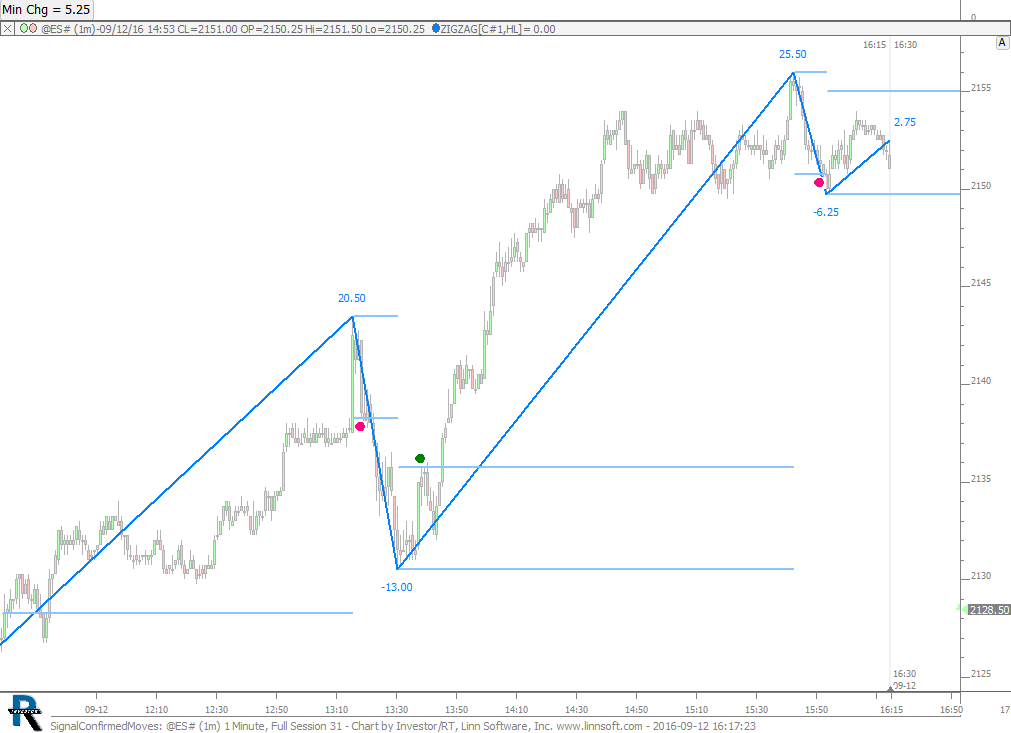 |
SignalConfirmedMoves (@ES#) cpayne [totalcount]
9 years 10 months ago
Alert when Zig Zag Moves are confirmed. Min Move can be adjusted with button at top. This chart was uploaded by Investor/RT 12.6.2 showing symbol: @ES#. |
View |
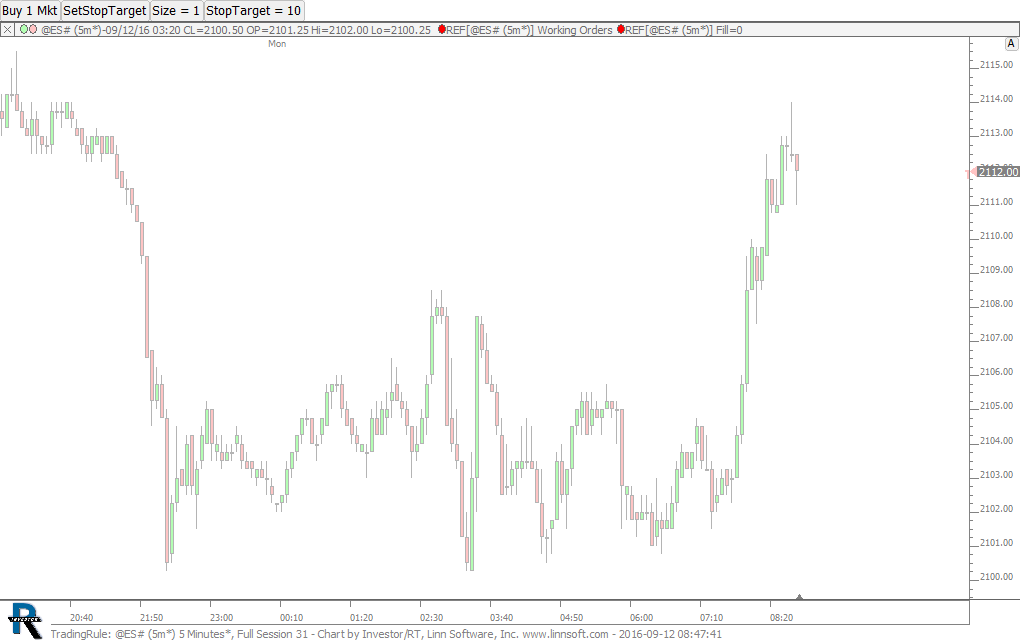 |
TradingRule (@ES#) cpayne [totalcount]
9 years 10 months ago
SetTargetStop. This chart was uploaded by Investor/RT 12.6.2 showing symbol: @ES#. |
View |
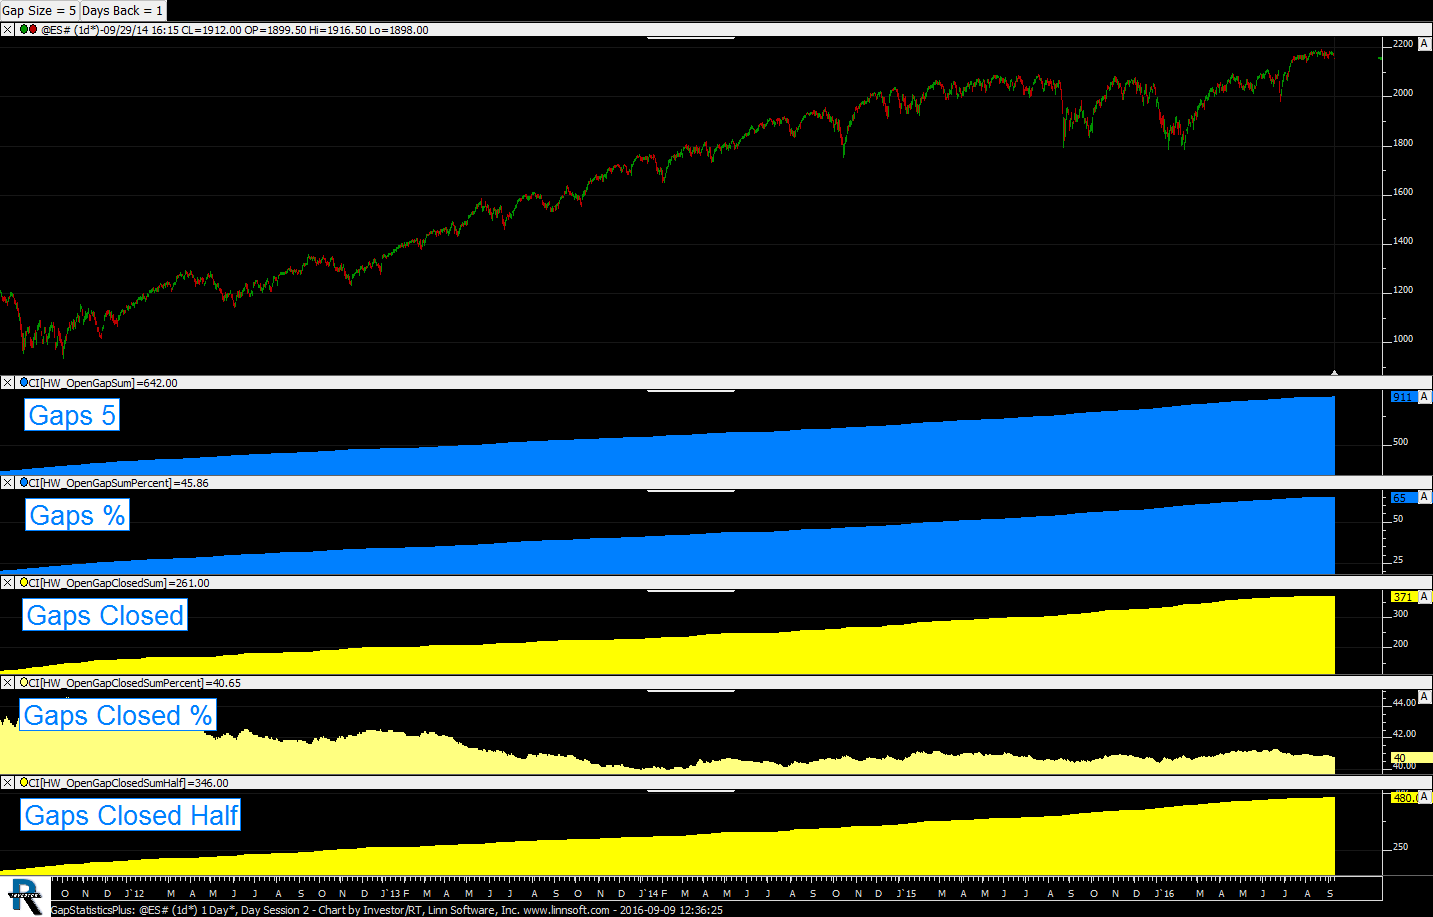 |
GapStatisticsPlus (@ES#) cpayne [totalcount]
9 years 10 months ago
This chart was uploaded by Investor/RT 12.6.2 showing symbol: @ES#. |
View |
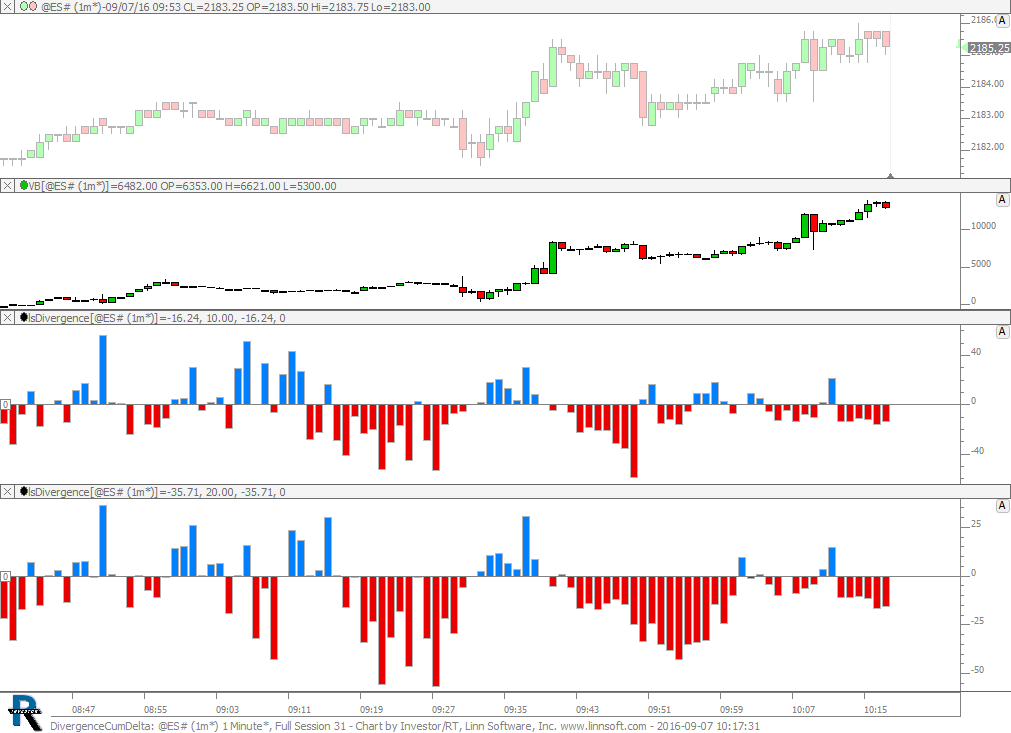 |
DivergenceCumDelta (@ES#) cpayne [totalcount]
9 years 10 months ago
Divergence between Price and Cumulative Delta. This chart was uploaded by Investor/RT 12.6.1 showing symbol: @ES#. |
View |
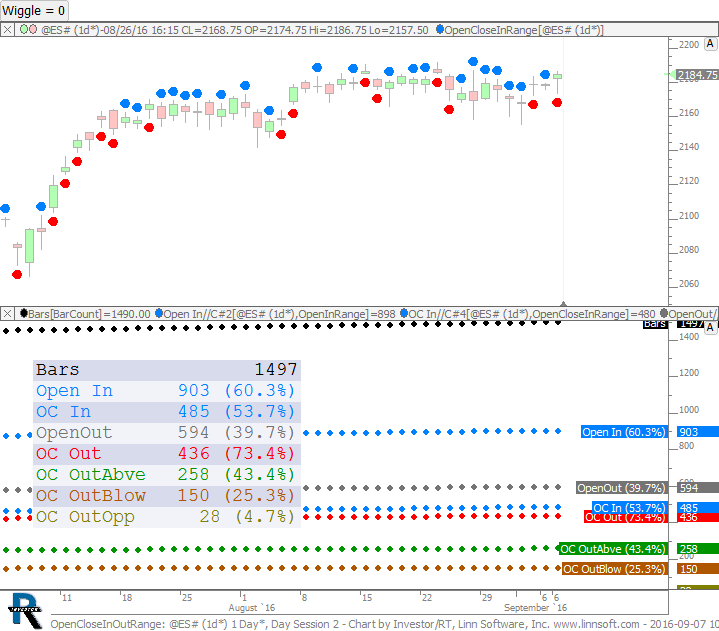 |
OpenCloseInOutRange (@ES#) cpayne [totalcount]
9 years 10 months ago
Counts Days Open and Close were both inside range. (or both outside range) with an optional wiggle (in ticks) controlled by button. |
View |
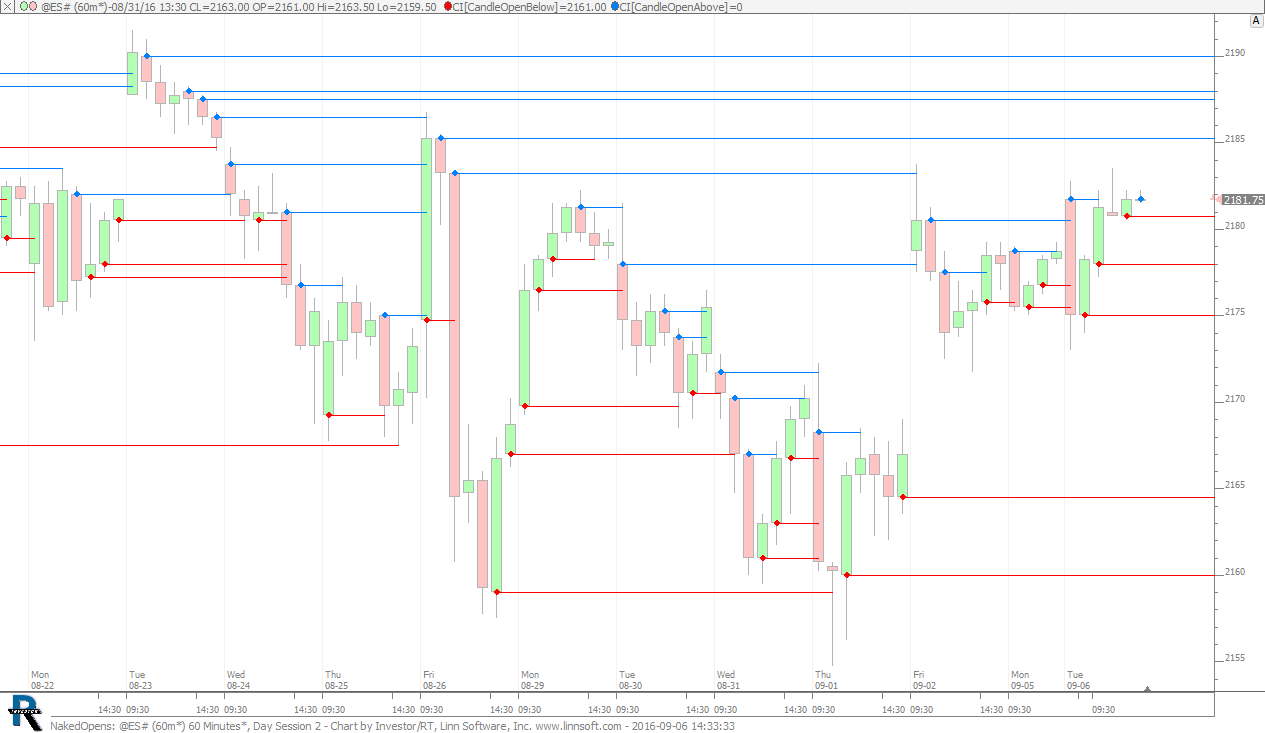 |
NakedOpens (@ES#) cpayne [totalcount]
9 years 10 months ago
Extended Naked Opens. This chart was uploaded by Investor/RT 12.6.1 showing symbol: @ES#. |
View |
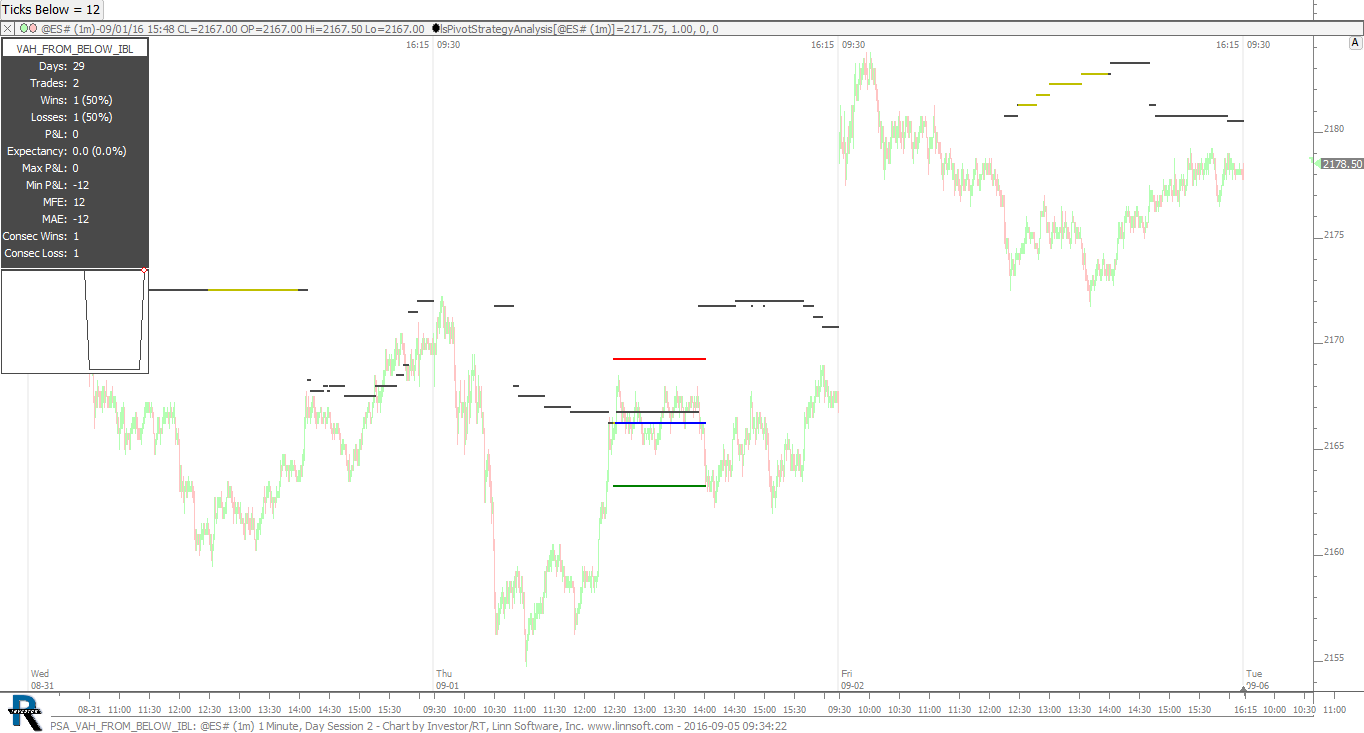 |
PSA VAH FROM BELOW IBL (@ES#) cpayne [totalcount]
9 years 10 months ago
VAH approached from below after going below IBL by user specified (button) number of ticks. This chart was uploaded by Investor/RT 12.6.1 showing symbol: @ES#. |
View |
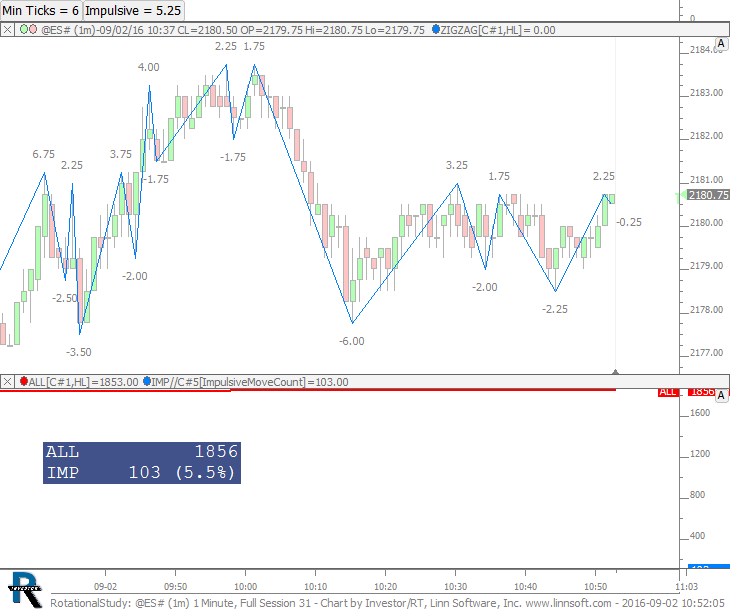 |
RotationalStudy (@ES#) cpayne [totalcount]
9 years 10 months ago
Rotation Study - Counts moves (based on Min Ticks button) and presents Impulsive Moves (controlled by Impulsive button and specified in $) as a percent of total moves. |
View |
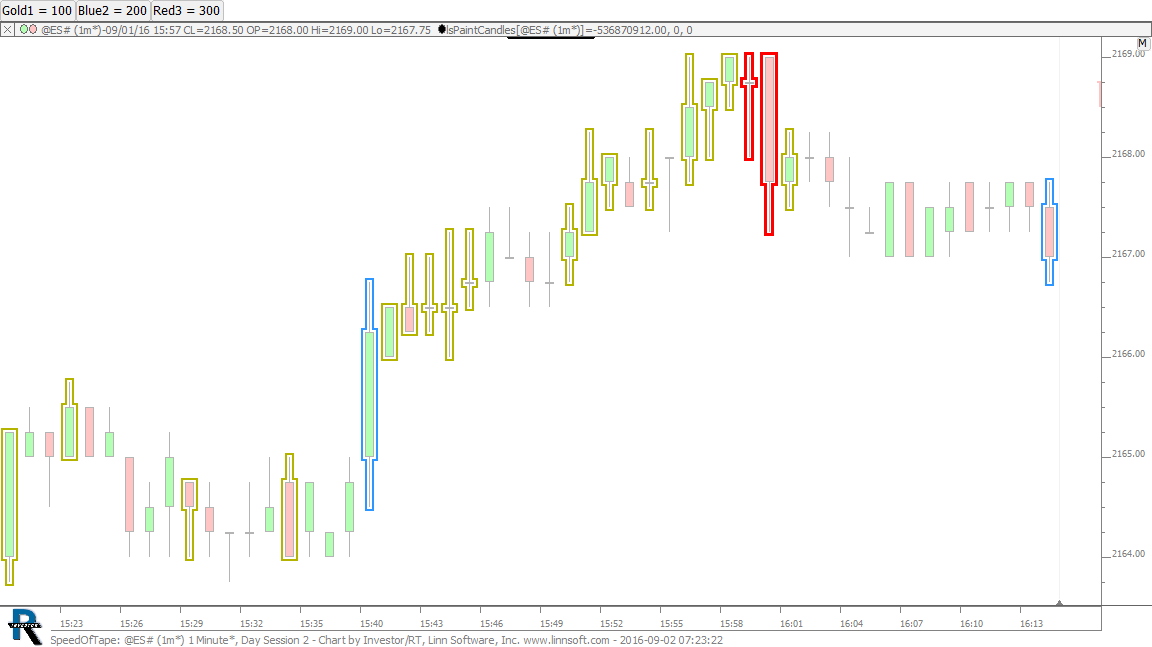 |
SpeedOfTape (@ES#) cpayne [totalcount]
9 years 10 months ago
Pace of Tape - PaintCandles Indicator paints bars with 150 trades or more (adjustable by button). This chart was uploaded by Investor/RT 12.6.1 showing symbol: @ES#. |
View |
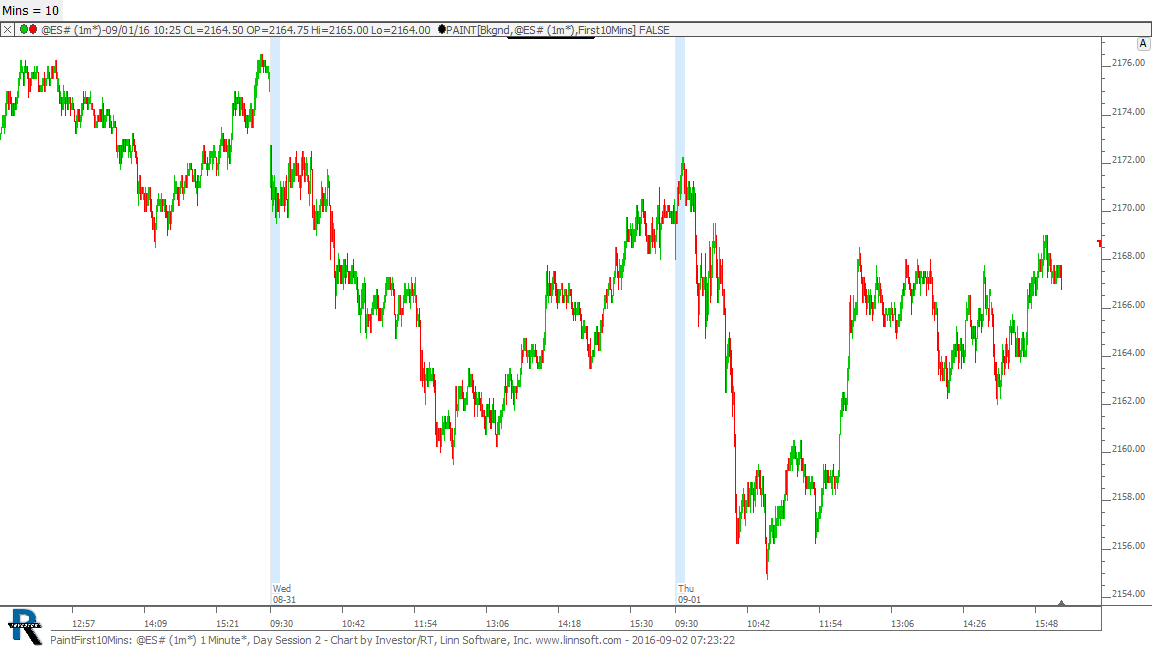 |
PaintFirst10Mins (@ES#) cpayne [totalcount]
9 years 10 months ago
Paint First 10 Minutes of Session - Button at top to control of minutes. This chart was uploaded by Investor/RT 12.6.1 showing symbol: @ES#. |
View |
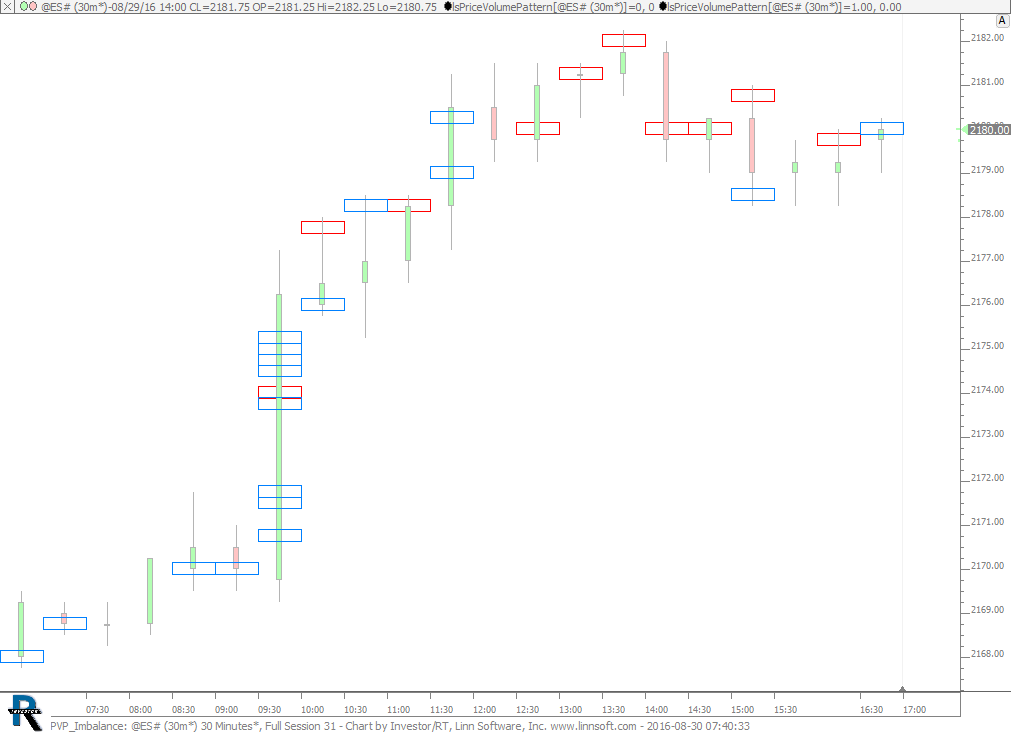 |
PVP Imbalance (@ES#) cpayne [totalcount]
9 years 10 months ago
Finding Imbalance using PVP. Blue identifies buy imbalance and red identifies sell imbalance. Requires 100 lots on both sides for imbalance to be considered. |
View |
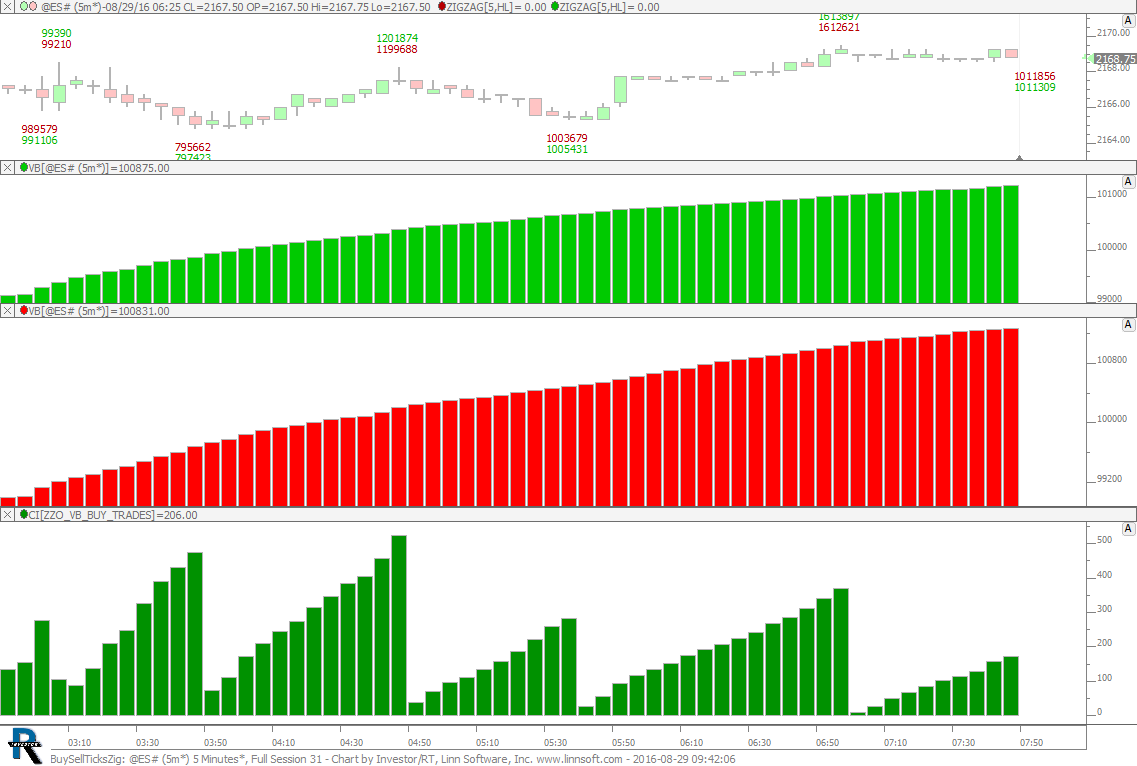 |
BuySellTicksZig (@ES#) cpayne [totalcount]
9 years 10 months ago
This chart was uploaded by Investor/RT 12.6.1 showing symbol: @ES#. |
View |
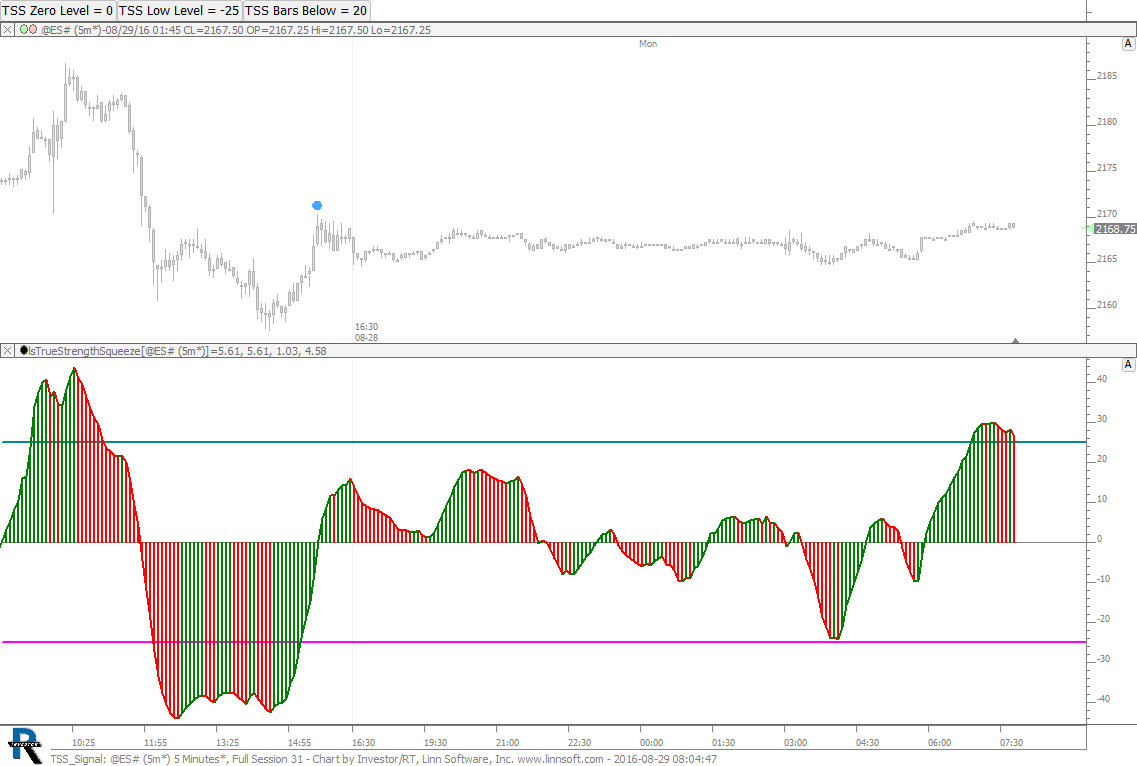 |
TSS Signal (@ES#) cpayne [totalcount]
9 years 10 months ago
TrueStrengthSqueeze Signal - TSI moves above zero level after moving below -25 level and staying under zero level for 20 bars. 20, -25, and zero line all adjustable with buttons. |
View |
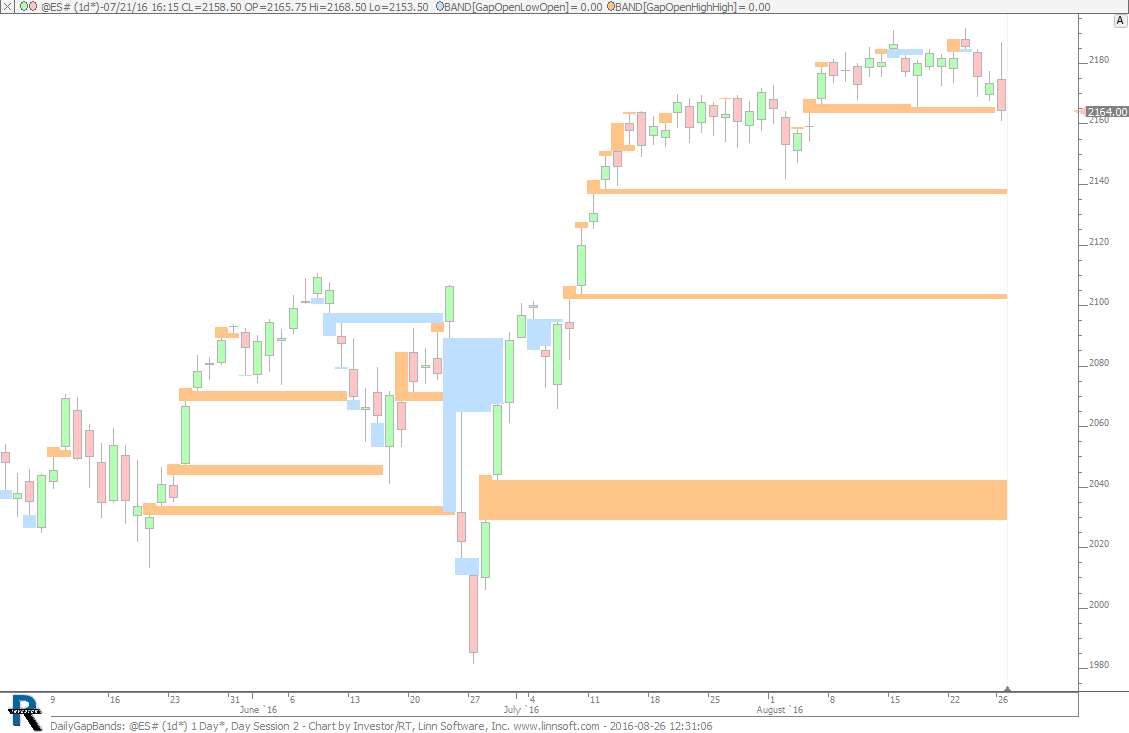 |
DailyGapBands (@ES#) cpayne [totalcount]
9 years 10 months ago
Daily Gap Bands. This chart was uploaded by Investor/RT 12.6.1 showing symbol: @ES#. |
View |
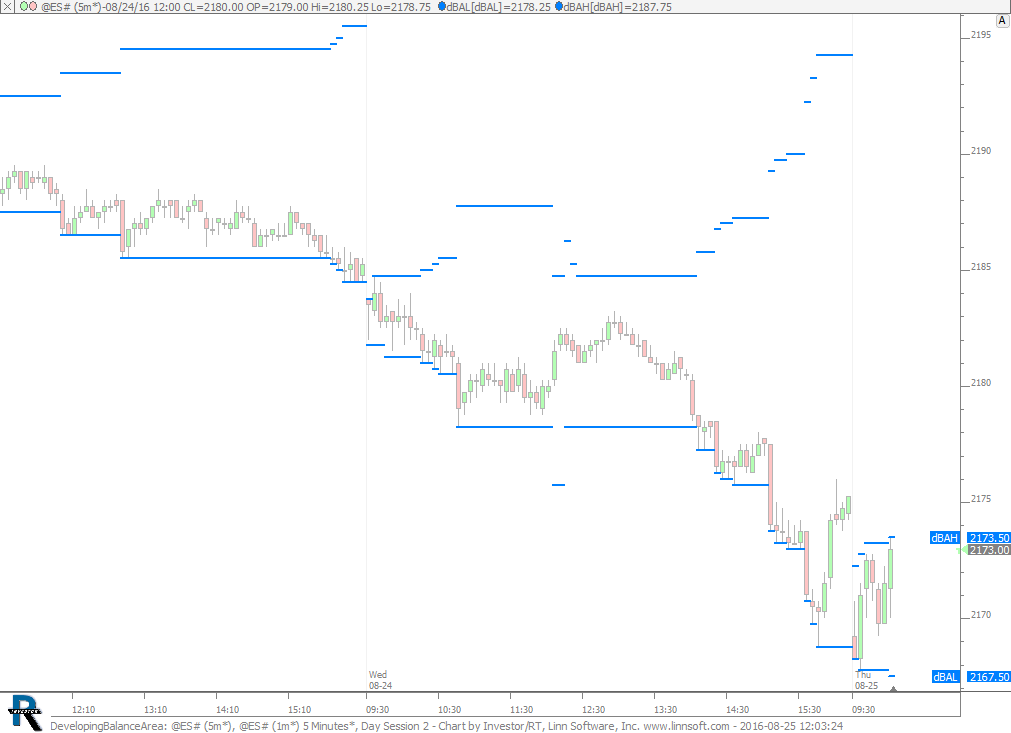 |
DevelopingBalanceArea (@ES#) 2 cpayne [totalcount]
9 years 10 months ago
Devloping Balance Area. This chart was uploaded by Investor/RT 12.6.1 showing symbol: @ES#. |
View |
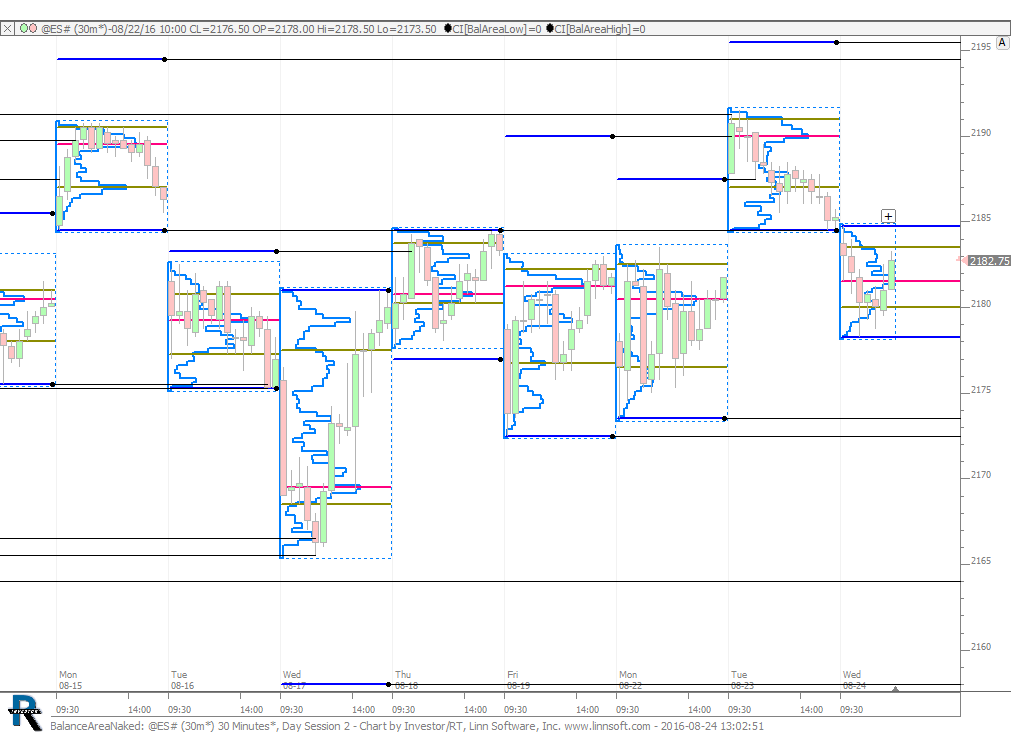 |
BalanceAreaNaked (@ES#) cpayne [totalcount]
9 years 10 months ago
Extended Naked Balance Area. This chart was uploaded by Investor/RT 12.6.1 showing symbol: @ES#. |
View |
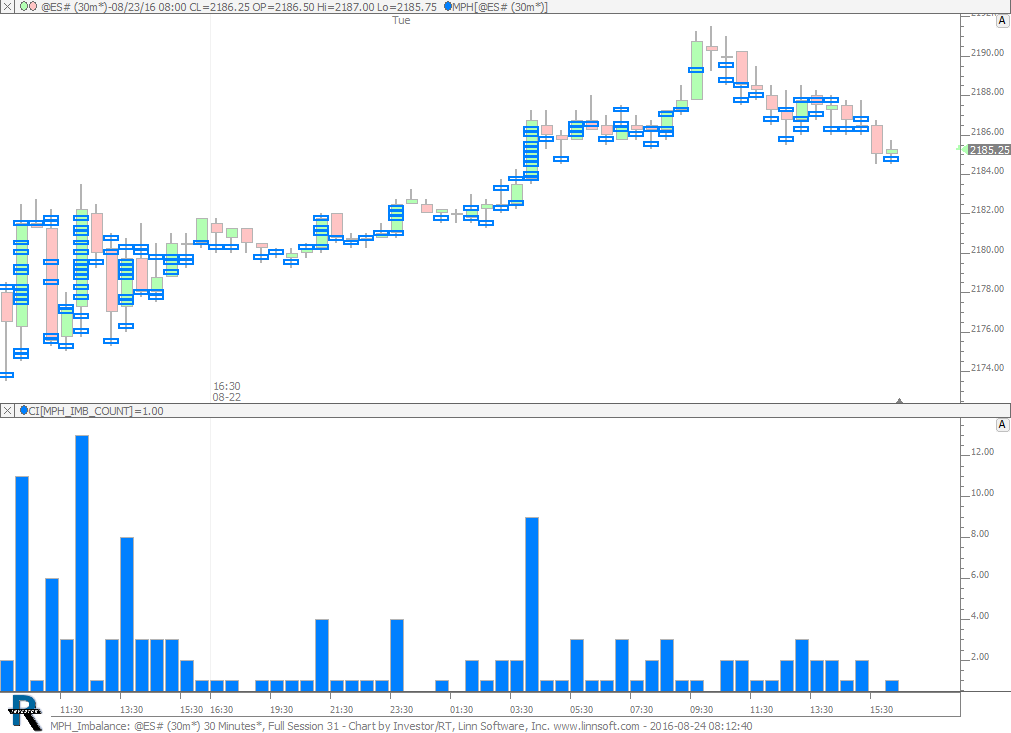 |
MPH Imbalance (@ES#) cpayne [totalcount]
9 years 10 months ago
MPH - Counting Prices with Buy Volume Imbalance > 190%. This chart was uploaded by Investor/RT 12.6.1 showing symbol: @ES#. |
View |
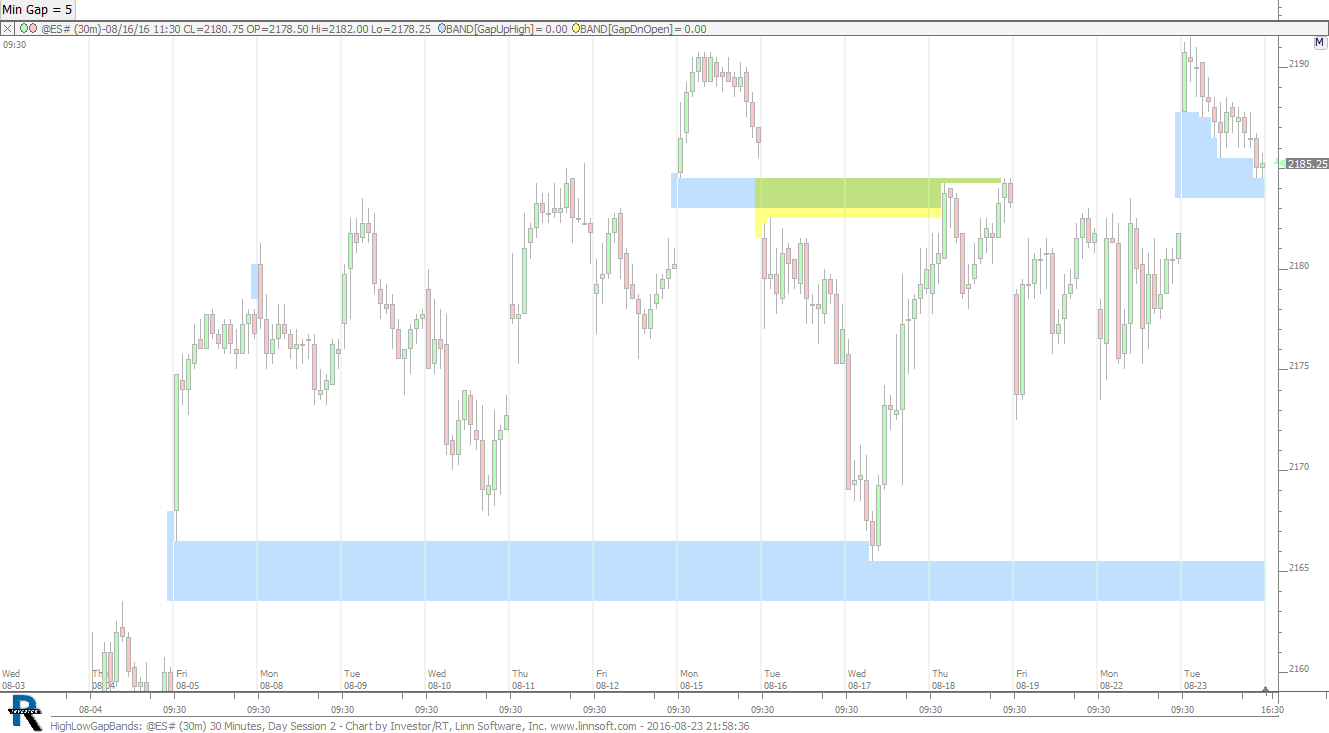 |
HighLowGapBands (@ES#) cpayne [totalcount]
9 years 10 months ago
Naked Gap Bands with Minimum Size in Ticks (Prev High to Low, Prev Low to High). This chart was uploaded by Investor/RT 12.6.1 showing symbol: @ES#. |
View |
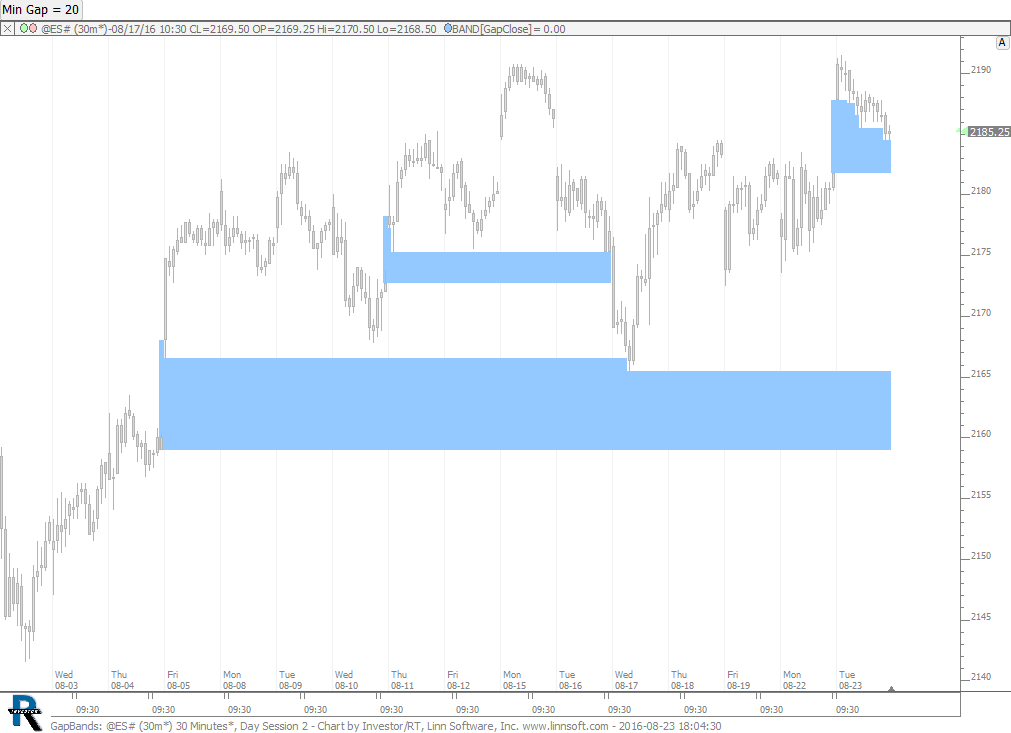 |
GapBands (@ES#) cpayne [totalcount]
9 years 10 months ago
Naked Gap Bands with Minimum Size in Ticks. This chart was uploaded by Investor/RT 12.6.1 showing symbol: @ES#. |
View |
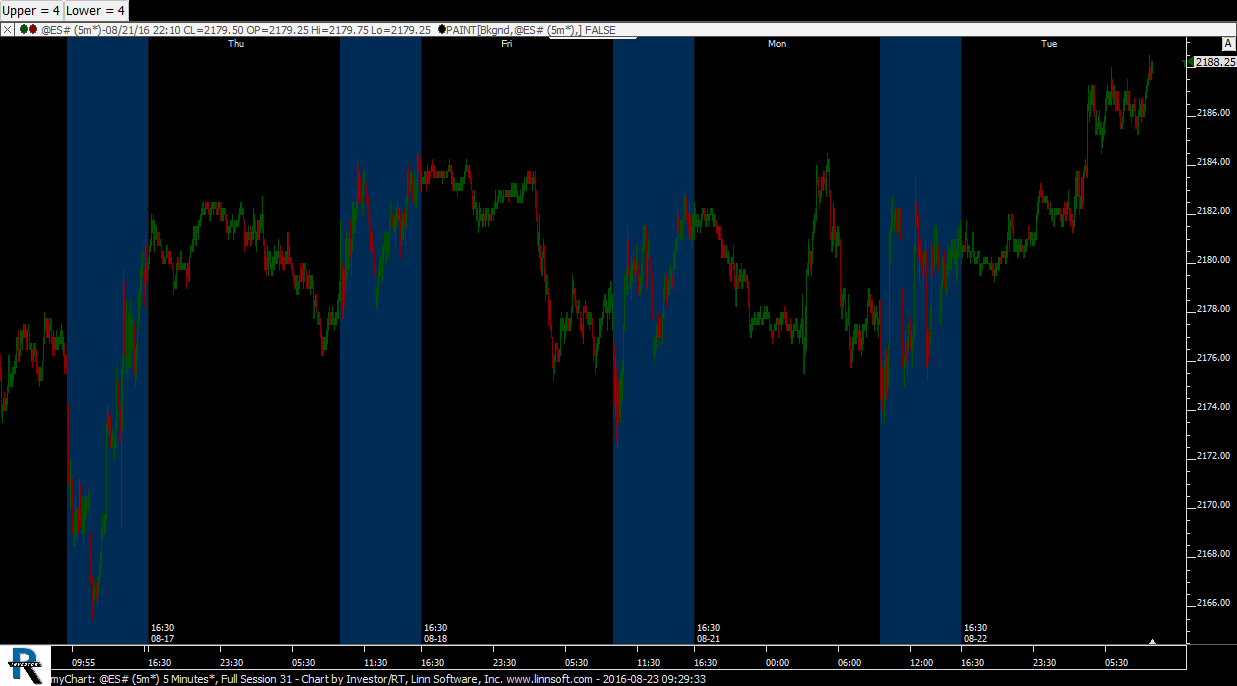 |
myChart (@ES#) cpayne [totalcount]
9 years 10 months ago
Painted Day Session. This chart was uploaded by Investor/RT 12.6.1 showing symbol: @ES#. |
View |
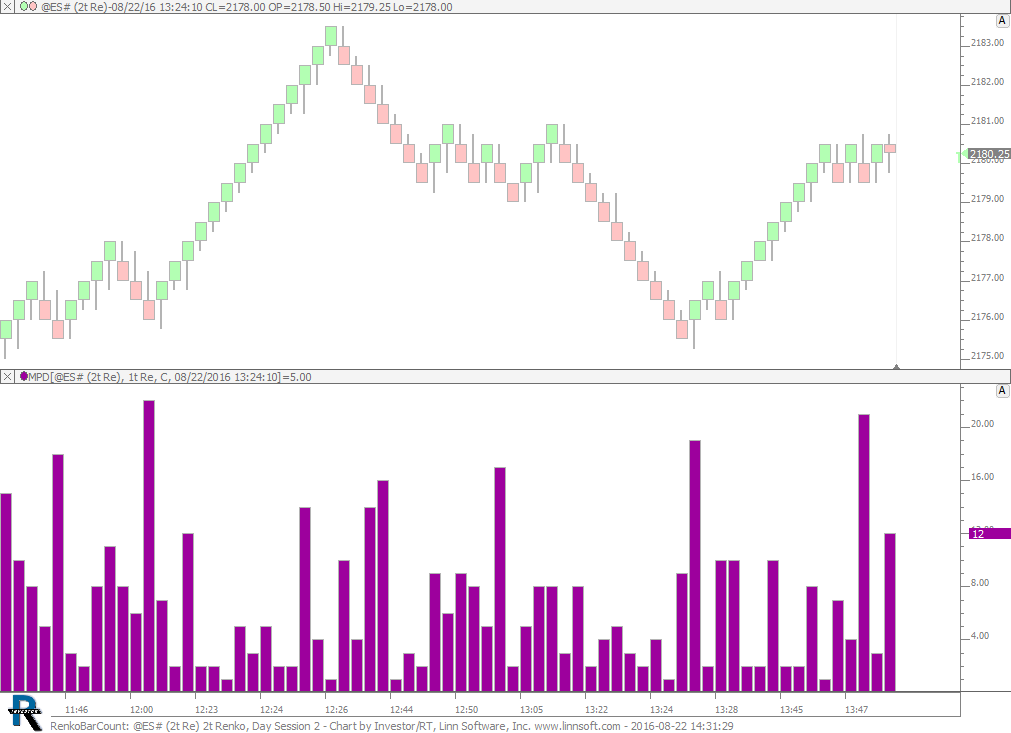 |
RenkoBarCount (@ES#) cpayne [totalcount]
9 years 10 months ago
Renko Bar Counts. This chart was uploaded by Investor/RT 12.6.1 showing symbol: @ES#. |
View |
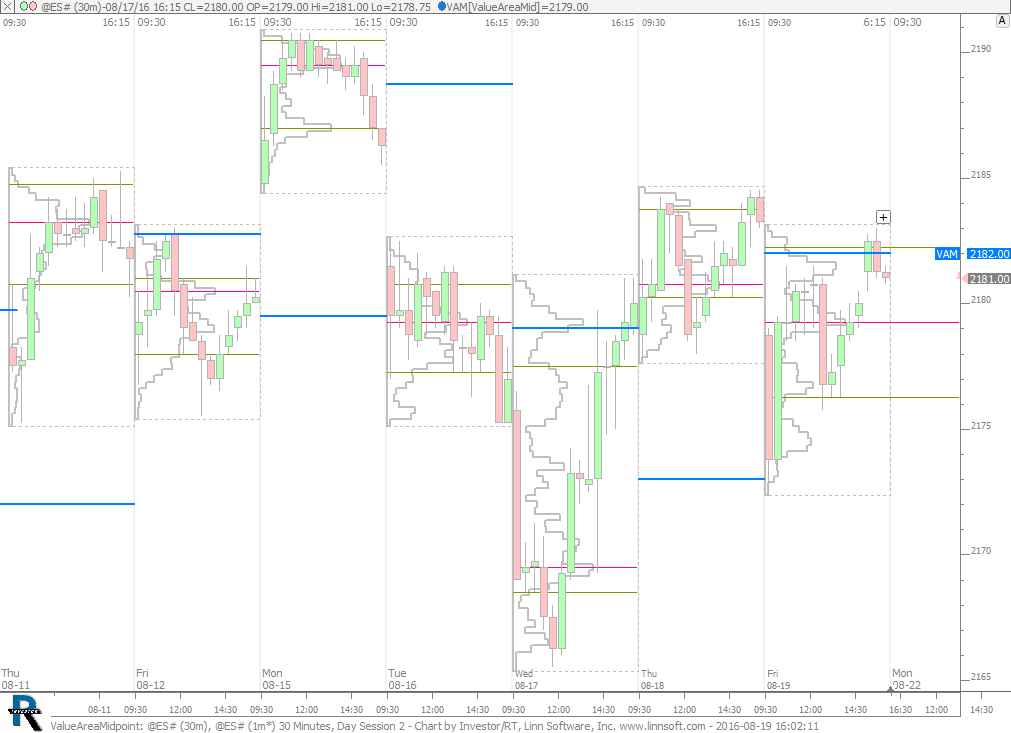 |
ValueAreaMidpoint (@ES#) cpayne [totalcount]
9 years 11 months ago
Midpoint of Previous Day Value Area. This chart was uploaded by Investor/RT 12.6.1 showing symbol: @ES#. |
View |
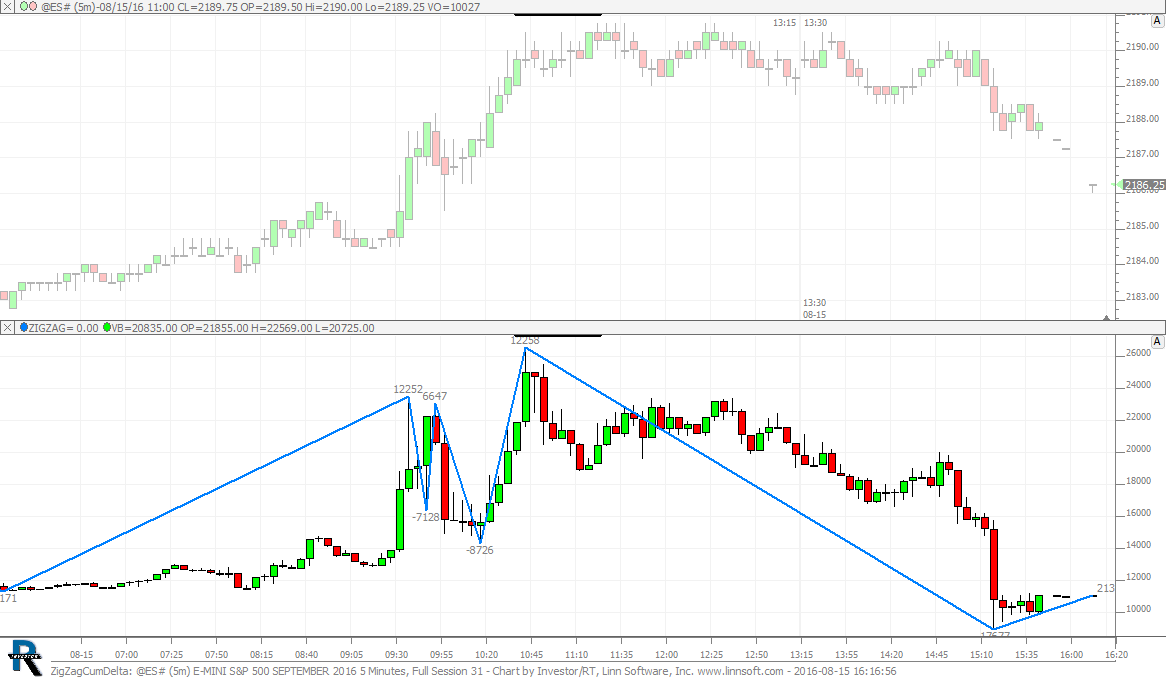 |
ZigZagCumDelta (@ES#) cpayne [totalcount]
9 years 11 months ago
Zig Zag of Cumulative Delta. This chart was uploaded by Investor/RT 12.6.1 showing symbol: @ES#. |
View |
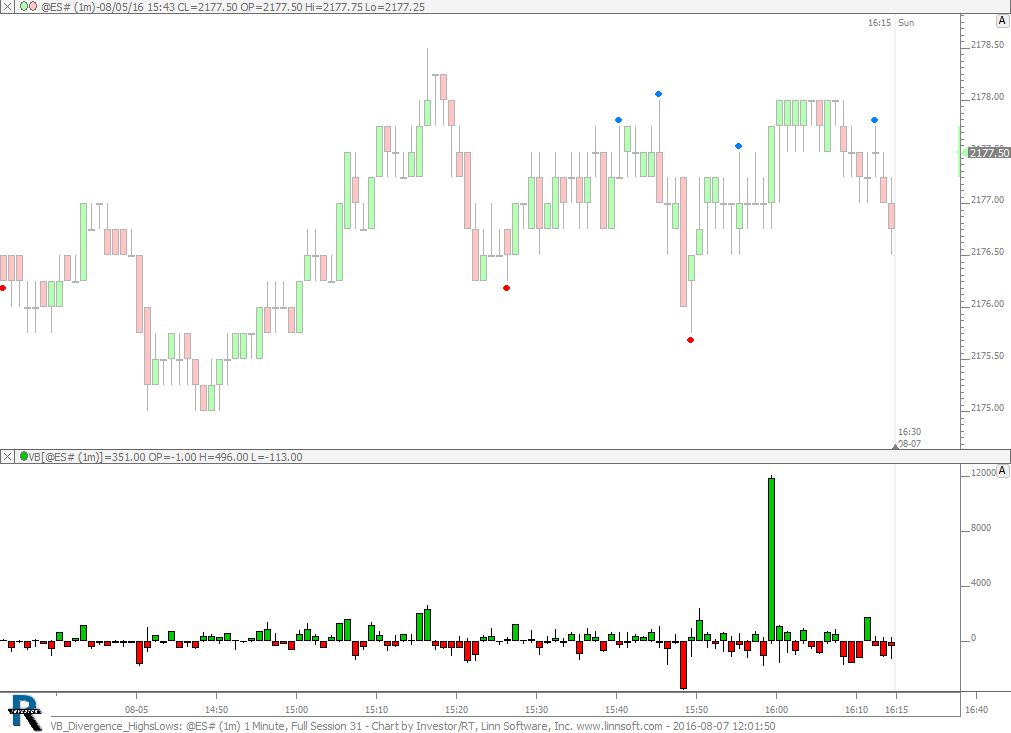 |
VB Divergence HighsLows (@ES#) cpayne [totalcount]
9 years 11 months ago
High High on Negative Delta (Blue) and Lower Low with Positive Delta (Red). This chart was uploaded by Investor/RT 12.6.1 showing symbol: @ES#. |
View |