 |
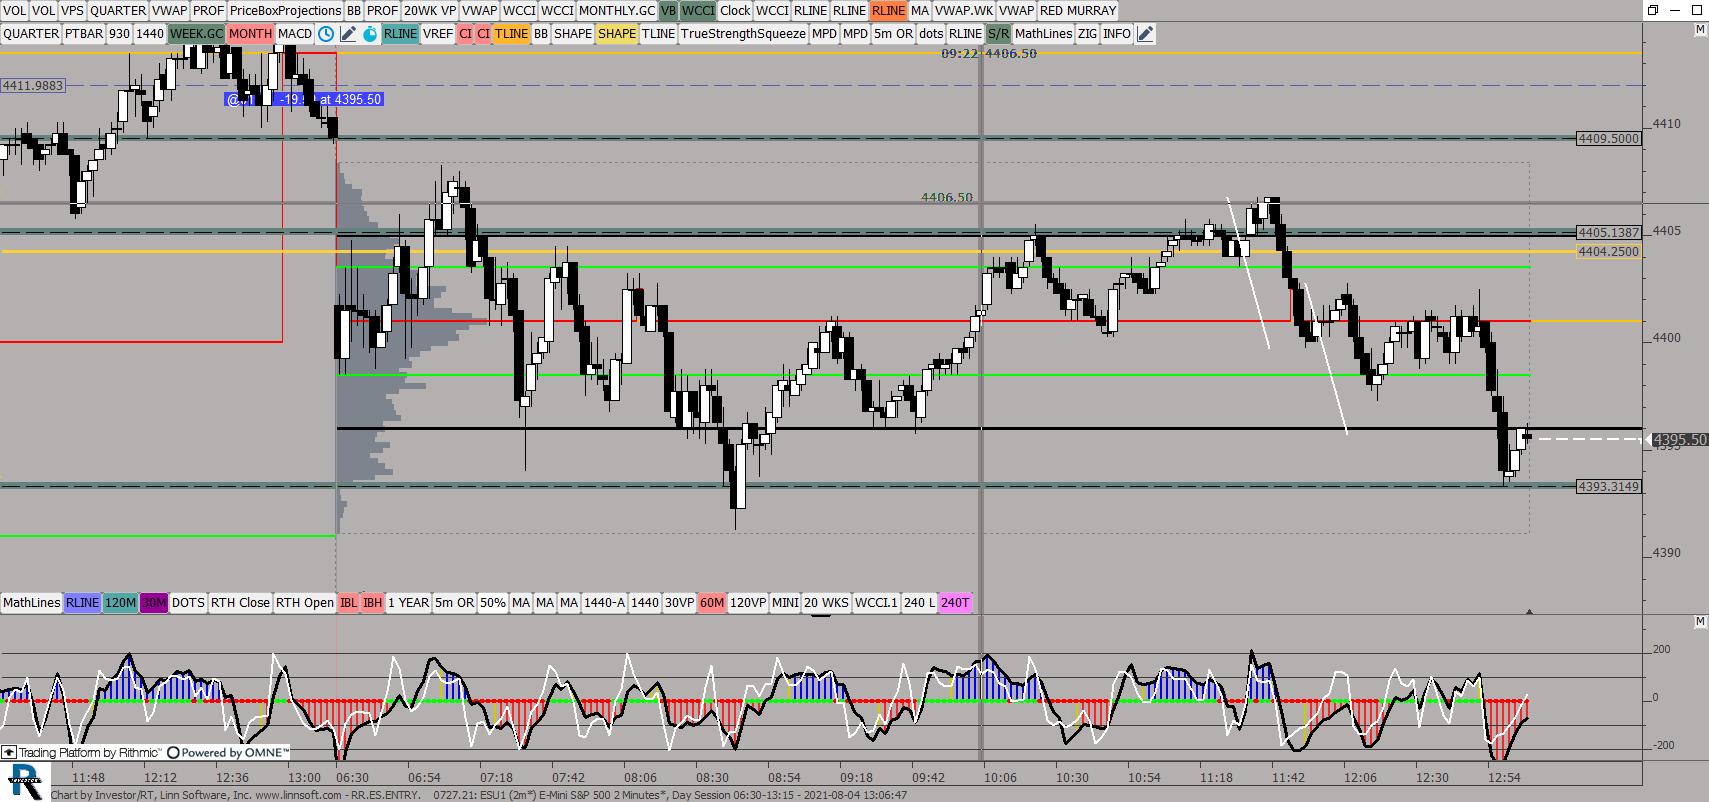
RRESENTRY (ESU1) ES42 [totalcount]
4 years 4 months ago
This chart was uploaded by Investor/RT 14.2.6 showing symbol: ESU1. |
View |
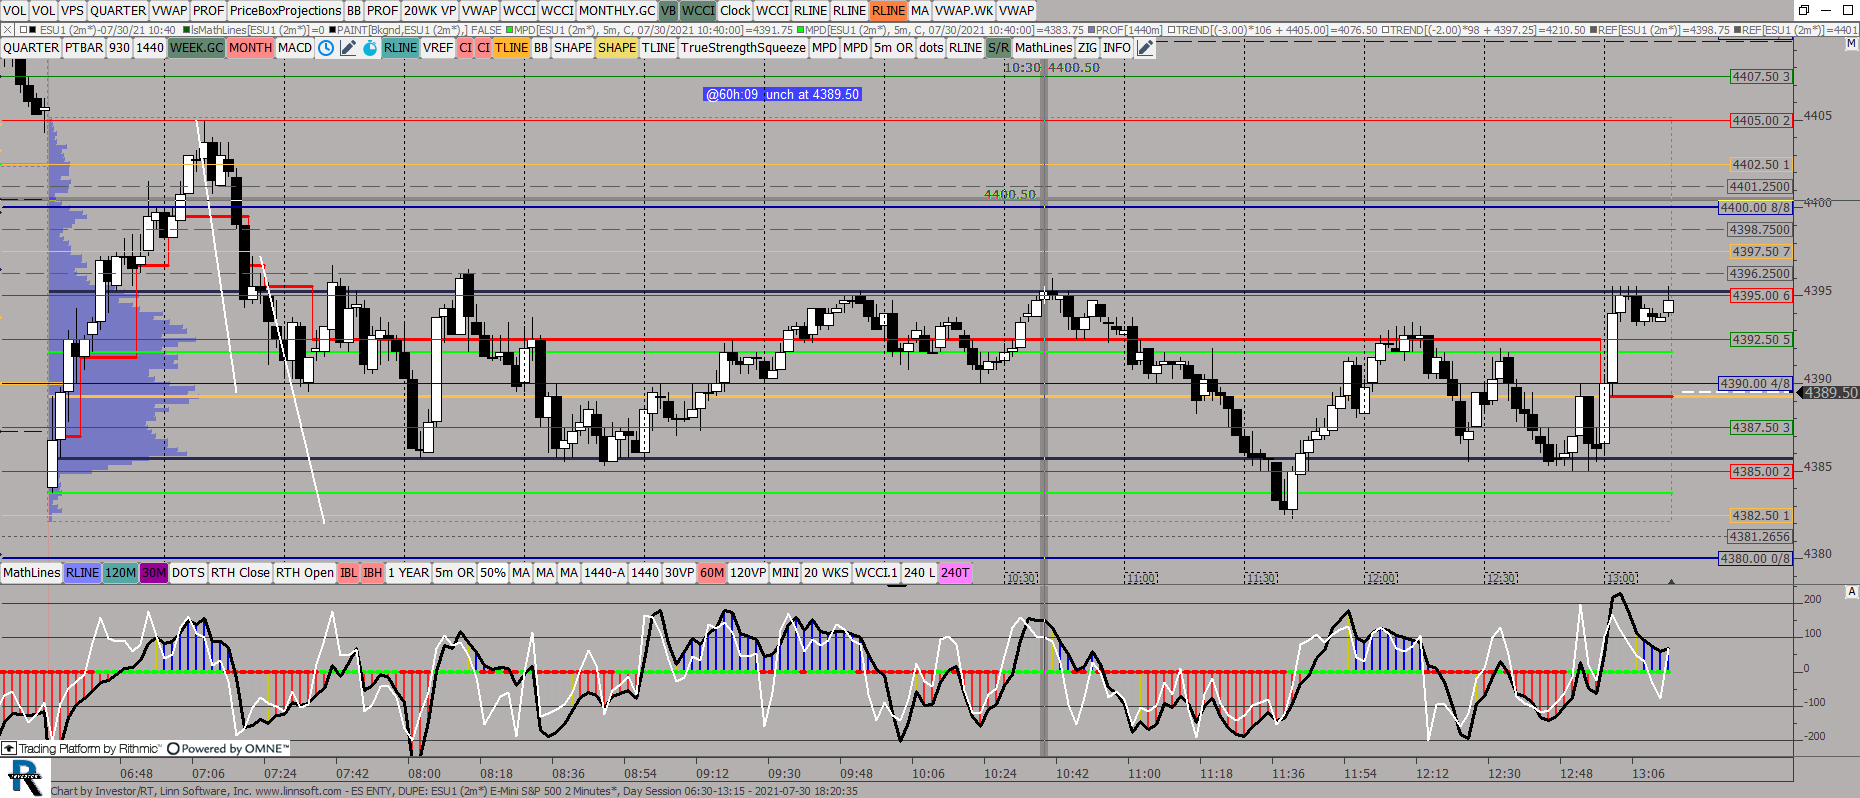 |
ES ENTY DUPE (ESU1) ES42 [totalcount]
4 years 4 months ago
Murray Math Stock. This chart was uploaded by Investor/RT 14.2.6 showing symbol: ESU1. |
View |
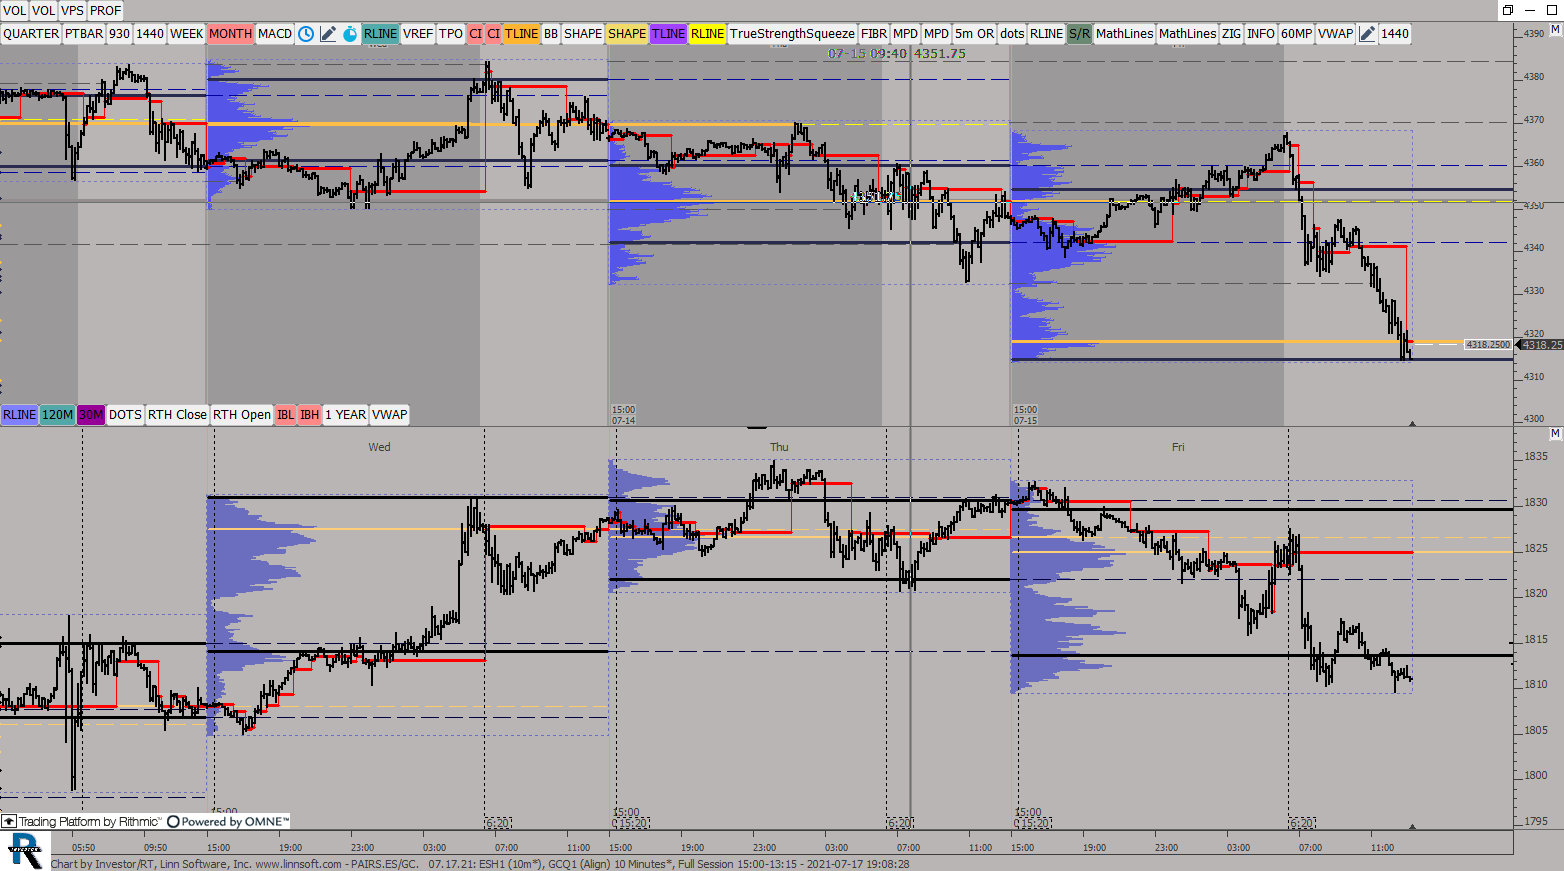 |
PAIRSES GC (ESH1) ES42 [totalcount]
4 years 5 months ago
This chart was uploaded by Investor/RT 14.2.6 showing symbol: ESH1. |
View |
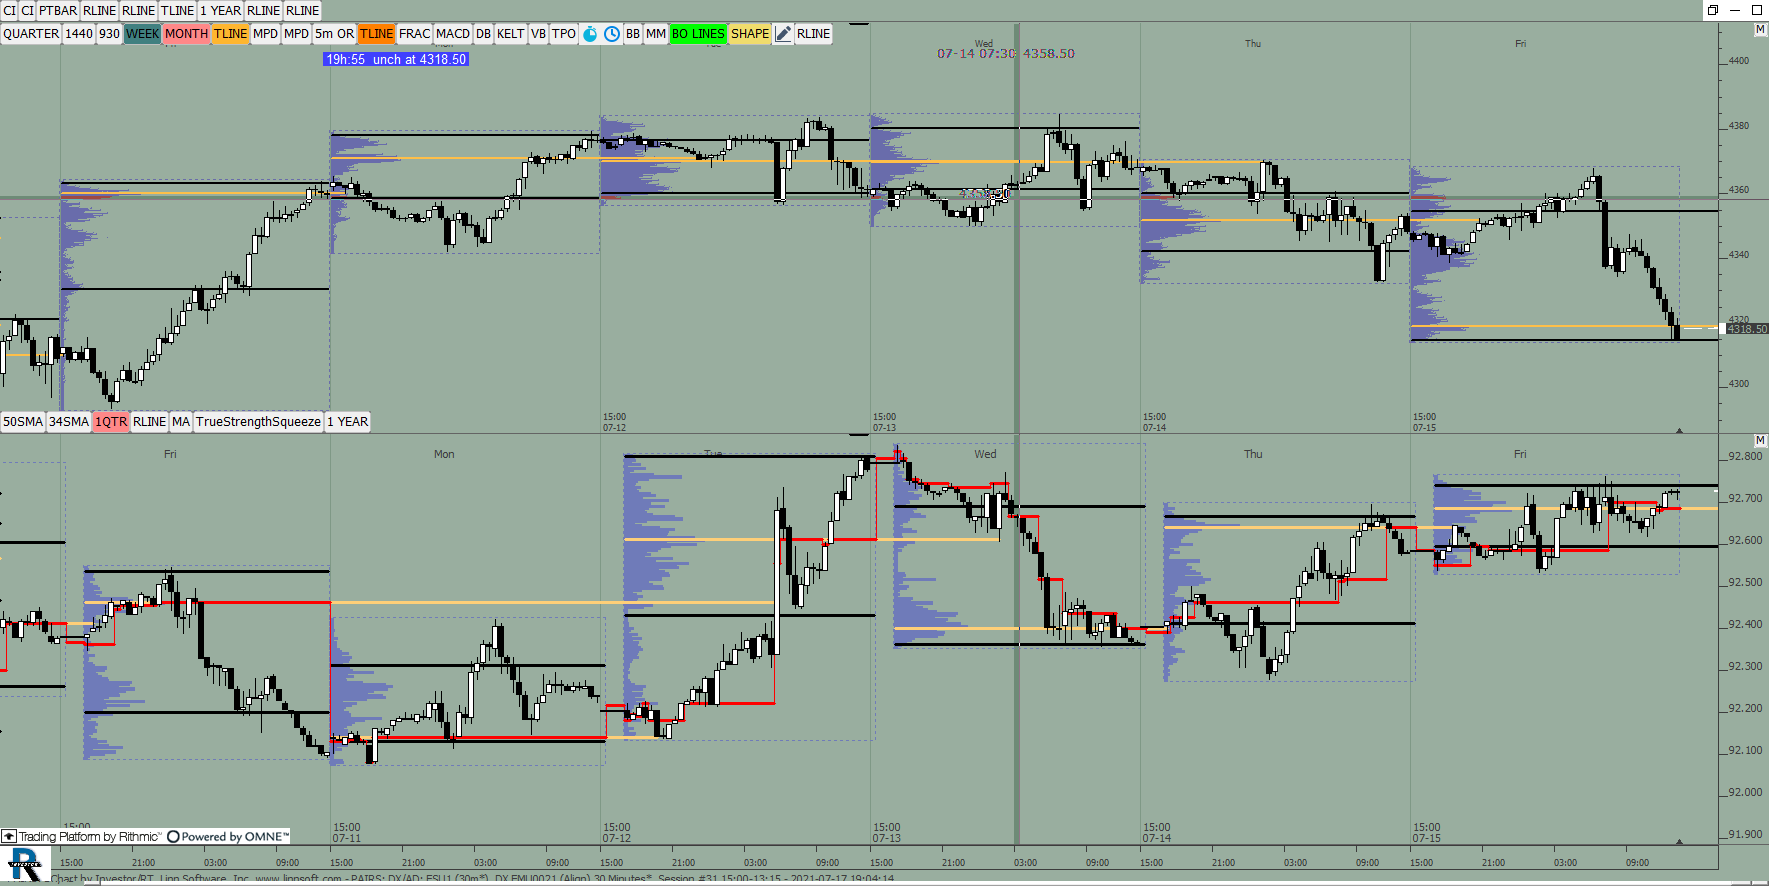 |
PAIRS DX AD (ESU1) ES42 [totalcount]
4 years 5 months ago
This chart was uploaded by Investor/RT 14.2.6 showing symbol: ESU1. |
View |
 |
PAIRSES NQ (ESU1) ES42 [totalcount]
4 years 5 months ago
This chart was uploaded by Investor/RT 14.2.6 showing symbol: ESU1. |
View |
 |
MP GLOBEXWEEKLYVALUE (ESU1) ES42 [totalcount]
4 years 5 months ago
This chart was uploaded by Investor/RT 14.2.6 showing symbol: ESU1. |
View |
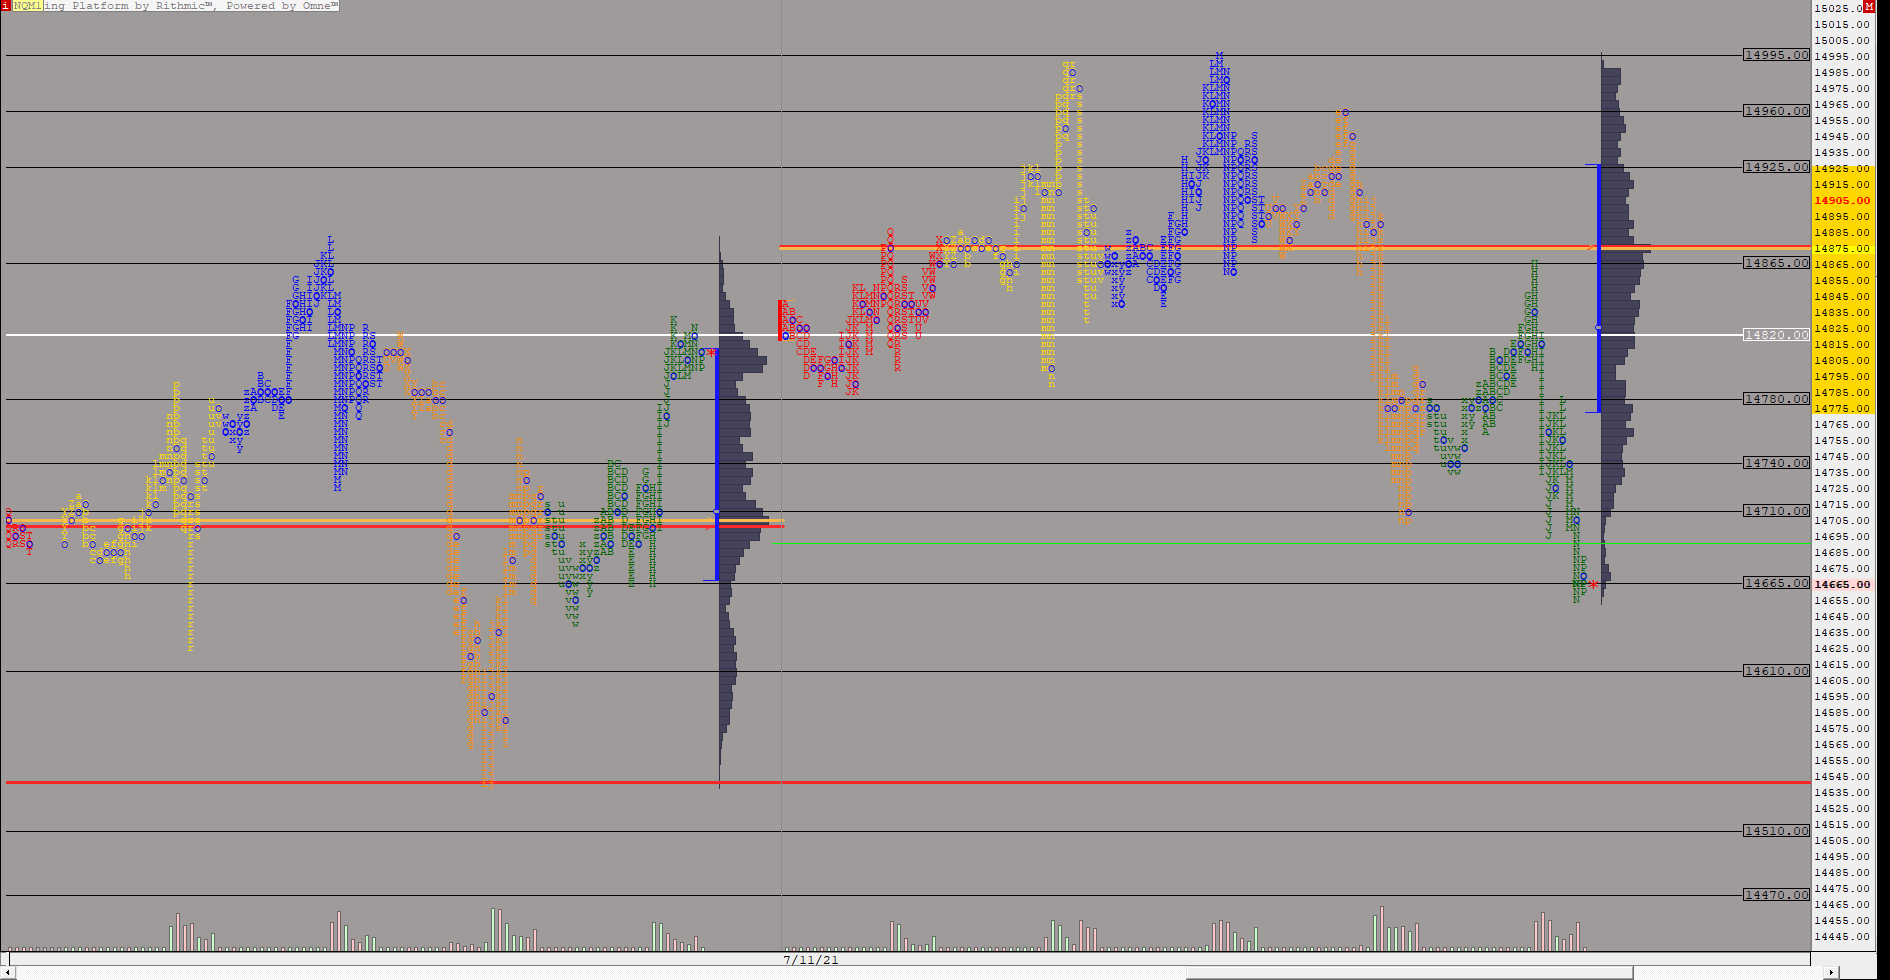 |
NQTPOWEEKLY (NQM1) ES42 [totalcount]
4 years 5 months ago
This chart was uploaded by Investor/RT 14.2.6 showing symbol: NQM1. |
View |
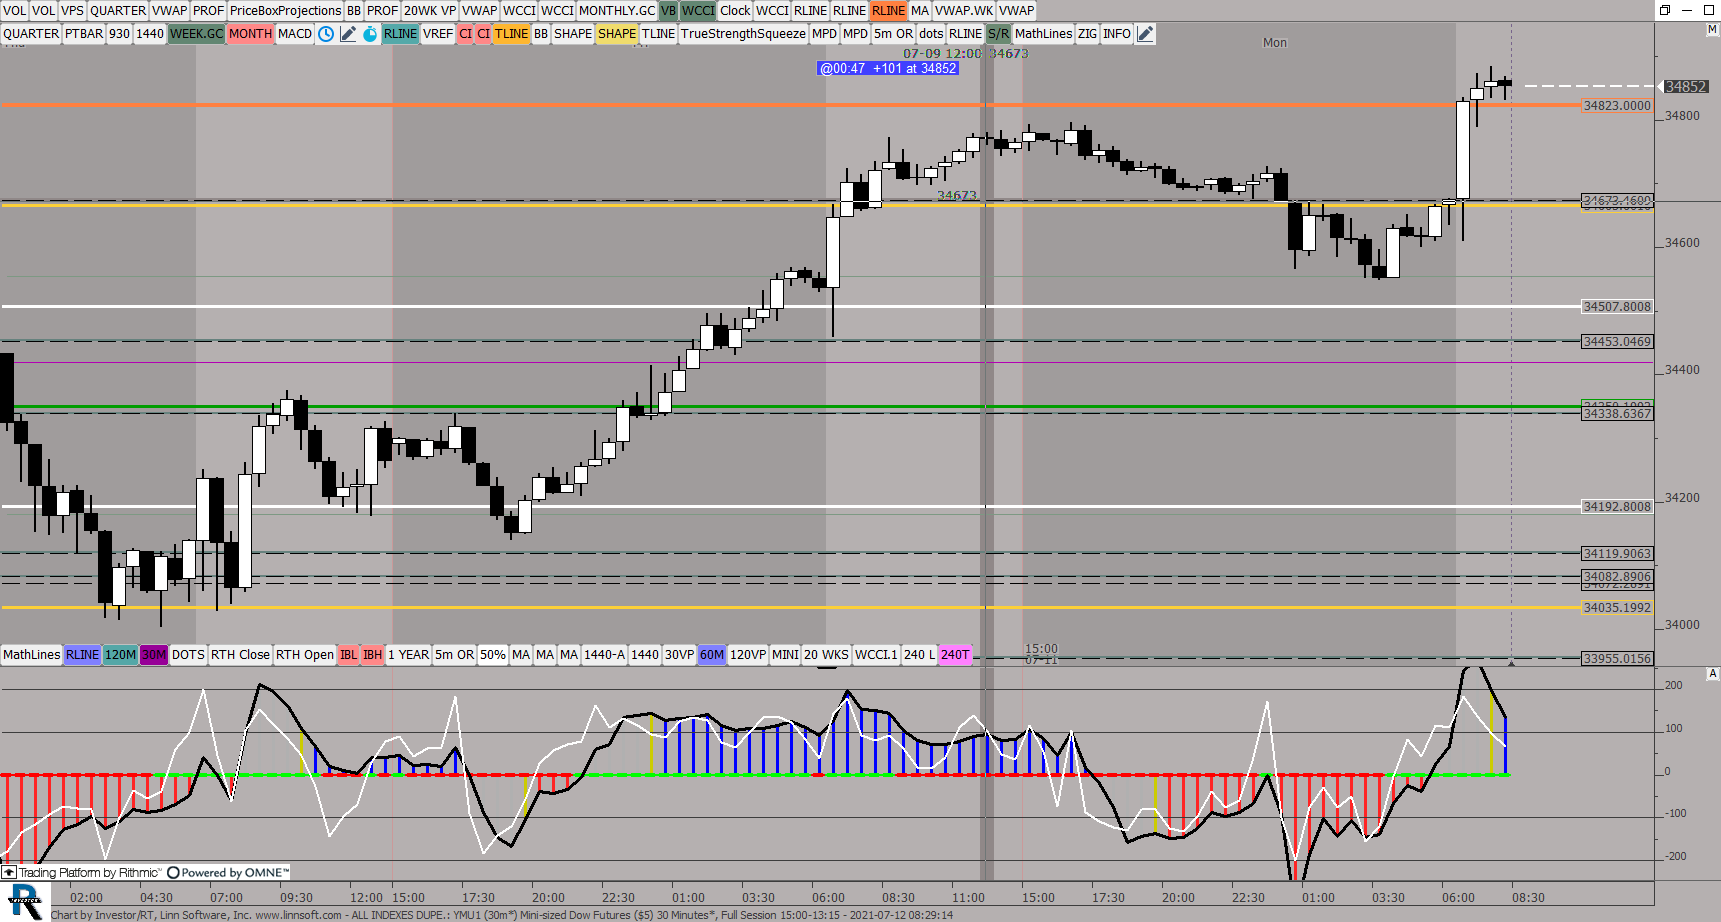 |
ALL INDEXES DUPE (YMU1) ES42 [totalcount]
4 years 5 months ago
This chart was uploaded by Investor/RT 14.2.6 showing symbol: YMU1. |
View |
 |
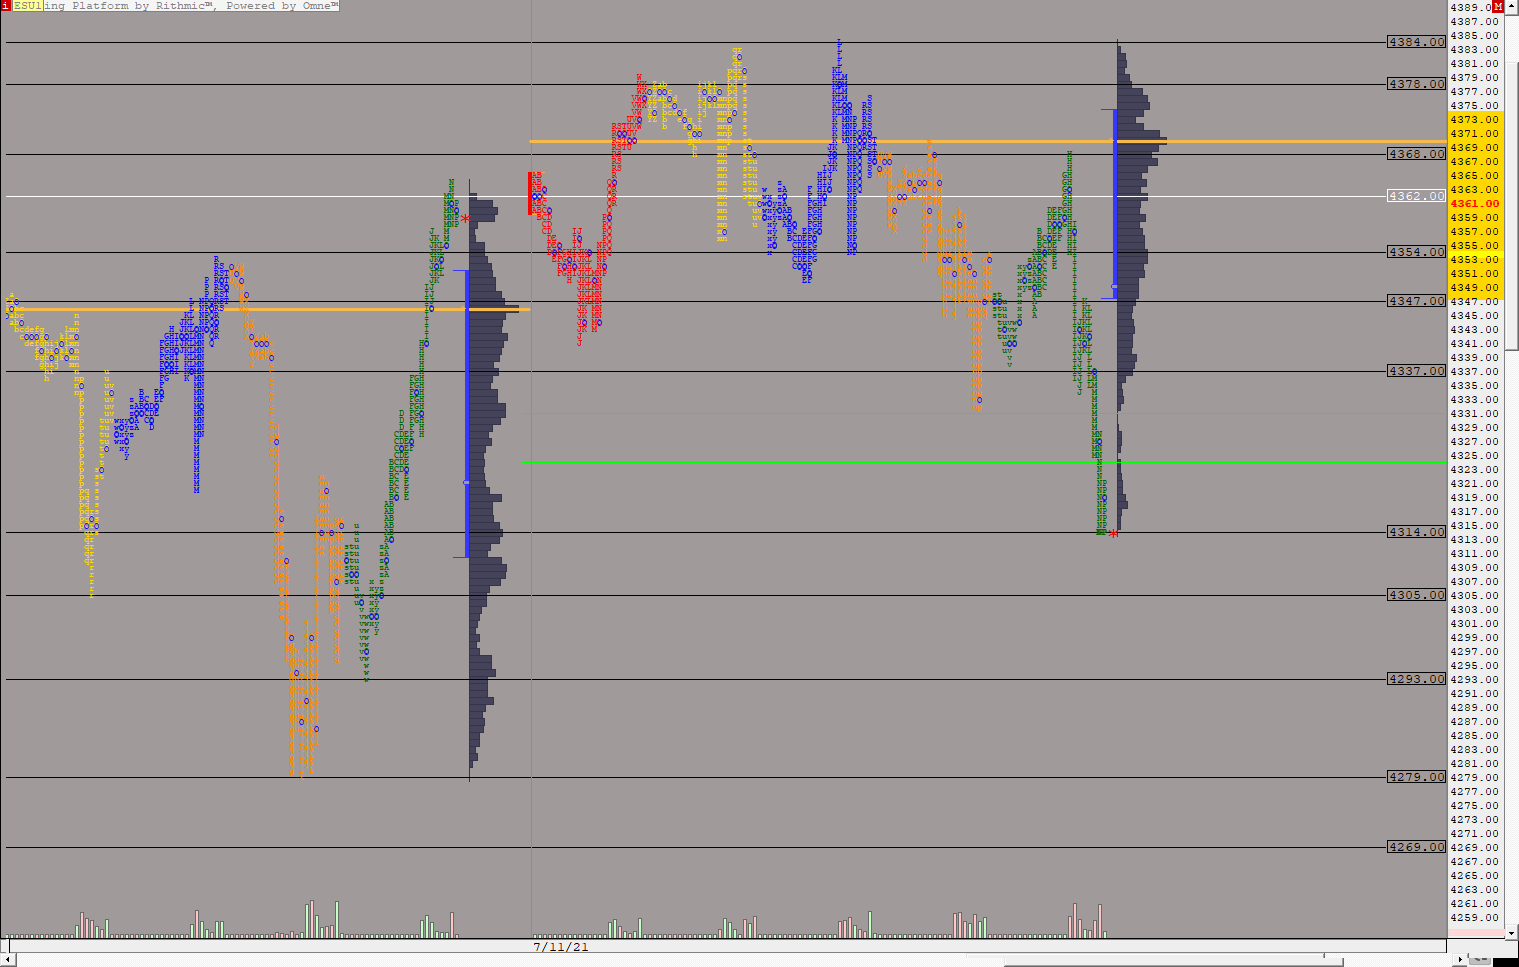
ESTPO (ESU1) ES42 [totalcount]
4 years 5 months ago
Measured Move. This chart was uploaded by Investor/RT 14.2.6 showing symbol: ESU1. |
View |
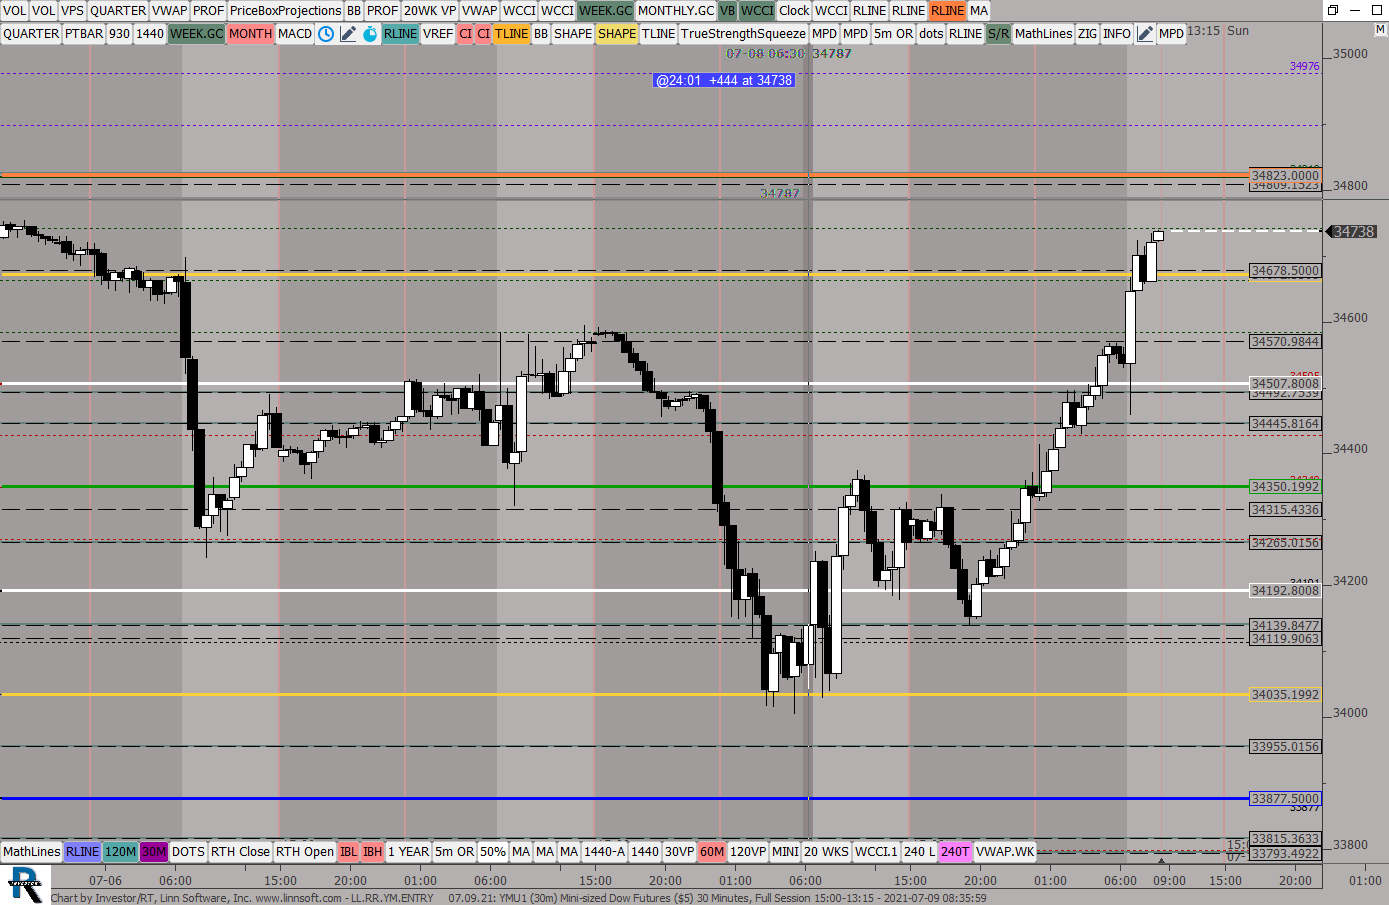 |
LLRRYMENTRY (YMU1) ES42 [totalcount]
4 years 5 months ago
This chart was uploaded by Investor/RT 14.2.6 showing symbol: YMU1. |
View |
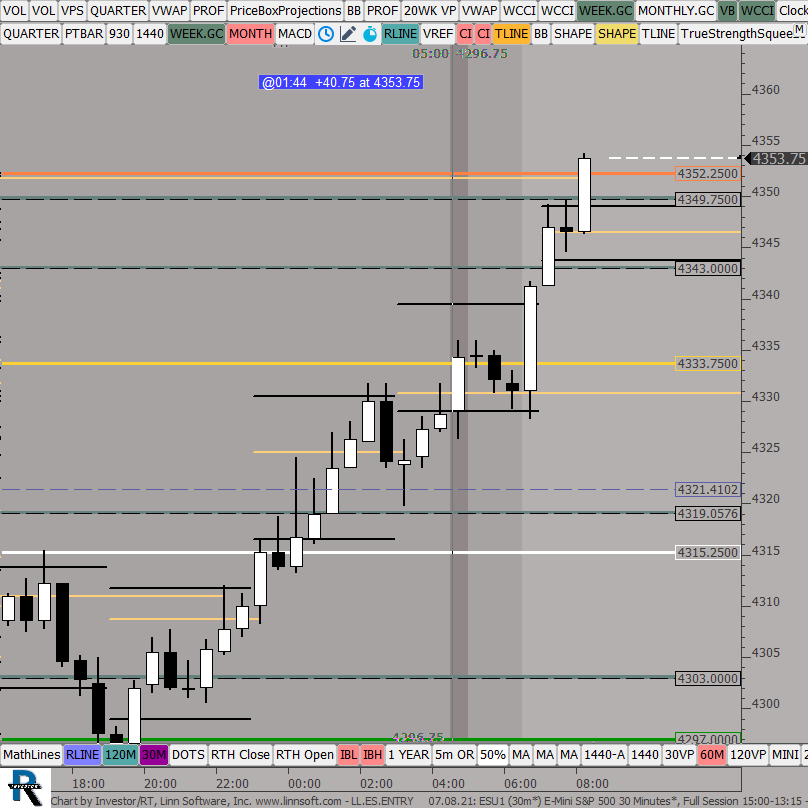 |
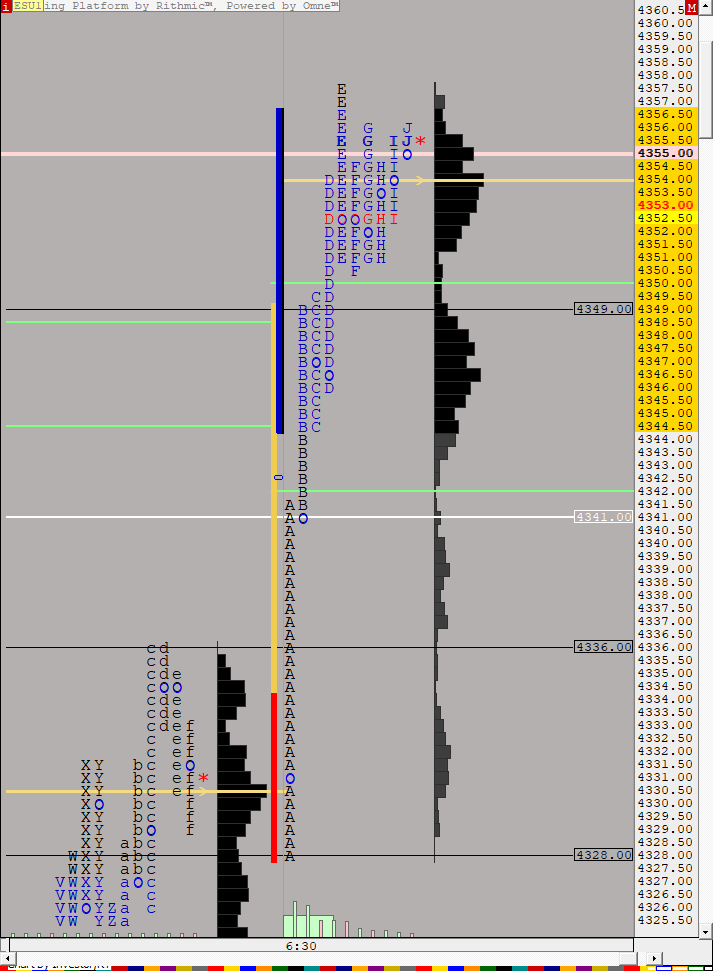
LLESENTRY (ESU1) ES42 [totalcount]
4 years 5 months ago
This chart was uploaded by Investor/RT 14.2.6 showing symbol: ESU1. |
View |
 |
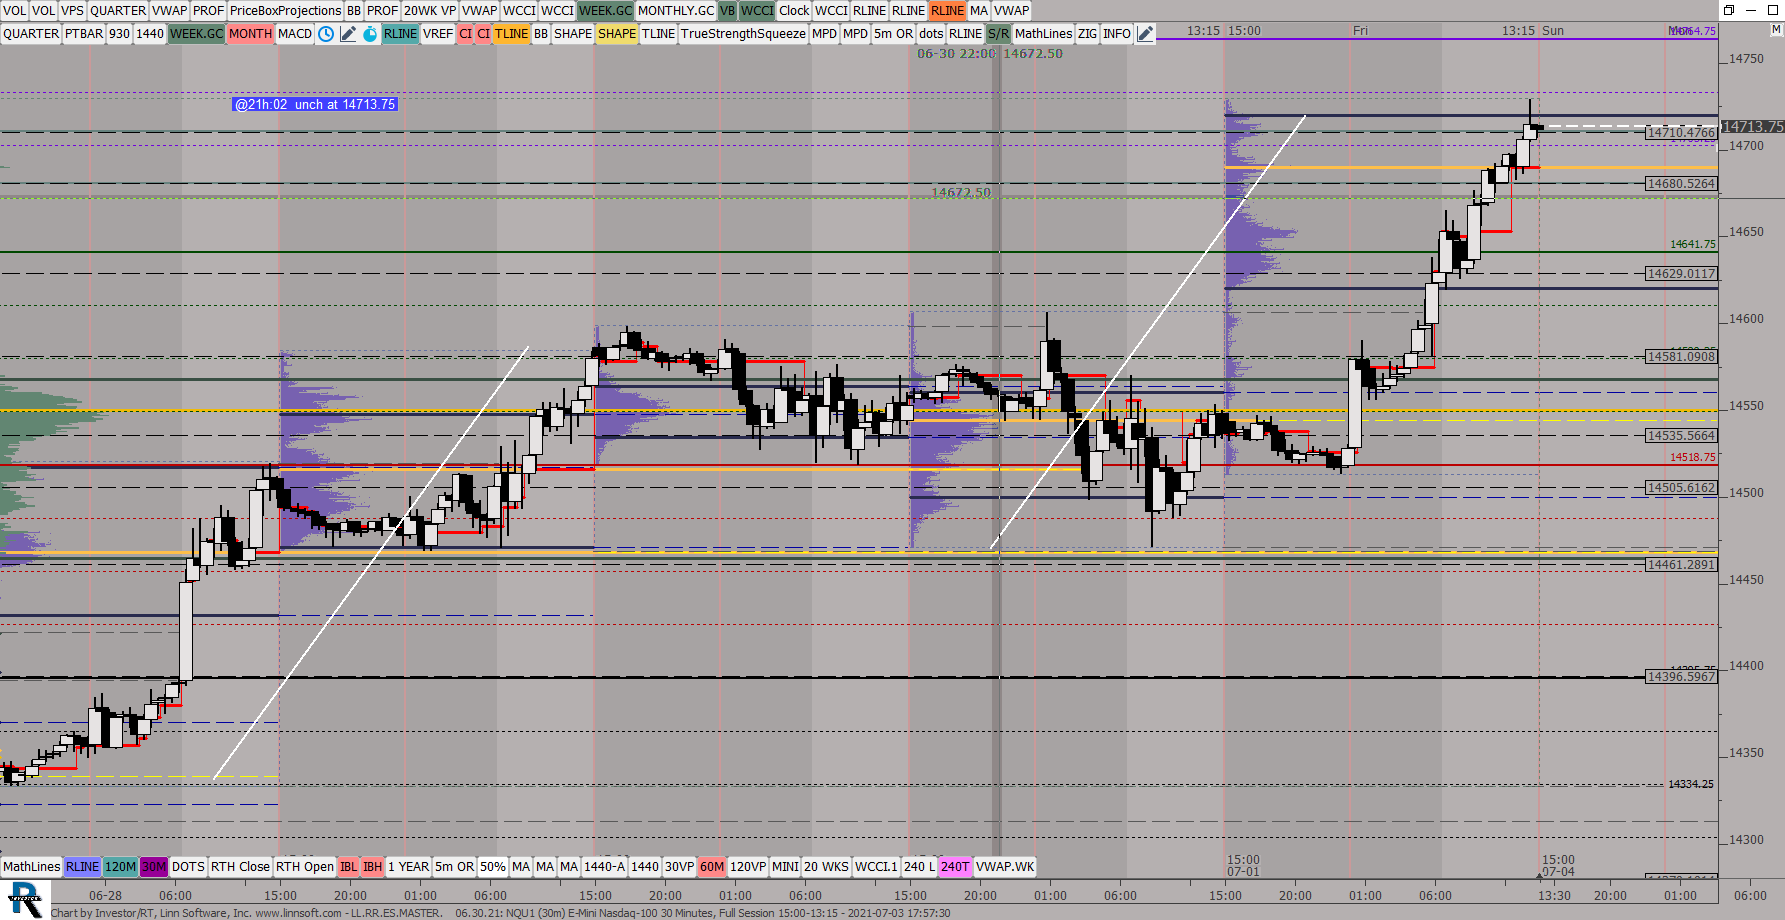
RRESMASTER (NQU1) ES42 [totalcount]
4 years 5 months ago
This chart was uploaded by Investor/RT 14.2.6 showing symbol: NQU1. |
View |
 |
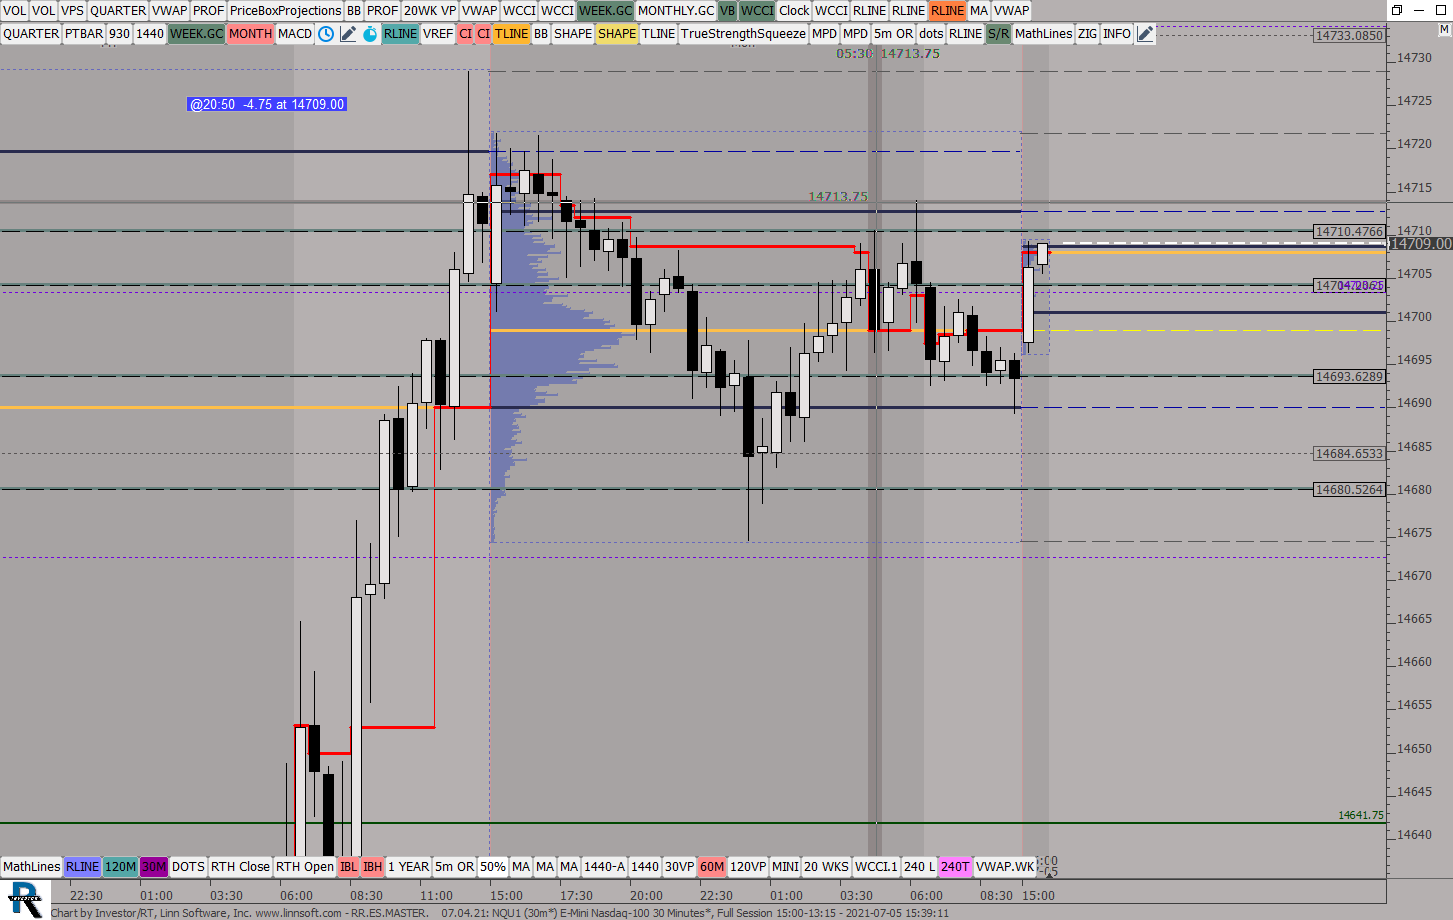
LLRRESMASTER (NQU1) ES42 [totalcount]
4 years 5 months ago
This chart was uploaded by Investor/RT 14.2.6 showing symbol: NQU1. |
View |
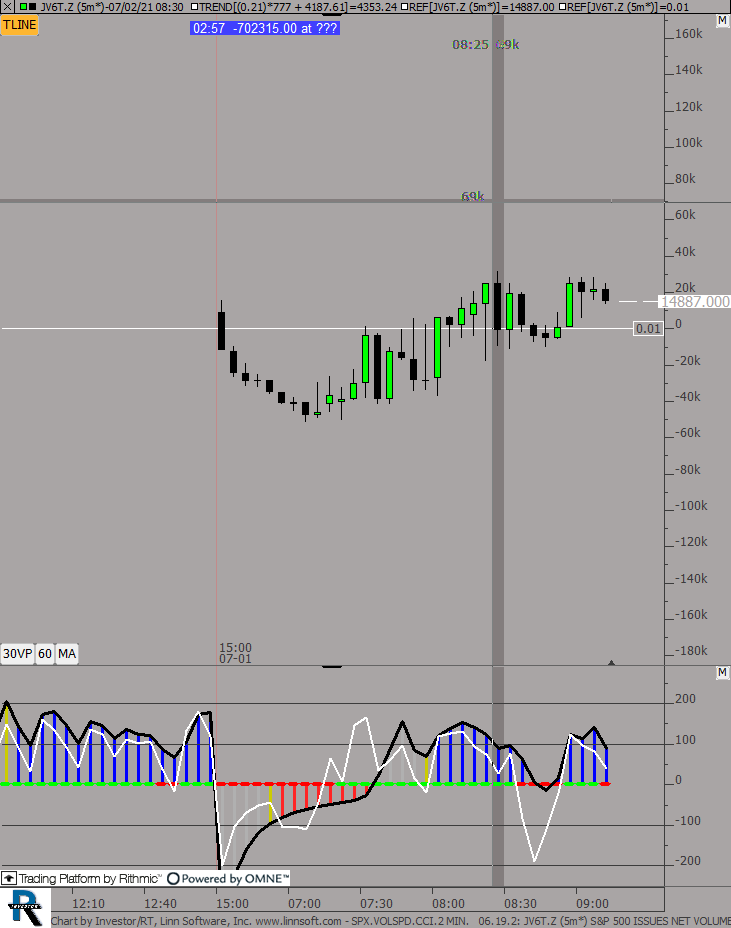 |
SPXVOLSPDCCI2 MIN (JV6T.Z) ES42 [totalcount]
4 years 5 months ago
This chart was uploaded by Investor/RT 14.2.6 showing symbol: JV6T.Z. |
View |
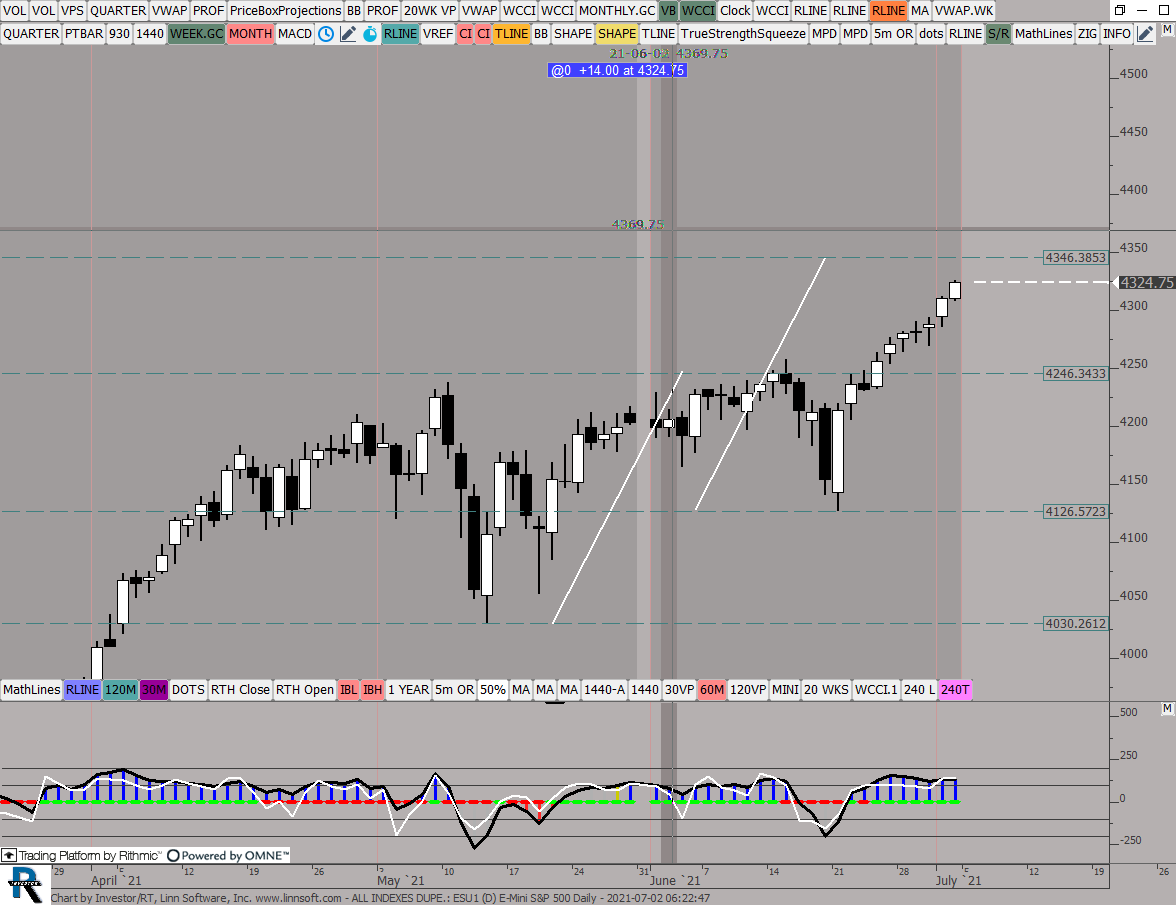 |
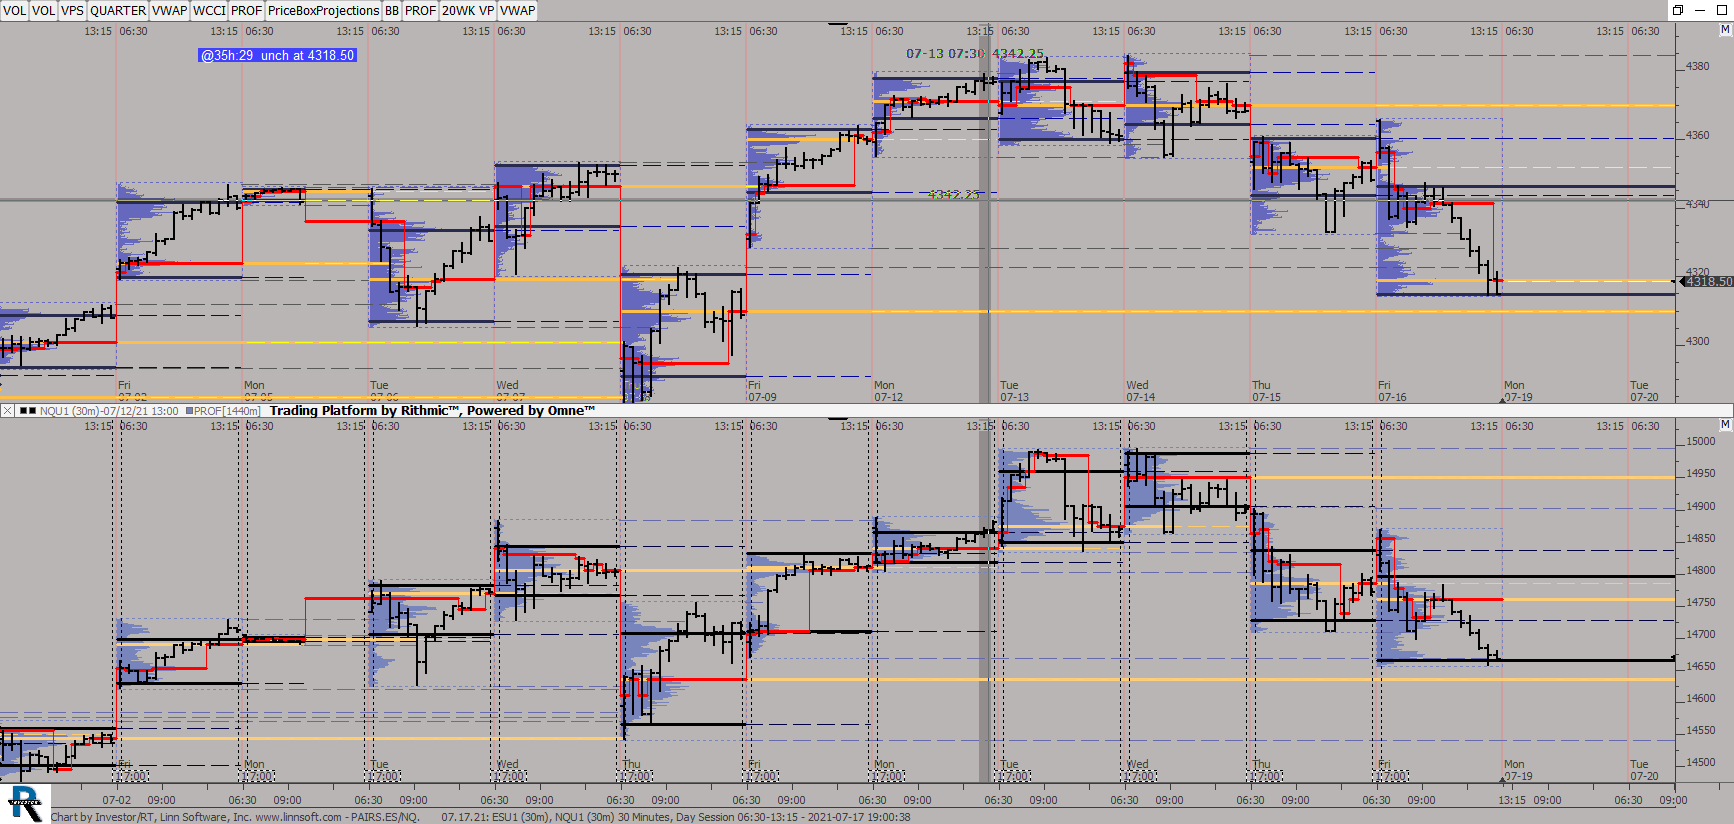
ALL INDEXES DUPE (ESU1) ES42 [totalcount]
4 years 5 months ago
This chart was uploaded by Investor/RT 14.2.6 showing symbol: ESU1. |
View |
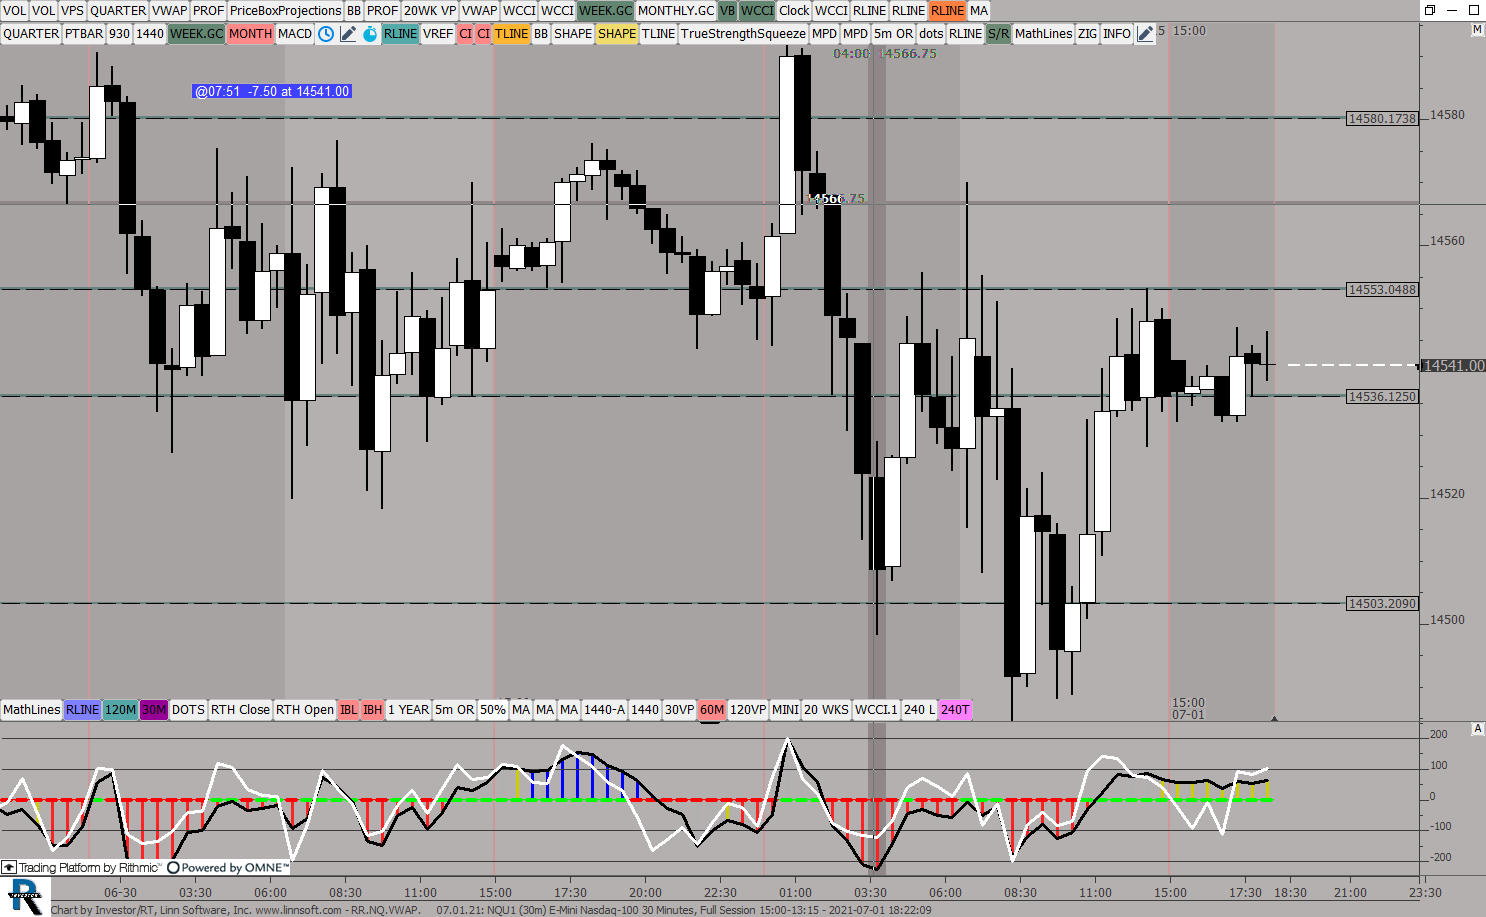 |
RRNQVWAP (NQU1) ES42 [totalcount]
4 years 5 months ago
This chart was uploaded by Investor/RT 14.2.6 showing symbol: NQU1. |
View |
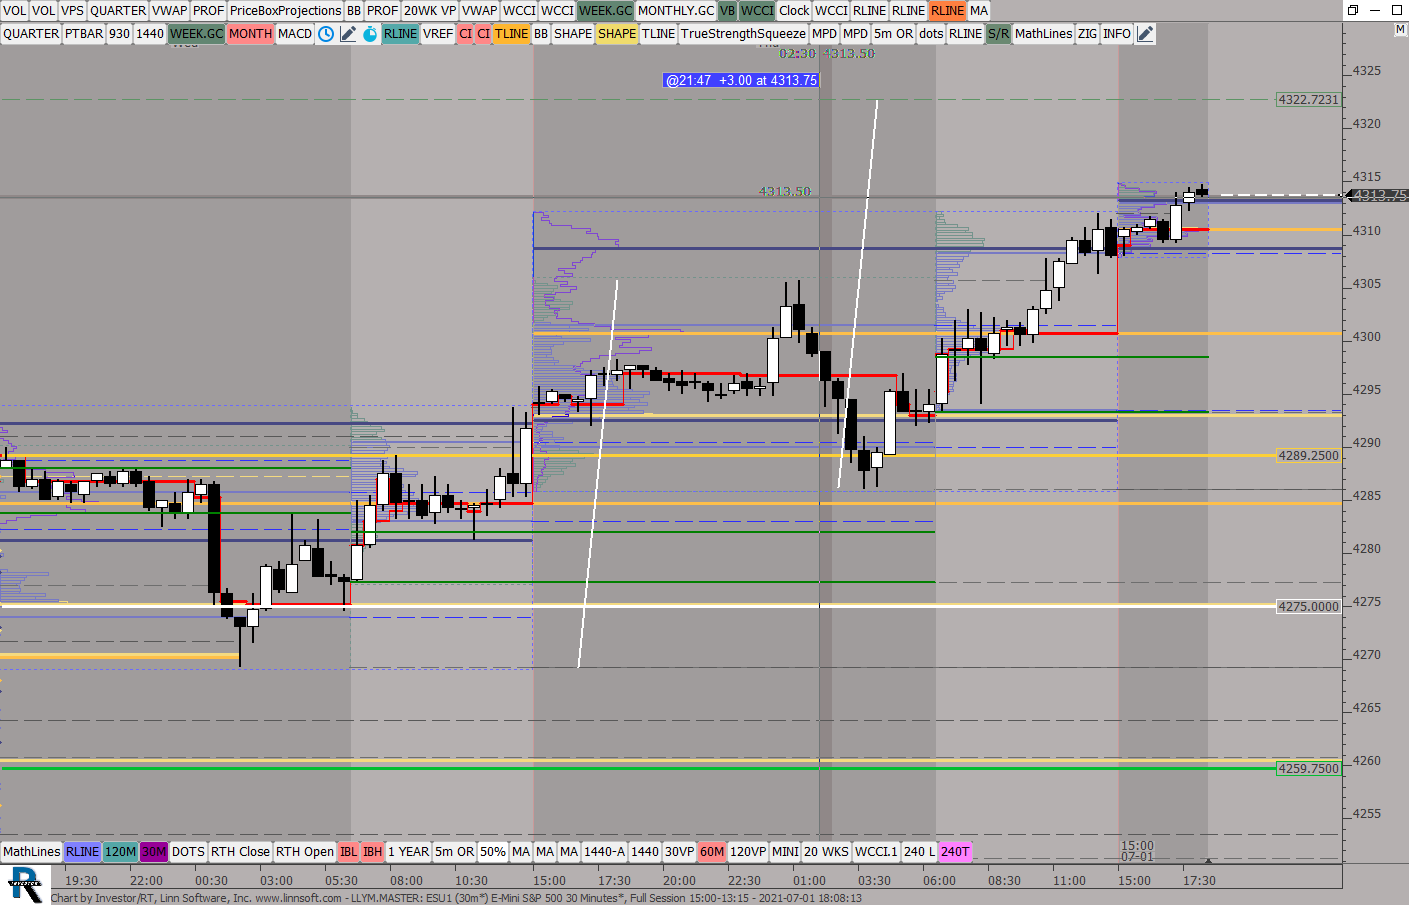 |
LLYMMASTER (ESU1) ES42 [totalcount]
4 years 5 months ago
This chart was uploaded by Investor/RT 14.2.6 showing symbol: ESU1. |
View |
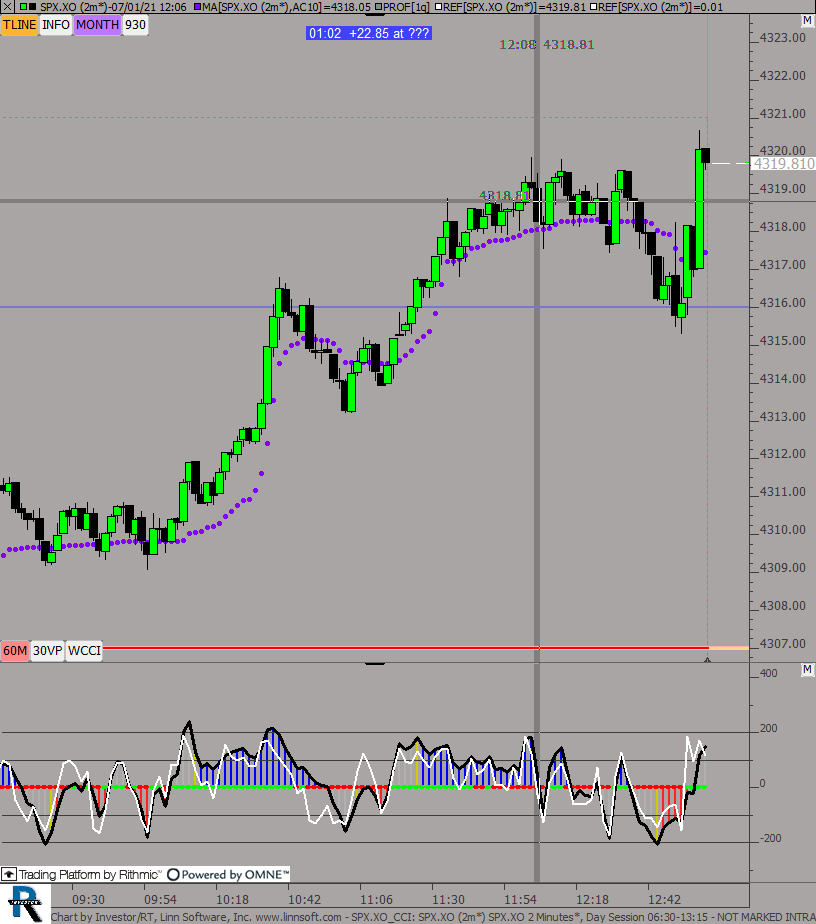 |
SPXXO CCI (SPX.XO) ES42 [totalcount]
4 years 5 months ago
This chart was uploaded by Investor/RT 14.2.6 showing symbol: SPX.XO. |
View |
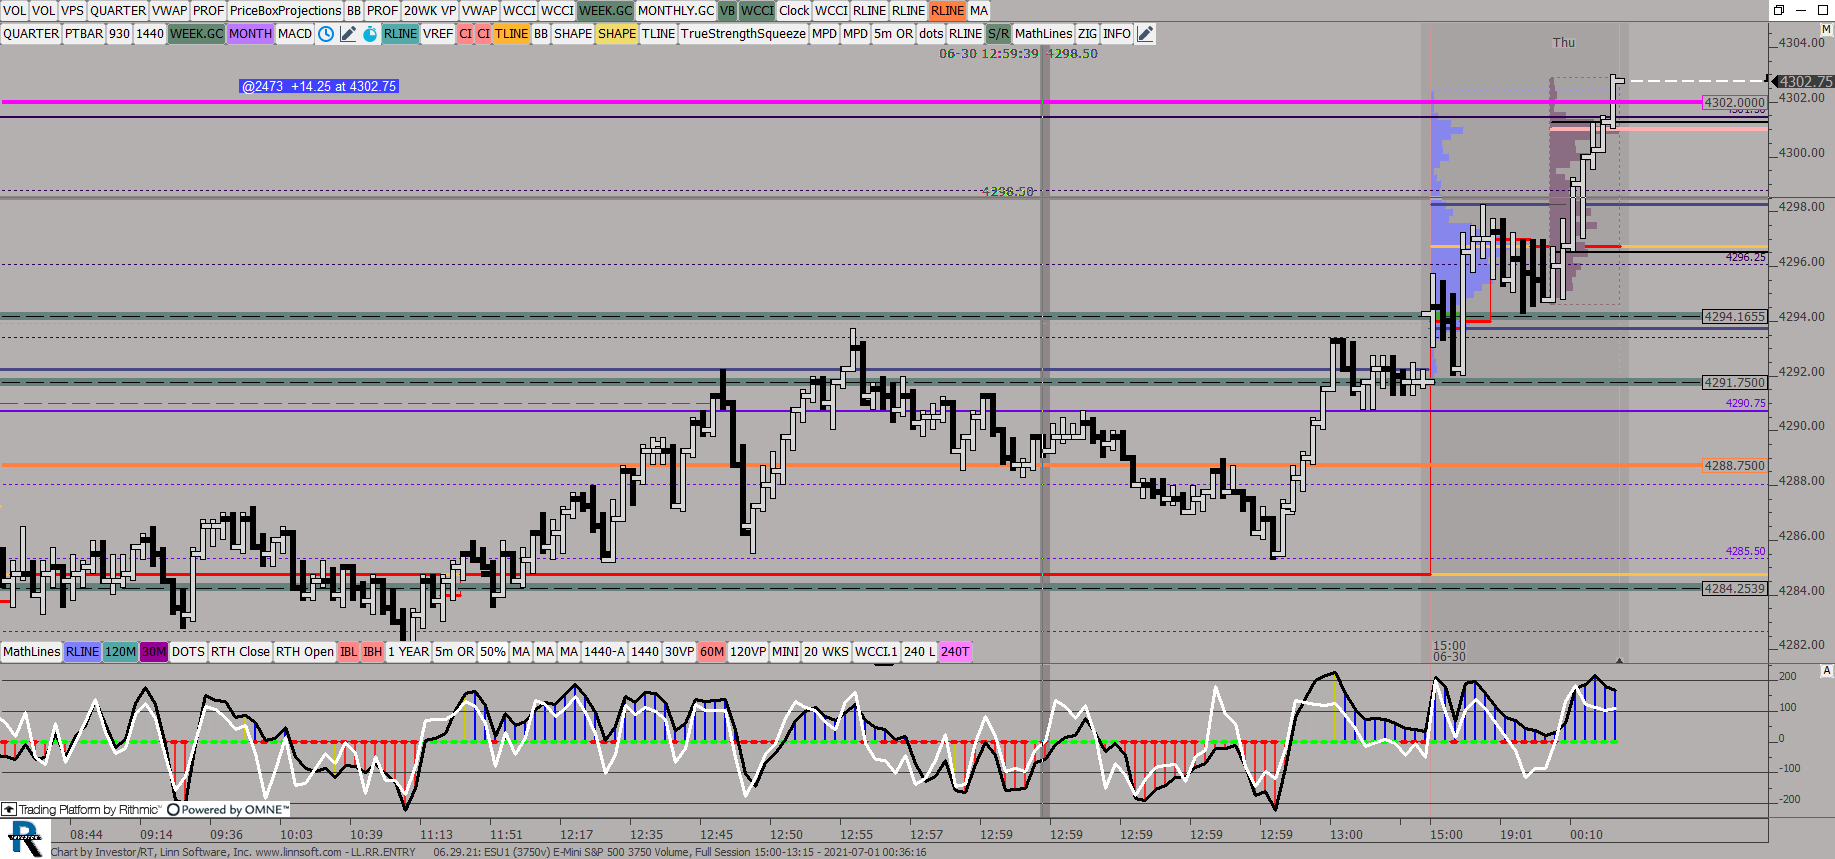 |
LLRRENTRY (ESU1) ES42 [totalcount]
4 years 5 months ago
This chart was uploaded by Investor/RT 14.2.6 showing symbol: ESU1. |
View |
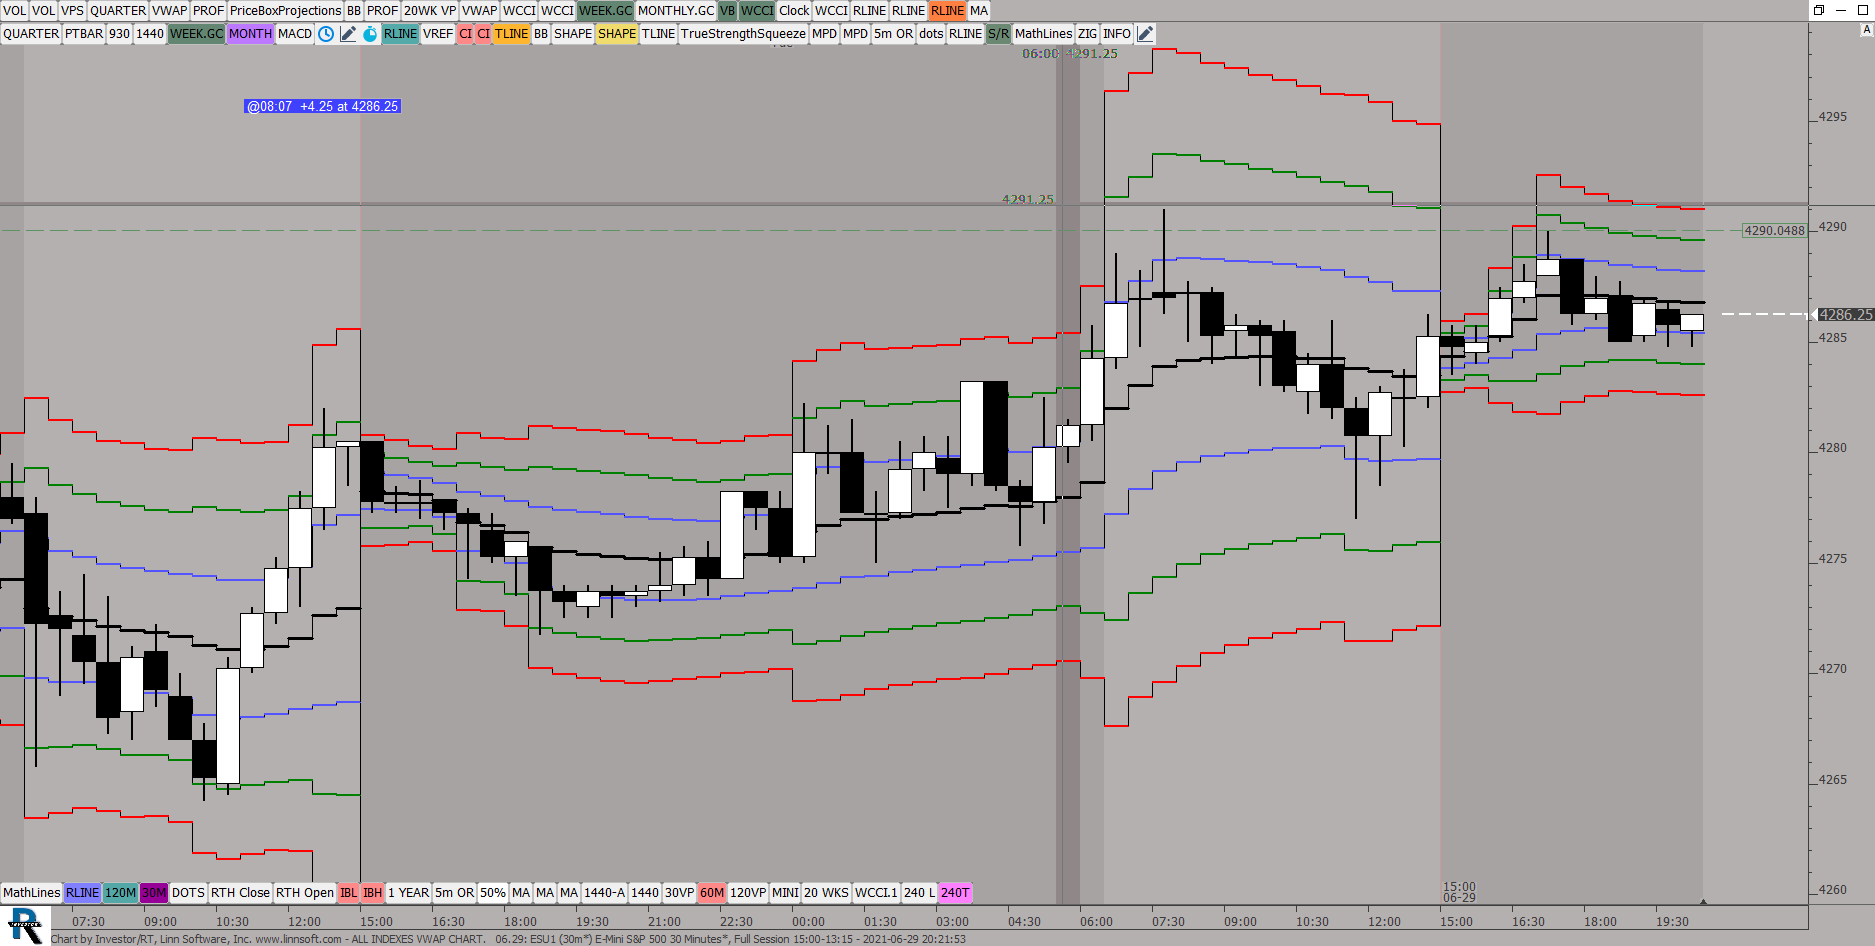 |
ALL INDEXES VWAP CHART (ESU1) ES42 [totalcount]
4 years 5 months ago
This chart was uploaded by Investor/RT 14.2.6 showing symbol: ESU1. |
View |
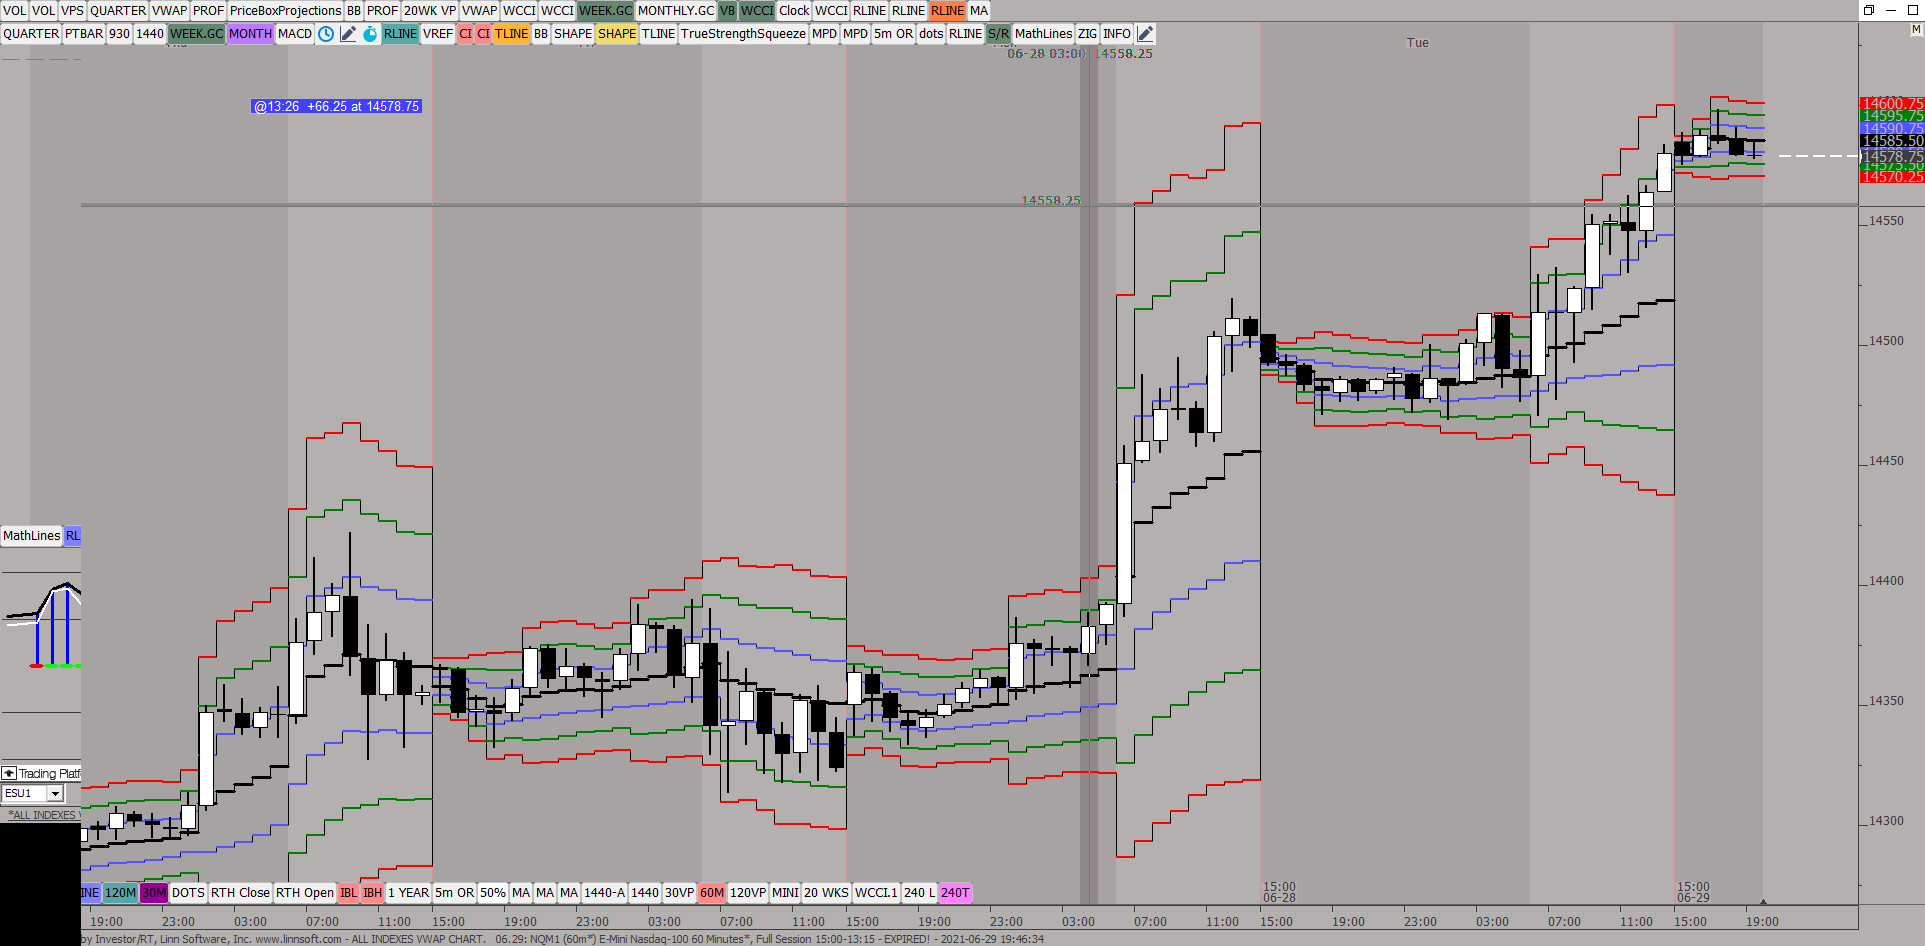 |
ALL INDEXES VWAP CHART (NQM1) ES42 [totalcount]
4 years 5 months ago
This chart was uploaded by Investor/RT 14.2.6 showing symbol: NQM1. |
View |
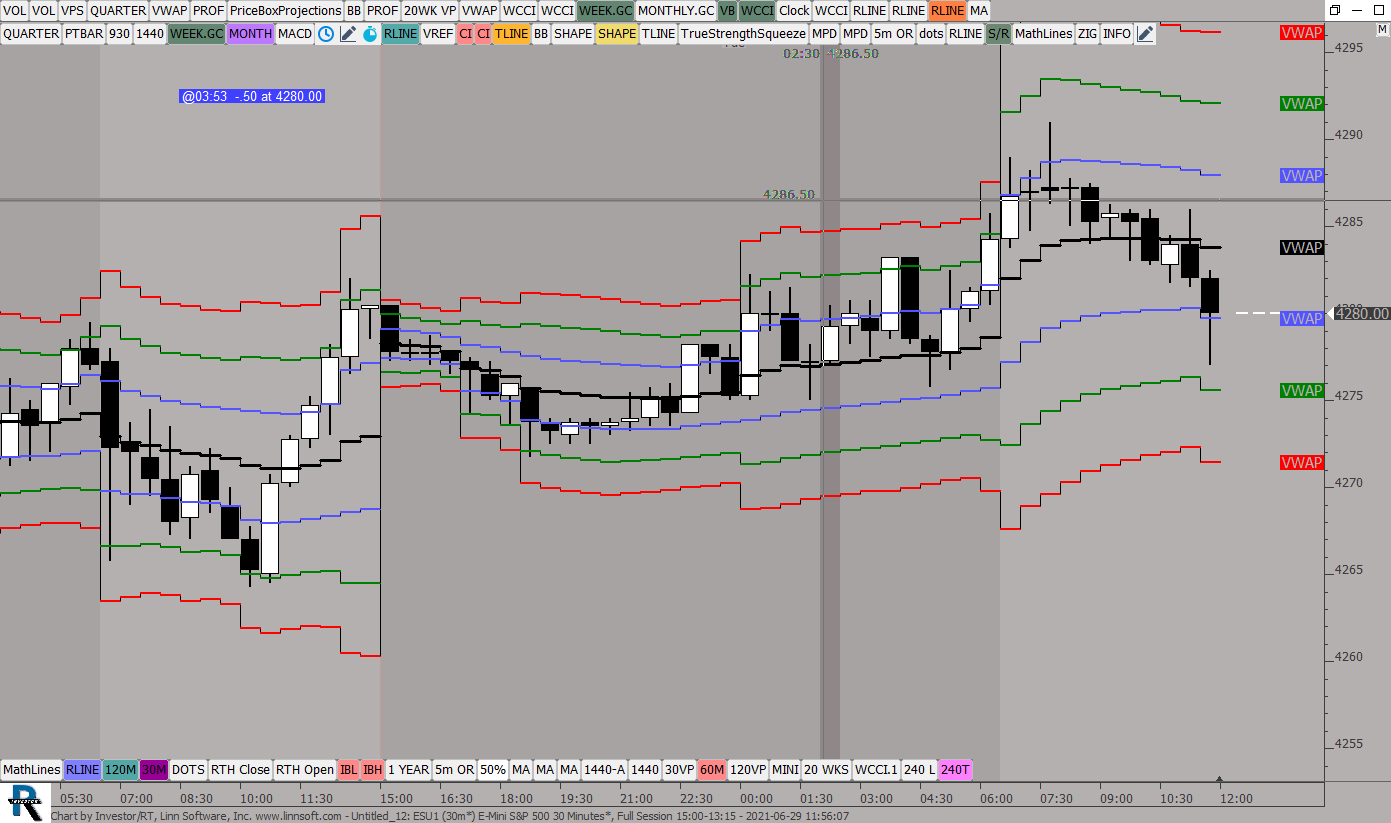 |
Untitled (ESU1) ES42 [totalcount]
4 years 5 months ago
This chart was uploaded by Investor/RT 14.2.6 showing symbol: ESU1. |
View |
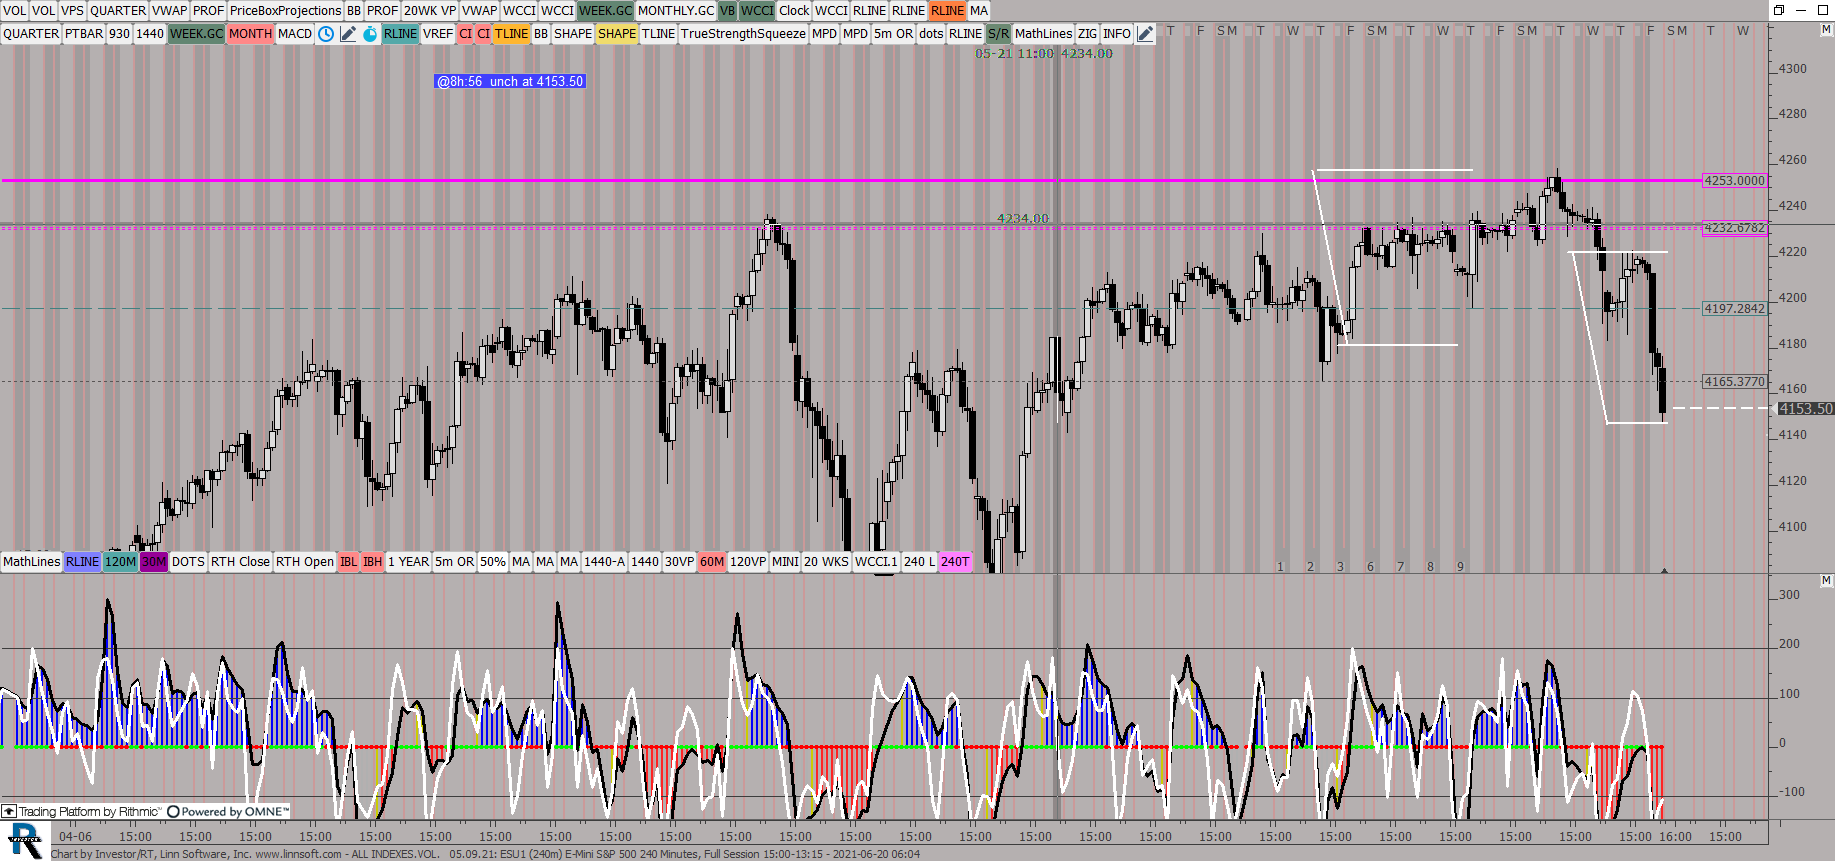 |
ALL INDEXESVOL (ESU1) ES42 [totalcount]
4 years 6 months ago
Measured Move. This chart was uploaded by Investor/RT 14.2.6 showing symbol: ESU1. |
View |
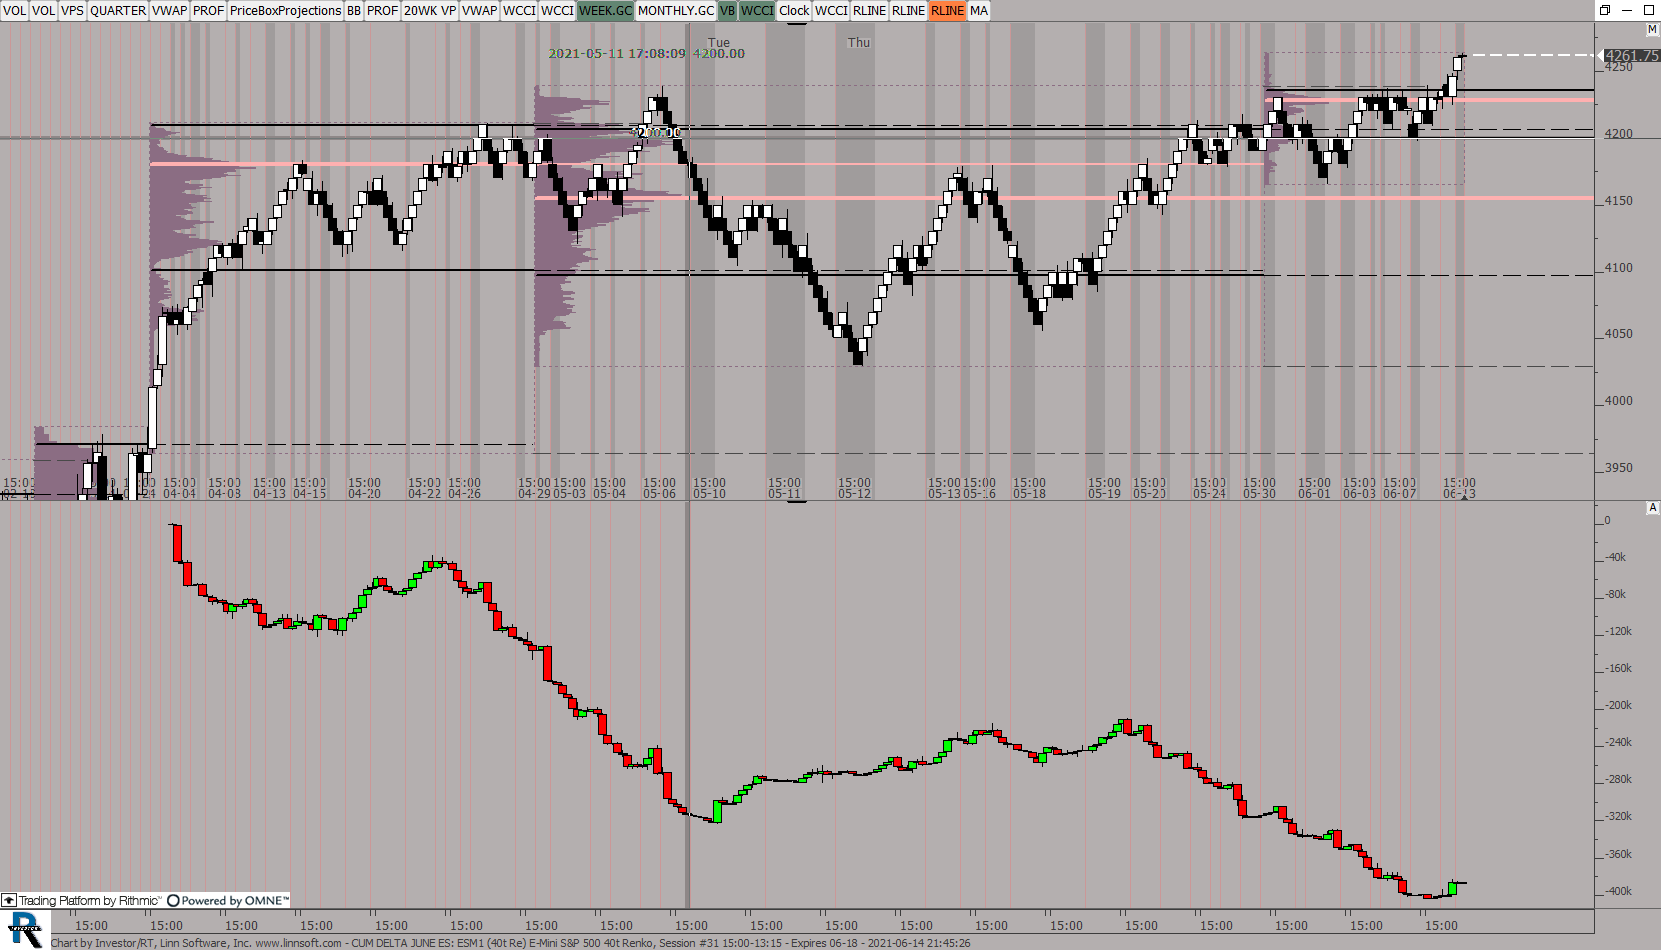 |
CUM DELTA JUNE ES (ESM1) ES42 [totalcount]
4 years 6 months ago
CUM DELTA JUNE CONTRACT. This chart was uploaded by Investor/RT 14.2.6 showing symbol: ESM1. |
View |
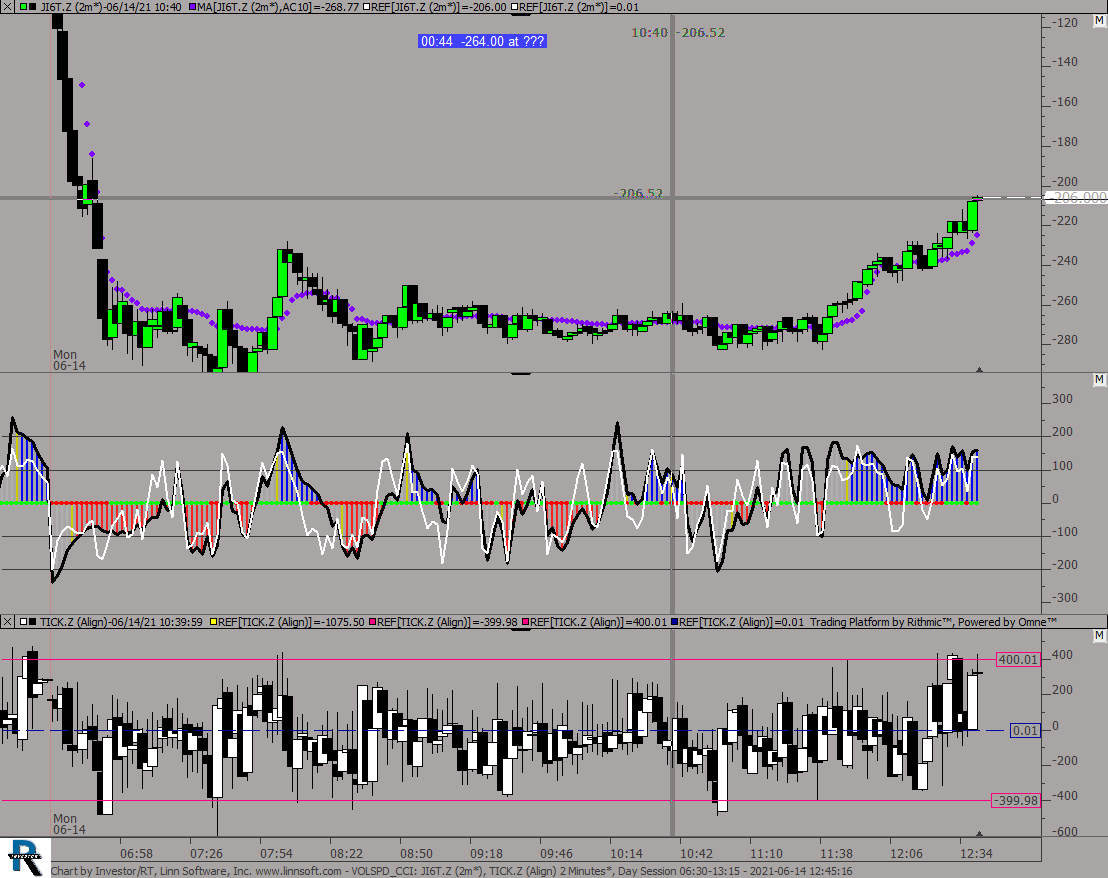 |
VOLSPD CCI (JI6T.Z) ES42 [totalcount]
4 years 6 months ago
This chart was uploaded by Investor/RT 14.2.5 showing symbol: JI6T.Z. |
View |