 |
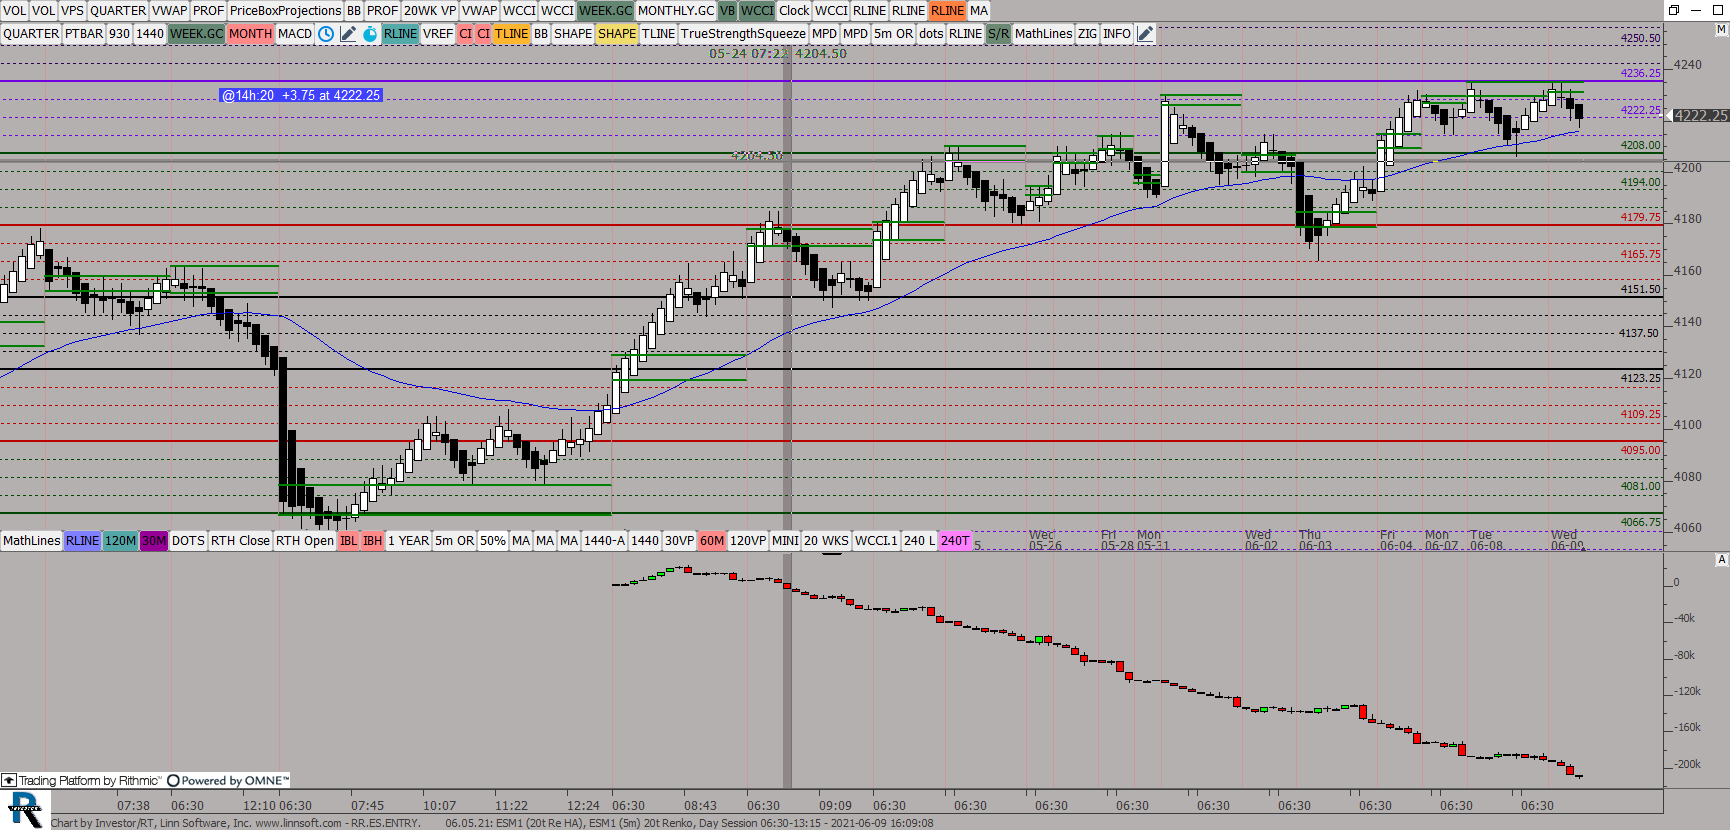
RRESENTRY (ESM1) ES42 [totalcount]
4 years 6 months ago
CUM Delta, June 2021Contract. This chart was uploaded by Investor/RT 14.2.6 showing symbol: ESM1. |
View |
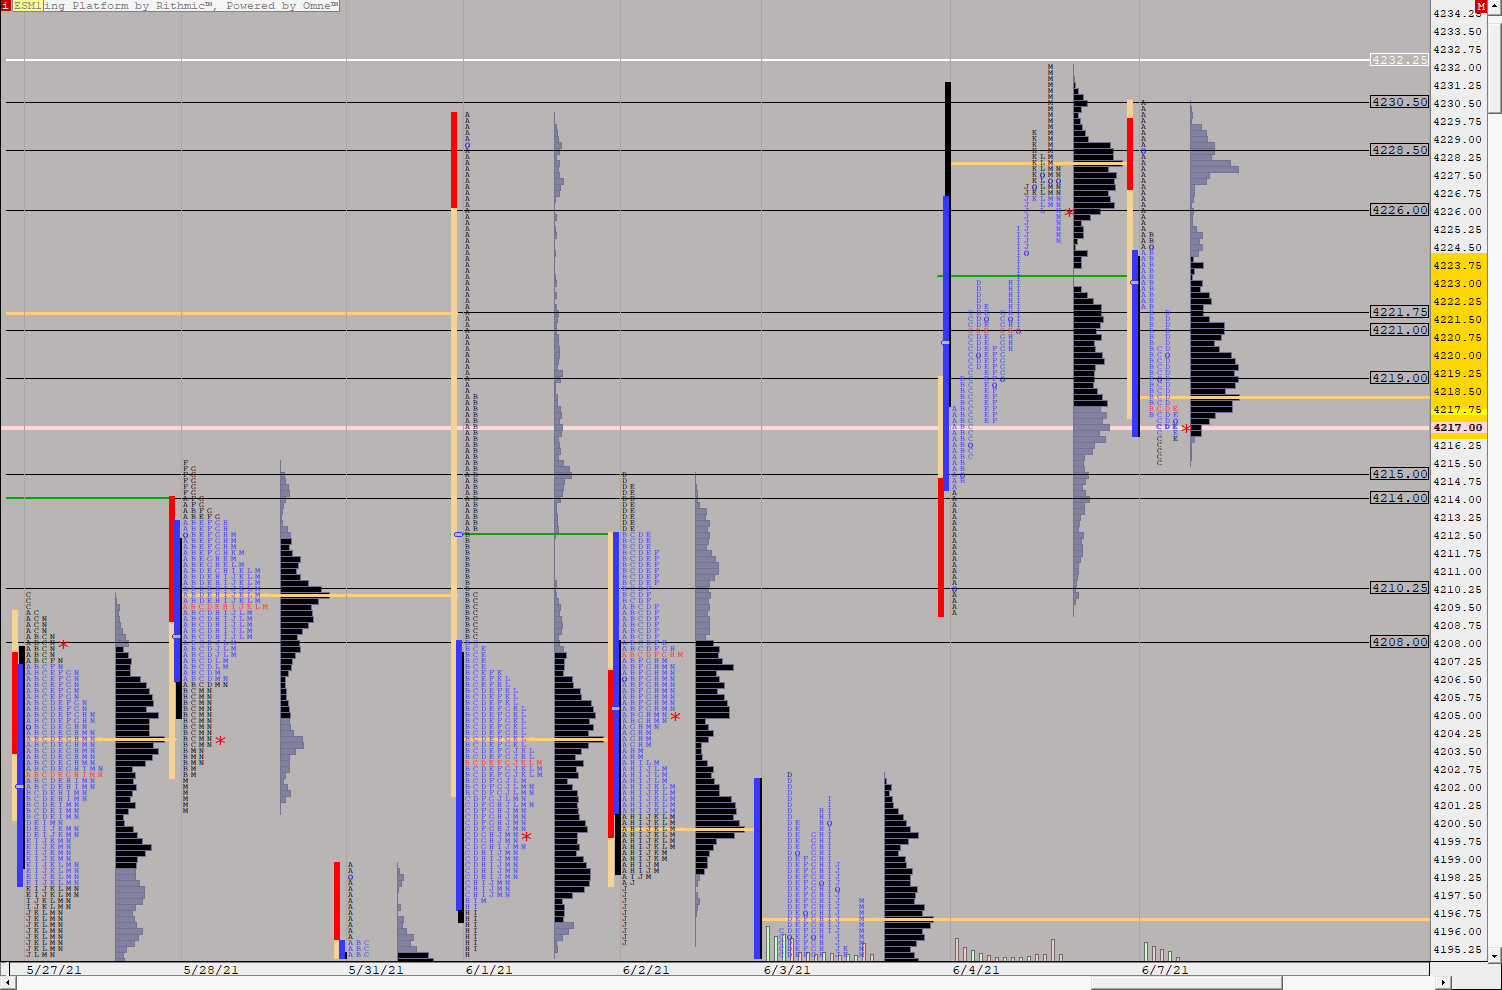 |
ESTPODaily (ESM1) ES42 [totalcount]
4 years 6 months ago
This chart was uploaded by Investor/RT 14.2.6 showing symbol: ESM1. |
View |
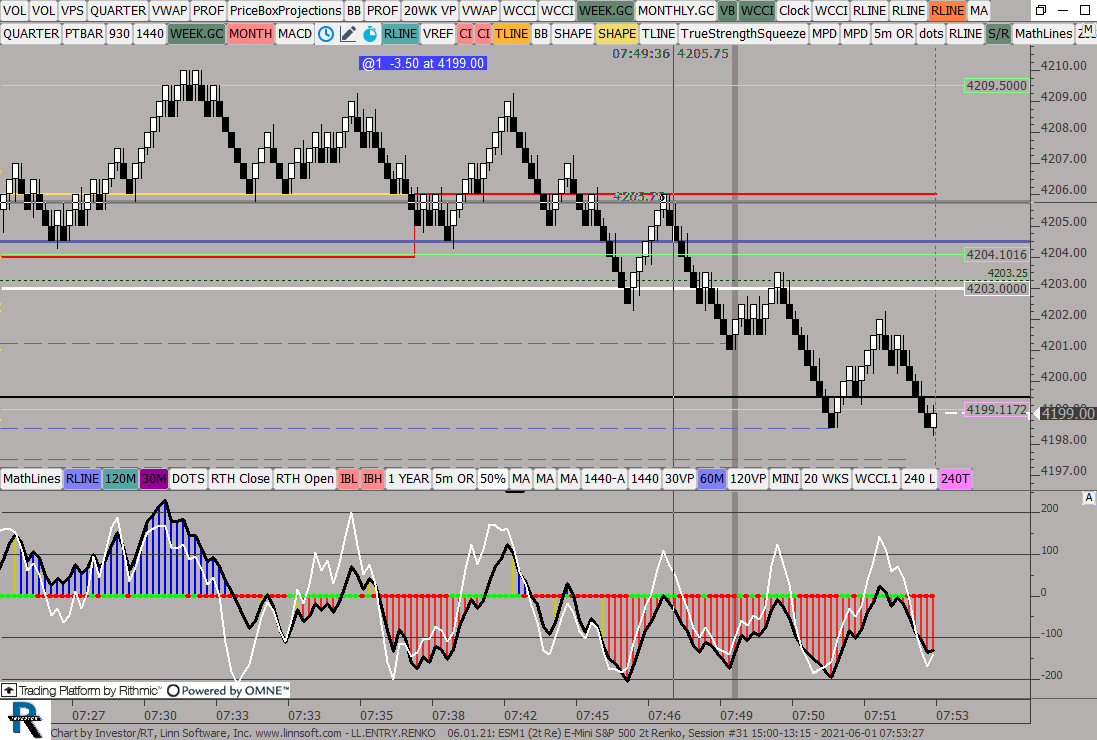 |
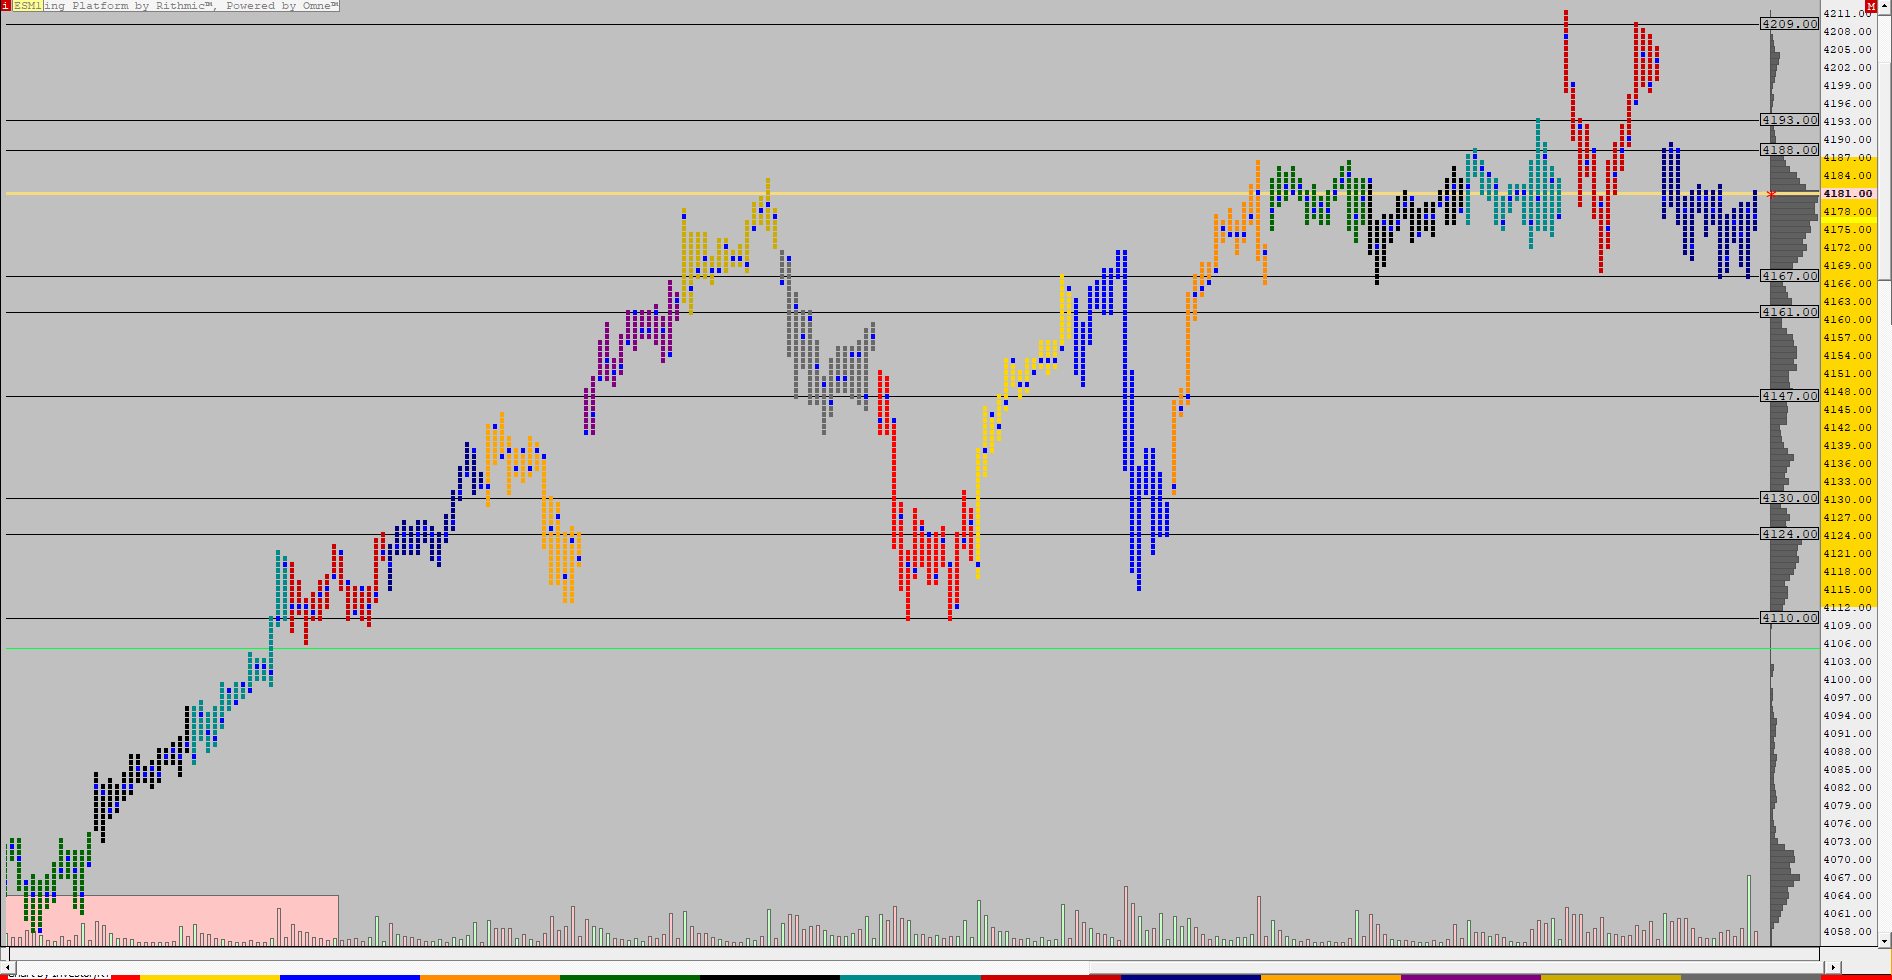
LLENTRYRENKO (ESM1) ES42 [totalcount]
4 years 6 months ago
This chart was uploaded by Investor/RT 14.2.6 showing symbol: ESM1. |
View |
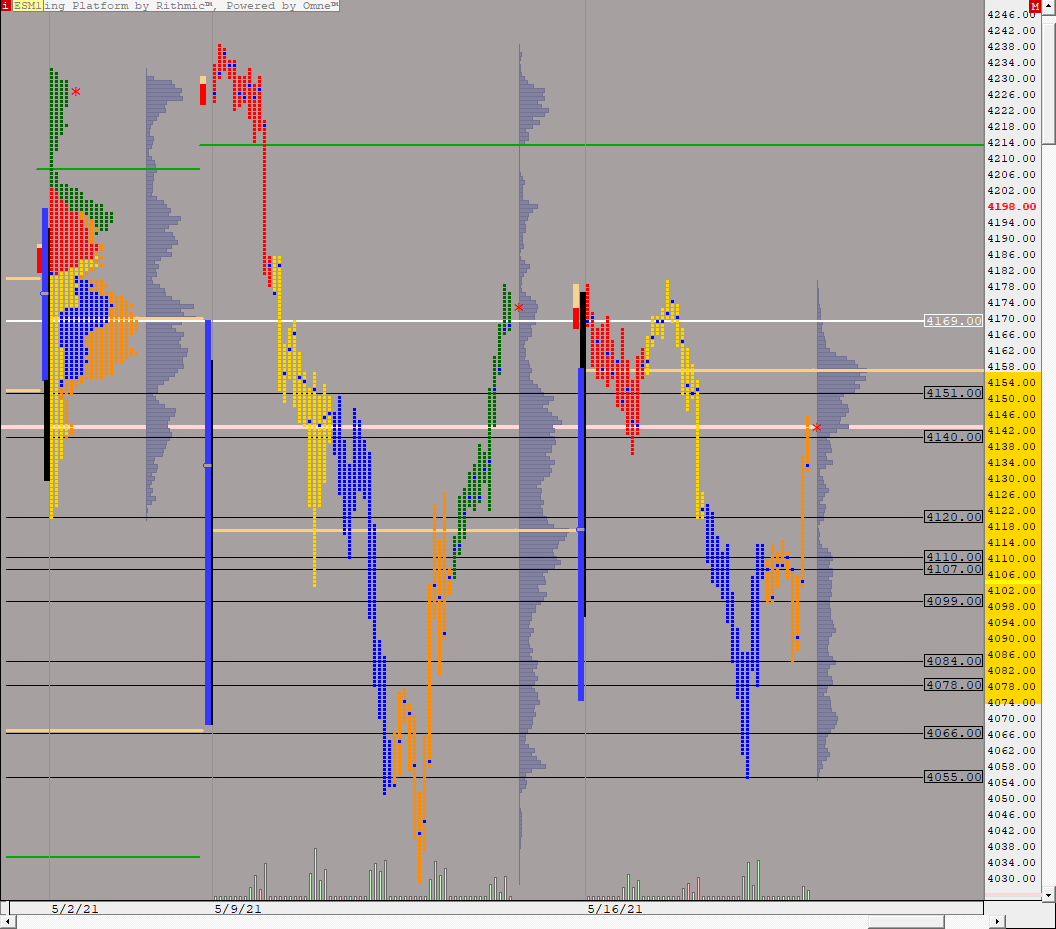 |
24H TPO Chart (ESM1) ES42 [totalcount]
4 years 7 months ago
This chart was uploaded by Investor/RT 14.2.6 showing symbol: ESM1. |
View |
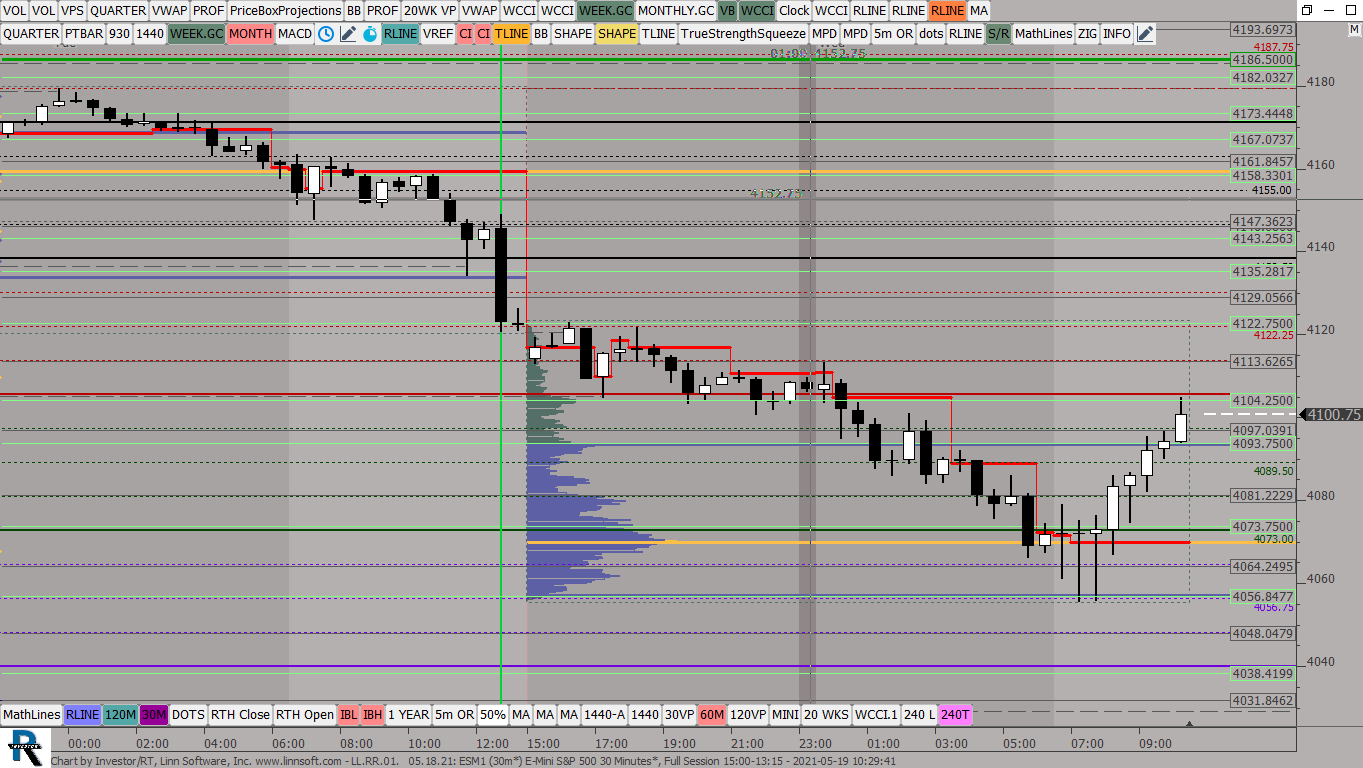 |
LLRR01 (ESM1) ES42 [totalcount]
4 years 7 months ago
This chart was uploaded by Investor/RT 14.2.6 showing symbol: ESM1. |
View |
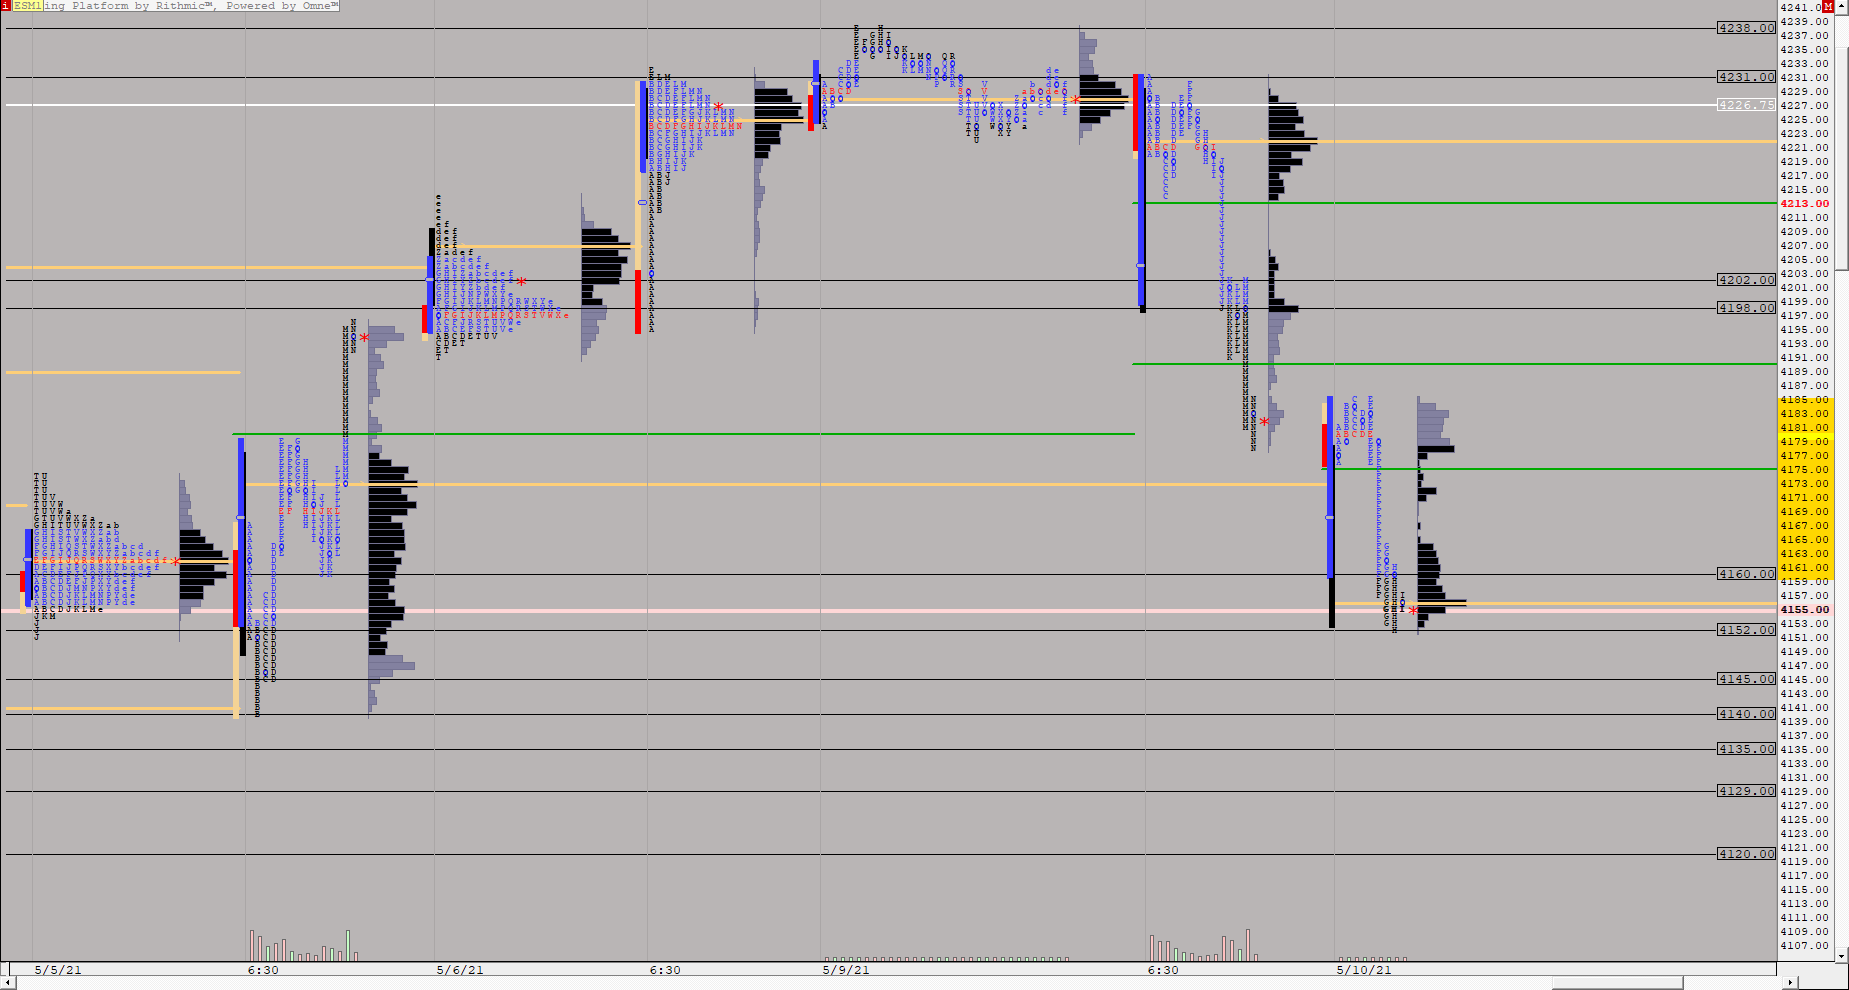 |
ESTPO 1POINT (ESM1) ES42 [totalcount]
4 years 7 months ago
Daily Profiles, 1 point ticks. This chart was uploaded by Investor/RT 14.2.6 showing symbol: ESM1. |
View |
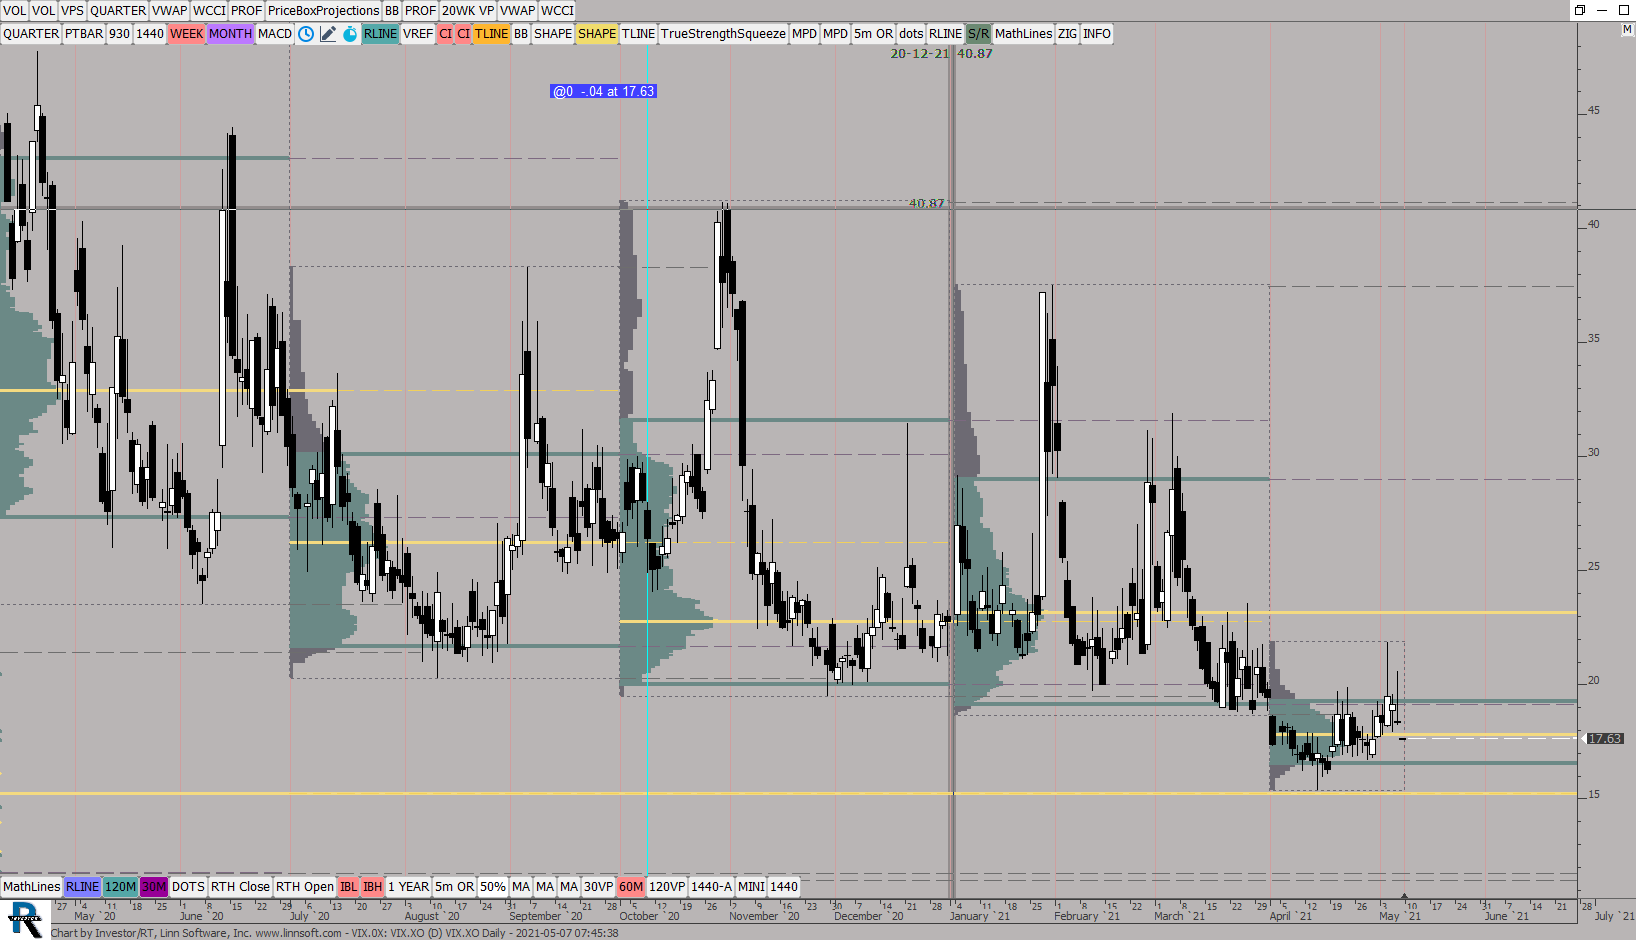 |
VIX0X (VIX.XO) ES42 [totalcount]
4 years 7 months ago
This chart was uploaded by Investor/RT 14.2.6 showing symbol: VIX.XO. |
View |
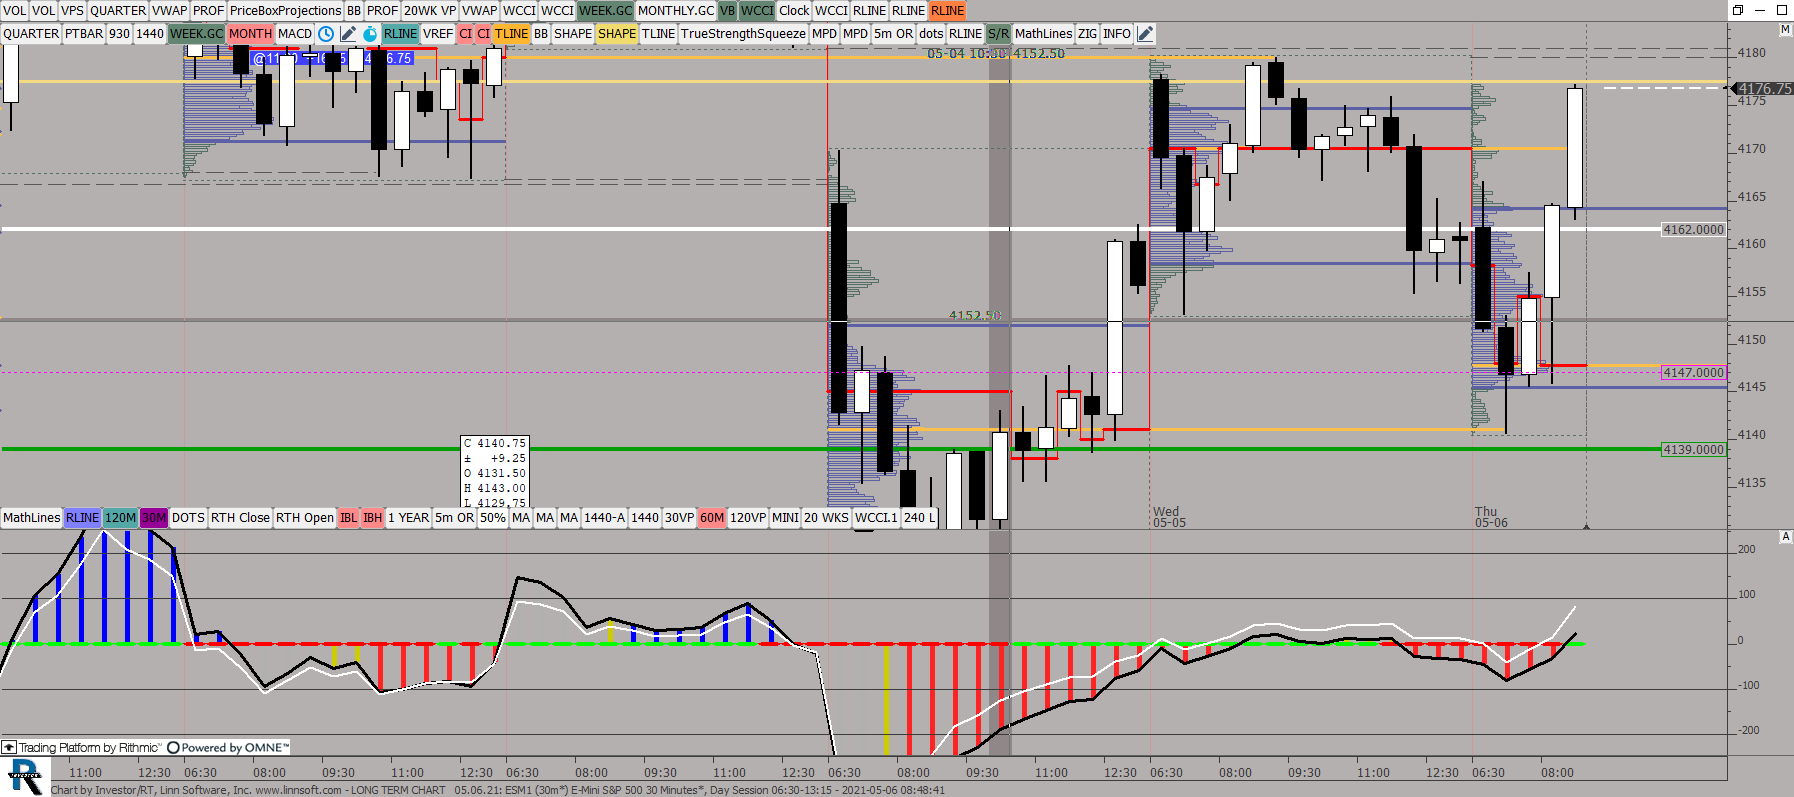 |
LONG TERM CHART (ESM1) ES42 [totalcount]
4 years 7 months ago
This chart was uploaded by Investor/RT 14.2.6 showing symbol: ESM1. |
View |
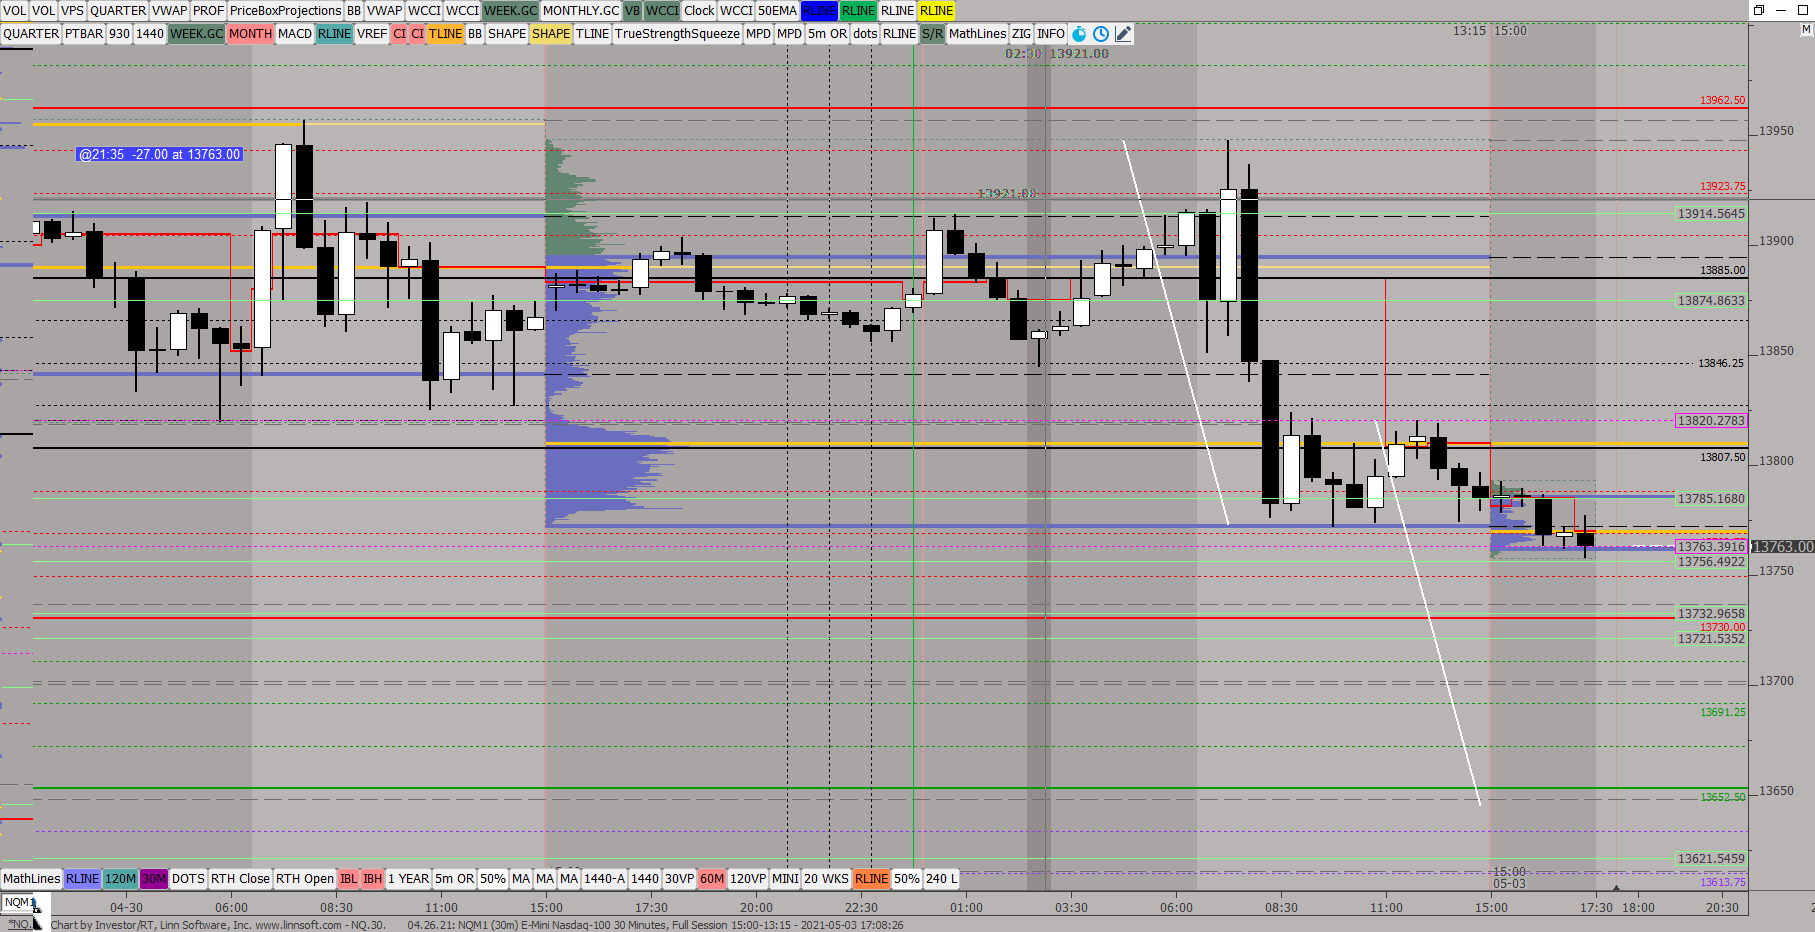 |
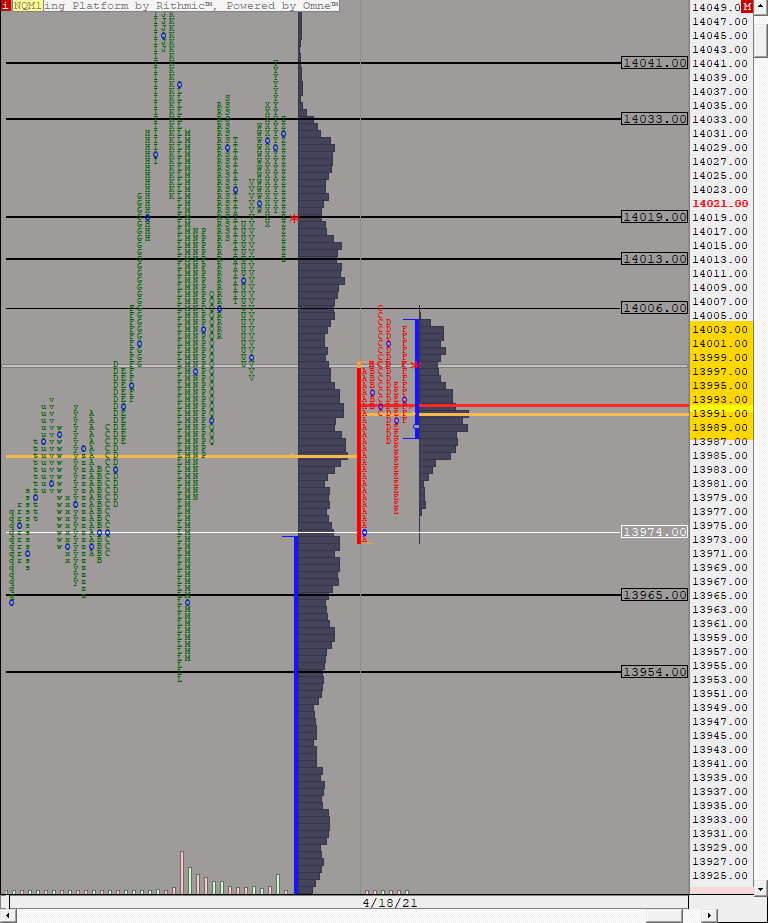
NQ30 (NQM1) ES42 [totalcount]
4 years 7 months ago
This chart was uploaded by Investor/RT 14.2.6 showing symbol: NQM1. |
View |
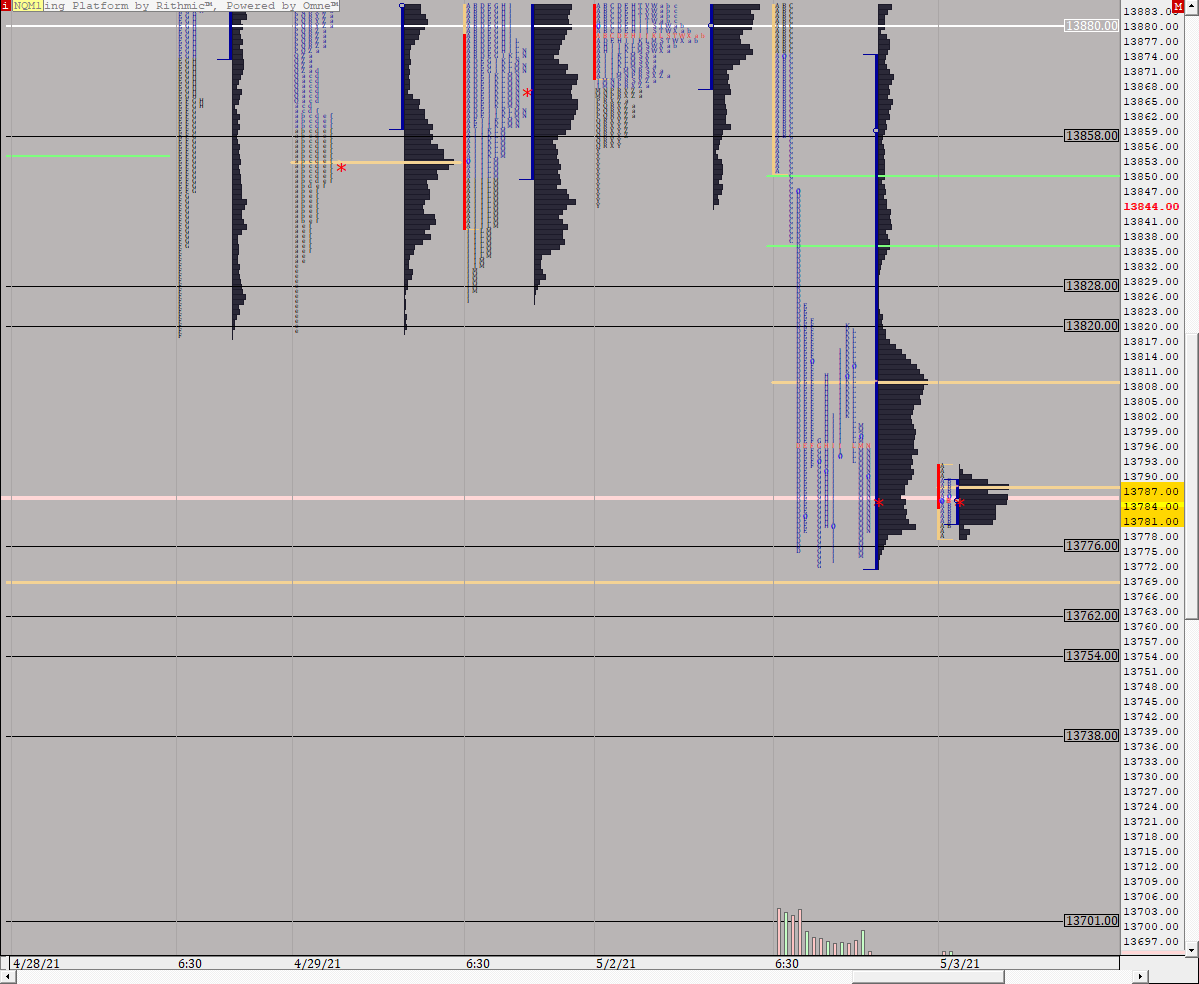 |
TPO NQ (NQM1) ES42 [totalcount]
4 years 7 months ago
This chart was uploaded by Investor/RT 14.2.6 showing symbol: NQM1. |
View |
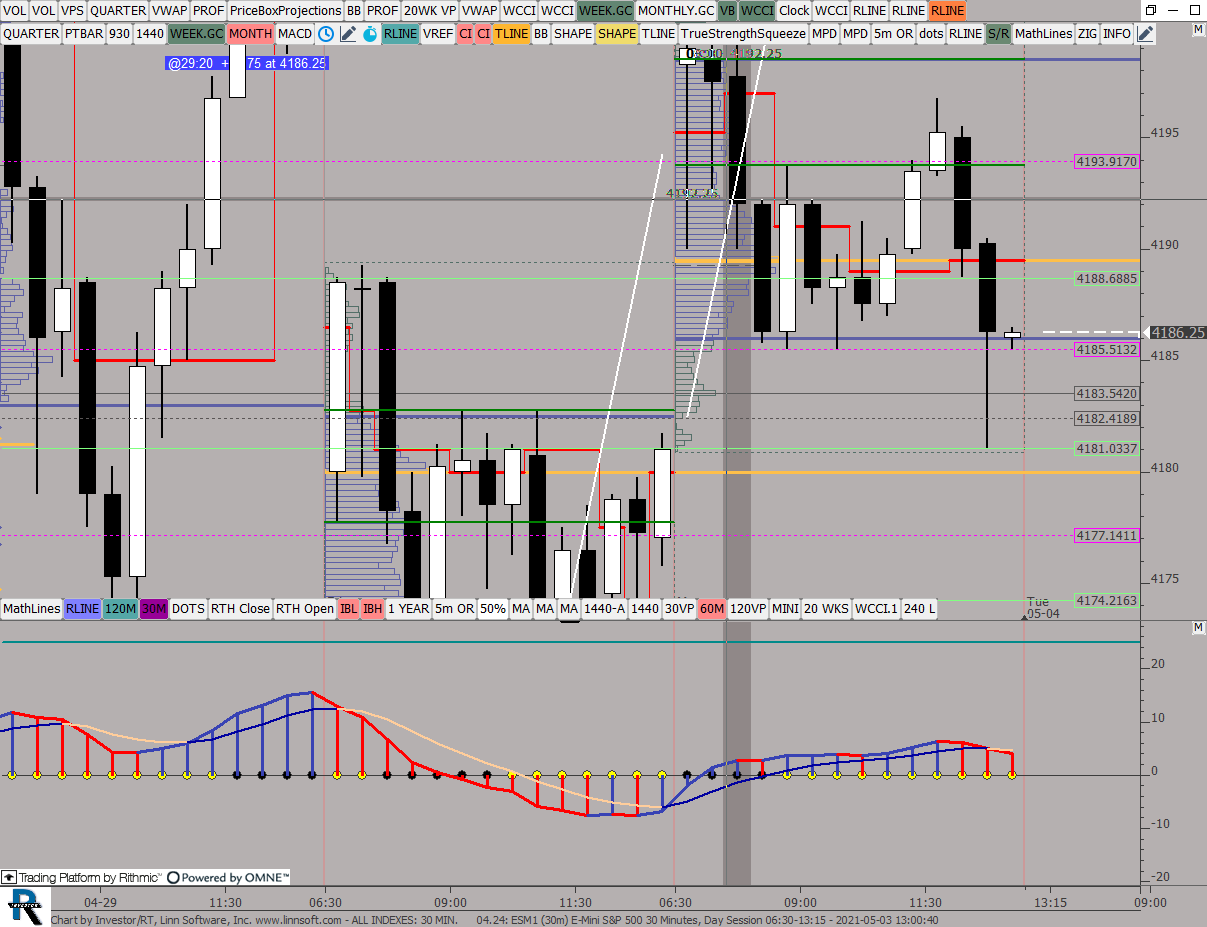 |
ALL INDEXES 30 MIN (ESM1) ES42 [totalcount]
4 years 7 months ago
This chart was uploaded by Investor/RT 14.2.6 showing symbol: ESM1. |
View |
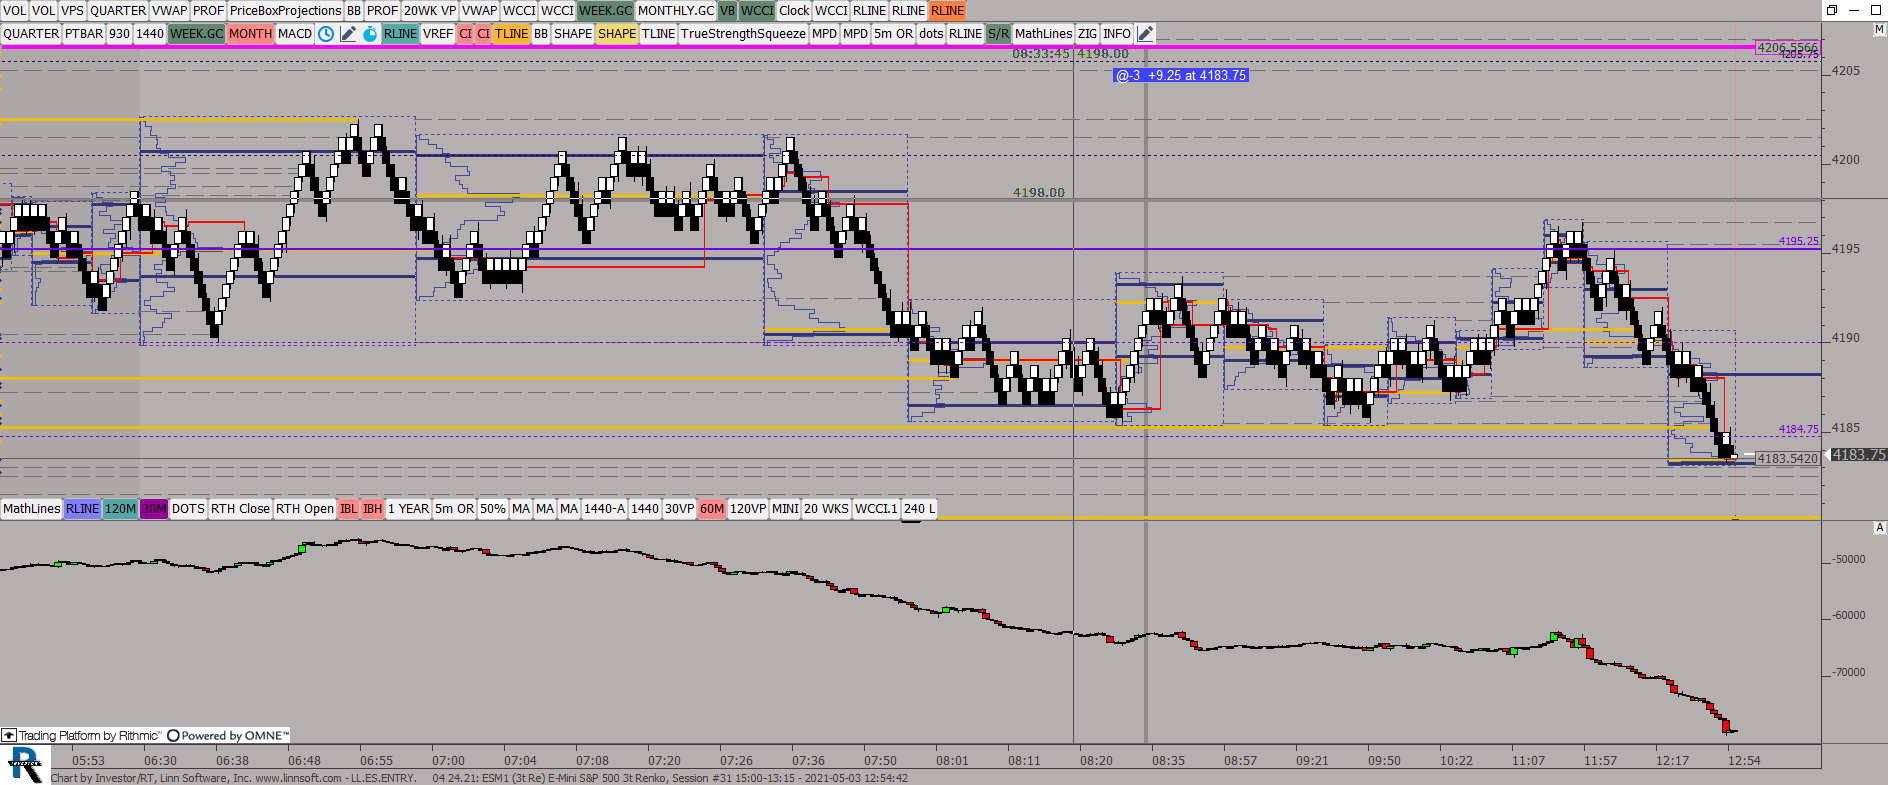 |
LLESENTRY 04 (ESM1) ES42 [totalcount]
4 years 7 months ago
This chart was uploaded by Investor/RT 14.2.6 showing symbol: ESM1. |
View |
 |
MonthlyMP ES (ESM1) ES42 [totalcount]
4 years 7 months ago
This chart was uploaded by Investor/RT 14.2.6 showing symbol: ESM1. |
View |
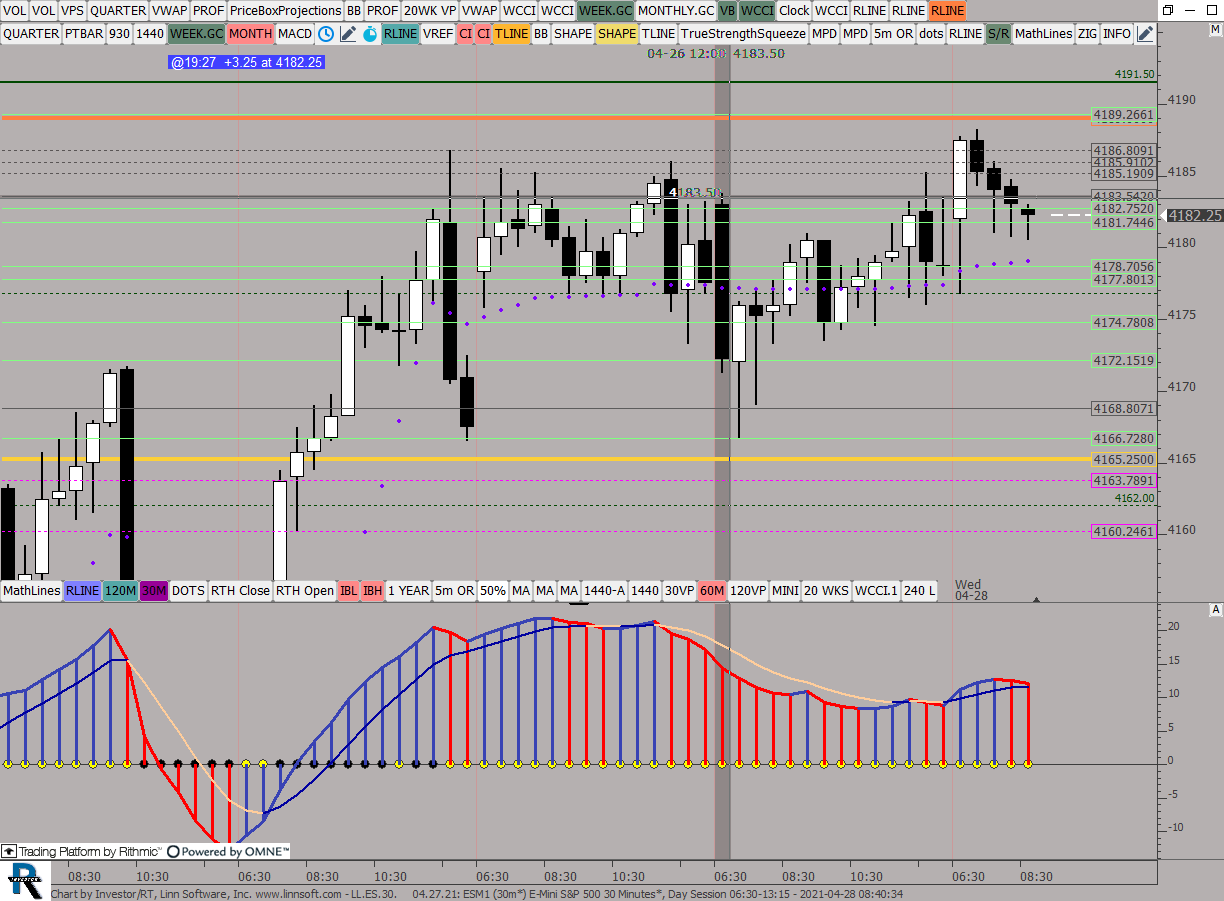 |
LLES30 (ESM1) ES42 [totalcount]
4 years 7 months ago
This chart was uploaded by Investor/RT 14.2.6 showing symbol: ESM1. |
View |
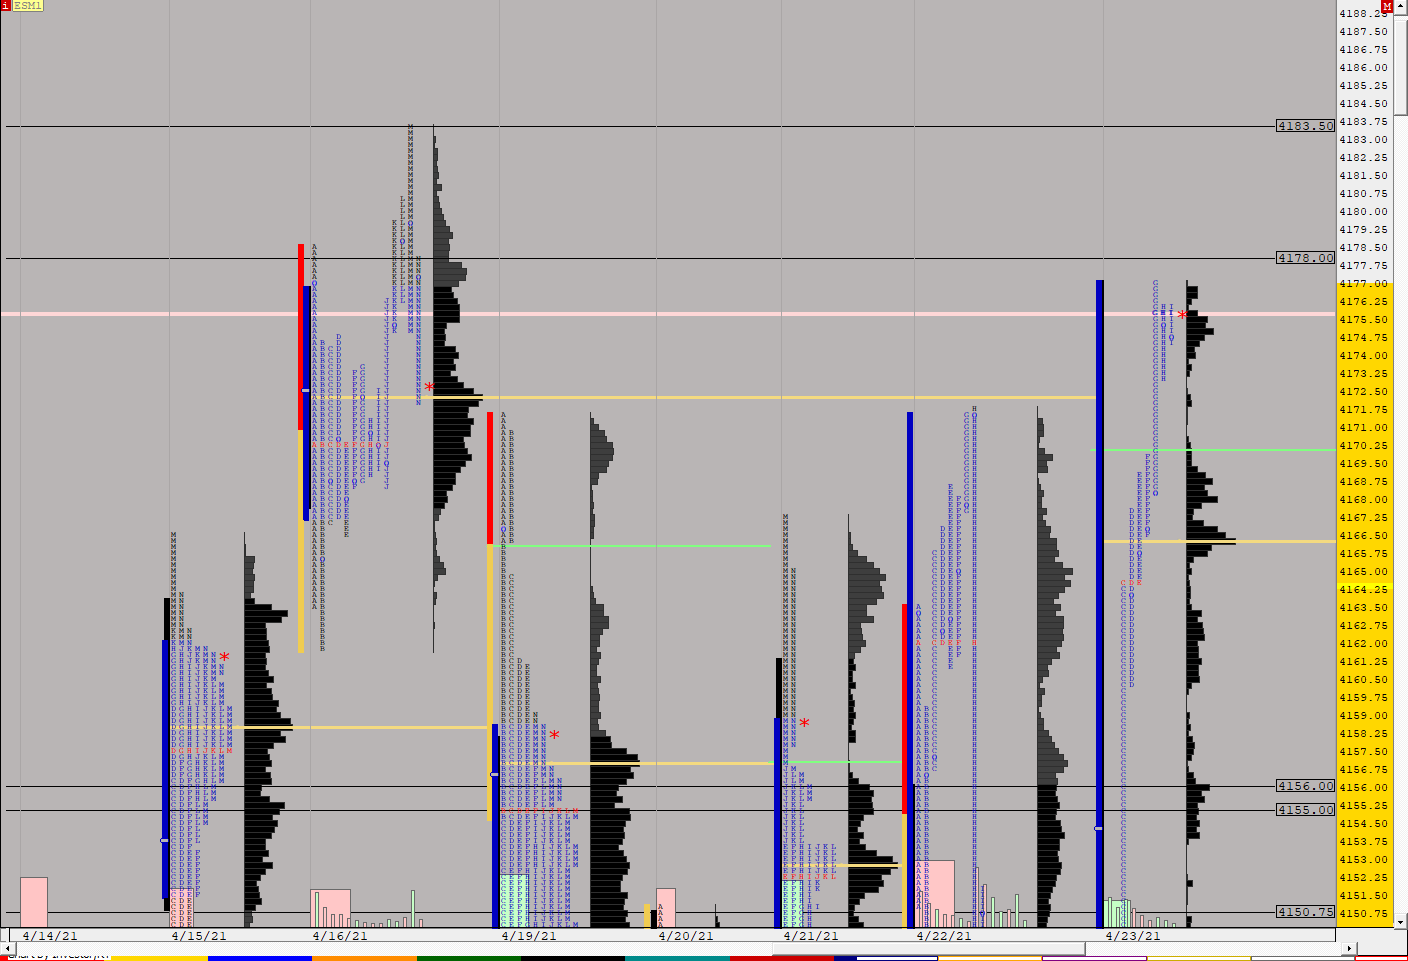 |
ESTPO (ESM1) ES42 [totalcount]
4 years 7 months ago
This chart was uploaded by Investor/RT 14.2.5 showing symbol: ESM1. |
View |
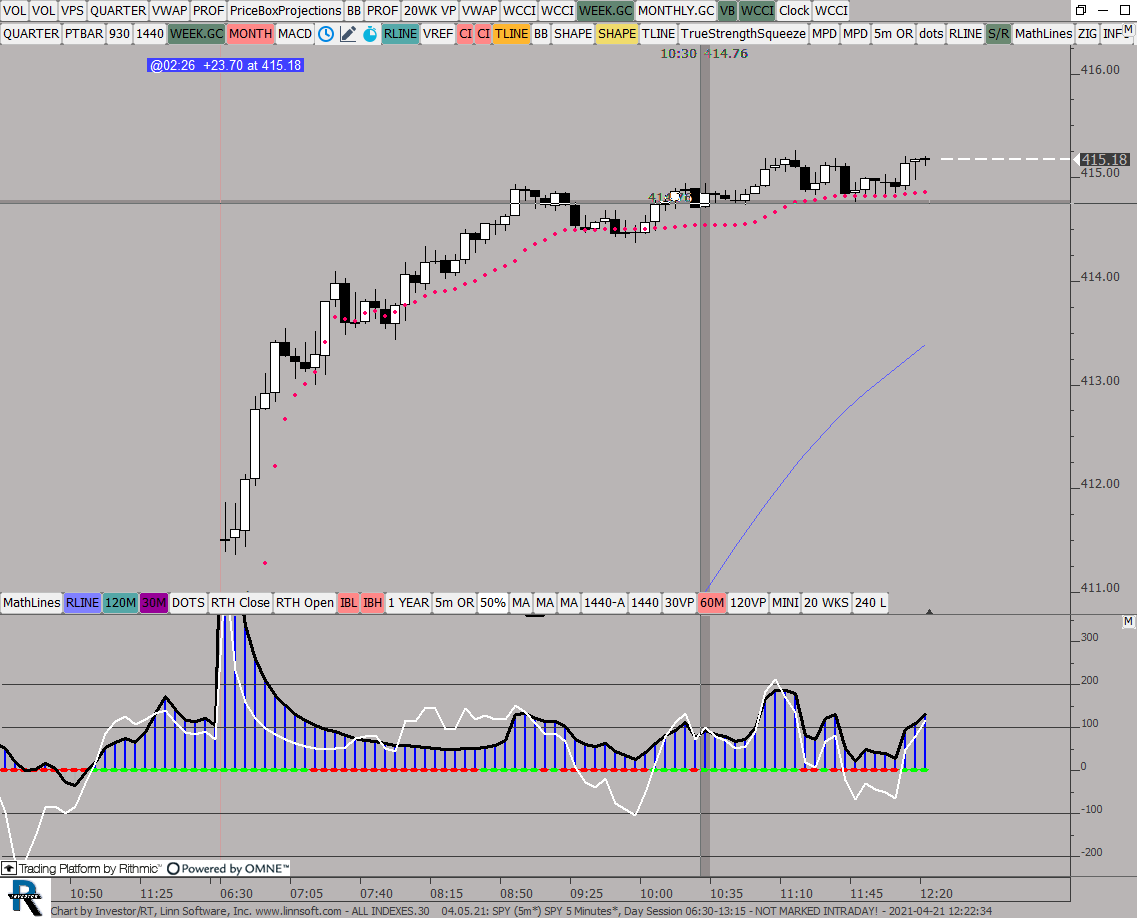 |
ALL INDEXES30 (SPY) ES42 [totalcount]
4 years 8 months ago
This chart was uploaded by Investor/RT 14.2.6 showing symbol: SPY. |
View |
 |
NQTPO (NQM1) ES42 [totalcount]
4 years 8 months ago
This chart was uploaded by Investor/RT 14.2.6 showing symbol: NQM1. |
View |
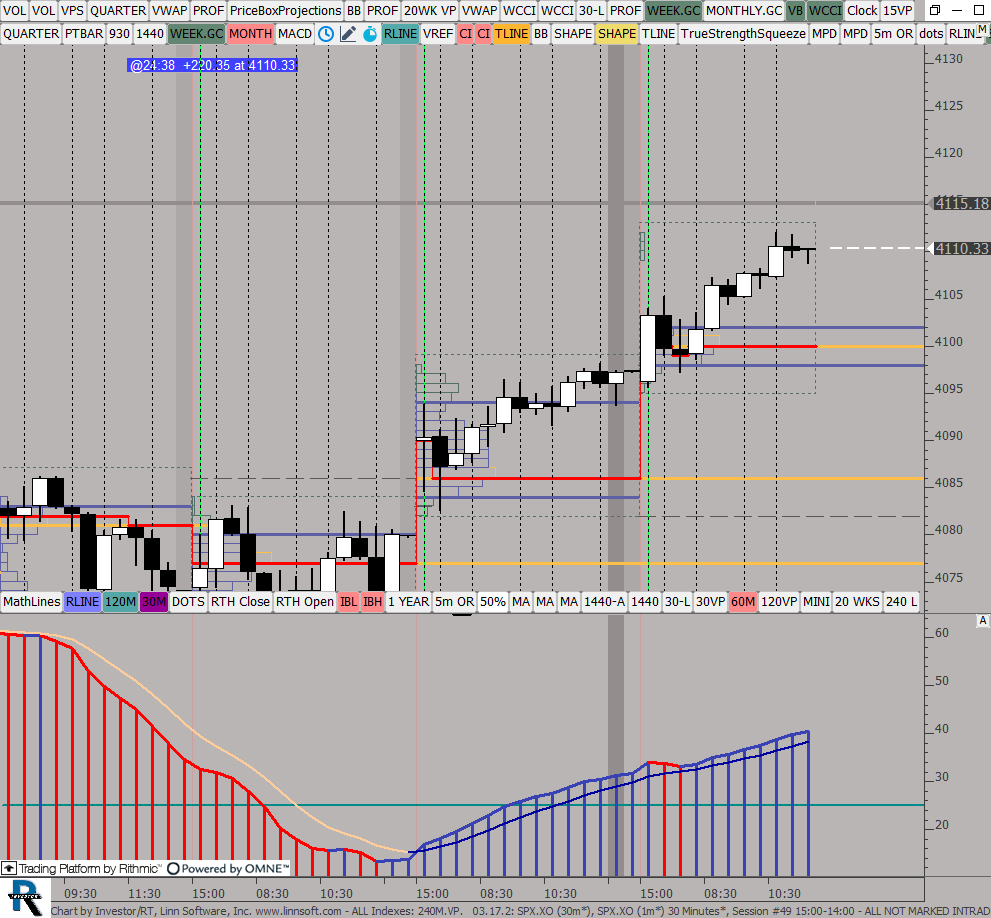 |
ALL Indexes 240MVP (SPX.XO) ES42 [totalcount]
4 years 8 months ago
This chart was uploaded by Investor/RT 14.2.5 showing symbol: SPX.XO. |
View |
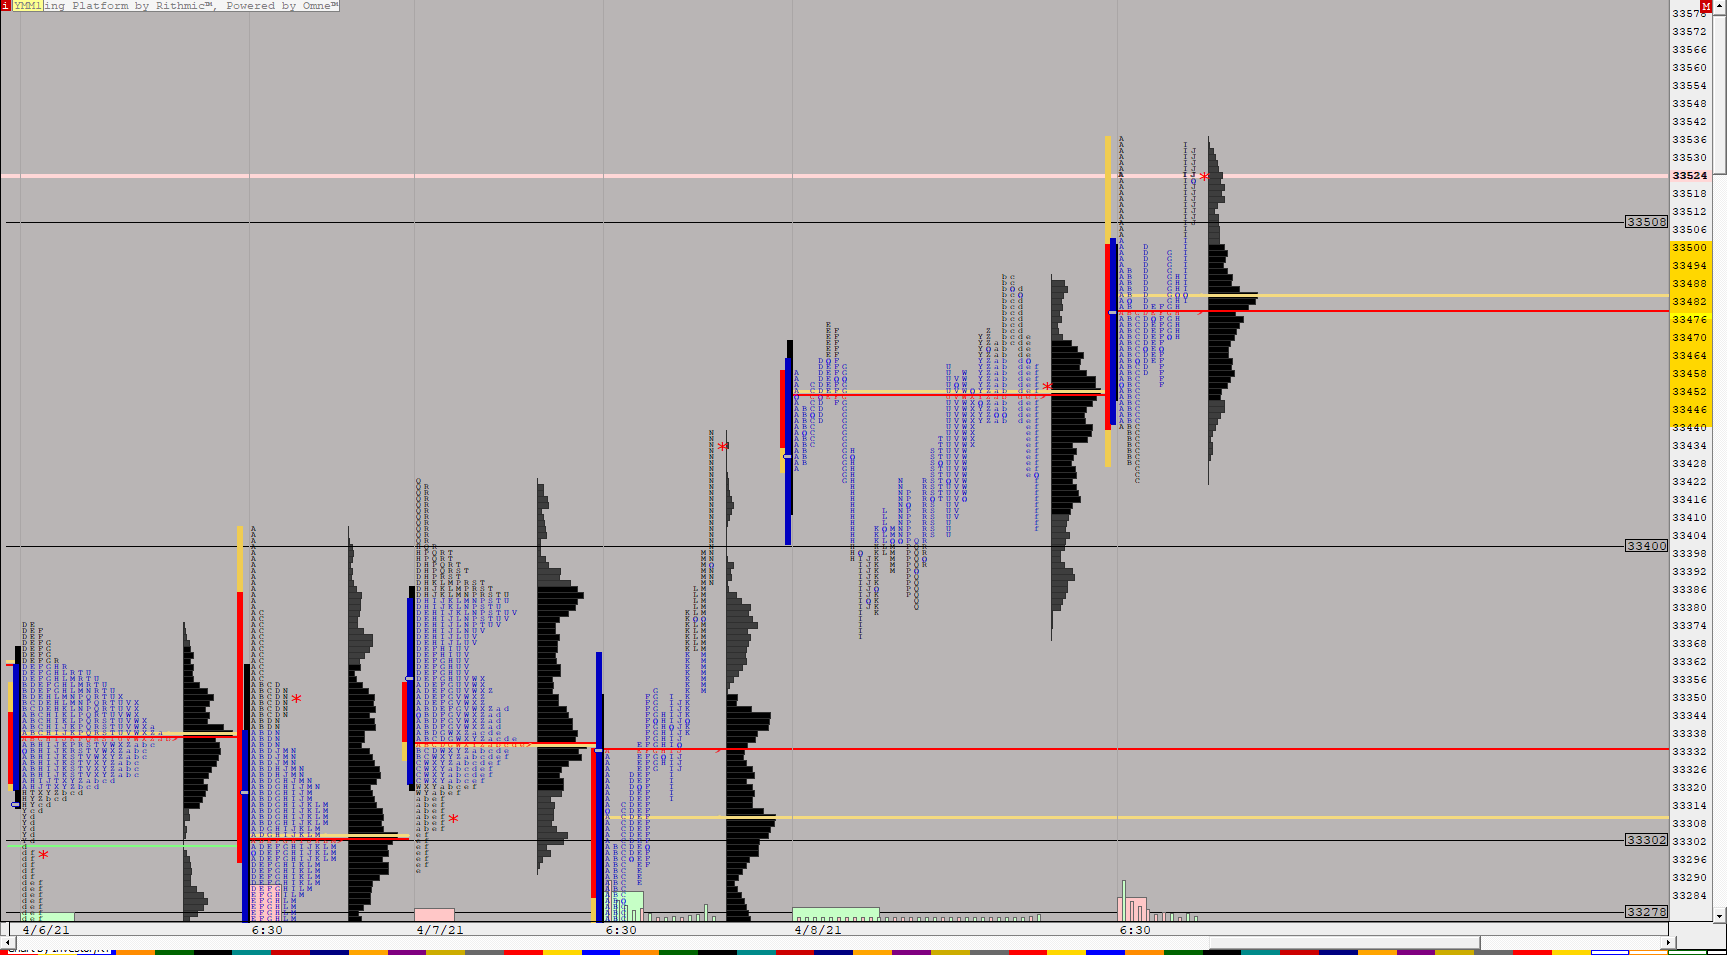 |
YMTPO (YMM1) ES42 [totalcount]
4 years 8 months ago
This chart was uploaded by Investor/RT 14.2.5 showing symbol: YMM1. |
View |
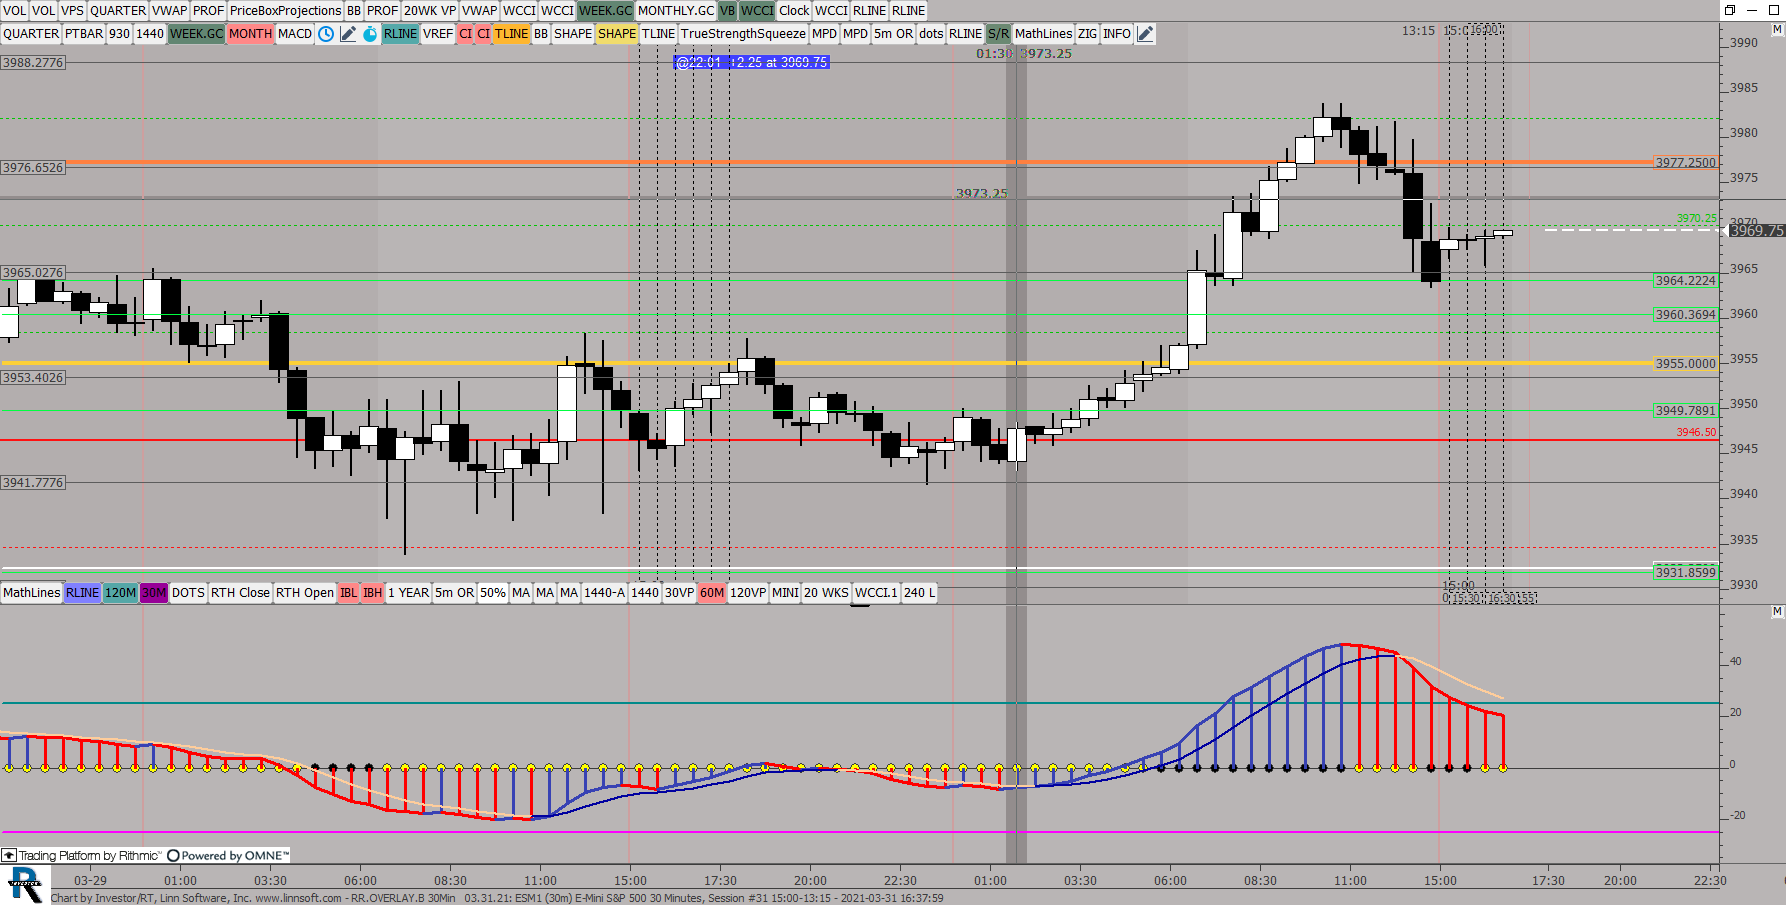 |
RROVERLAYB 30Min (ESM1) ES42 [totalcount]
4 years 8 months ago
This chart was uploaded by Investor/RT 14.2.5 showing symbol: ESM1. |
View |
 |
RROVERLAY240 (ESM1) ES42 [totalcount]
4 years 8 months ago
This chart was uploaded by Investor/RT 14.2.5 showing symbol: ESM1. |
View |
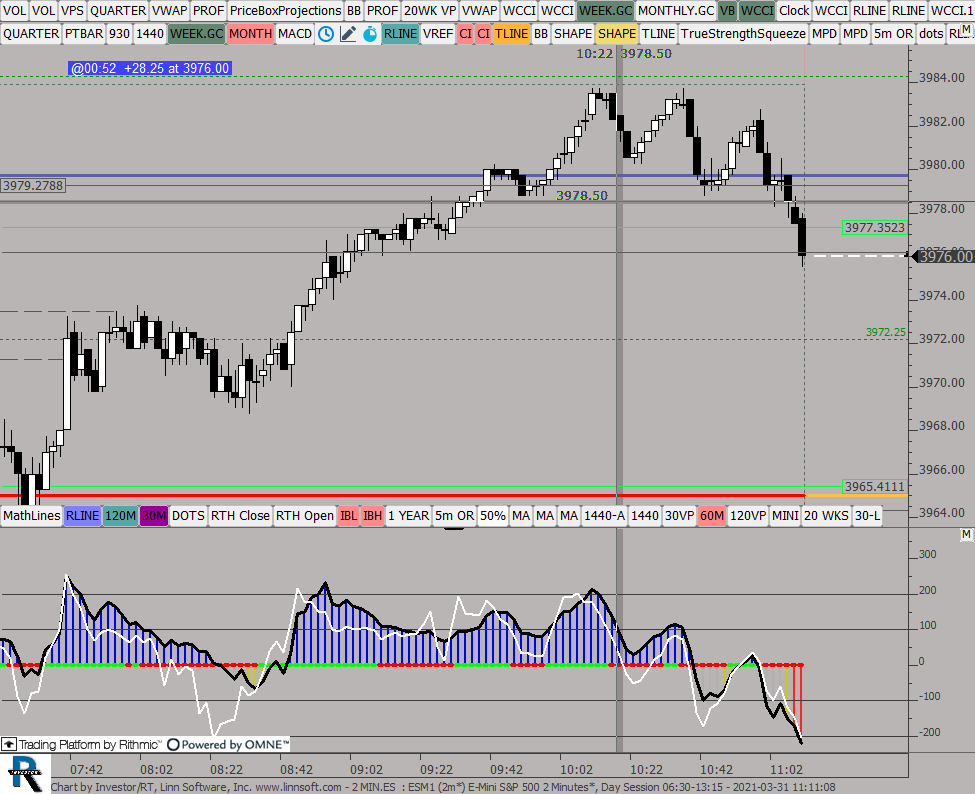 |
2 MINES (ESM1) ES42 [totalcount]
4 years 8 months ago
This chart was uploaded by Investor/RT 14.2.5 showing symbol: ESM1. |
View |
 |
ESTPORTH (ESM1) ES42 [totalcount]
4 years 8 months ago
This chart was uploaded by Investor/RT 14.2.5 showing symbol: ESM1. |
View |
 |
ESWEEKLYTPOGLOBEX (ESM1) ES42 [totalcount]
4 years 9 months ago
This chart was uploaded by Investor/RT 14.2.5 showing symbol: ESM1. |
View |
 |
WEEKLYTPORTH (ESM1) ES42 [totalcount]
4 years 9 months ago
This chart was uploaded by Investor/RT 14.2.5 showing symbol: ESM1. |
View |