 |
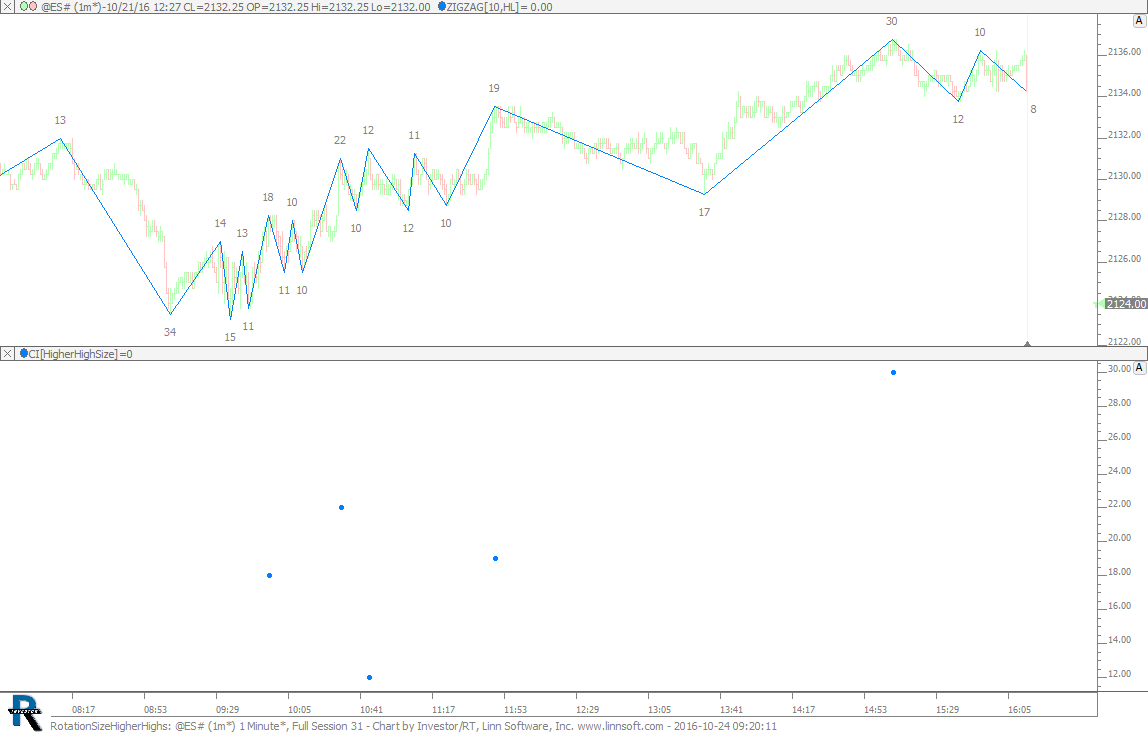
RotationSizeHigherHighs (@ES#) cpayne [totalcount]
9 years 9 months ago
Rotation Size of Higher Highs. This chart was uploaded by Investor/RT 12.6.7 showing symbol: @ES#. |
View |
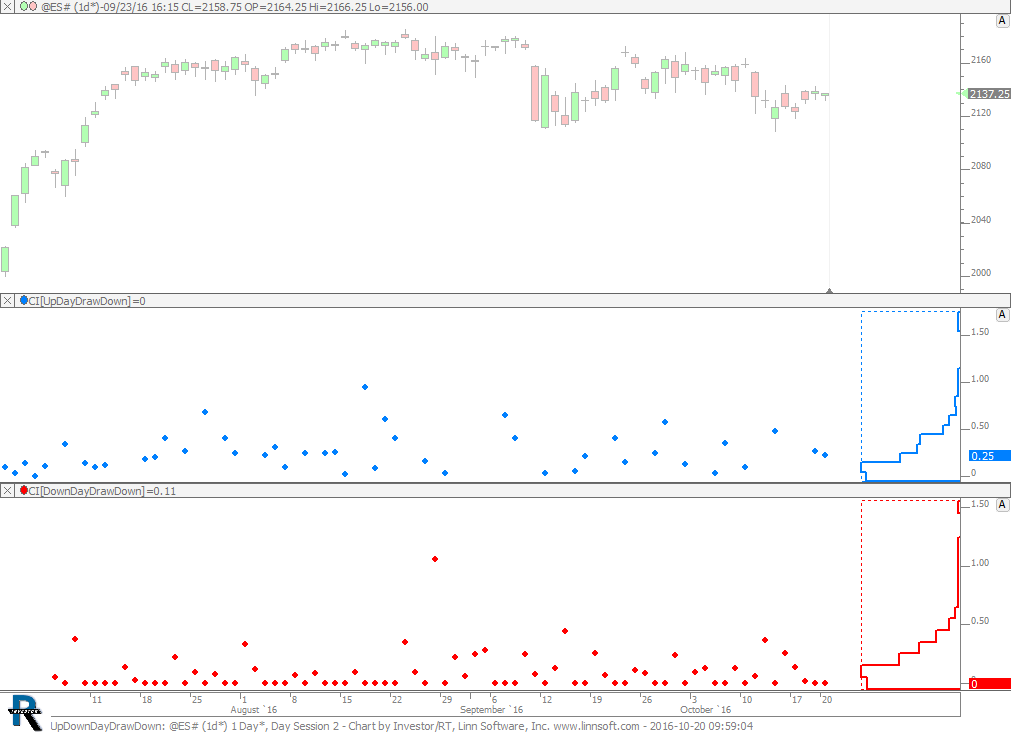 |
UpDownDayDrawDown (@ES#) cpayne [totalcount]
9 years 9 months ago
Up and Down Day Drop Down. This chart was uploaded by Investor/RT 12.6.6 showing symbol: @ES#. |
View |
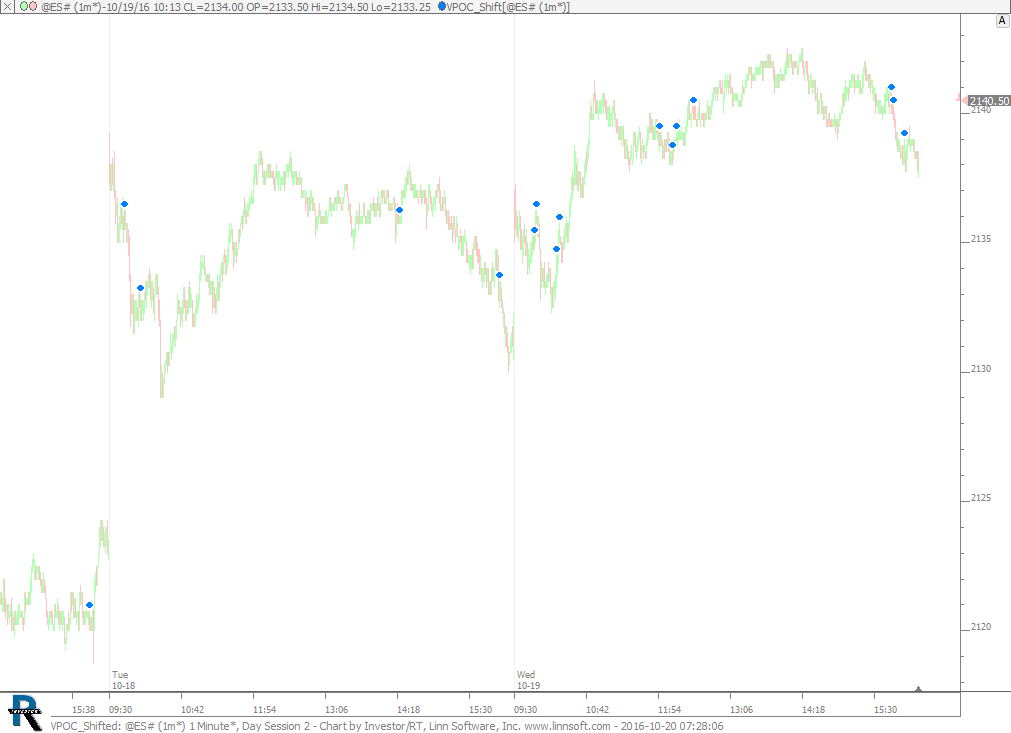 |
VPOC Shifted (@ES#) cpayne [totalcount]
9 years 9 months ago
VPOC Shift Alert. This chart was uploaded by Investor/RT 12.6.6 showing symbol: @ES#. |
View |
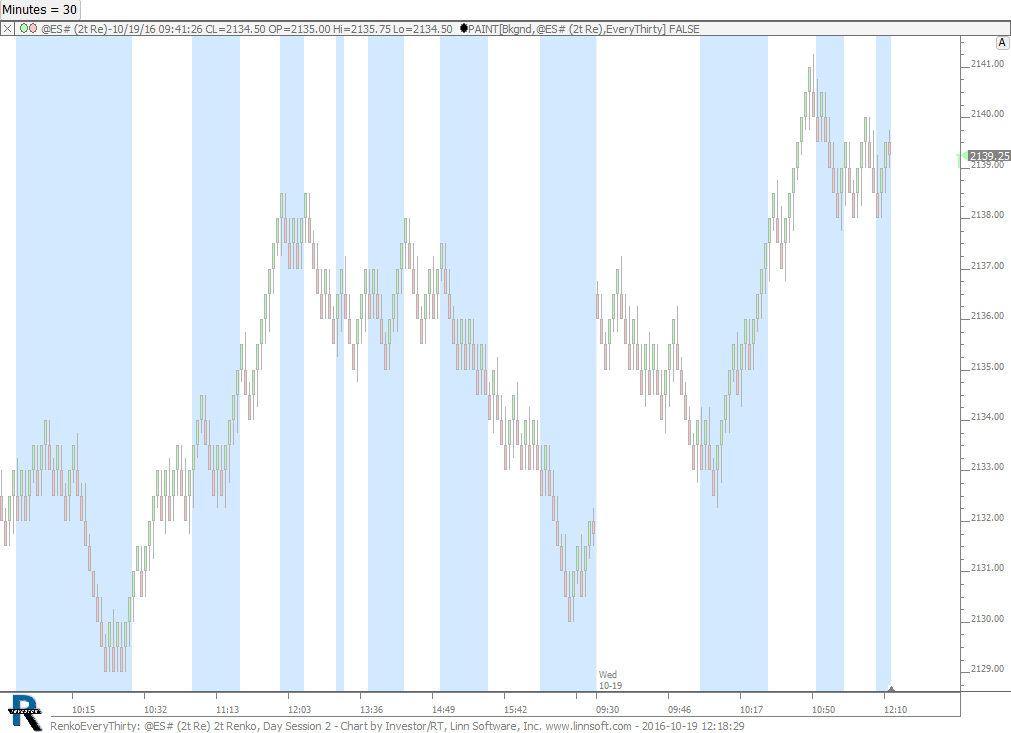 |
RenkoEveryThirty (@ES#) cpayne [totalcount]
9 years 9 months ago
Renko Chart With Every 30 Minute Period Painted. This chart was uploaded by Investor/RT 12.6.6 showing symbol: @ES#. |
View |
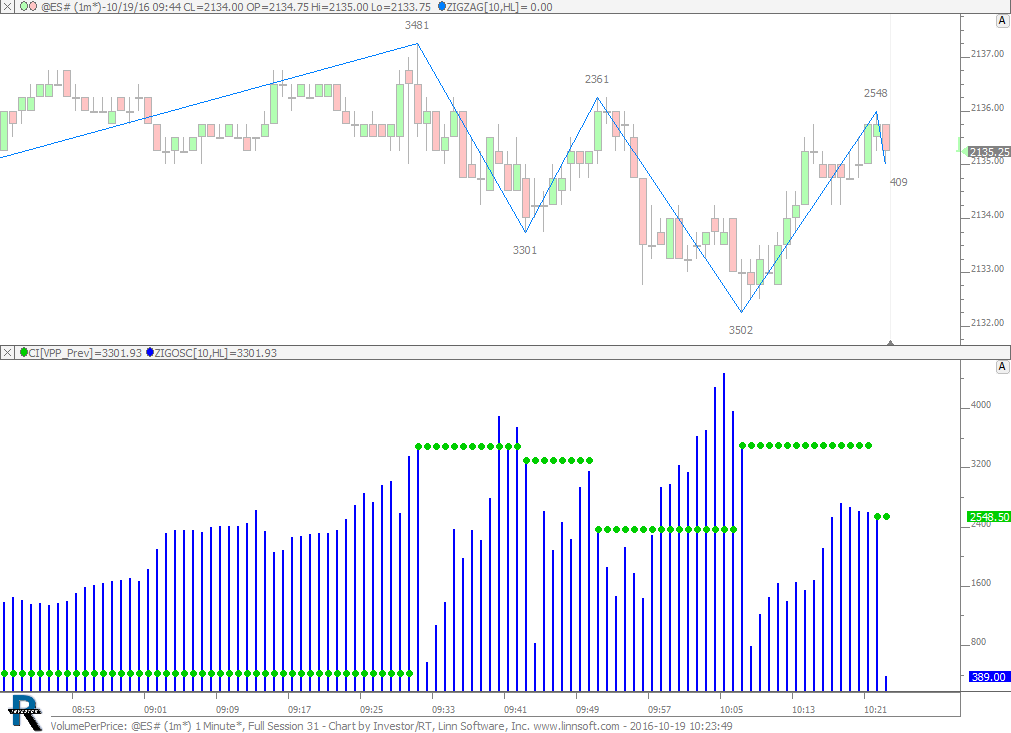 |
VolumePerPrice (@ES#) cpayne [totalcount]
9 years 9 months ago
Volume Per Price of Previous Leg. This chart was uploaded by Investor/RT 12.6.6 showing symbol: @ES#. |
View |
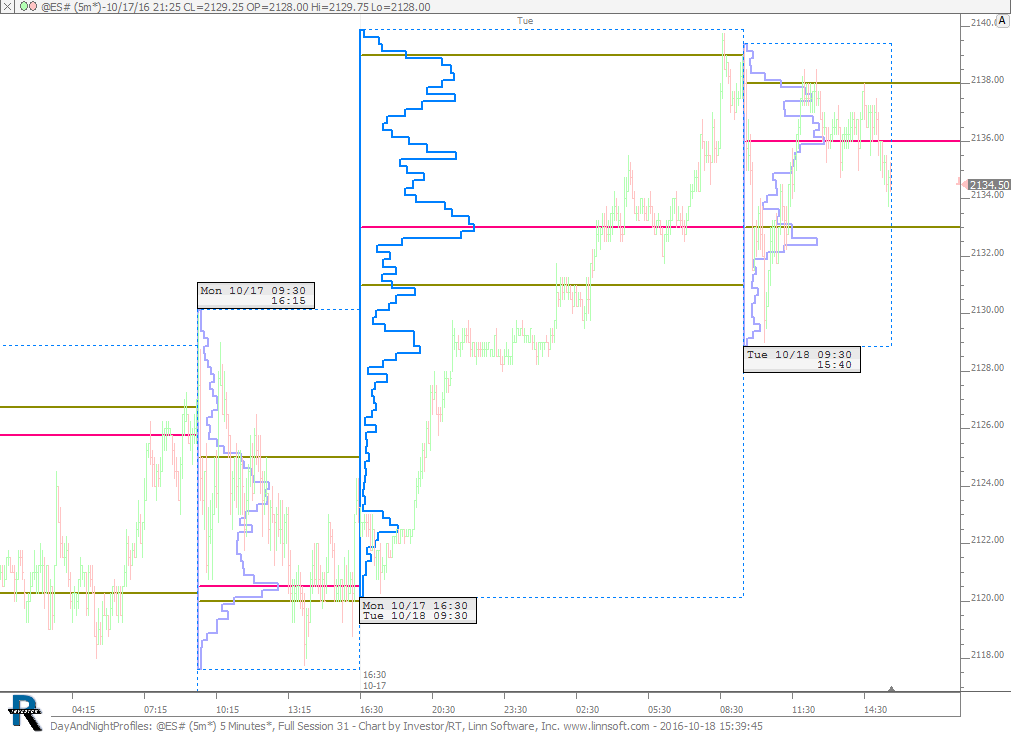 |
DayAndNightProfiles (@ES#) cpayne [totalcount]
9 years 9 months ago
Split Profile - Day and ON Session. This chart was uploaded by Investor/RT 12.6.6 showing symbol: @ES#. |
View |
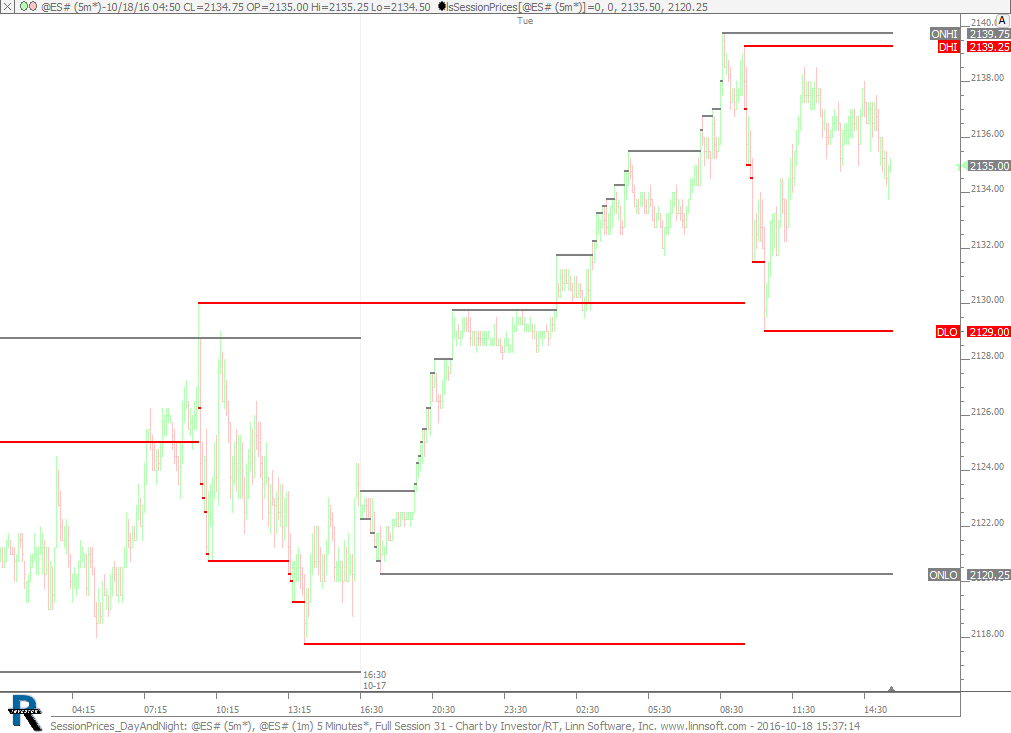 |
SessionPrices DayAndNight (@ES#) cpayne [totalcount]
9 years 9 months ago
Session Prices - Day and Overnight High / Low. This chart was uploaded by Investor/RT 12.6.6 showing symbol: @ES#. |
View |
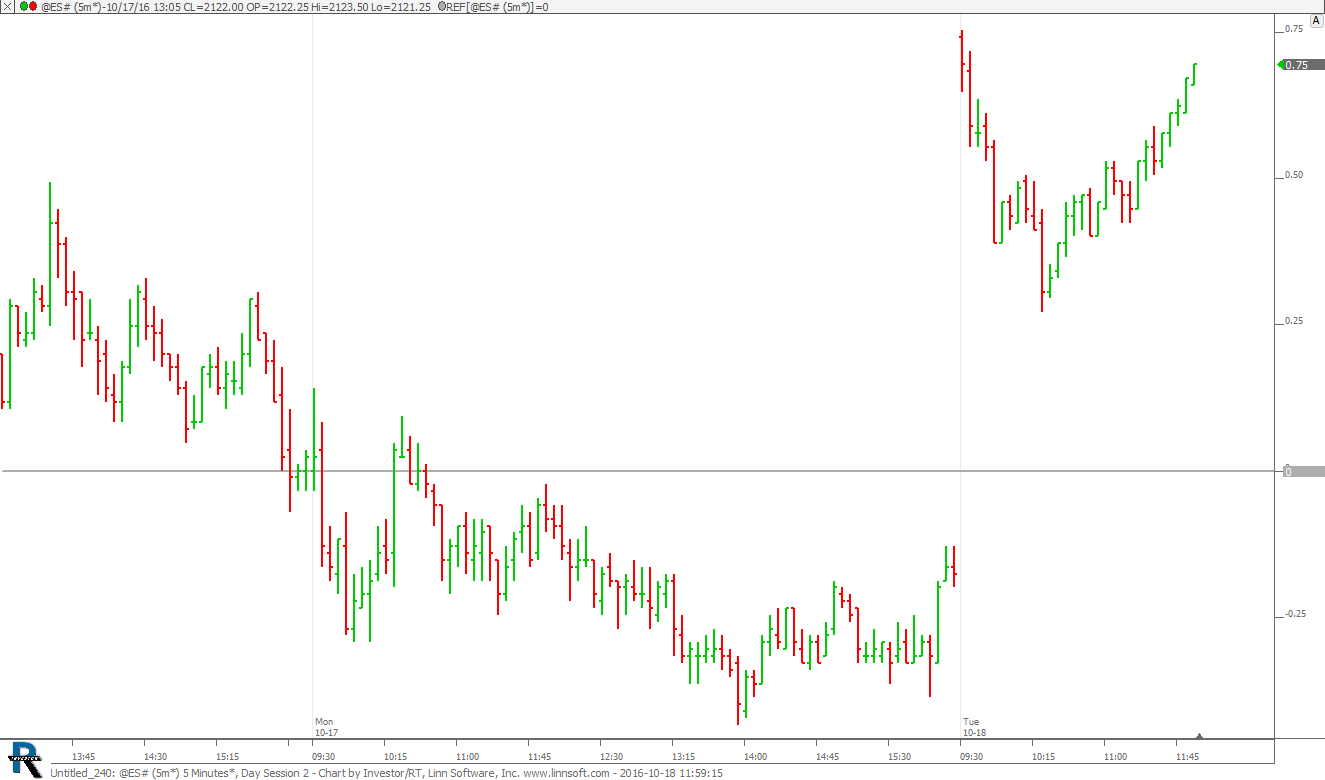 |
Untitled 240 (@ES#) cpayne [totalcount]
9 years 9 months ago
Day % Change from Previous Close. This chart was uploaded by Investor/RT 12.6.6 showing symbol: @ES#. |
View |
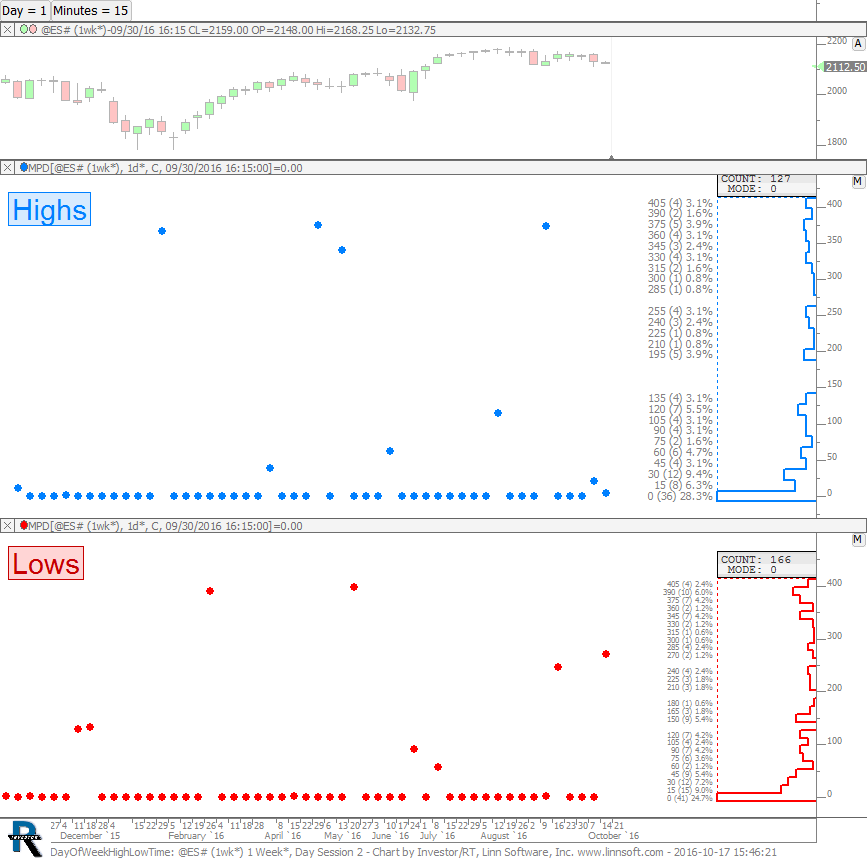 |
DayOfWeekHighLowTime (@ES#) cpayne [totalcount]
9 years 9 months ago
When High of Week was made on any particular day, what time of that day was high made?. This chart was uploaded by Investor/RT 12.6.6 showing symbol: @ES#. |
View |
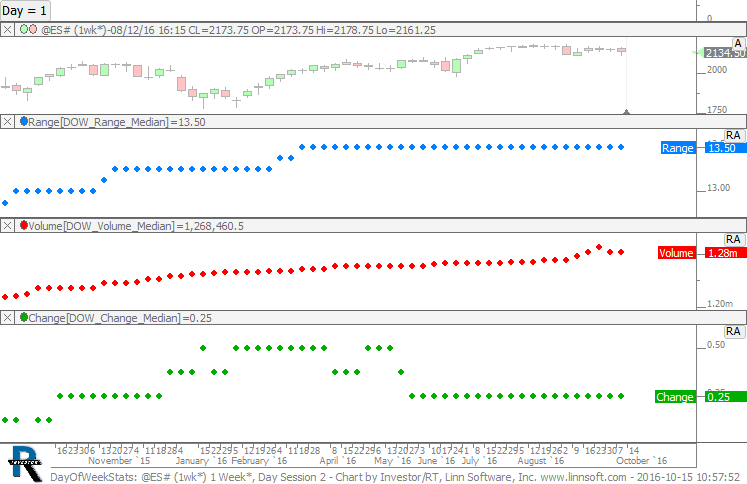 |
DayOfWeekStats (@ES#) cpayne [totalcount]
9 years 9 months ago
Day of Week Statistics. This chart was uploaded by Investor/RT 12.6.6 showing symbol: @ES#. |
View |
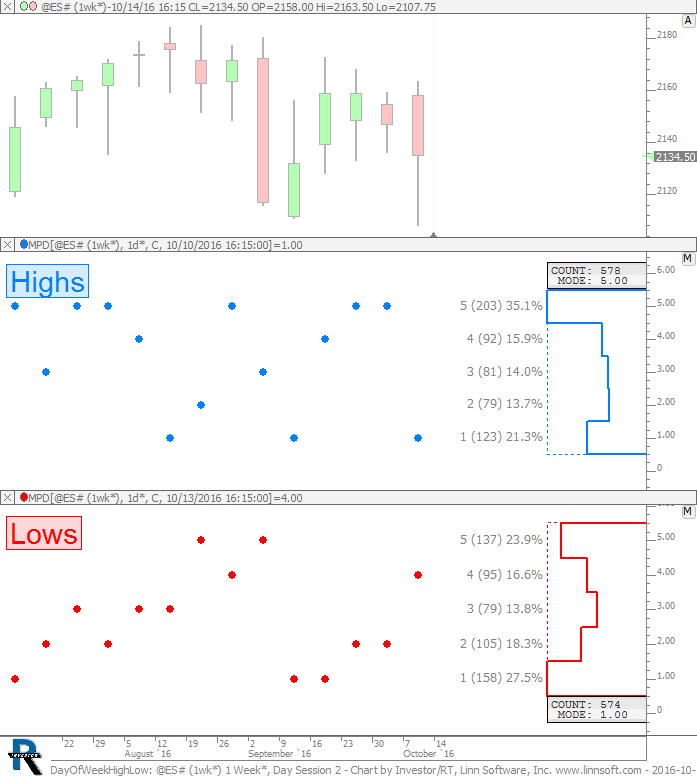 |
DayOfWeekHighLow (@ES#) cpayne [totalcount]
9 years 9 months ago
Day of Week that created the high and low of the week. This chart was uploaded by Investor/RT 12.6.6 showing symbol: @ES#. |
View |
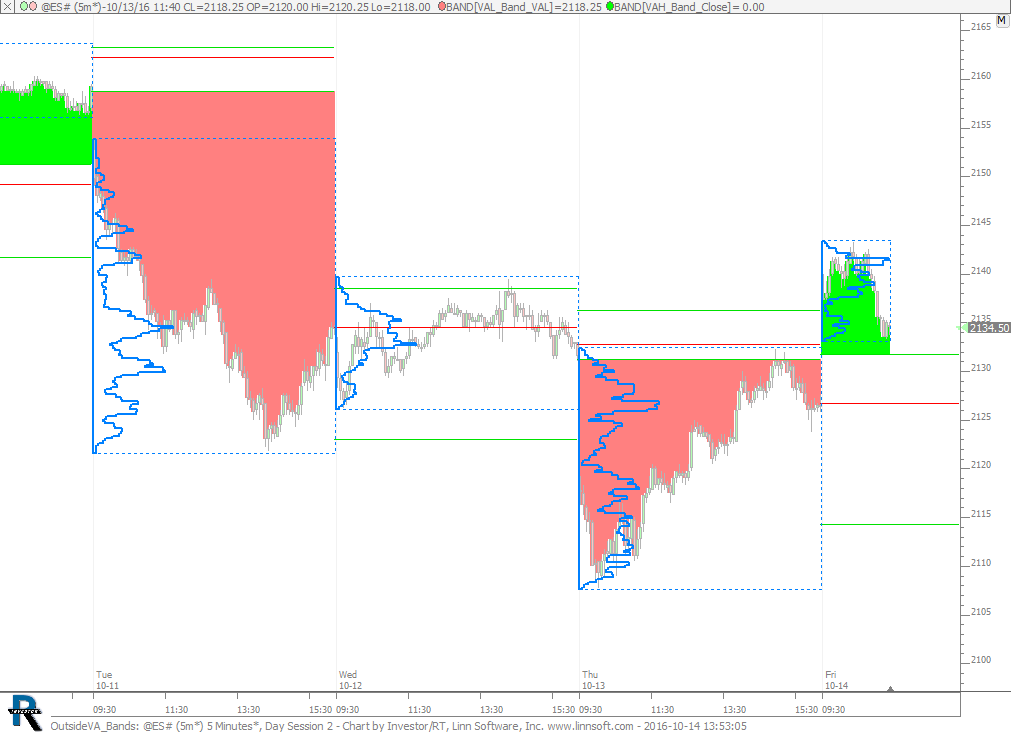 |
OutsideVA Bands (@ES#) cpayne [totalcount]
9 years 9 months ago
Bands Drawn When Price is Outside the Value Area. This chart was uploaded by Investor/RT 12.6.6 showing symbol: @ES#. |
View |
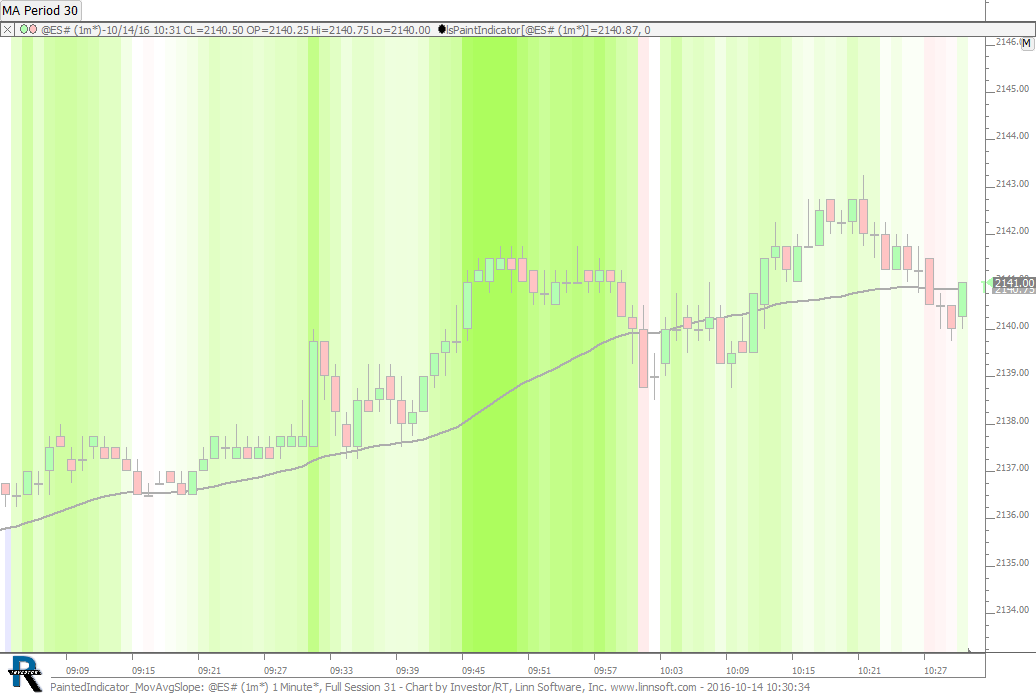 |
PaintedIndicator MovAvgSlope (@ES#) cpayne [totalcount]
9 years 9 months ago
PaintIndicator - Gradient for Moving Average Slope. This chart was uploaded by Investor/RT 12.6.6 showing symbol: @ES#. |
View |
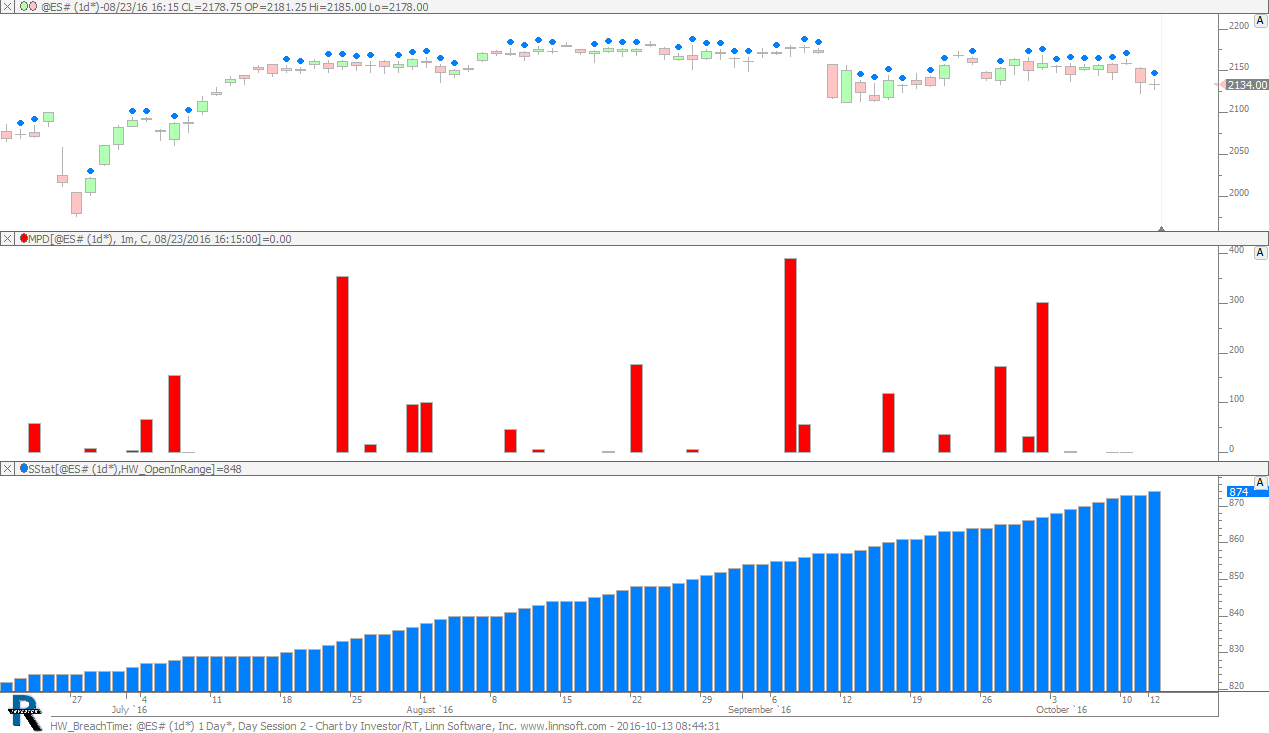 |
HW BreachTime (@ES#) cpayne [totalcount]
9 years 9 months ago
Homework: Time Breached High. This chart was uploaded by Investor/RT 12.6.5 showing symbol: @ES#. |
View |
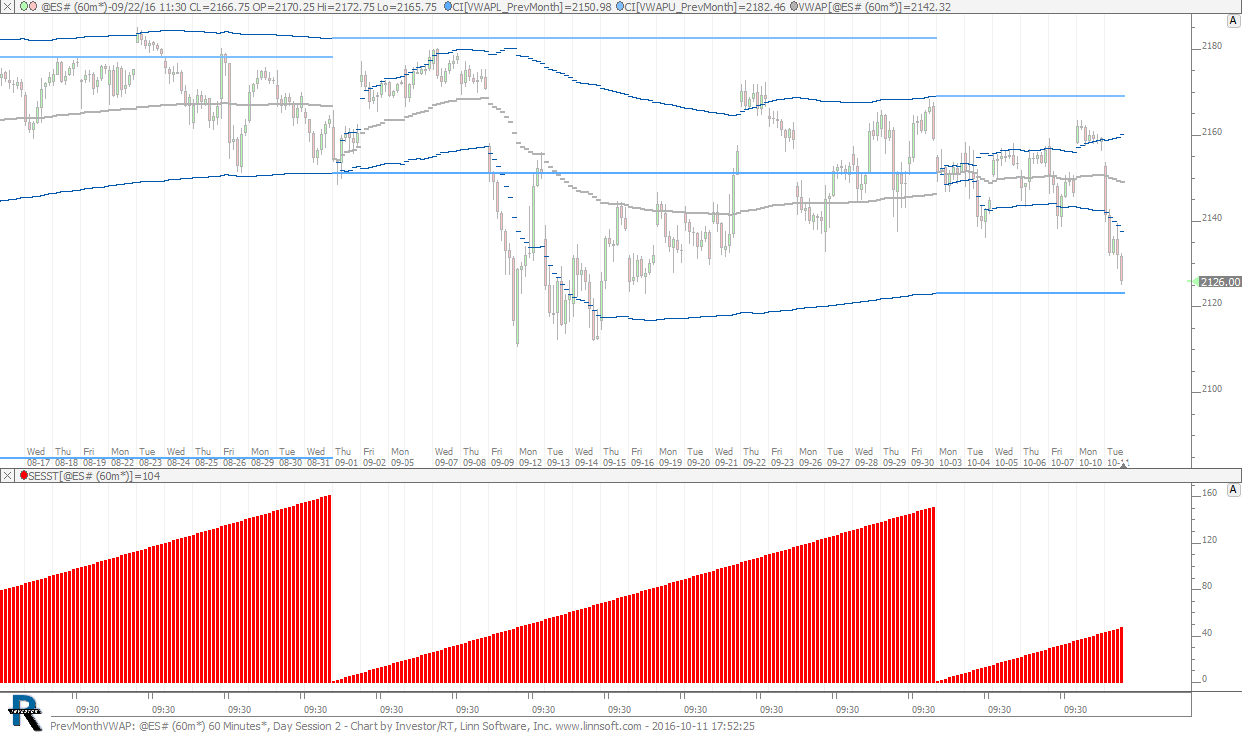 |
PrevMonthVWAP (@ES#) cpayne [totalcount]
9 years 9 months ago
Previous Month VWAP. This chart was uploaded by Investor/RT 12.6.5 showing symbol: @ES#. |
View |
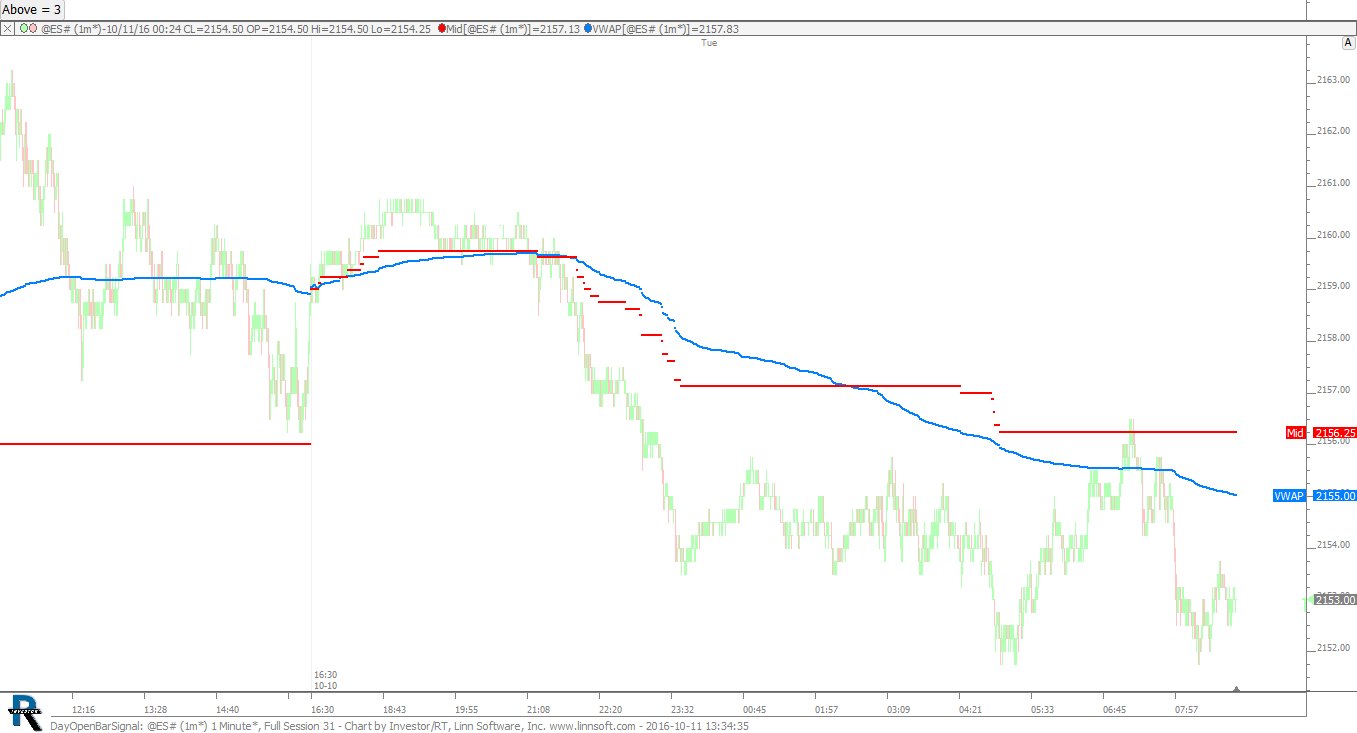 |
DayOpenBarSignal (@ES#) cpayne [totalcount]
9 years 9 months ago
Day Open Bar Signal. This chart was uploaded by Investor/RT 12.6.5 showing symbol: @ES#. |
View |
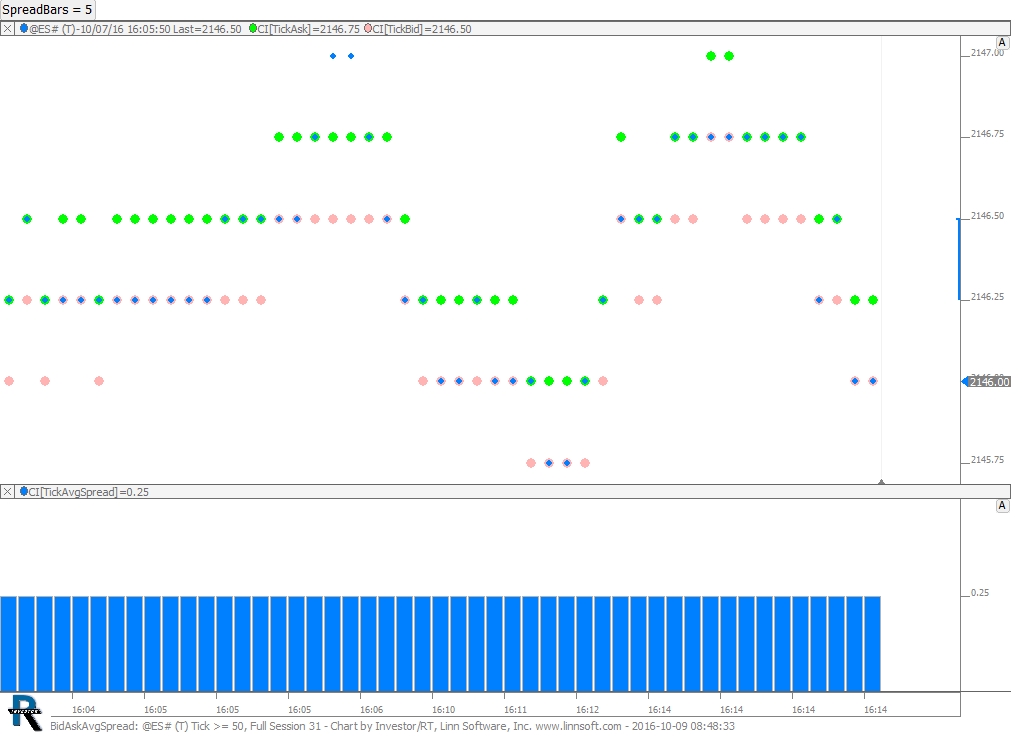 |
BidAskAvgSpread (@ES#) cpayne [totalcount]
9 years 9 months ago
Bid Ask Average Spread. This chart was uploaded by Investor/RT 12.6.5 showing symbol: @ES#. |
View |
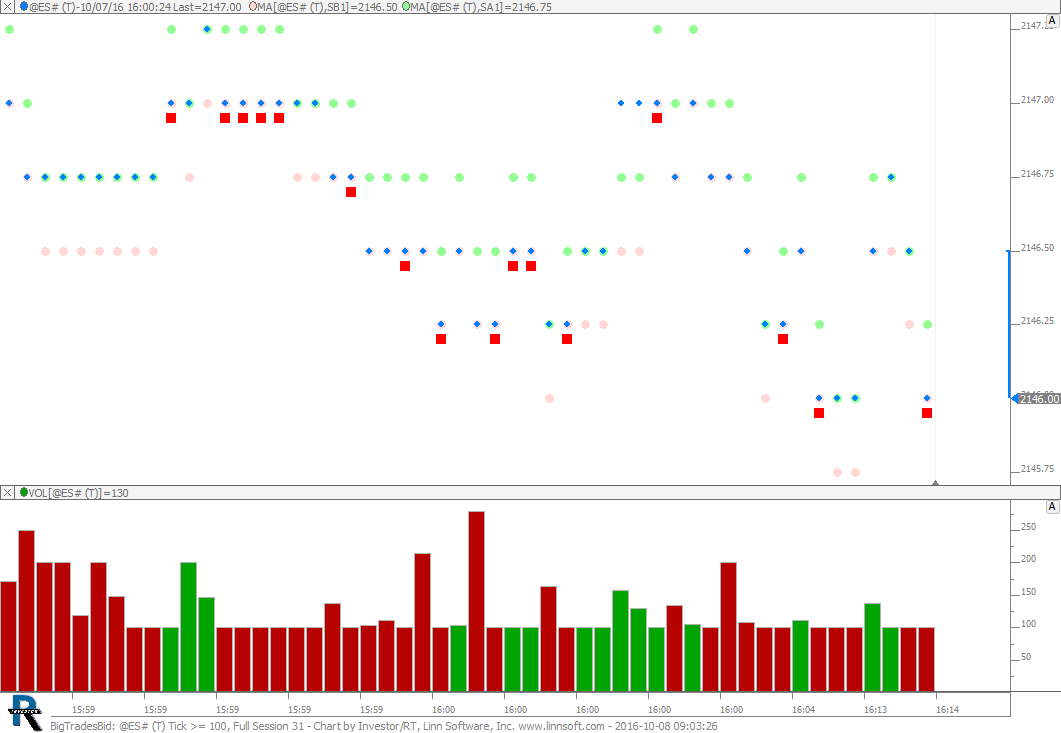 |
BigTradesBid (@ES#) cpayne [totalcount]
9 years 9 months ago
100 Lots on Bid. This chart was uploaded by Investor/RT 12.6.5 showing symbol: @ES#. |
View |
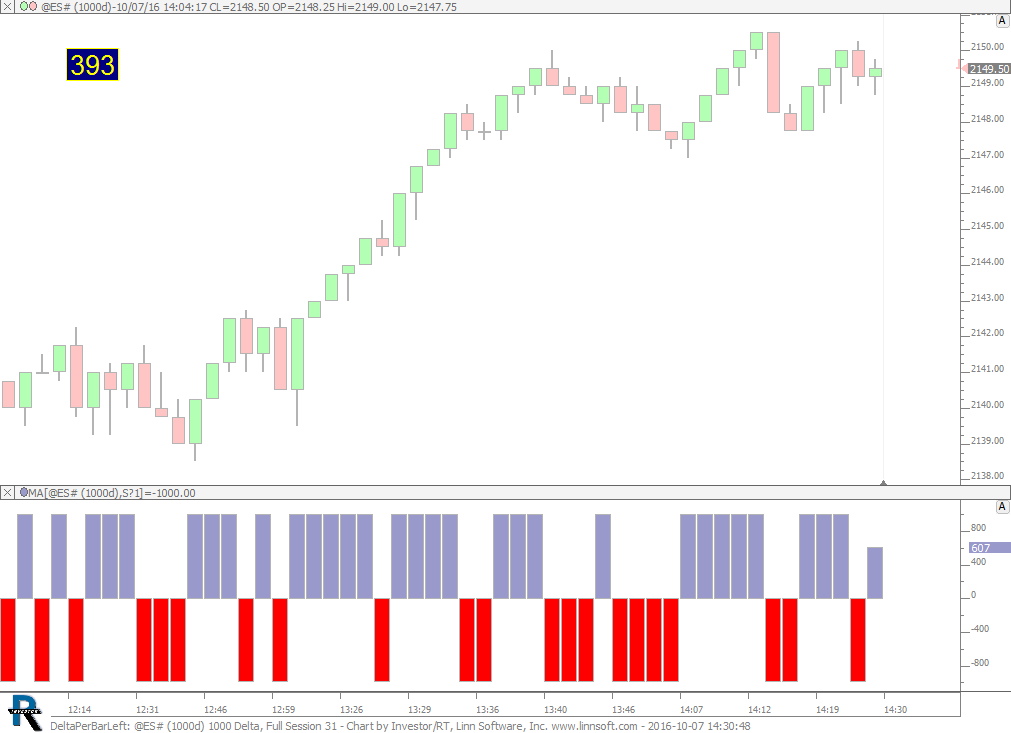 |
DeltaPerBarLeft (@ES#) cpayne [totalcount]
9 years 9 months ago
Delta Per Bar / BarLeft. This chart was uploaded by Investor/RT 12.6.5 showing symbol: @ES#. |
View |
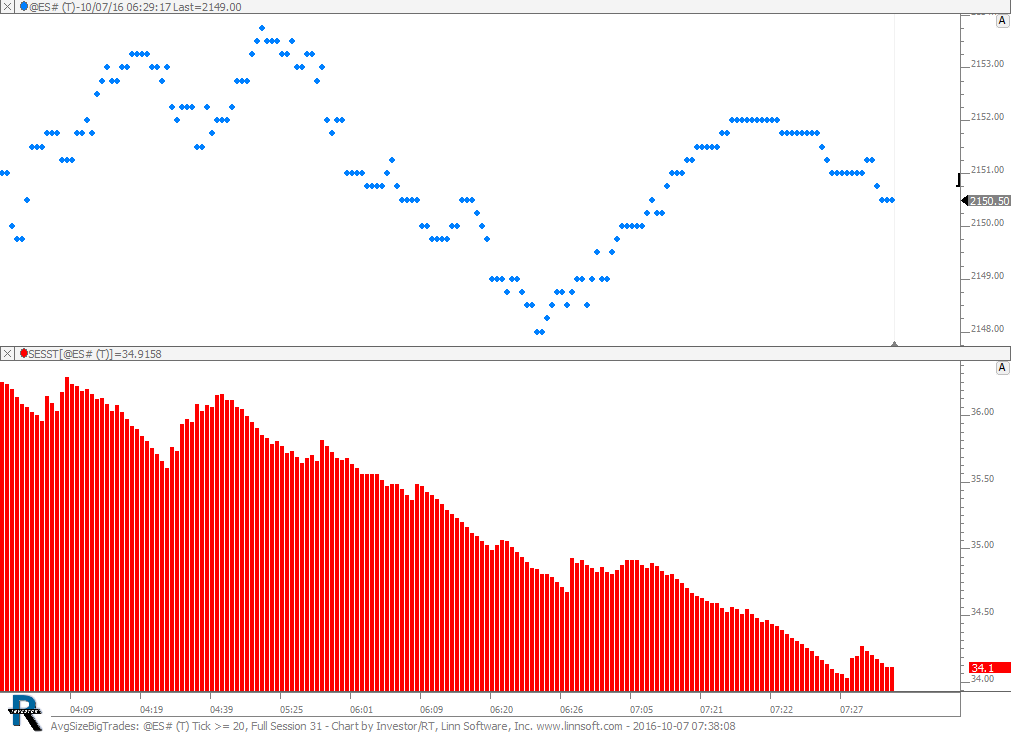 |
AvgSizeBigTrades (@ES#) cpayne [totalcount]
9 years 9 months ago
Average Size of All Big Trades in Chart. This chart was uploaded by Investor/RT 12.6.5 showing symbol: @ES#. |
View |
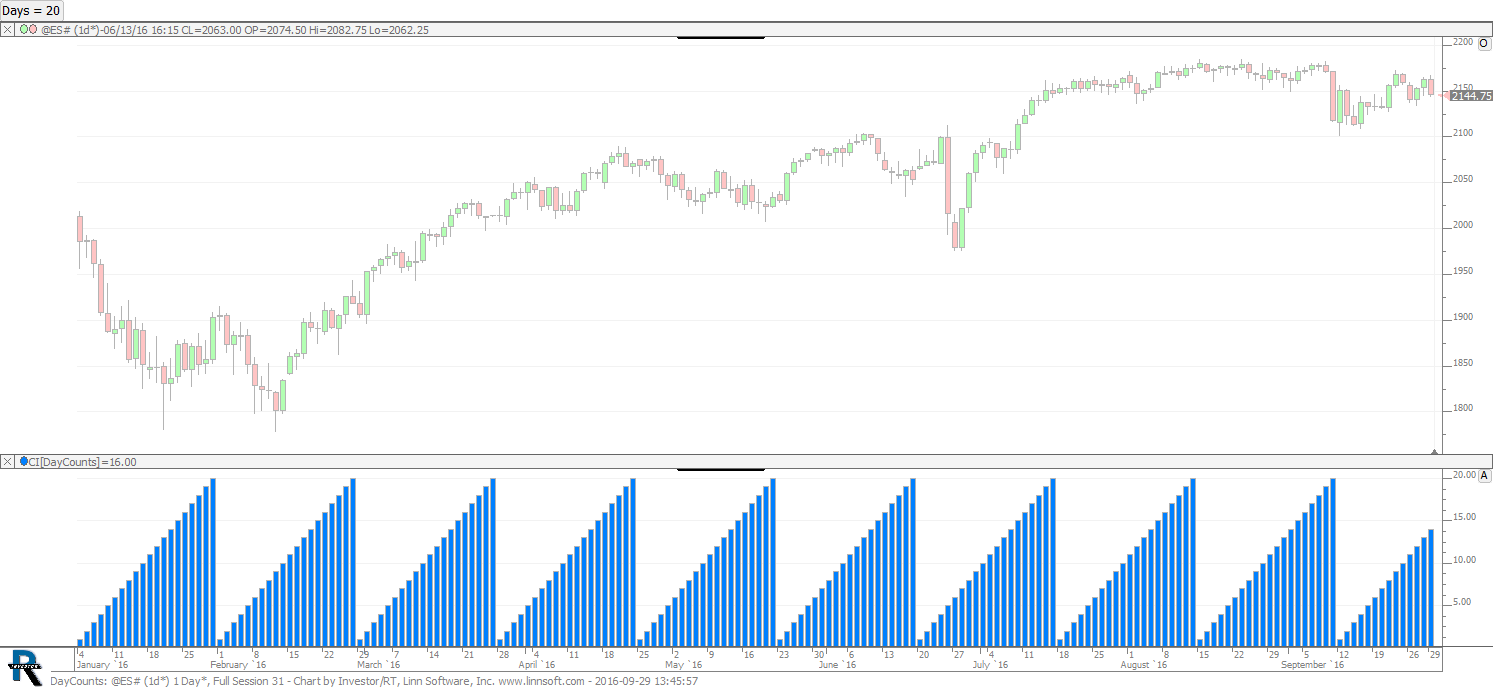 |
DayCounts (@ES#) cpayne [totalcount]
9 years 10 months ago
Day Counts. This chart was uploaded by Investor/RT 12.6.4 showing symbol: @ES#. |
View |
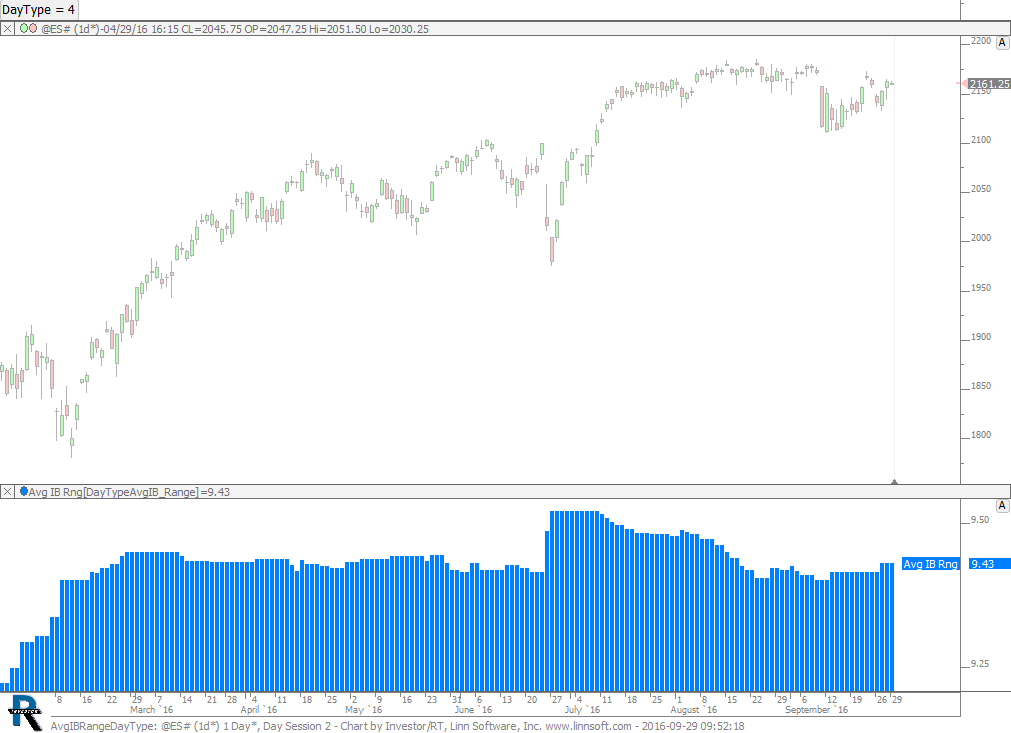 |
AvgIBRangeDayType (@ES#) cpayne [totalcount]
9 years 10 months ago
Average IB Range by Day Type. This chart was uploaded by Investor/RT 12.6.4 showing symbol: @ES#. |
View |
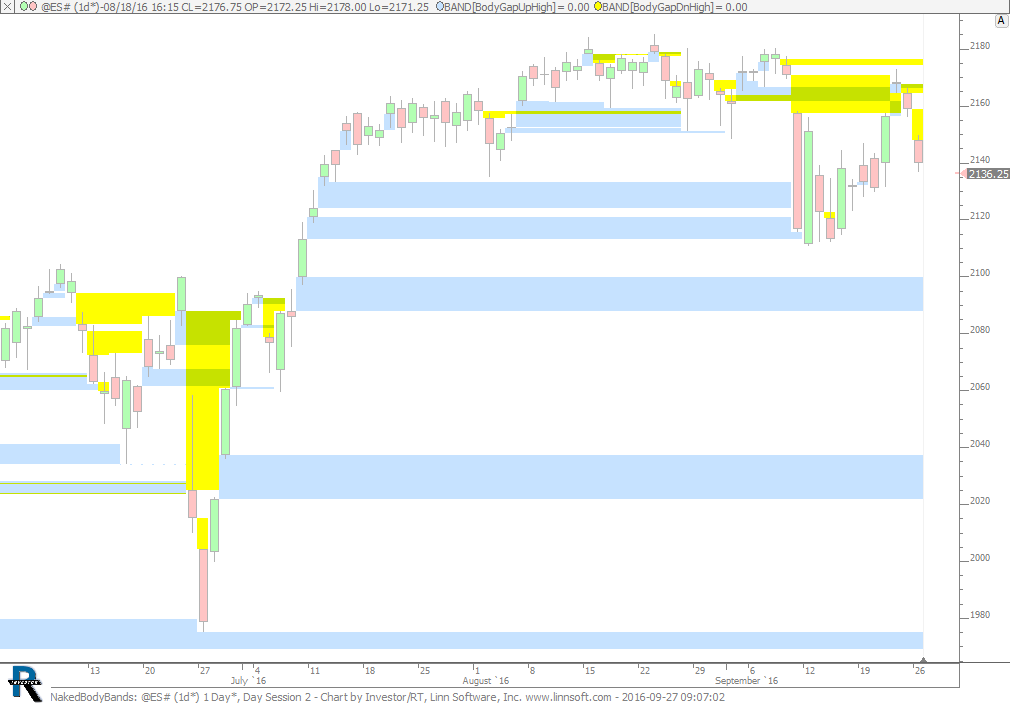 |
NakedBodyBands (@ES#) cpayne [totalcount]
9 years 10 months ago
Naked Body Bands. This chart was uploaded by Investor/RT 12.6.2 showing symbol: @ES#. |
View |
 |
CumDeltaNewHighLow (@ES#) 2 cpayne [totalcount]
9 years 10 months ago
Cum Delta Session High / Low. This chart was uploaded by Investor/RT 12.6.4 showing symbol: @ES#. |
View |
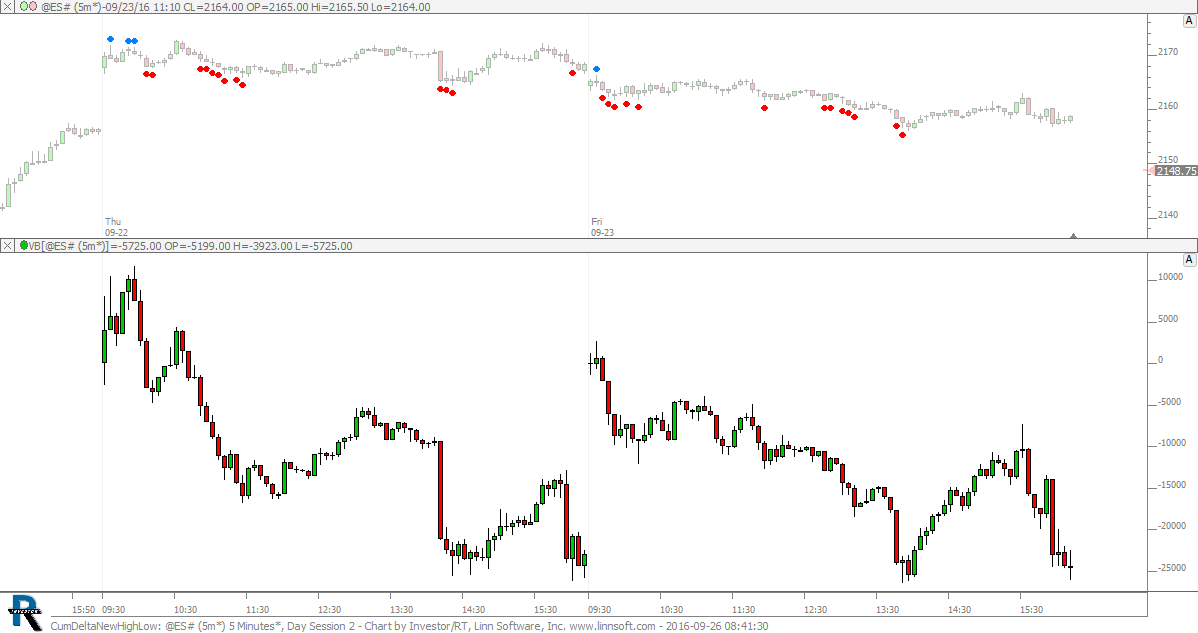 |
CumDeltaNewHighLow (@ES#) cpayne [totalcount]
9 years 10 months ago
Cumulative Delta New Session High/Lows. This chart was uploaded by Investor/RT 12.6.2 showing symbol: @ES#. |
View |