 |
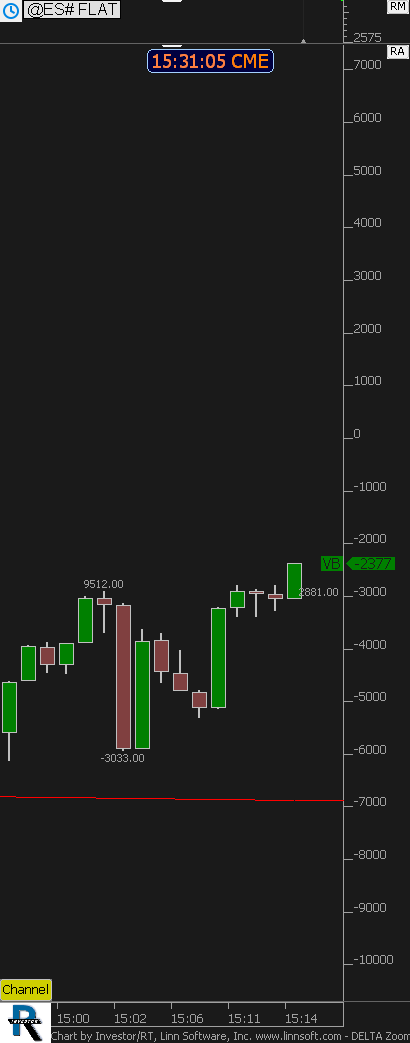
DELTA Zoom (@ES#) joseph-j-helminiak [totalcount]
7 years 3 months ago
Delta. This chart was uploaded by Investor/RT 13.5.24 showing symbol: @ES#. |
View |
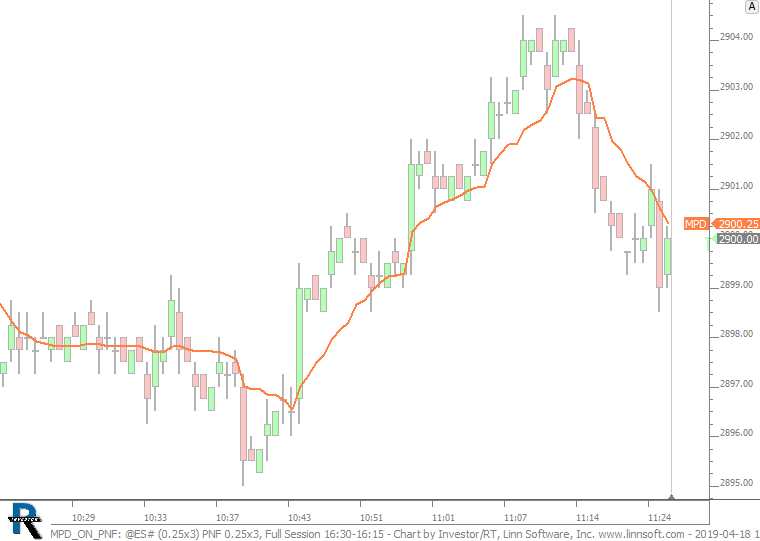 |
MPD ON PNF (@ES#) cpayne [totalcount]
7 years 3 months ago
This chart was uploaded by Investor/RT 13.5.24 showing symbol: @ES#. |
View |
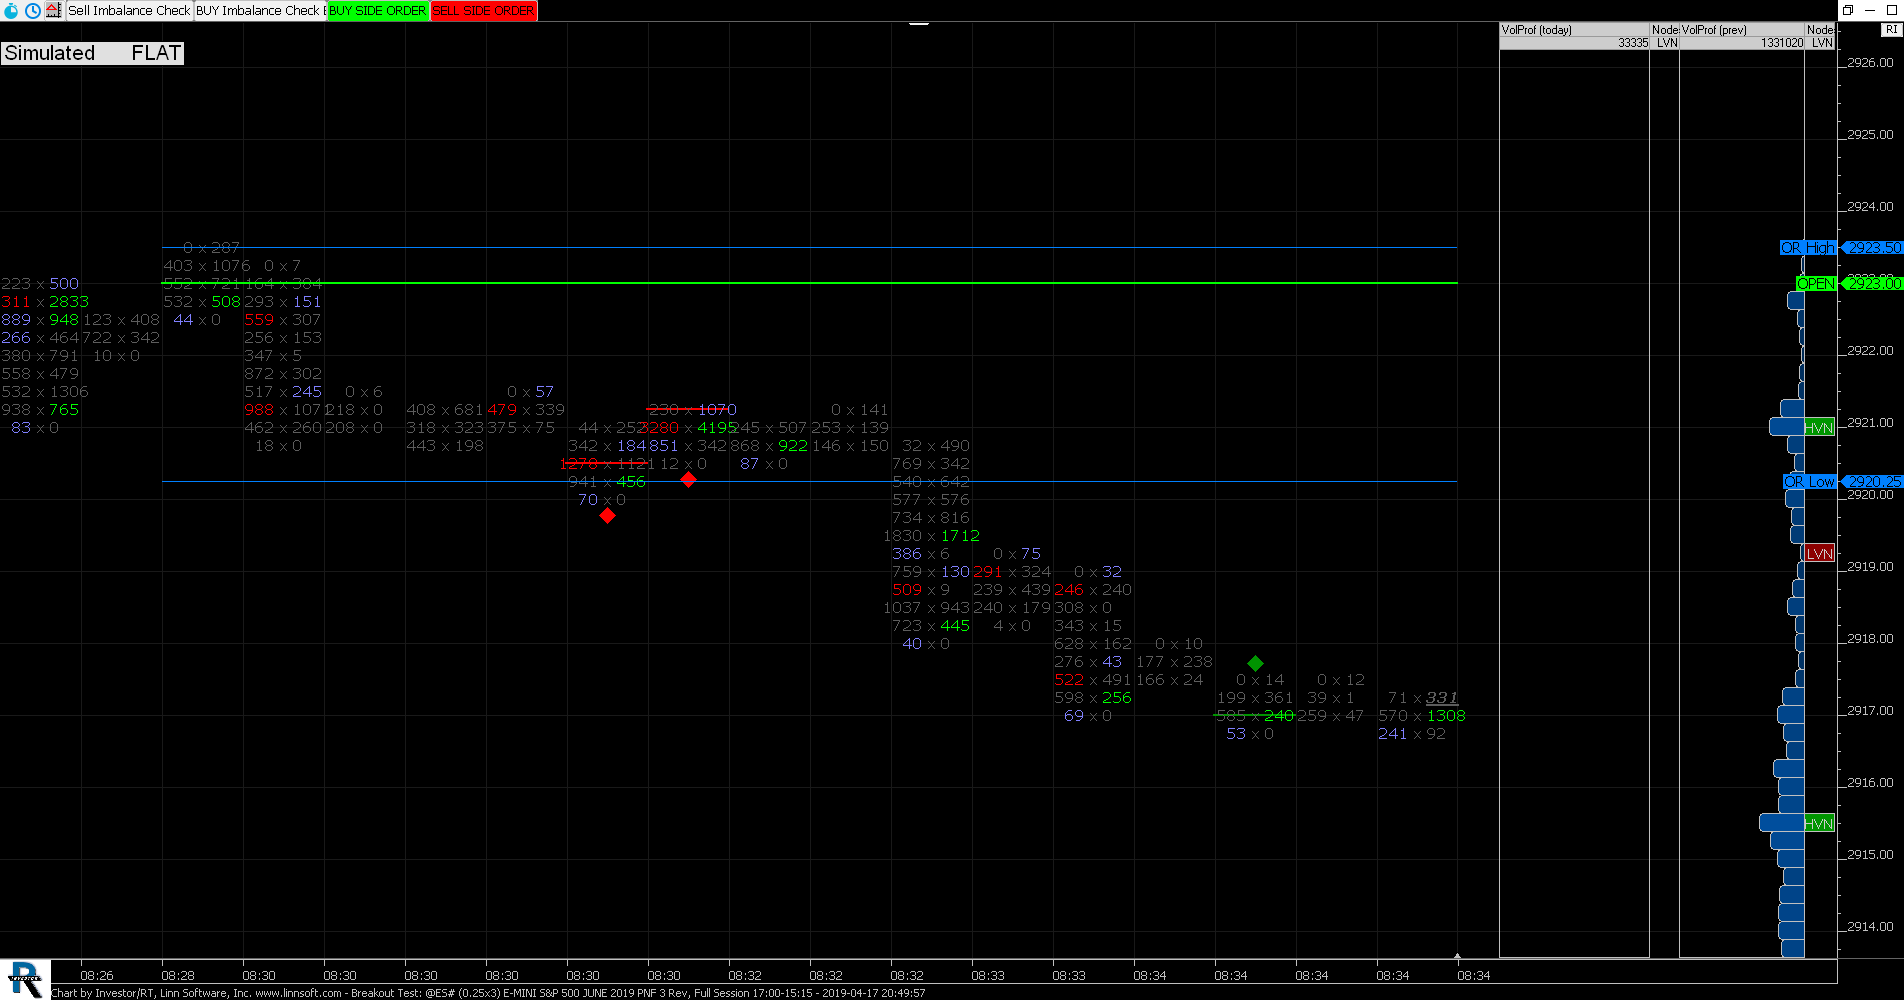 |
Breakout Test (@ES#) joseph-j-helminiak [totalcount]
7 years 3 months ago
ES OR Breakout trade w/VolumeScope AND Imbalance. This chart was uploaded by Investor/RT 13.5.24 showing symbol: @ES#. |
View |
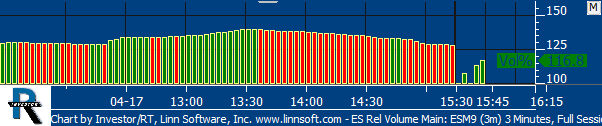 |
ES Rel Volume Main (ESM9) scottz46 [totalcount]
7 years 3 months ago
This chart was uploaded by Investor/RT 13.5.24 showing symbol: ESM9. |
View |
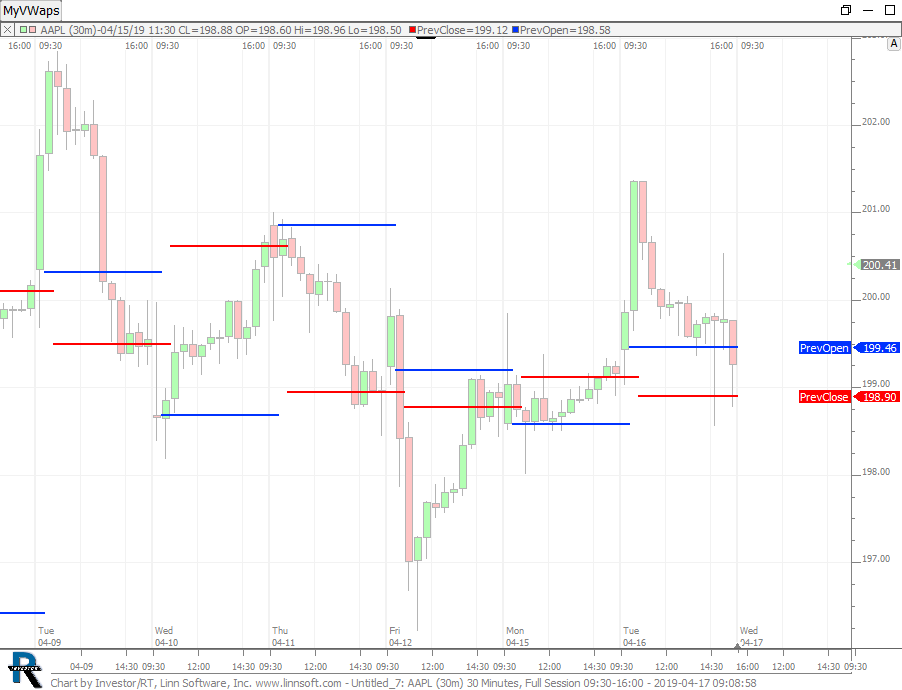 |
Untitled 7 (AAPL) scooke [totalcount]
7 years 3 months ago
This chart was uploaded by Investor/RT 13.5.24 showing symbol: AAPL. |
View |
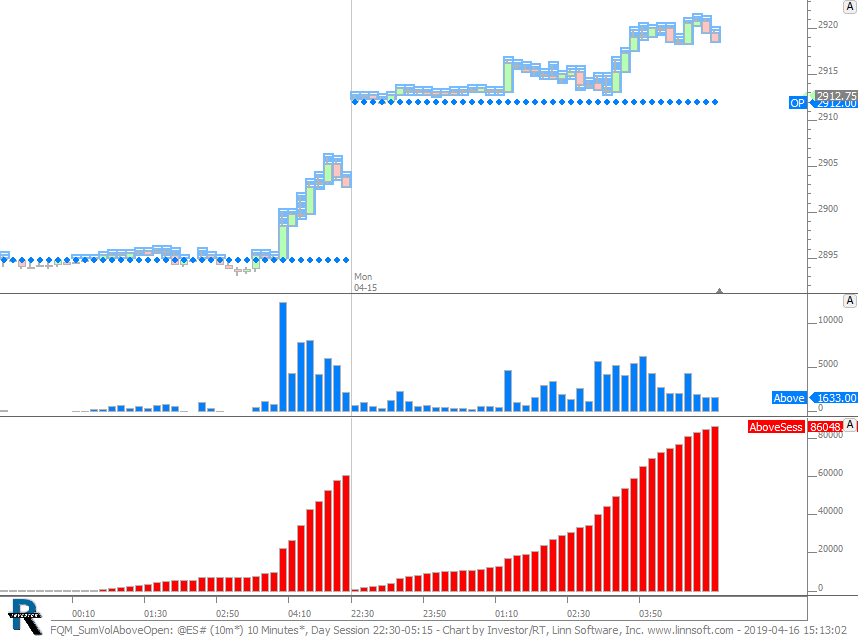 |
FQM SumVolAboveOpen (@ES#) cpayne [totalcount]
7 years 3 months ago
This chart was uploaded by Investor/RT 13.5.24 showing symbol: @ES#. |
View |
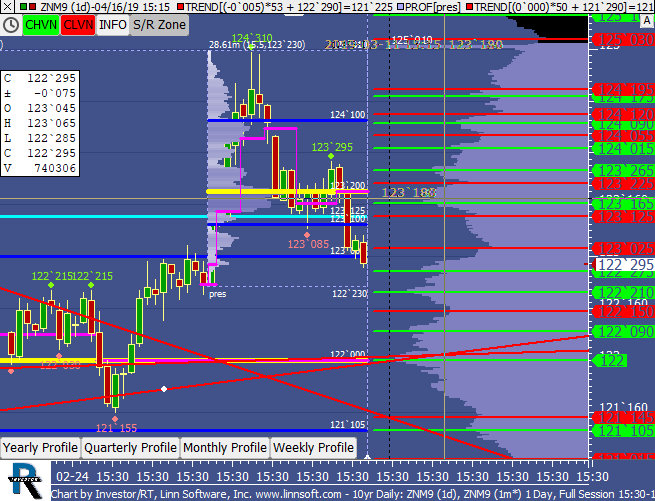 |
10yr Daily (ZNM9) scottz46 [totalcount]
7 years 3 months ago
This chart was uploaded by Investor/RT 13.5.24 showing symbol: ZNM9. |
View |
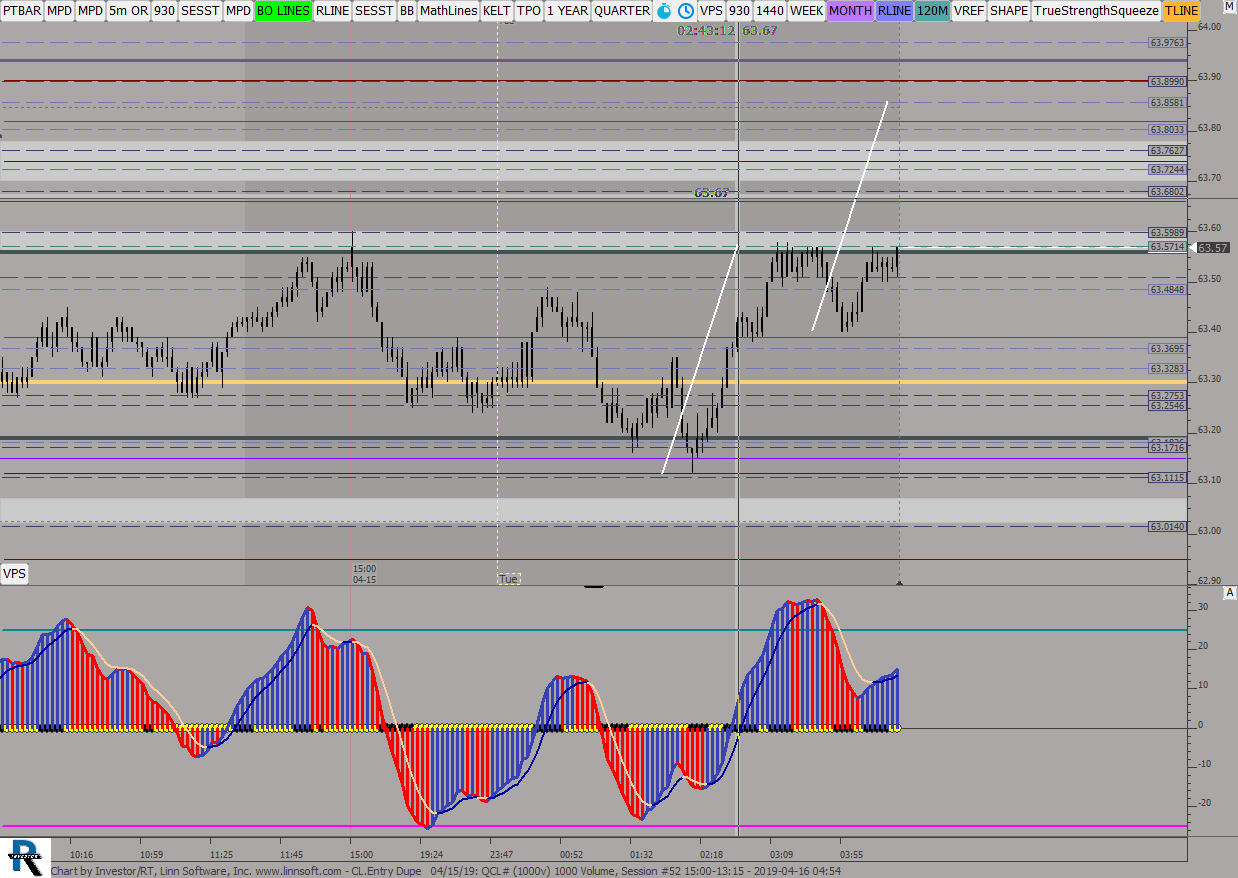 |
CLEntry Dupe 04 15 (QCL#) ES42 [totalcount]
7 years 3 months ago
This chart was uploaded by Investor/RT 13.5.24 showing symbol: QCL#. |
View |
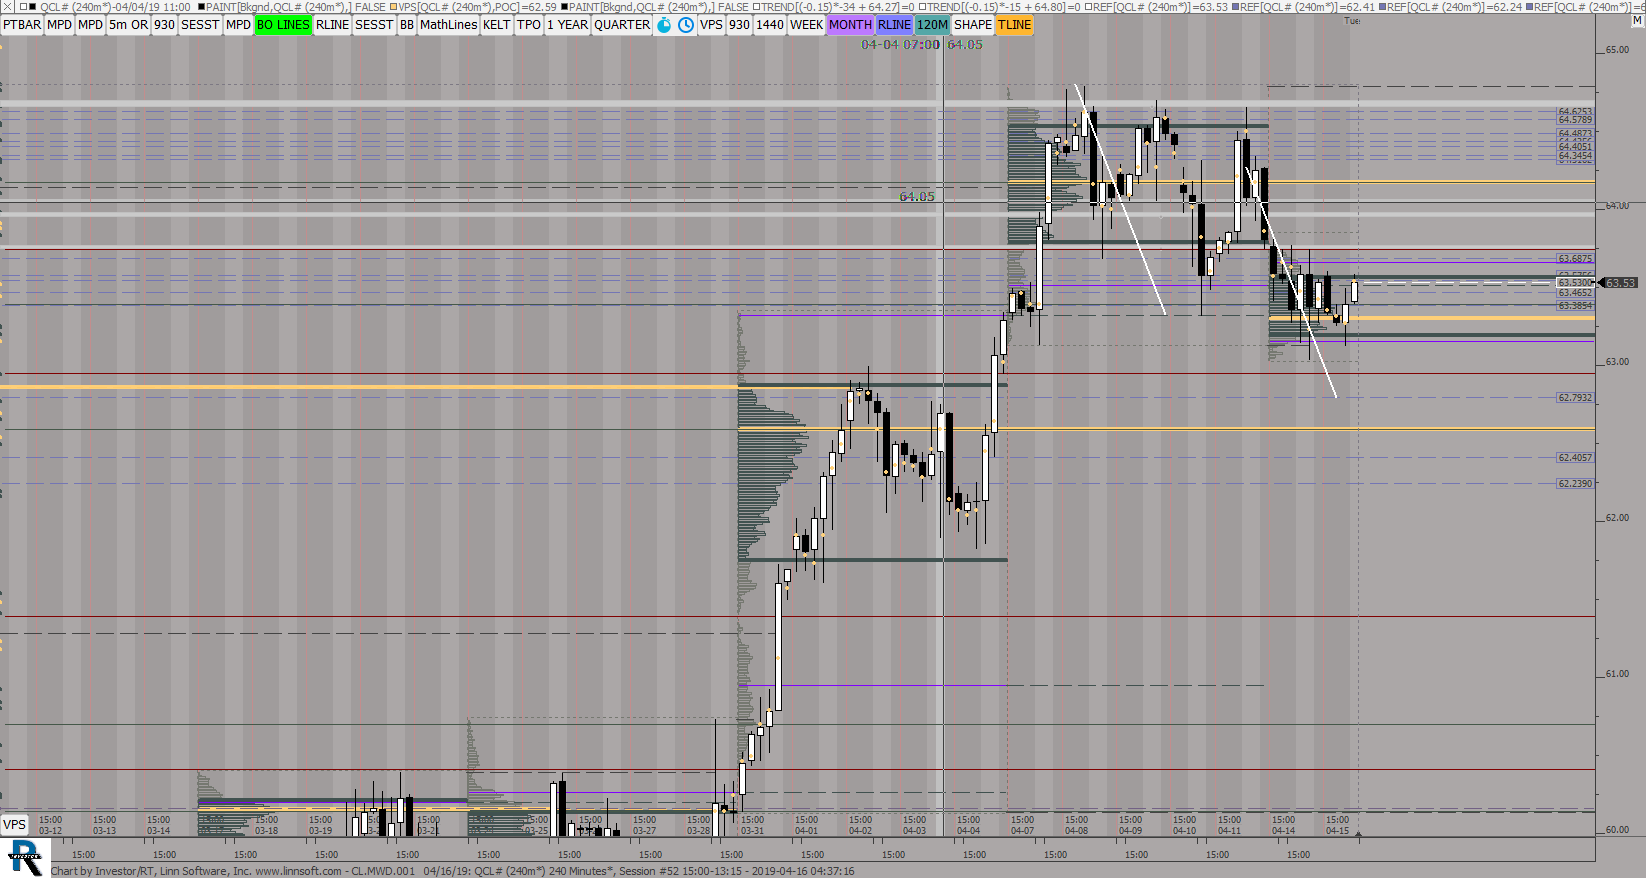 |
CLMWD001 04 16 (QCL#) ES42 [totalcount]
7 years 3 months ago
This chart was uploaded by Investor/RT 13.5.24 showing symbol: QCL#. |
View |
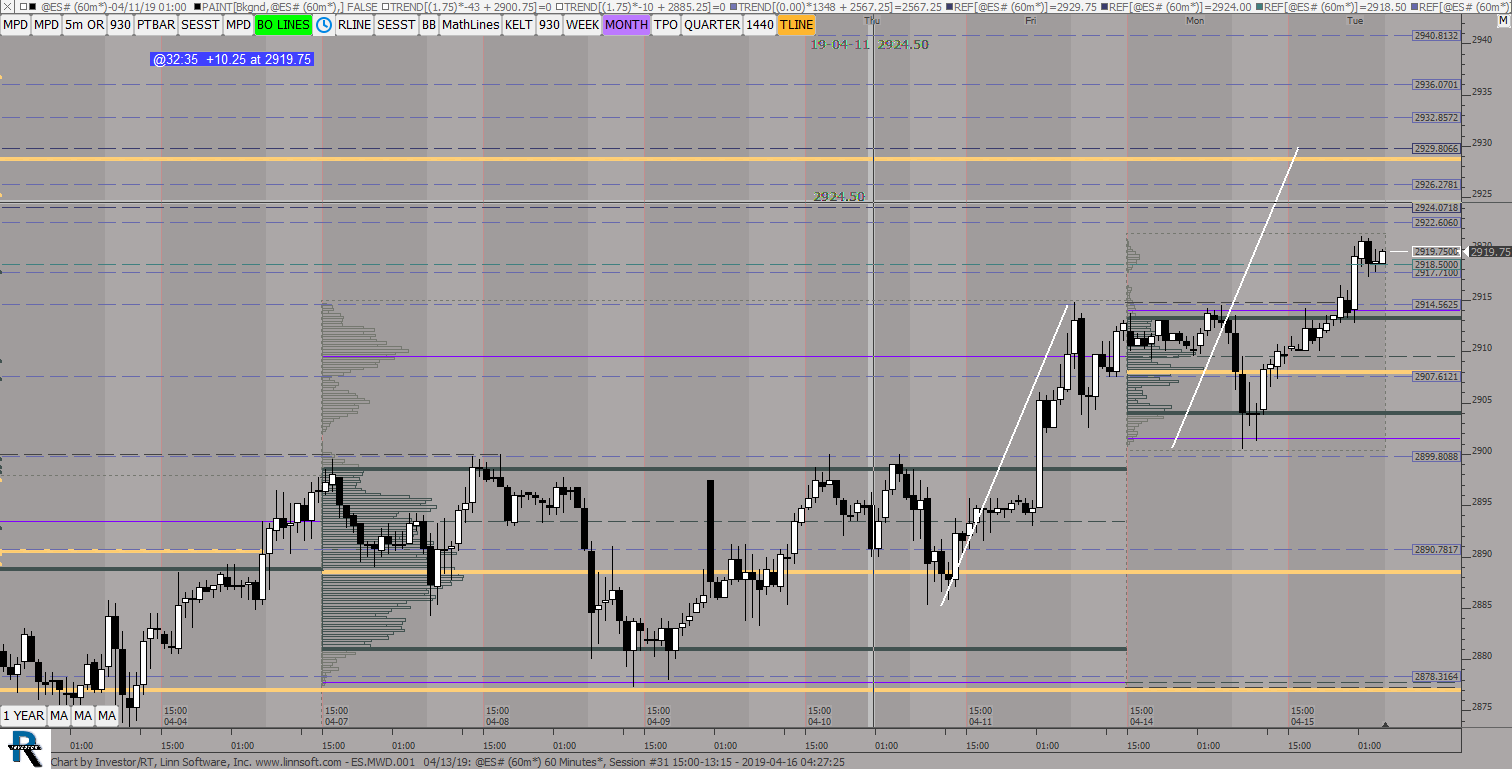 |
ESMWD001 04 13 (@ES#) ES42 [totalcount]
7 years 3 months ago
This chart was uploaded by Investor/RT 13.5.24 showing symbol: @ES#. |
View |
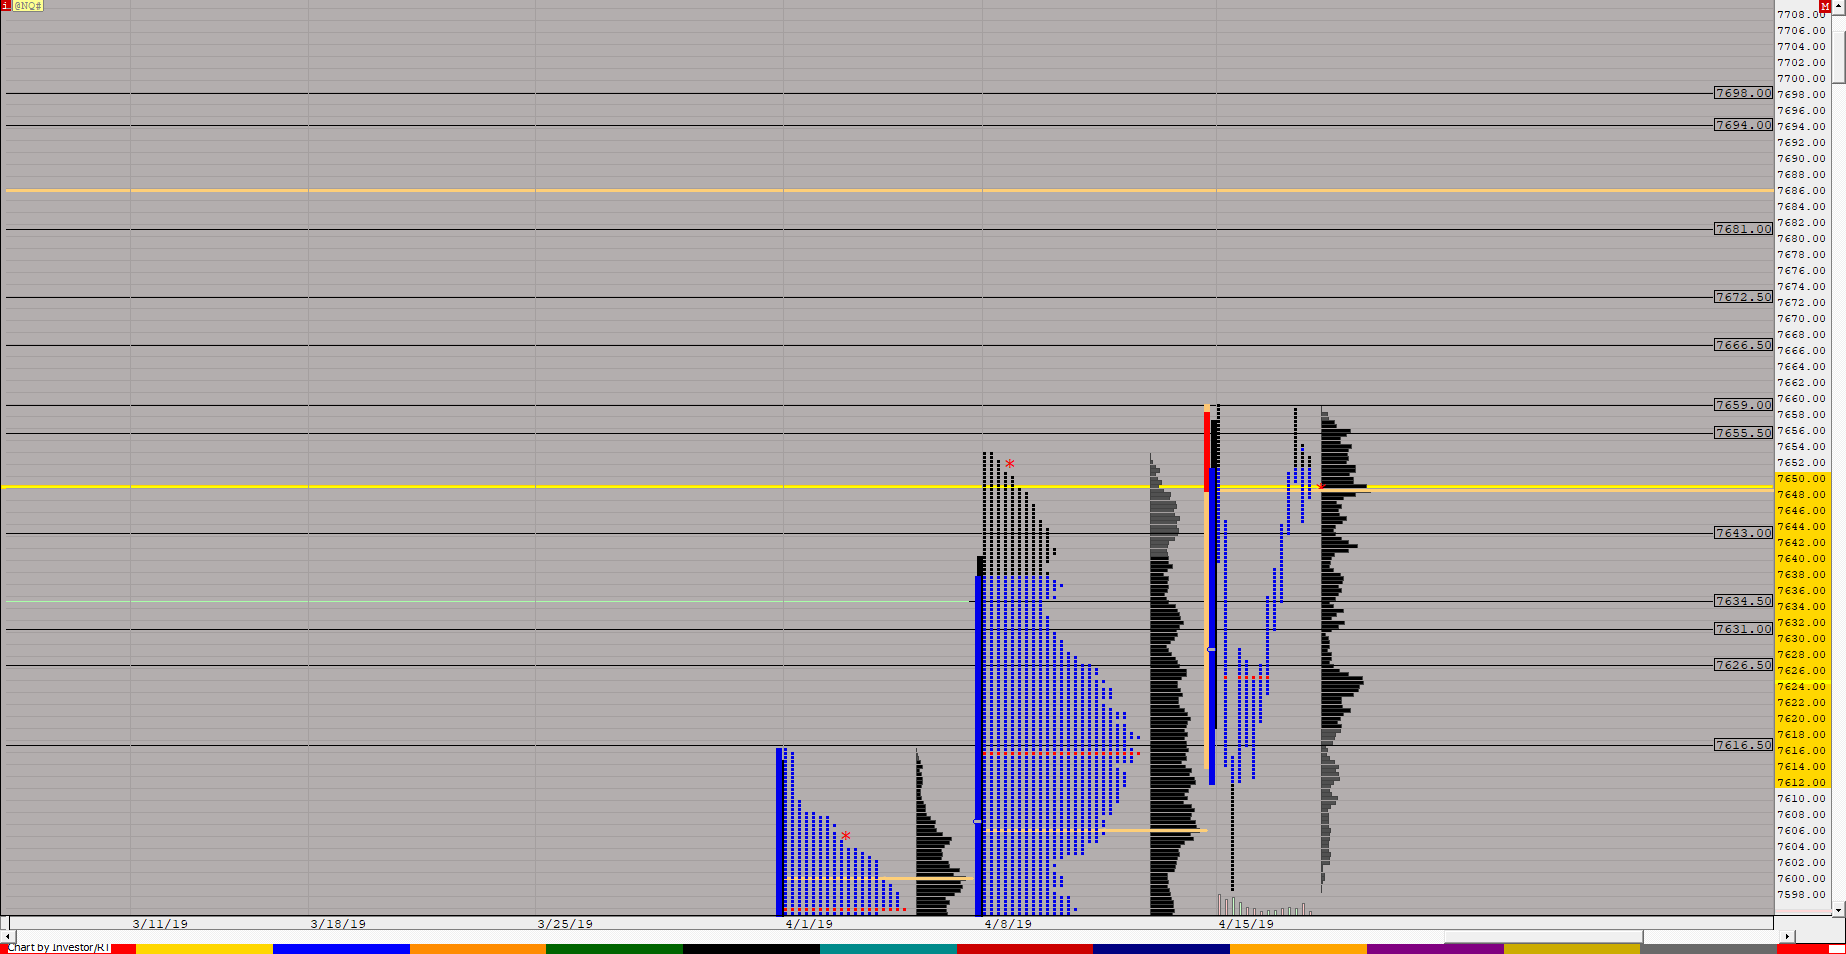 |
NQ MP (@NQ#) ES42 [totalcount]
7 years 3 months ago
This chart was uploaded by Investor/RT 13.5.24 showing symbol: @NQ#. |
View |
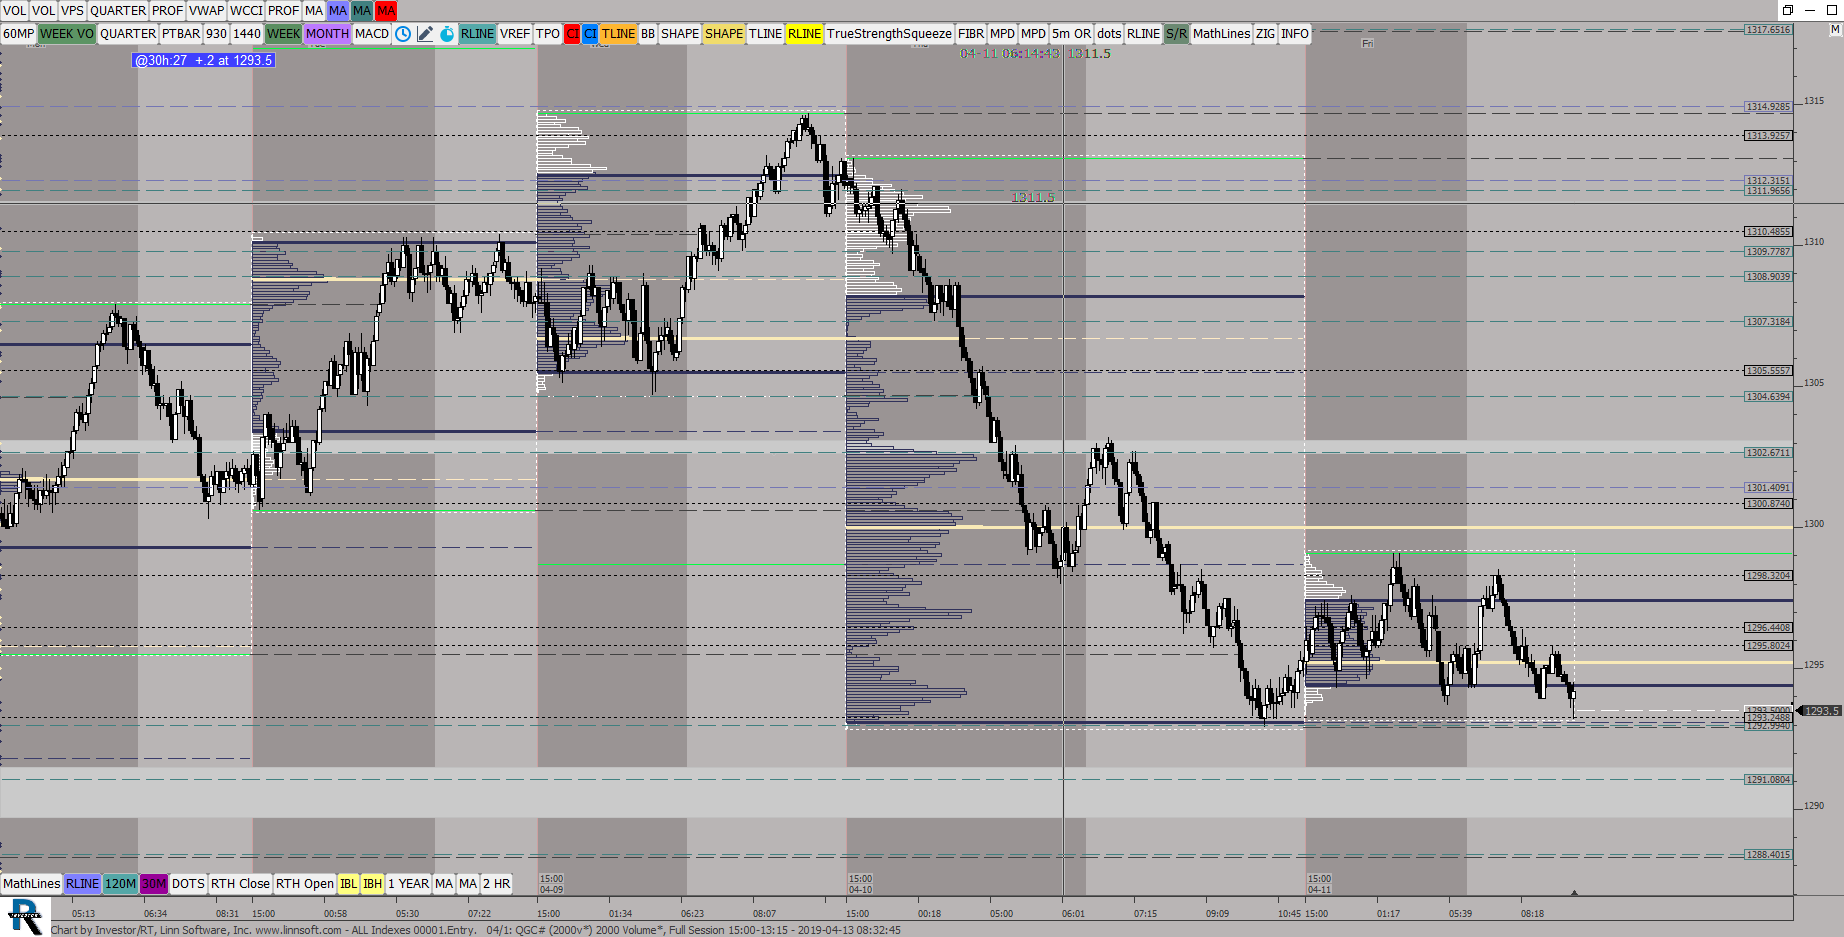 |
ALL Indexes 00001Entry 04 (QGC#) ES42 [totalcount]
7 years 3 months ago
This chart was uploaded by Investor/RT 13.5.24 showing symbol: QGC#. |
View |
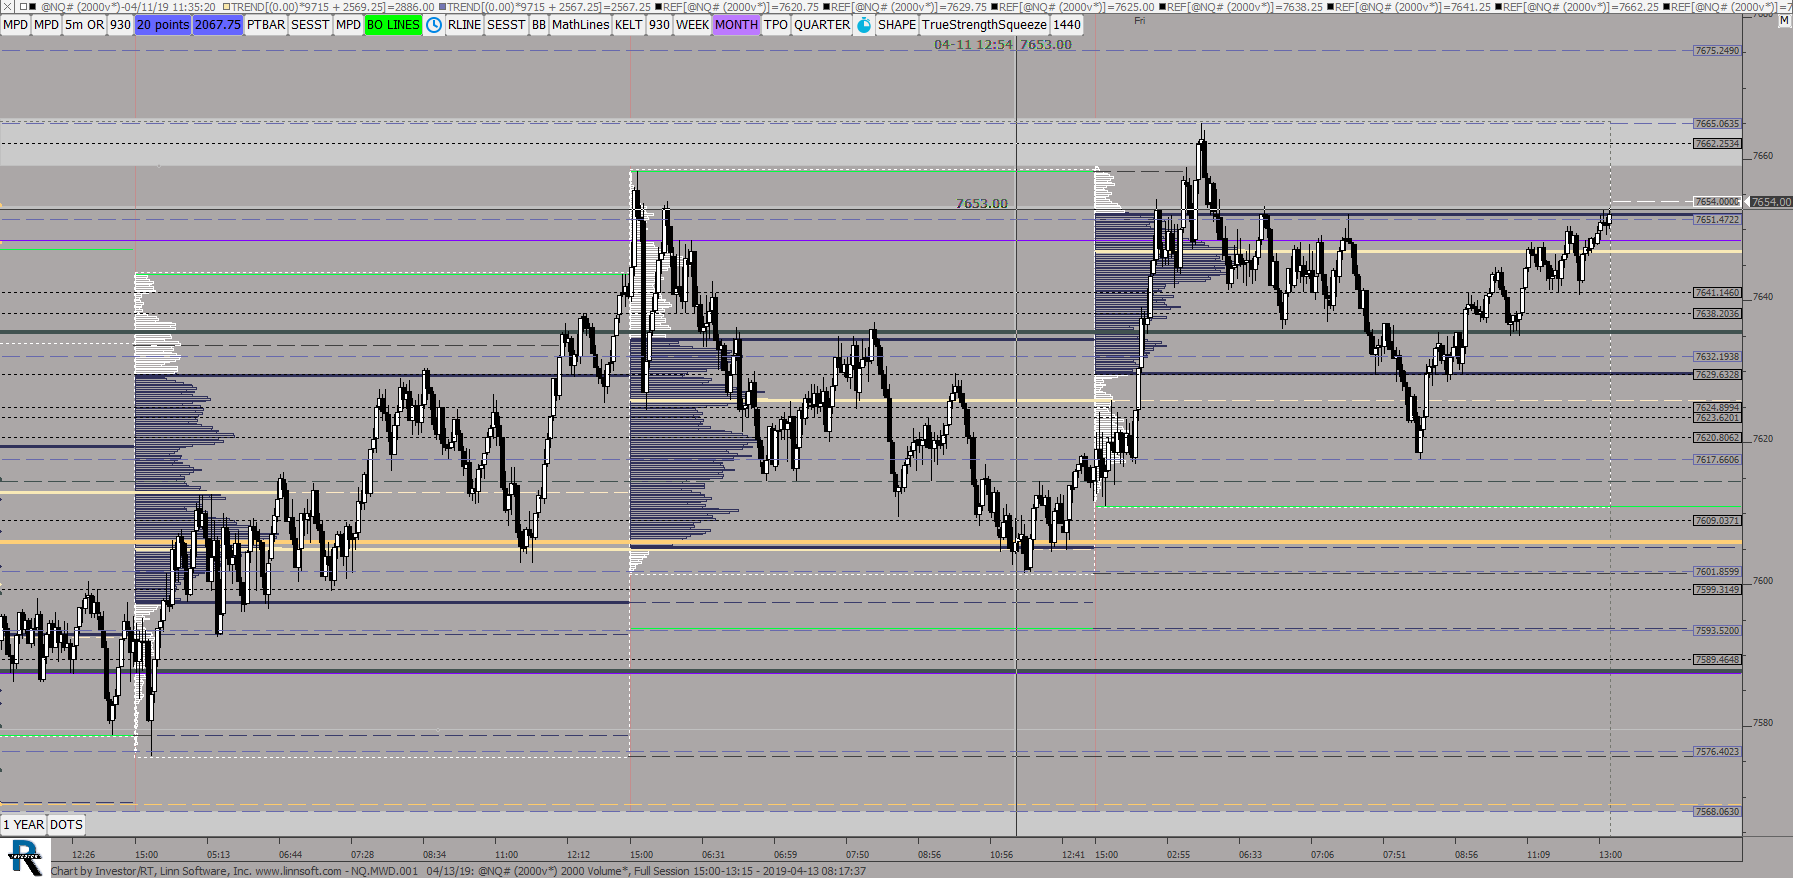 |
NQMWD001 04 13 (@NQ#) ES42 [totalcount]
7 years 3 months ago
This chart was uploaded by Investor/RT 13.5.24 showing symbol: @NQ#. |
View |
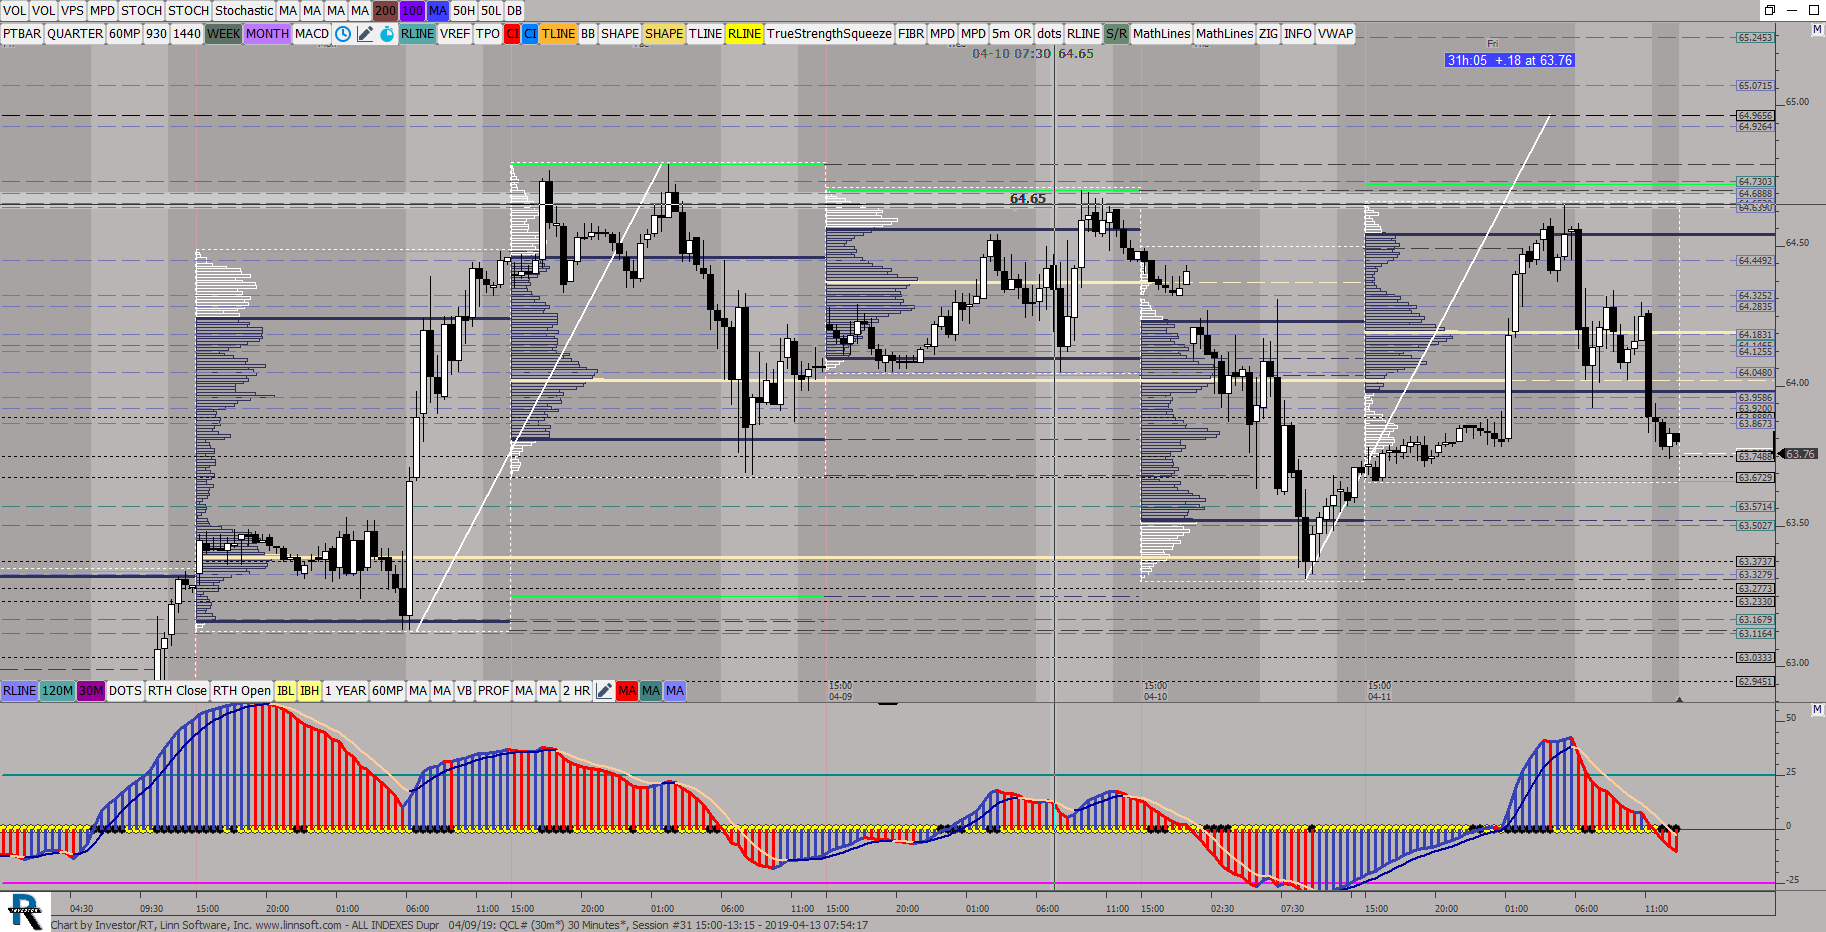 |
ALL INDEXES Dupr 04 09 (QCL#) ES42 [totalcount]
7 years 3 months ago
This chart was uploaded by Investor/RT 13.5.24 showing symbol: QCL#. |
View |
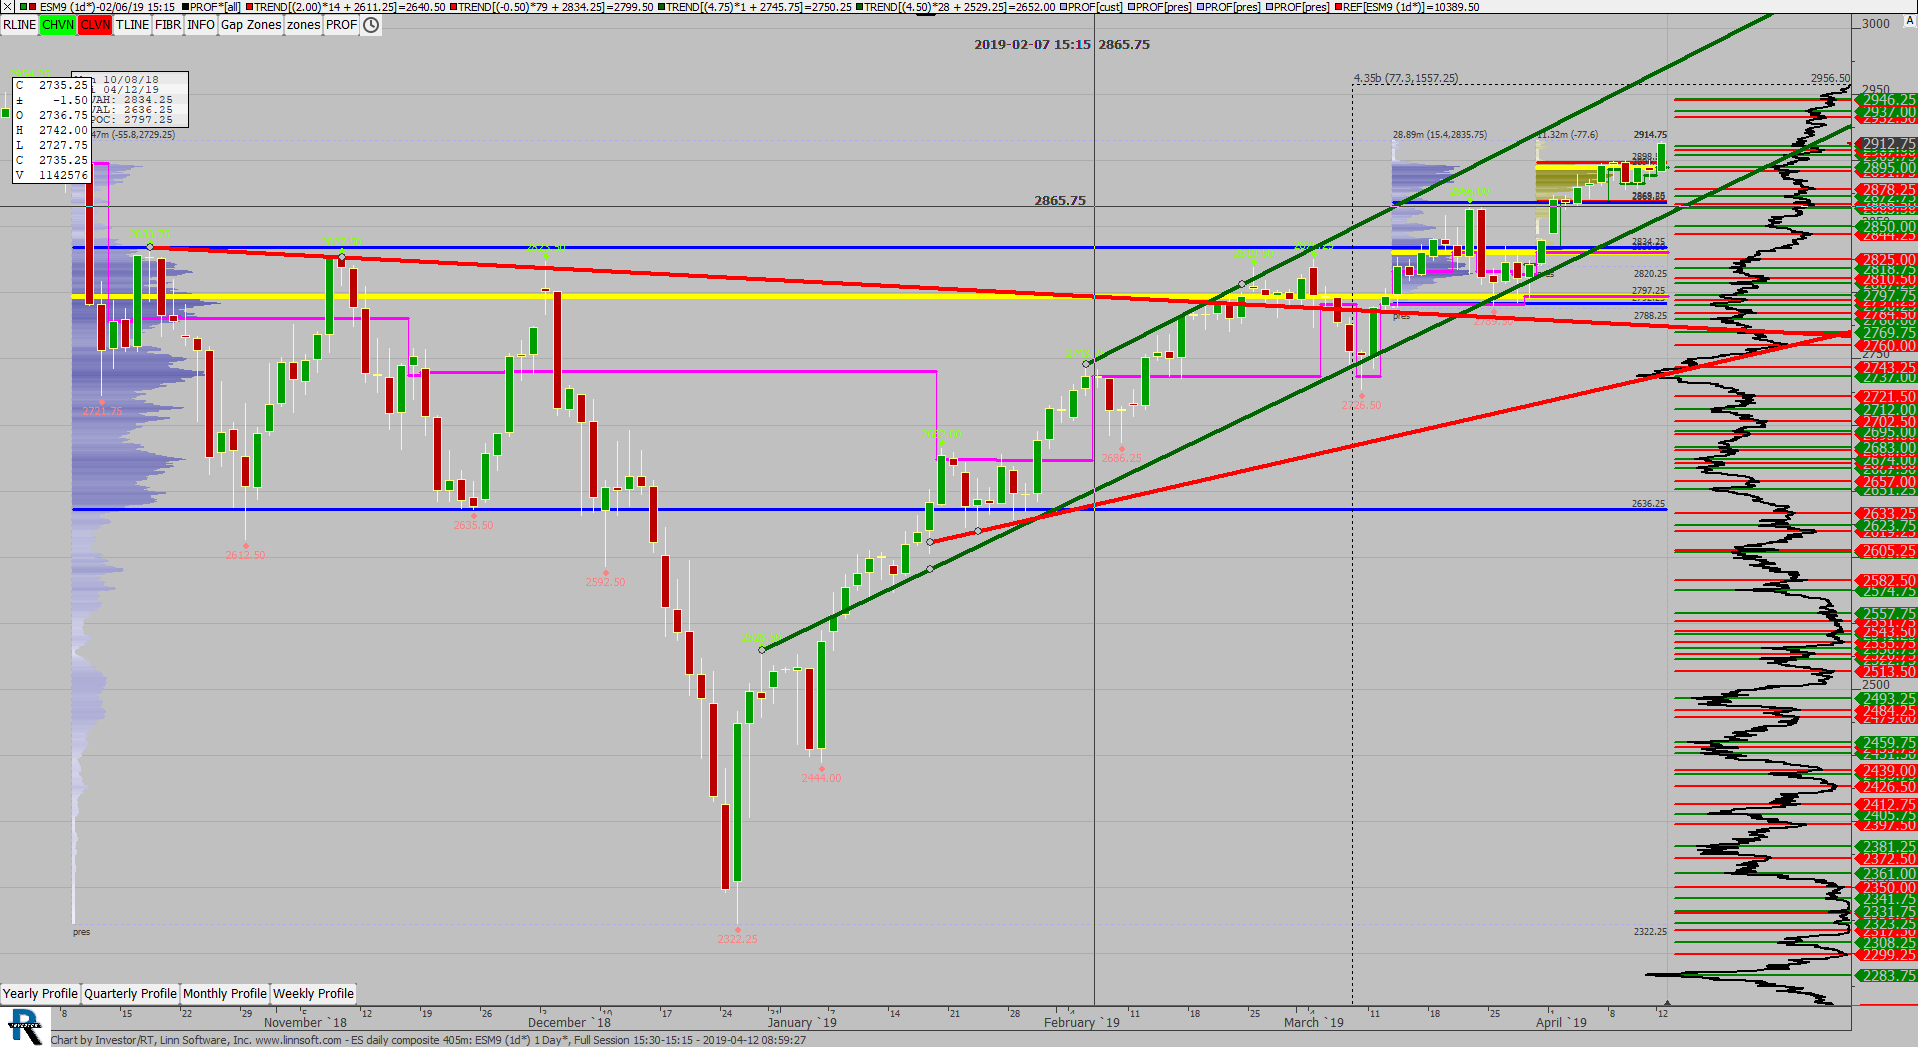 |
ES daily composite 405m (ESM9) scottz46 [totalcount]
7 years 3 months ago
This chart was uploaded by Investor/RT 13.5.21 showing symbol: ESM9. |
View |
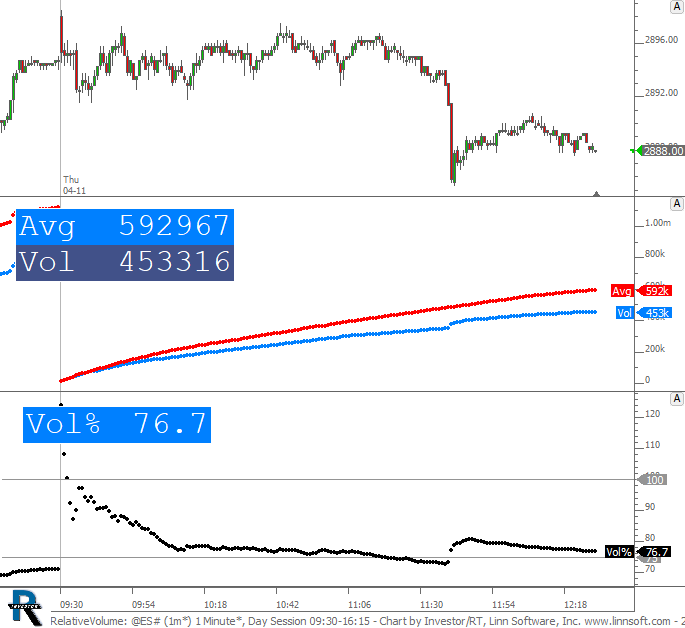 |
RelativeVolume (@ES#) cpayne [totalcount]
7 years 3 months ago
Relative Volume - Lower pane shows what percent of average volume we've achieved at each minute of the session. |
View |
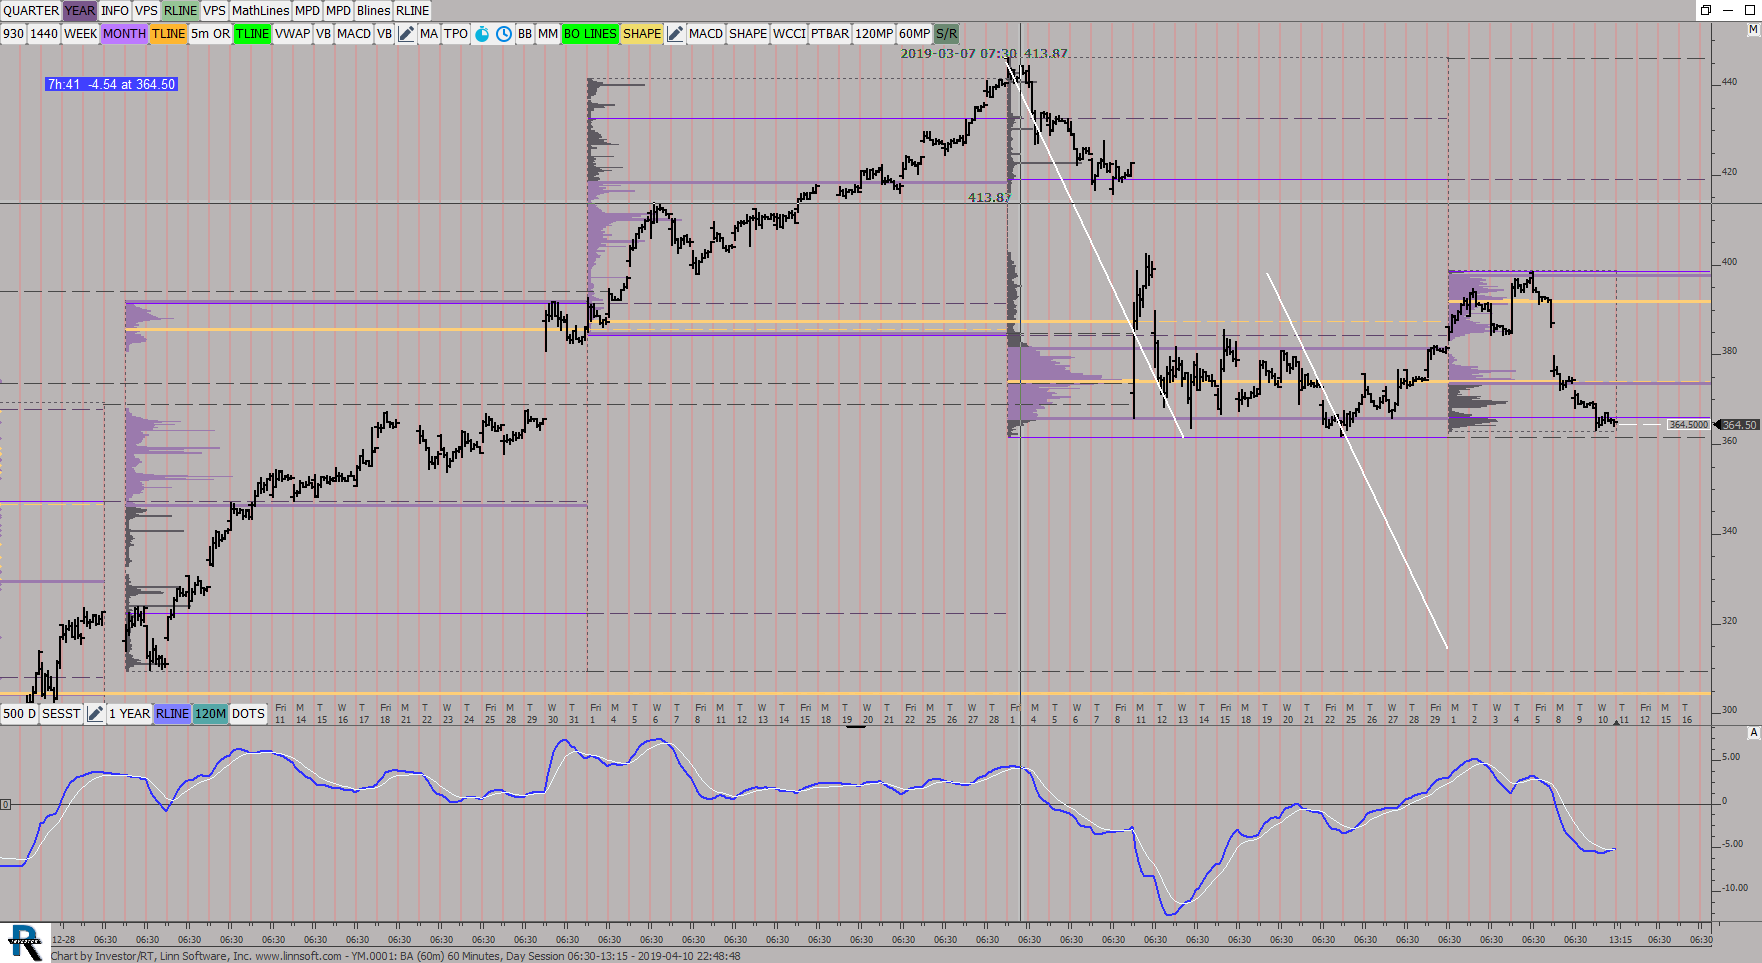 |
YM (BA) ES42 [totalcount]
7 years 3 months ago
BA Measured move. This chart was uploaded by Investor/RT 13.5.23 showing symbol: BA. |
View |
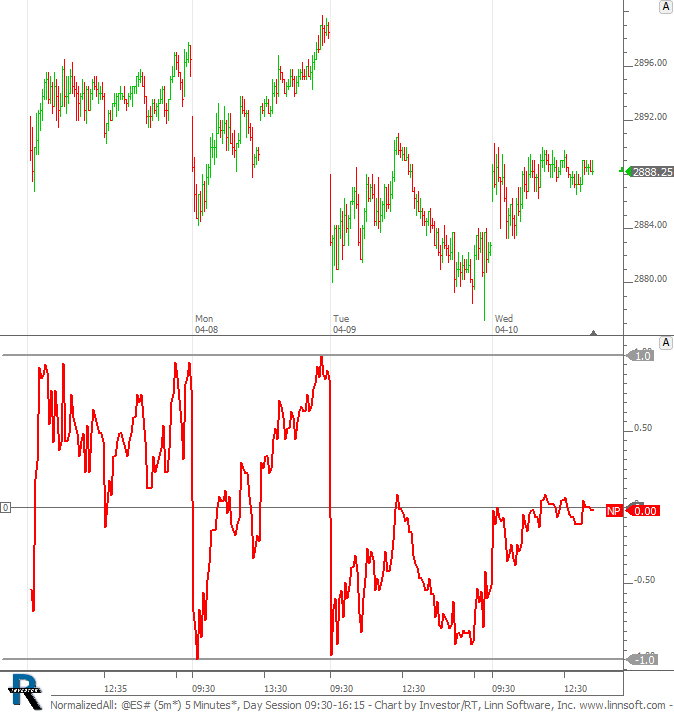 |
NormalizedAll (@ES#) cpayne [totalcount]
7 years 3 months ago
Normalized Price - Full Chart Range. This chart was uploaded by Investor/RT 13.5.24 showing symbol: @ES#. |
View |
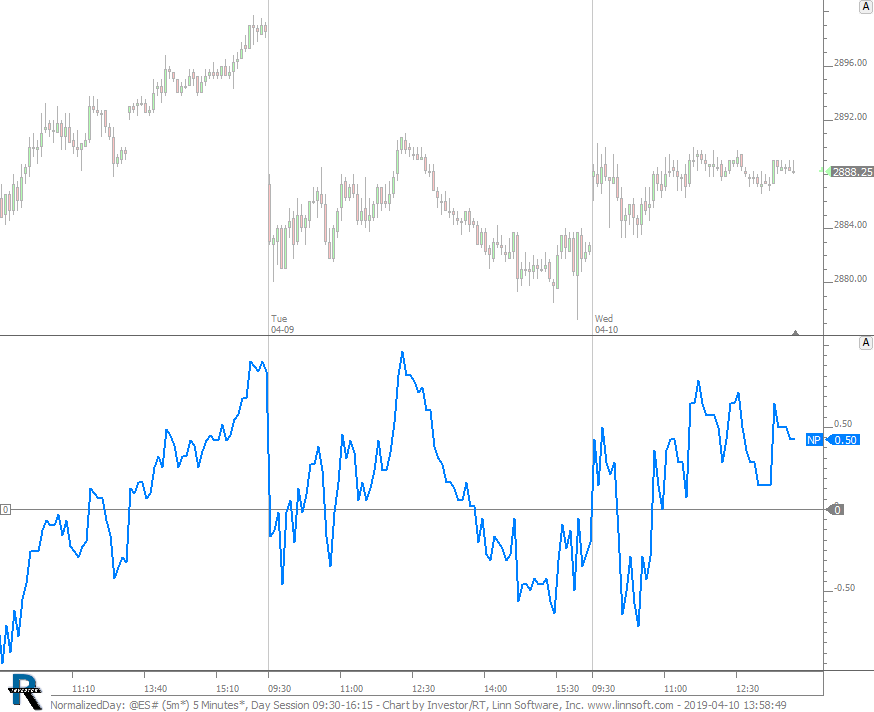 |
NormalizedDay (@ES#) cpayne [totalcount]
7 years 3 months ago
Normalized Price - Reset Each Day. This chart was uploaded by Investor/RT 13.5.24 showing symbol: @ES#. |
View |
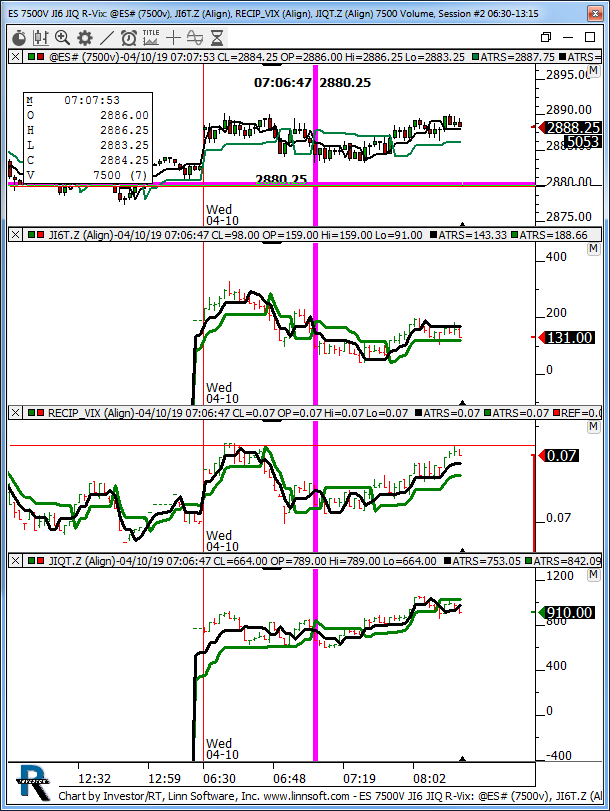 |
ES 7500V JI6 JIQ R Vix (@ES#) kencassorla [totalcount]
7 years 3 months ago
r vix. This chart was uploaded by Investor/RT 13.5.21 showing symbol: @ES#. |
View |
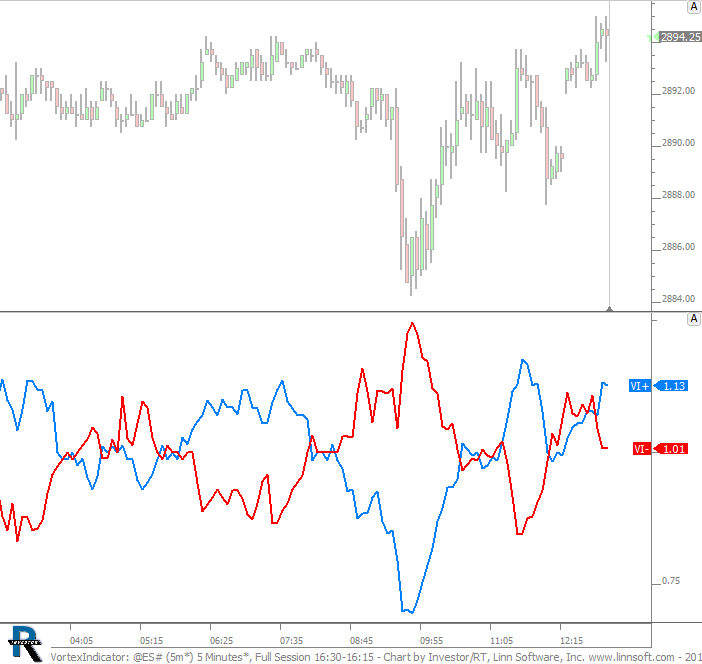 |
VortexIndicator (@ES#) cpayne [totalcount]
7 years 3 months ago
Vortex Indicator. This chart was uploaded by Investor/RT 13.5.24 showing symbol: @ES#. |
View |
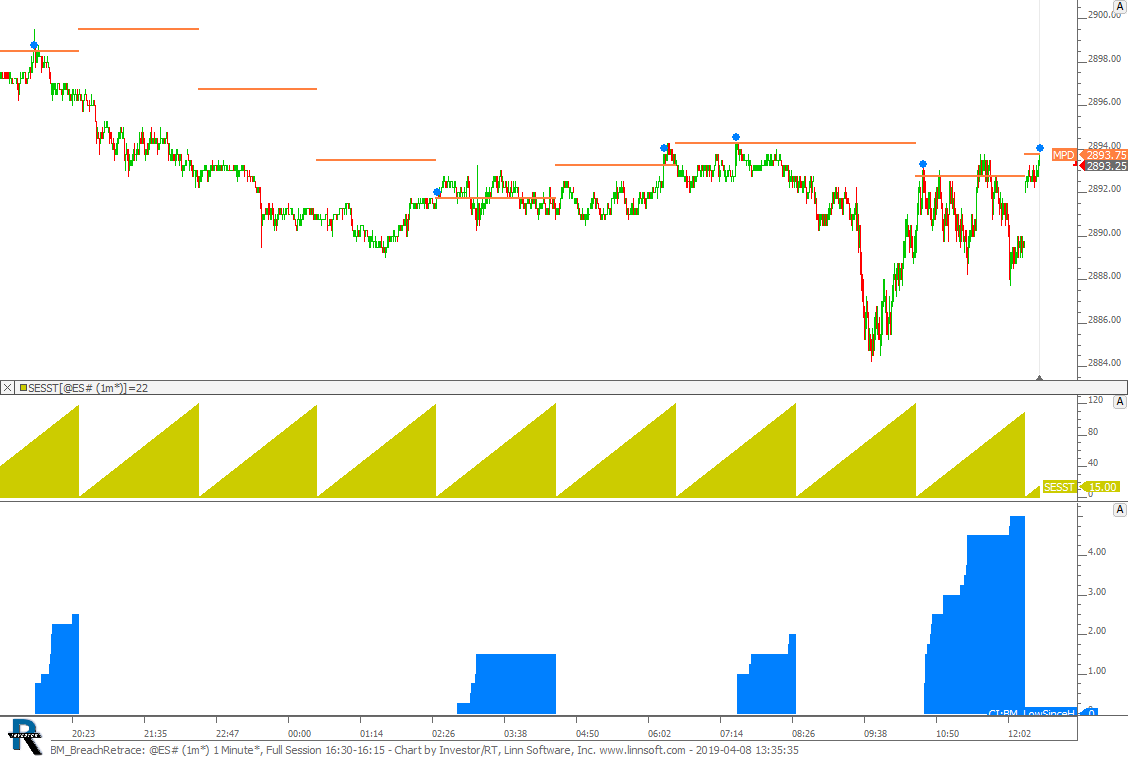 |
BM BreachRetrace (@ES#) cpayne [totalcount]
7 years 3 months ago
This chart was uploaded by Investor/RT 13.5.24 showing symbol: @ES#. |
View |
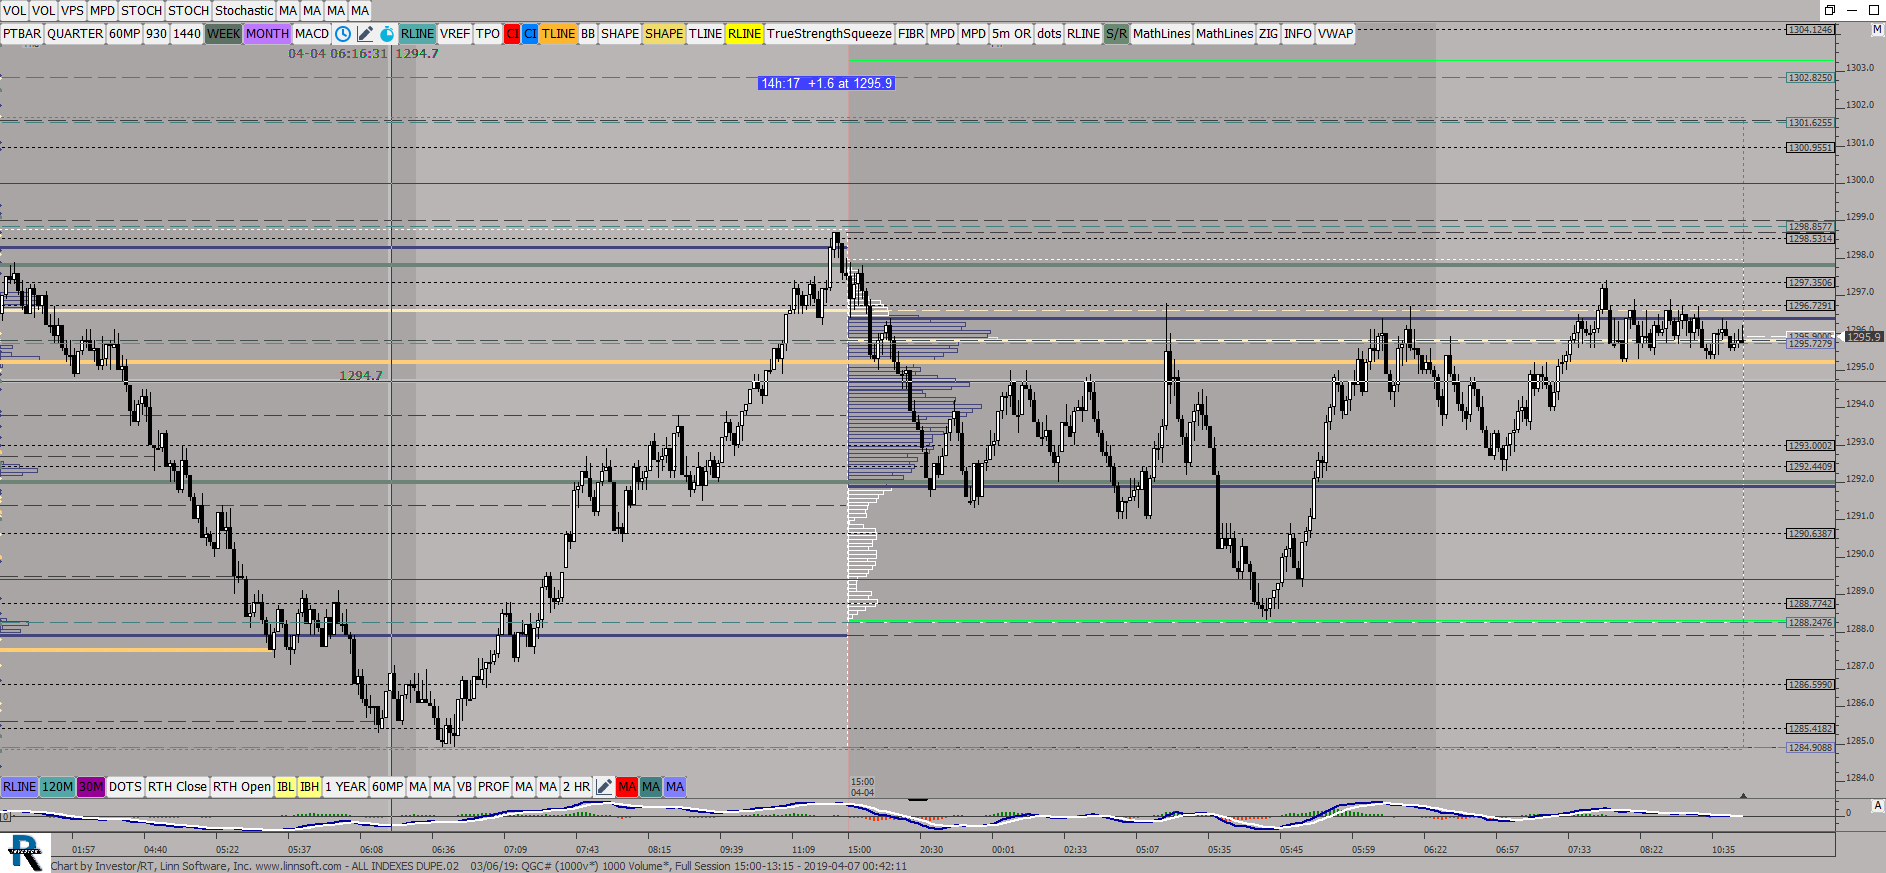 |
ALL INDEXES DUPE02 03 06 (QGC#) ES42 [totalcount]
7 years 3 months ago
This chart was uploaded by Investor/RT 13.5.23 showing symbol: QGC#. |
View |
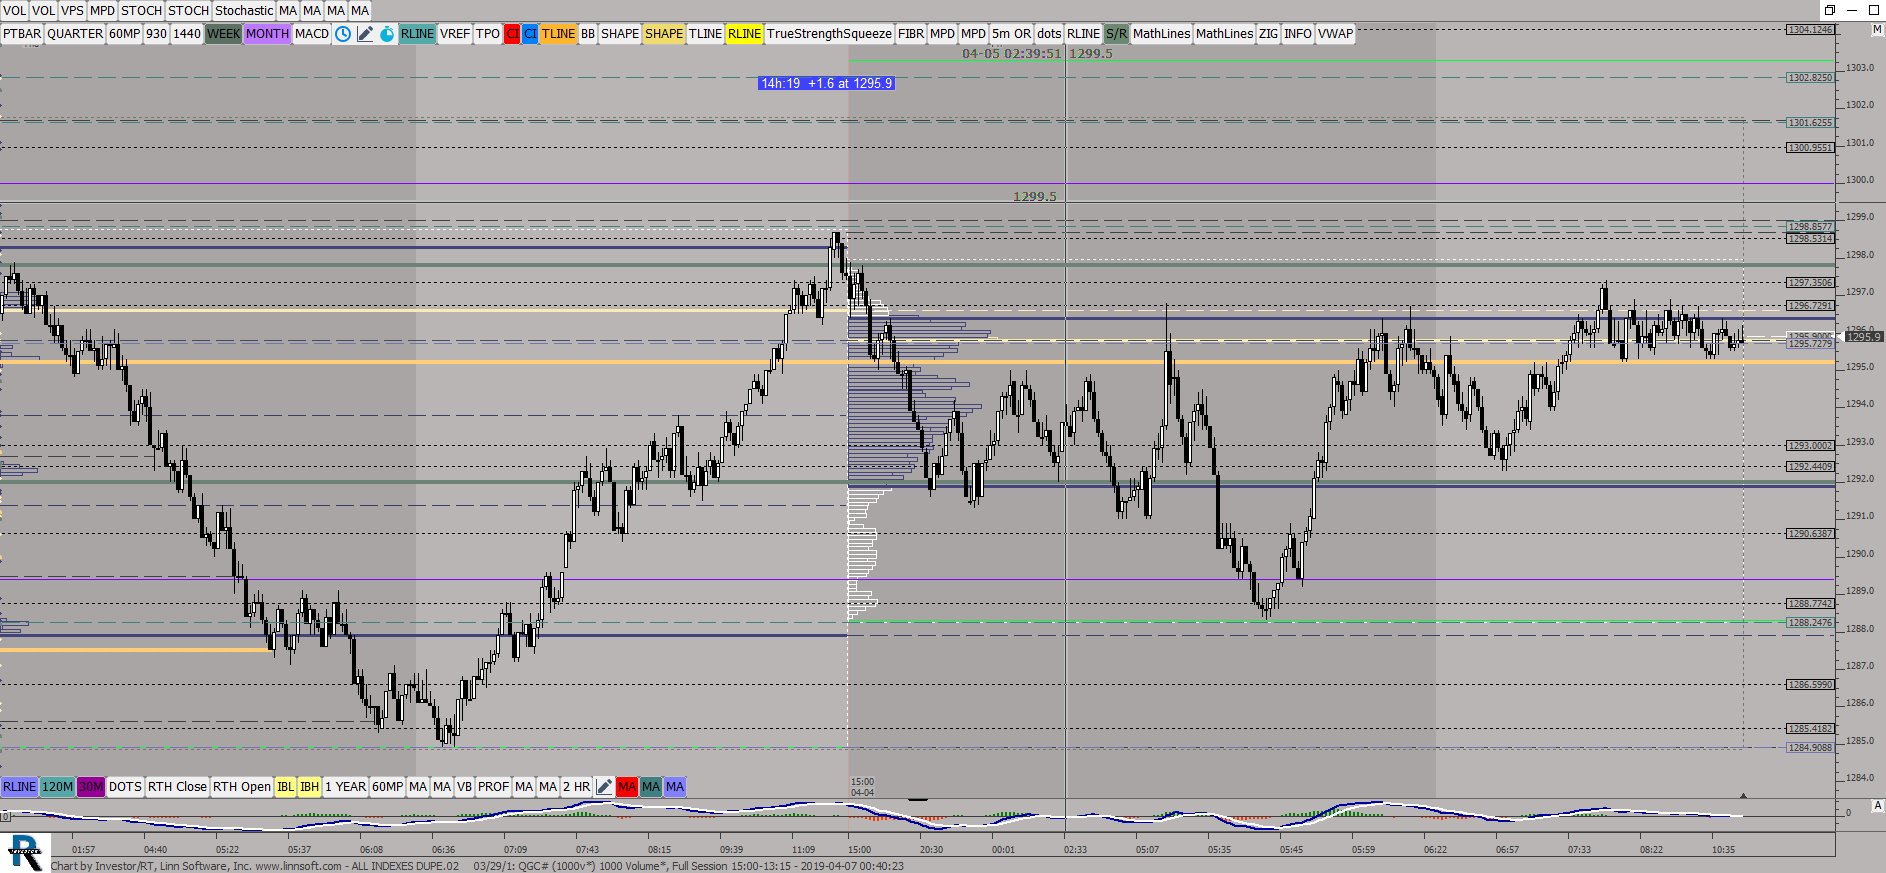 |
ALL INDEXES DUPE02 03 29 (QGC#) ES42 [totalcount]
7 years 3 months ago
This chart was uploaded by Investor/RT 13.5.23 showing symbol: QGC#. |
View |
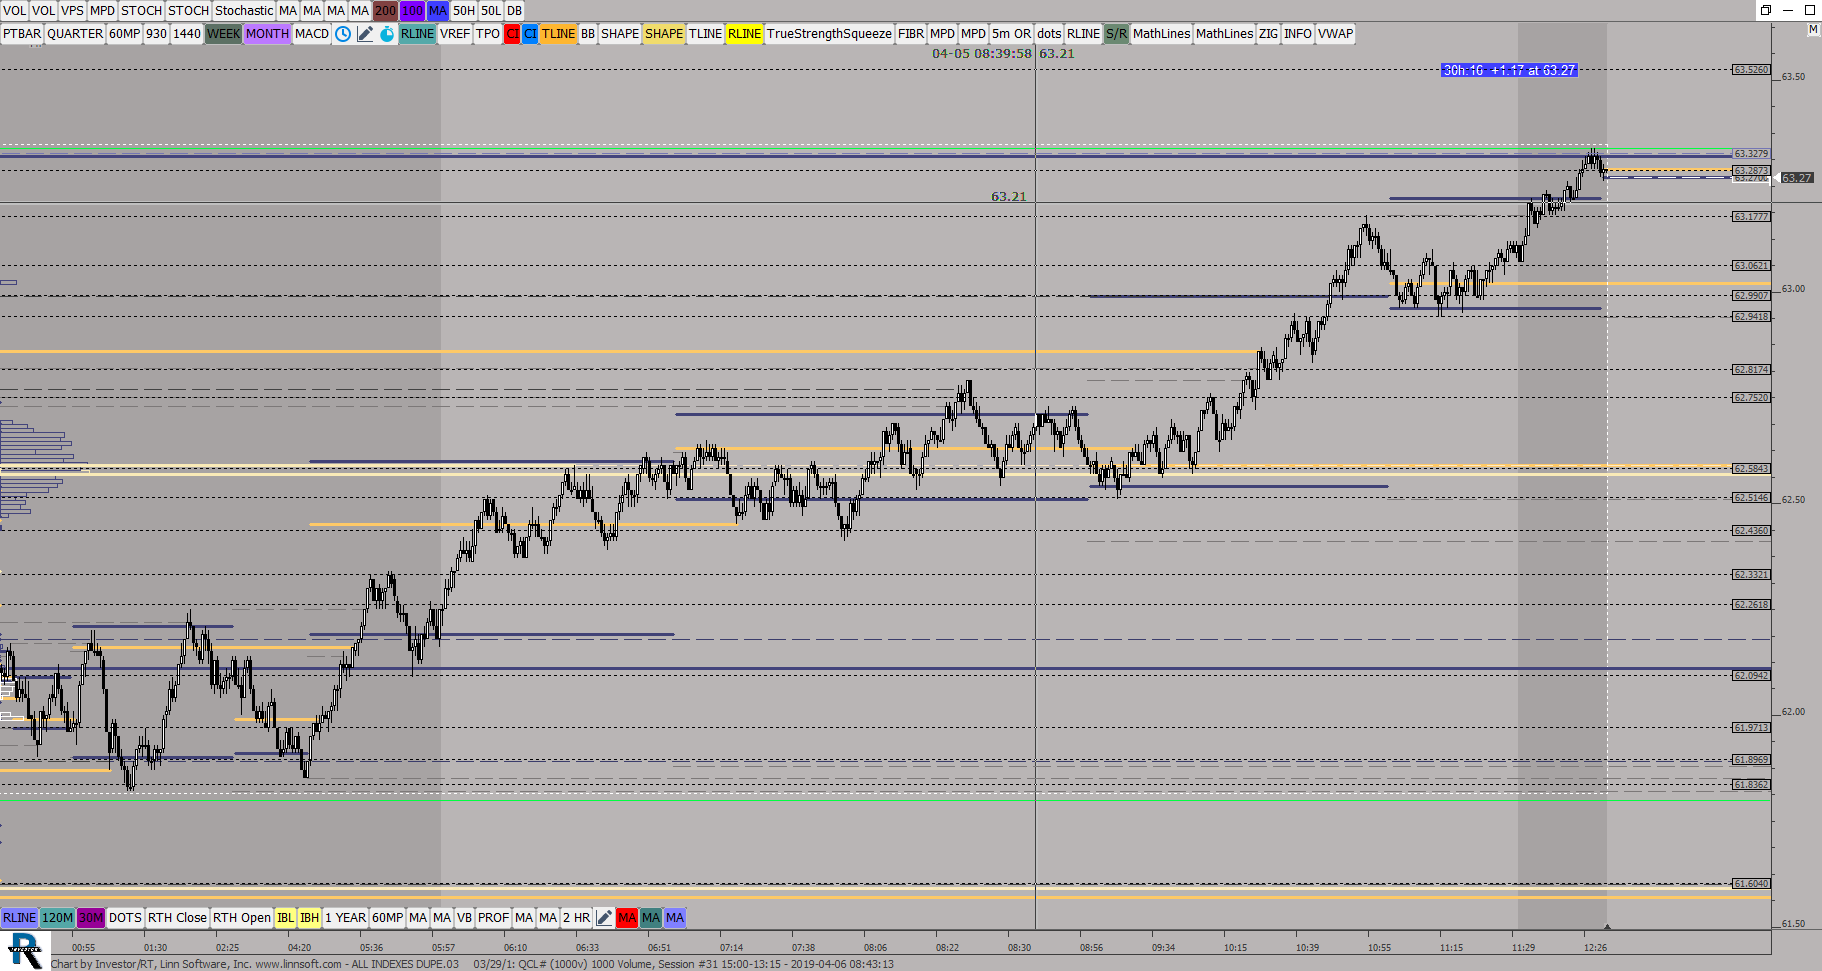 |
ALL INDEXES DUPE03 03 29 (QCL#) ES42 [totalcount]
7 years 3 months ago
3 Month Profile, 4 hour candles. This chart was uploaded by Investor/RT 13.5.23 showing symbol: QCL#. |
View |