 |
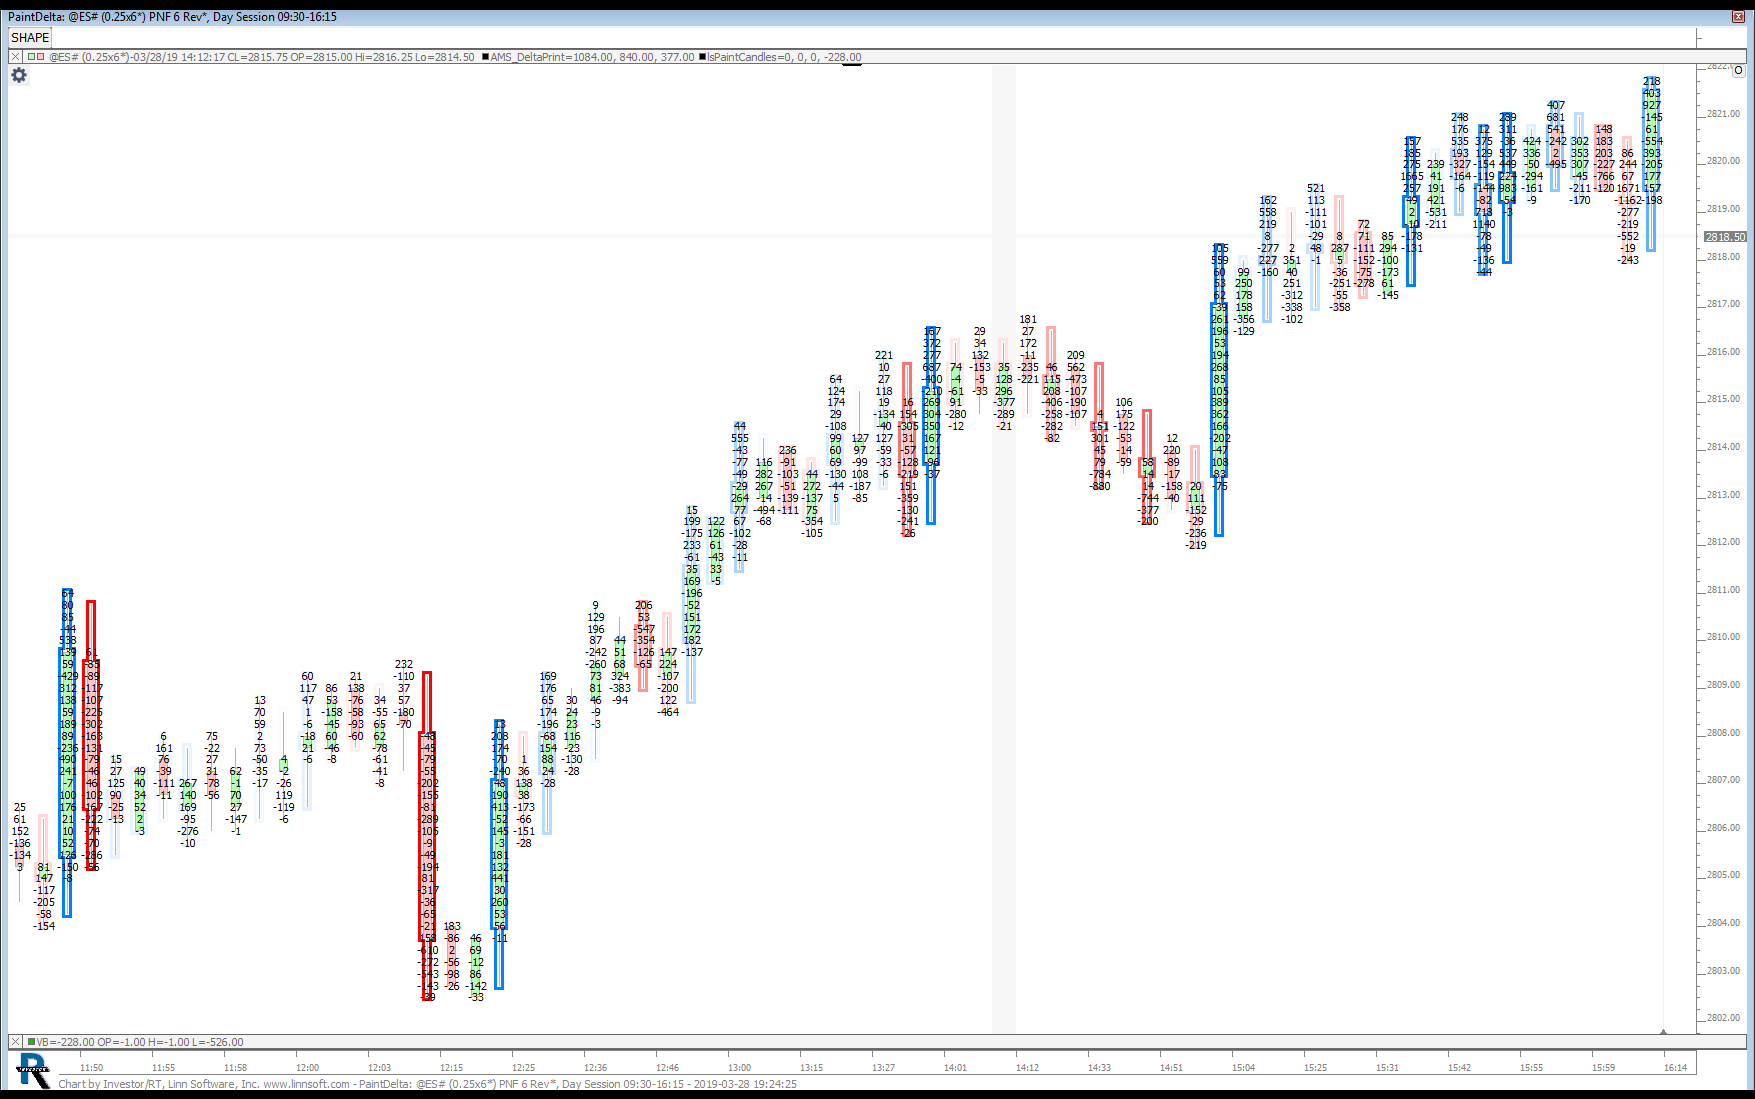
PaintDelta (@ES#) 2 hsams1 [totalcount]
7 years 4 months ago
HSAMS1. This chart was uploaded by Investor/RT 13.3.5 showing symbol: @ES#. |
View |
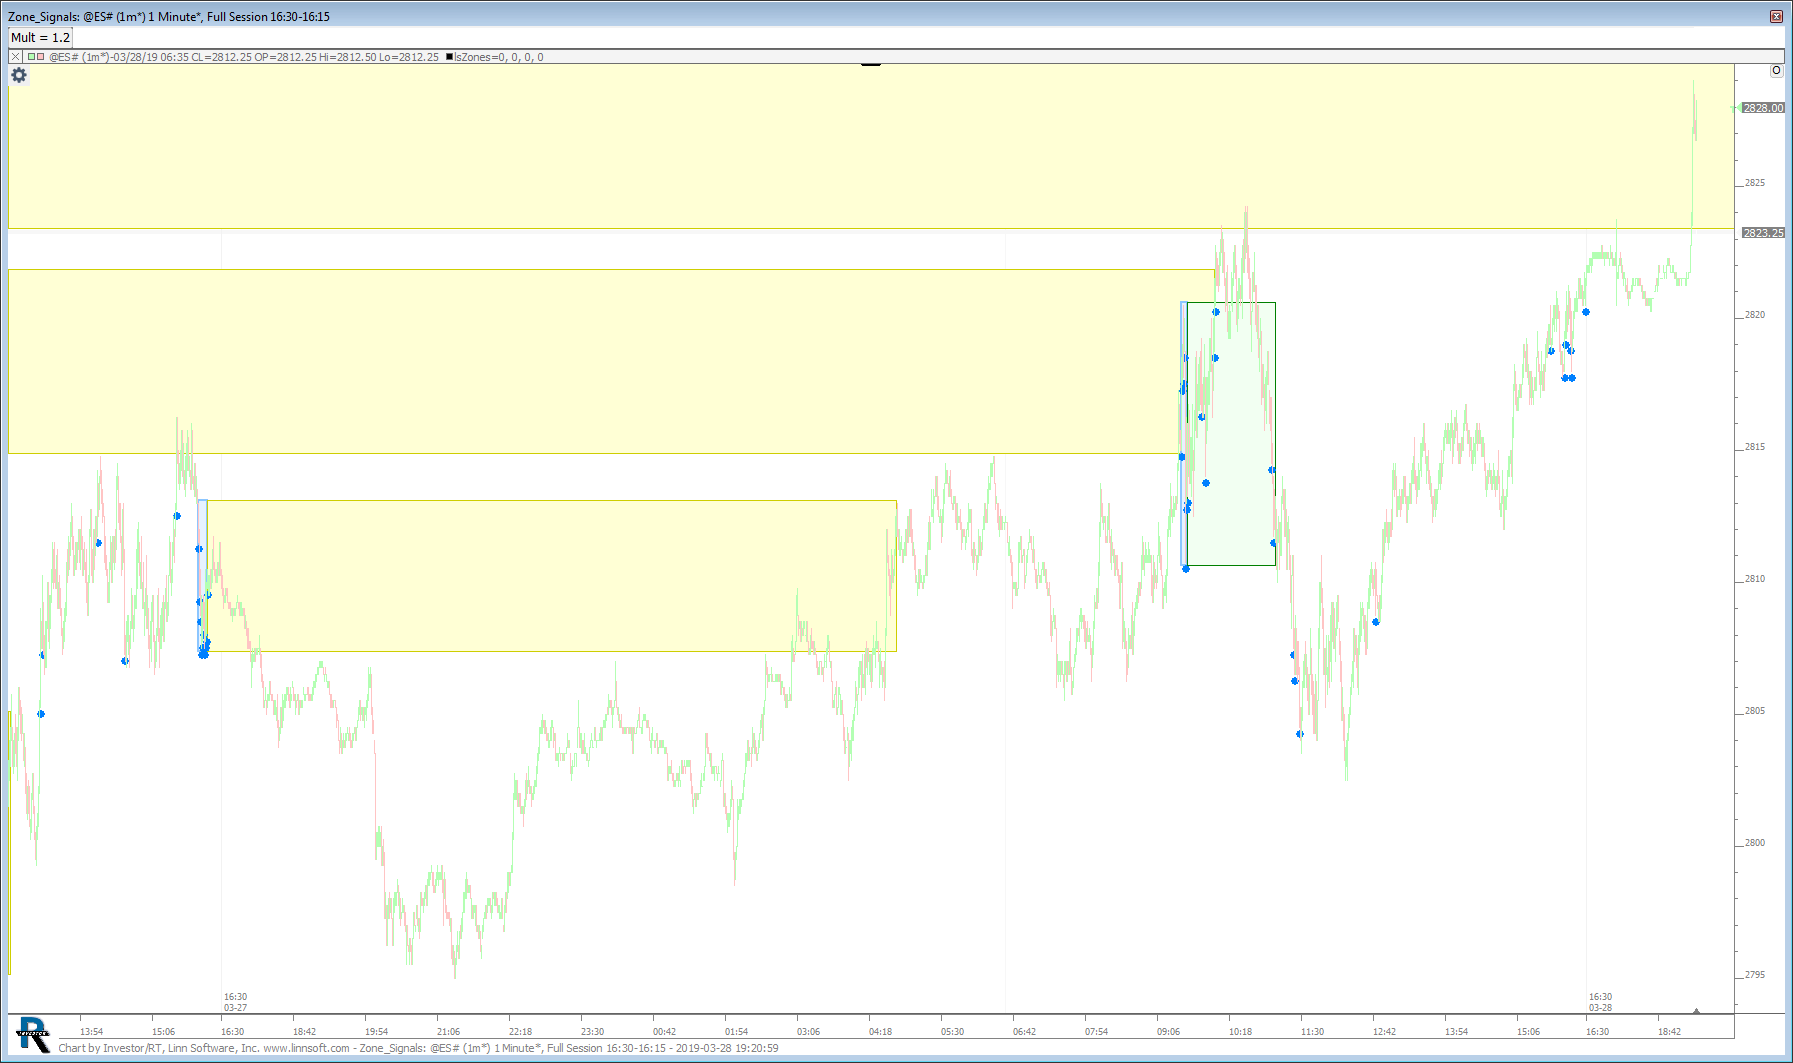 |
Zone Signals (@ES#) 2 hsams1 [totalcount]
7 years 4 months ago
CURTIS. This chart was uploaded by Investor/RT 13.3.5 showing symbol: @ES#. |
View |
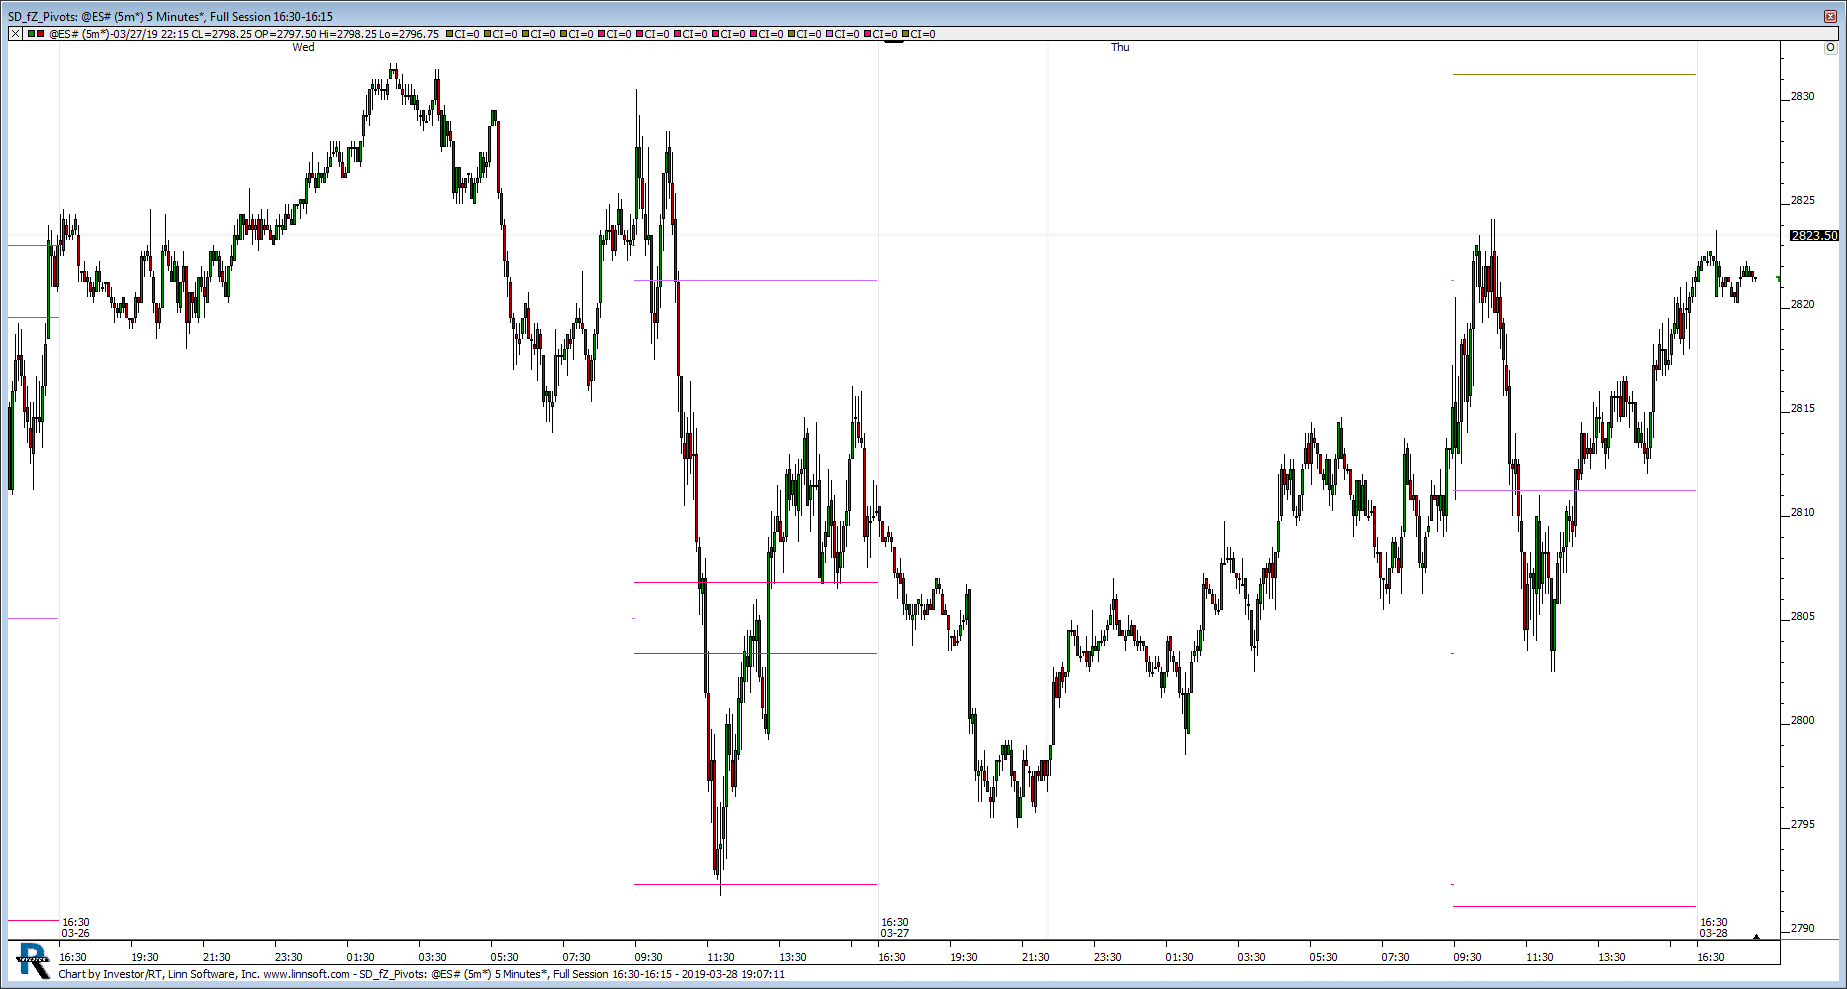 |
SD fZ Pivots (@ES#) hsams1 [totalcount]
7 years 4 months ago
CURTIS. This chart was uploaded by Investor/RT 13.1.4 showing symbol: @ES#. |
View |
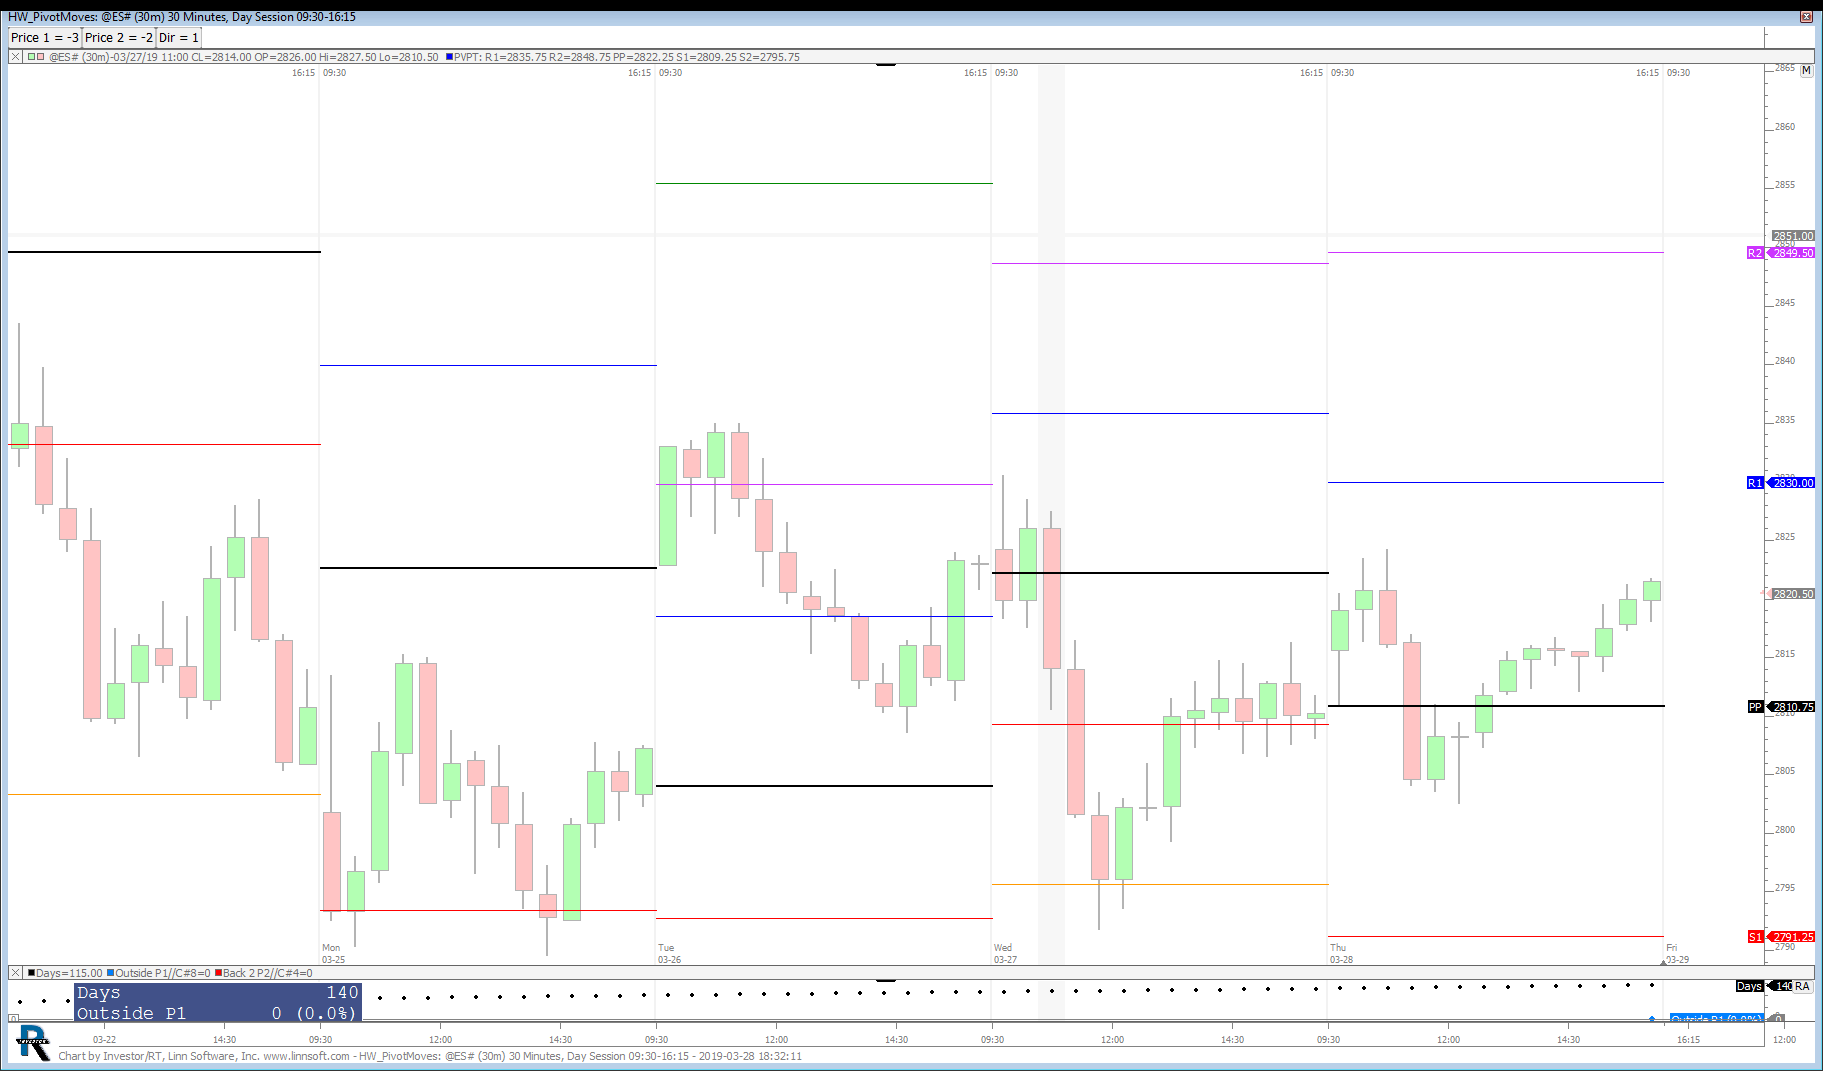 |
HW PivotMoves (@ES#) 2 hsams1 [totalcount]
7 years 4 months ago
This chart was uploaded by Investor/RT 13.5.21 showing symbol: @ES#. |
View |
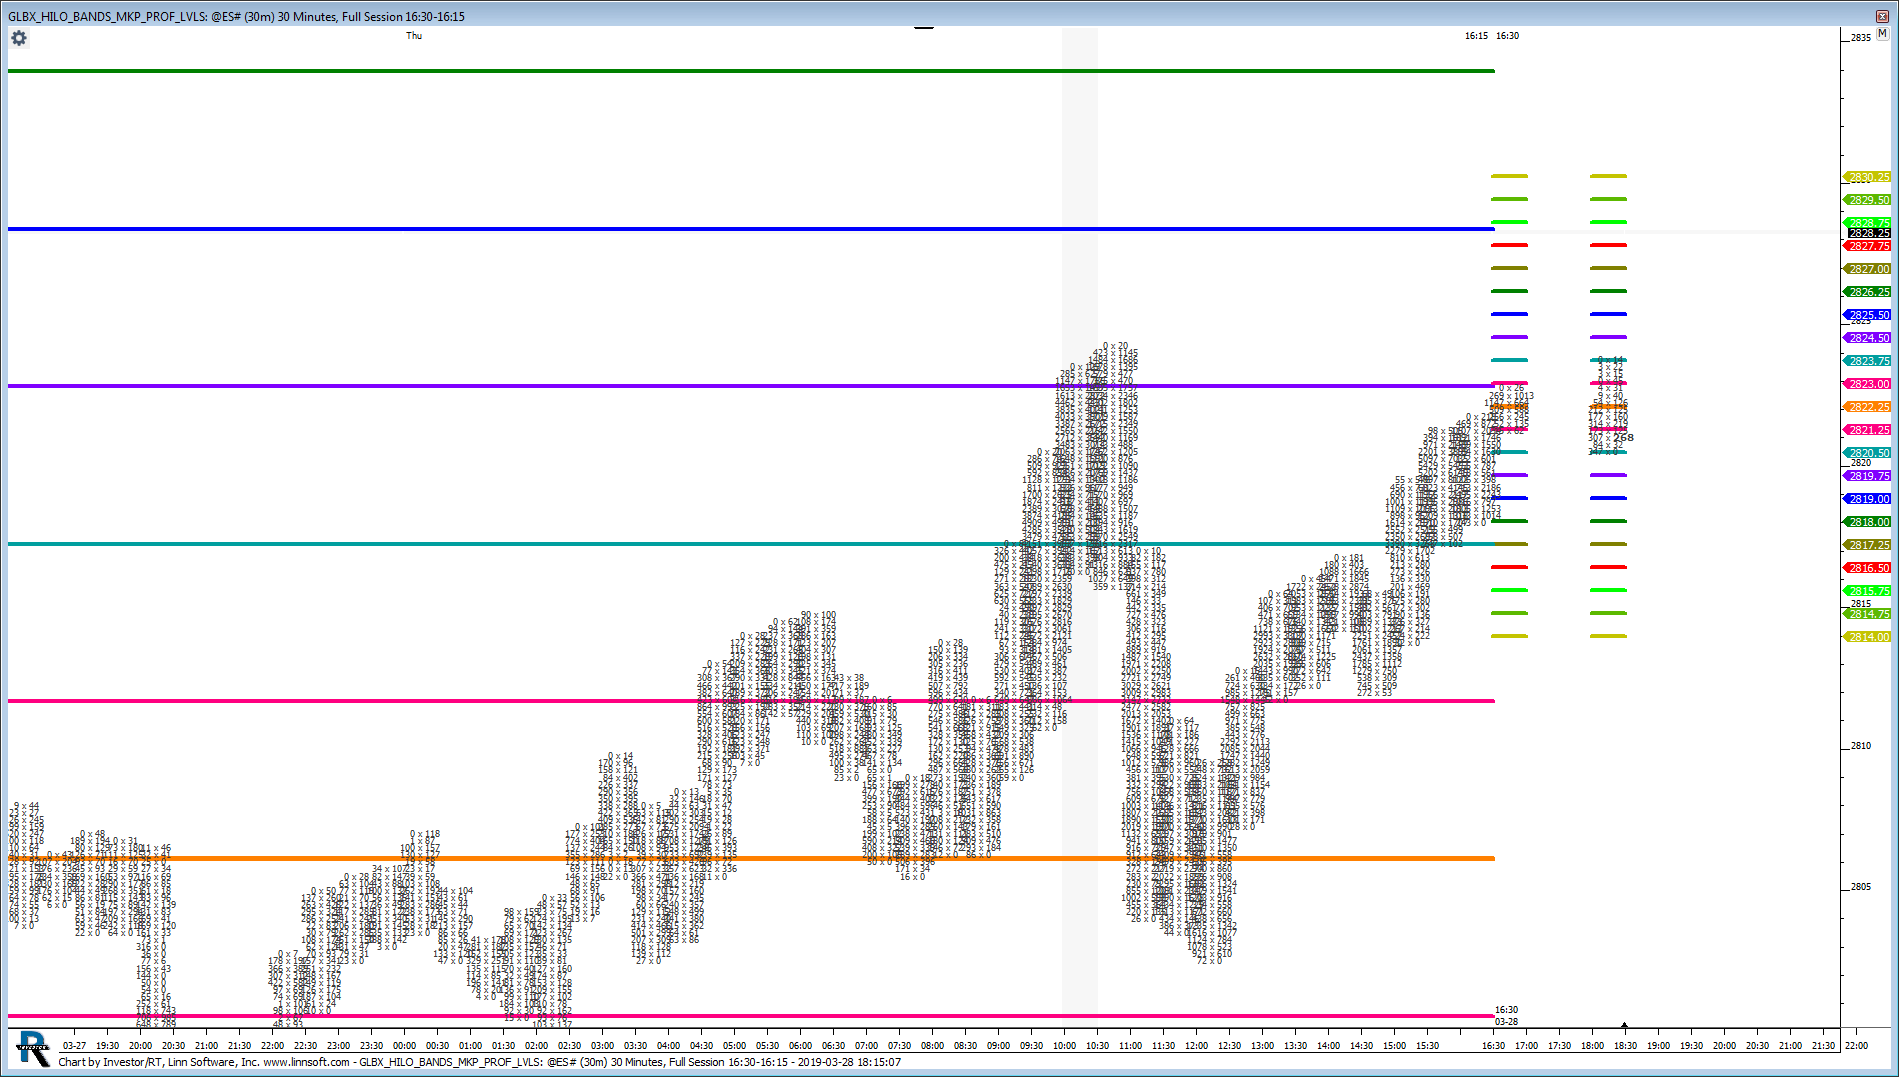 |
GLBX HILO BANDS MKP PROF LVLS (@ES#) hsams1 [totalcount]
7 years 4 months ago
This chart was uploaded by Investor/RT 13.5.21 showing symbol: @ES#. |
View |
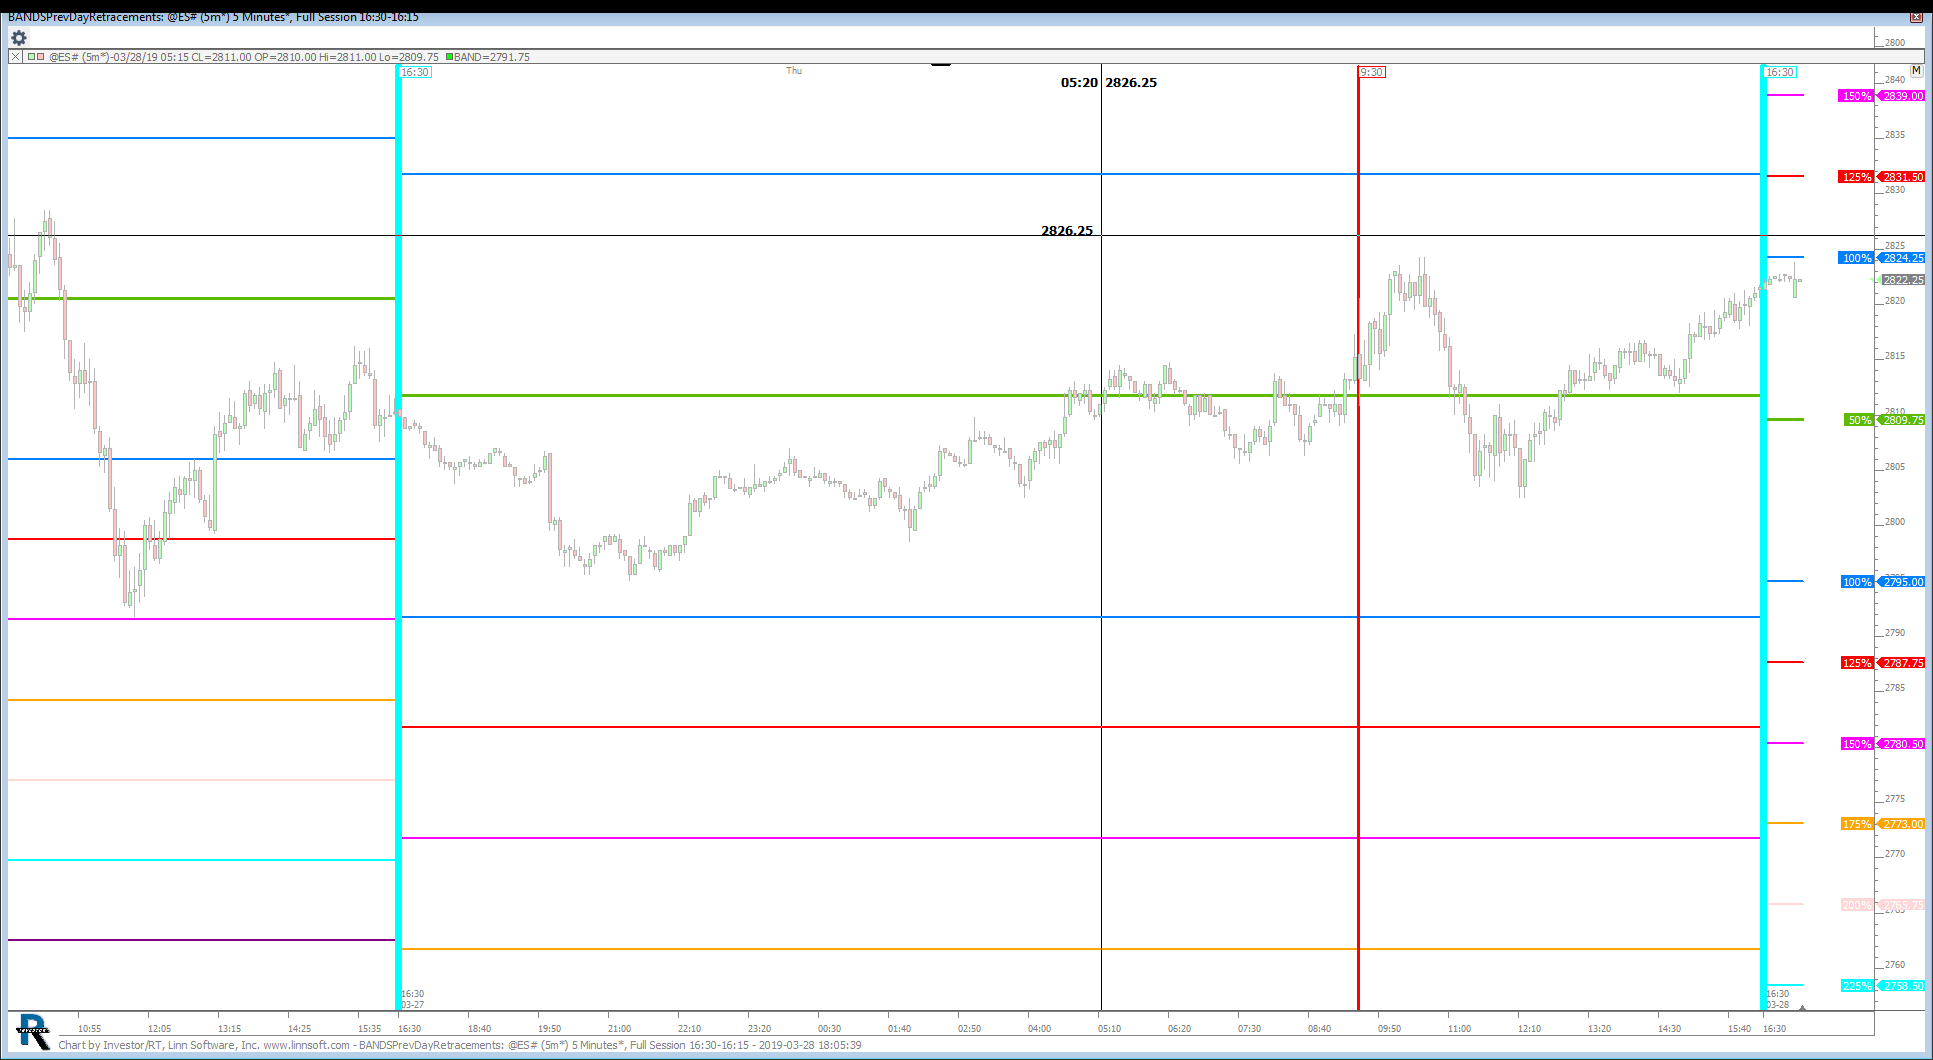 |
BANDSPrevDayRetracements (@ES#) hsams1 [totalcount]
7 years 4 months ago
This chart was uploaded by Investor/RT 13.5.21 showing symbol: @ES#. |
View |
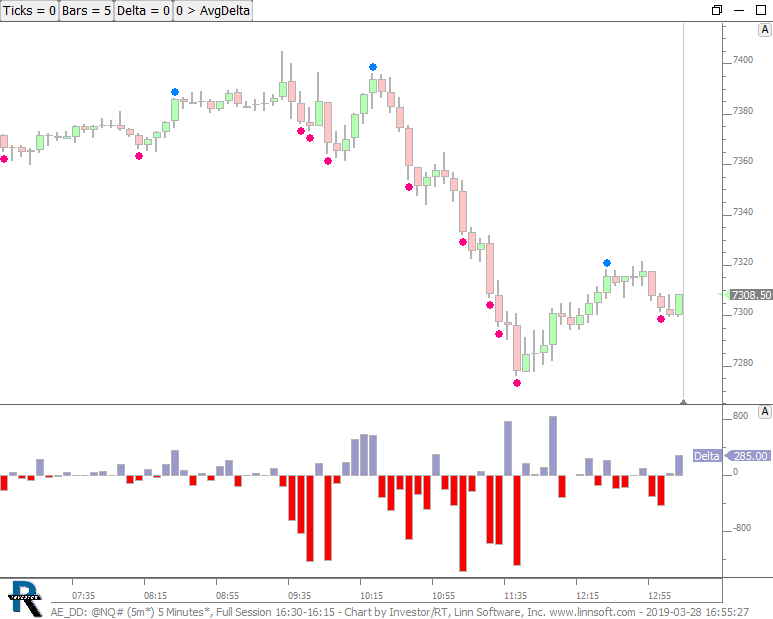 |
AE DD (@NQ#) cpayne [totalcount]
7 years 4 months ago
This chart was uploaded by Investor/RT 13.5.24 showing symbol: @NQ#. |
View |
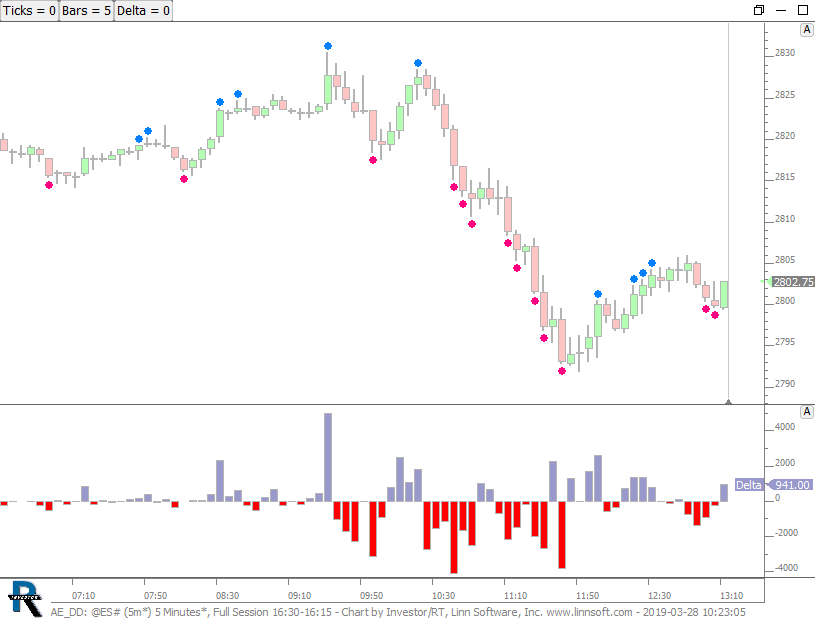 |
AE DD (@ES#) cpayne [totalcount]
7 years 4 months ago
AE Chart. This chart was uploaded by Investor/RT 13.5.23 showing symbol: @ES#. |
View |
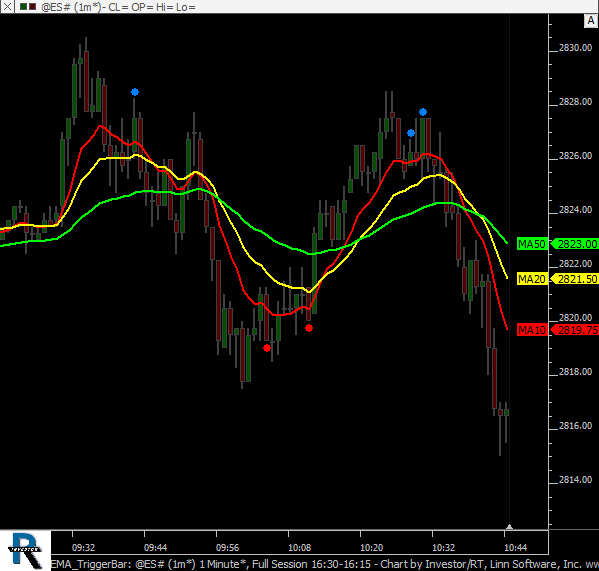 |
EMA TriggerBar (@ES#) cpayne [totalcount]
7 years 4 months ago
Stacked EMA Trigger Bar. This chart was uploaded by Investor/RT 13.5.23 showing symbol: @ES#. |
View |
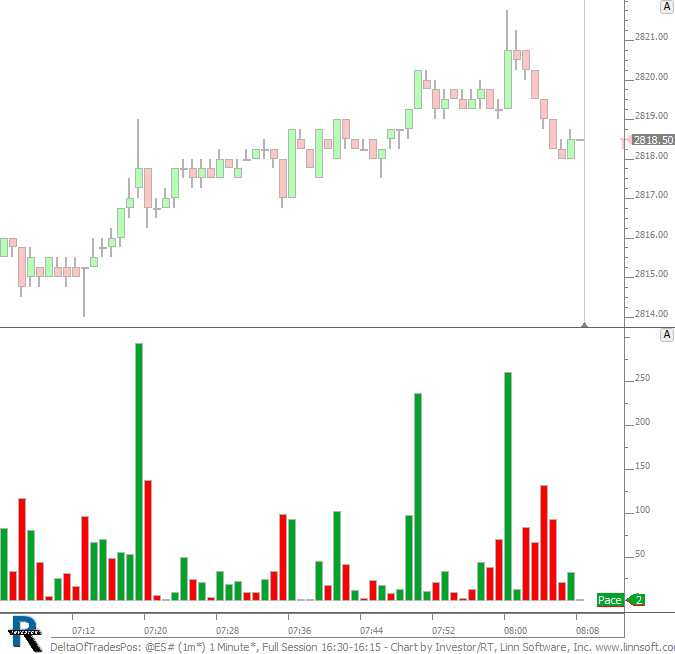 |
DeltaOfTradesPos (@ES#) cpayne [totalcount]
7 years 4 months ago
Buy Trades minus Sell Trades with both presented positive using different colors thru 2 custom indicators. This chart was uploaded by Investor/RT 13.5.23 showing symbol: @ES#. |
View |
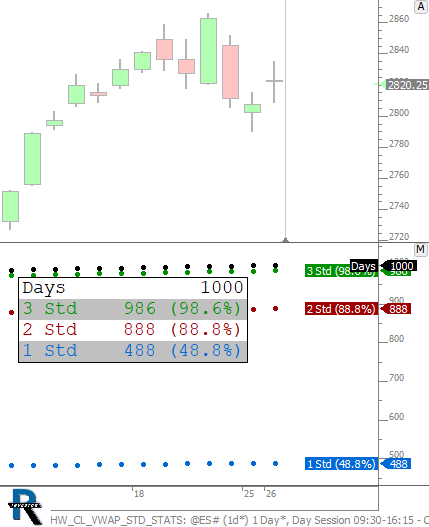 |
HW CL VWAP STD STATS (@ES#) cpayne [totalcount]
7 years 4 months ago
How often does price close within 1, 2, and 3 standard deviations of the VWAP. This chart was uploaded by Investor/RT 13.5.23 showing symbol: @ES#. |
View |
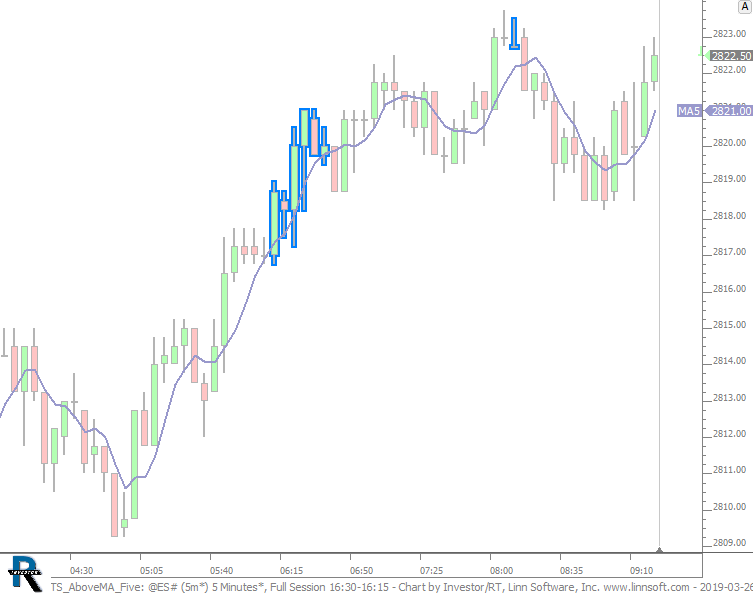 |
TS AboveMA Five (@ES#) cpayne [totalcount]
7 years 4 months ago
Close above MA5 for 7 or more consecutive bars. This chart was uploaded by Investor/RT 13.5.23 showing symbol: @ES#. |
View |
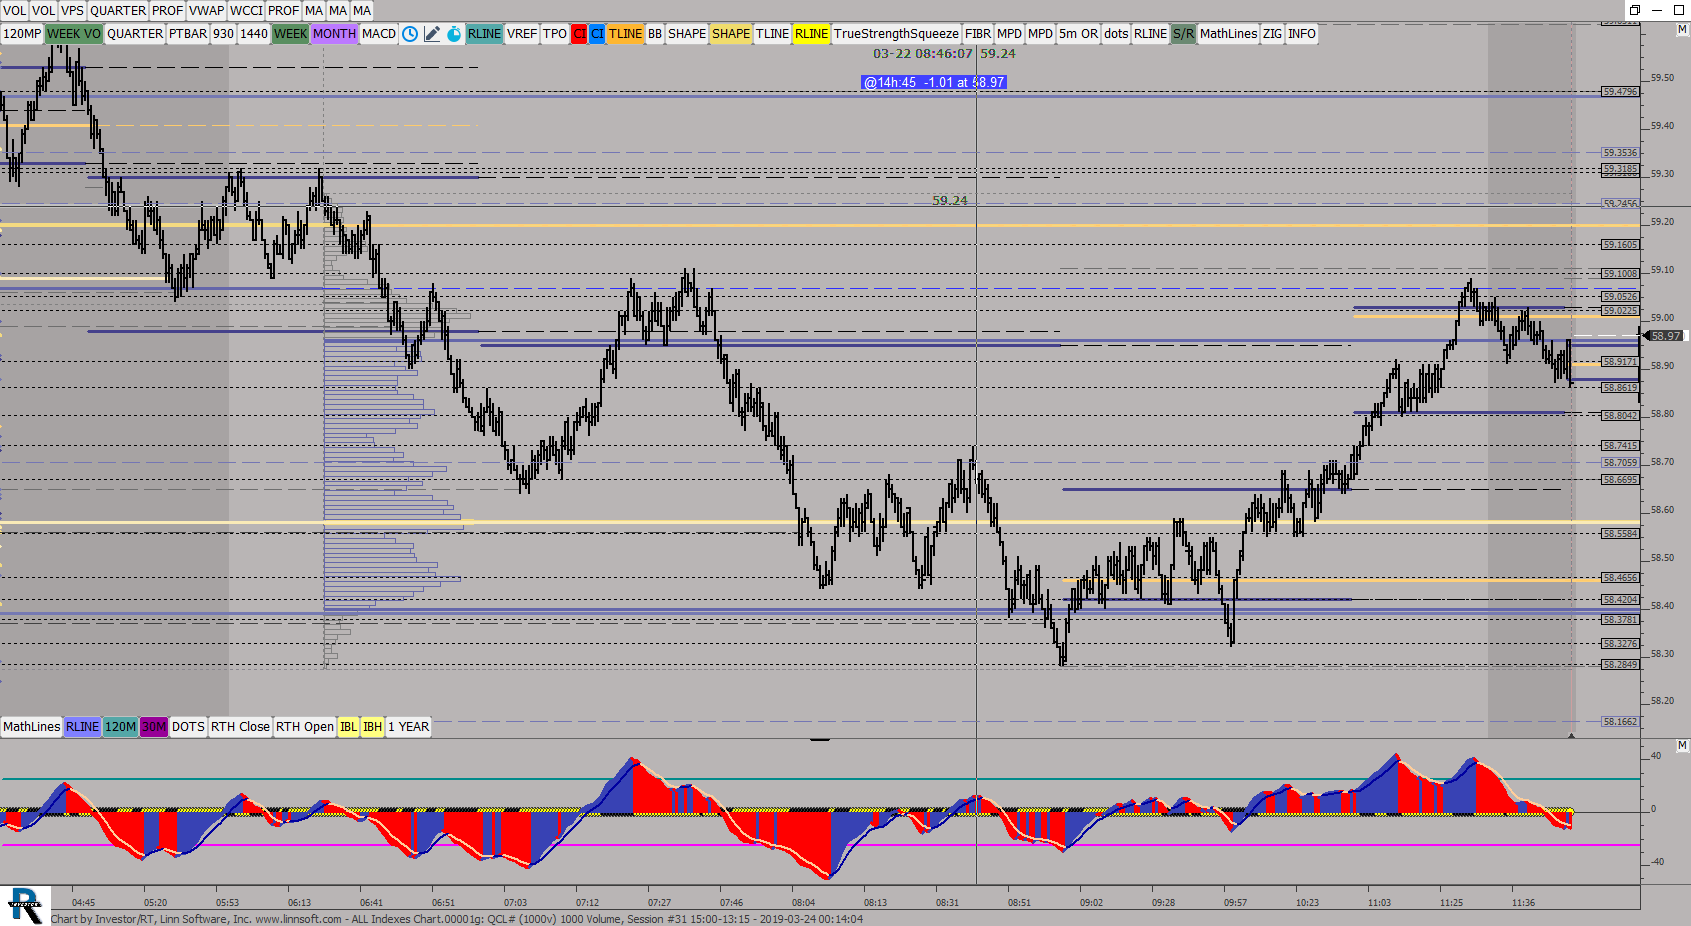 |
ALL Indexes Chart00001g (QCL#) ES42 [totalcount]
7 years 4 months ago
Daily Candles. This chart was uploaded by Investor/RT 13.5.23 showing symbol: QCL#. |
View |
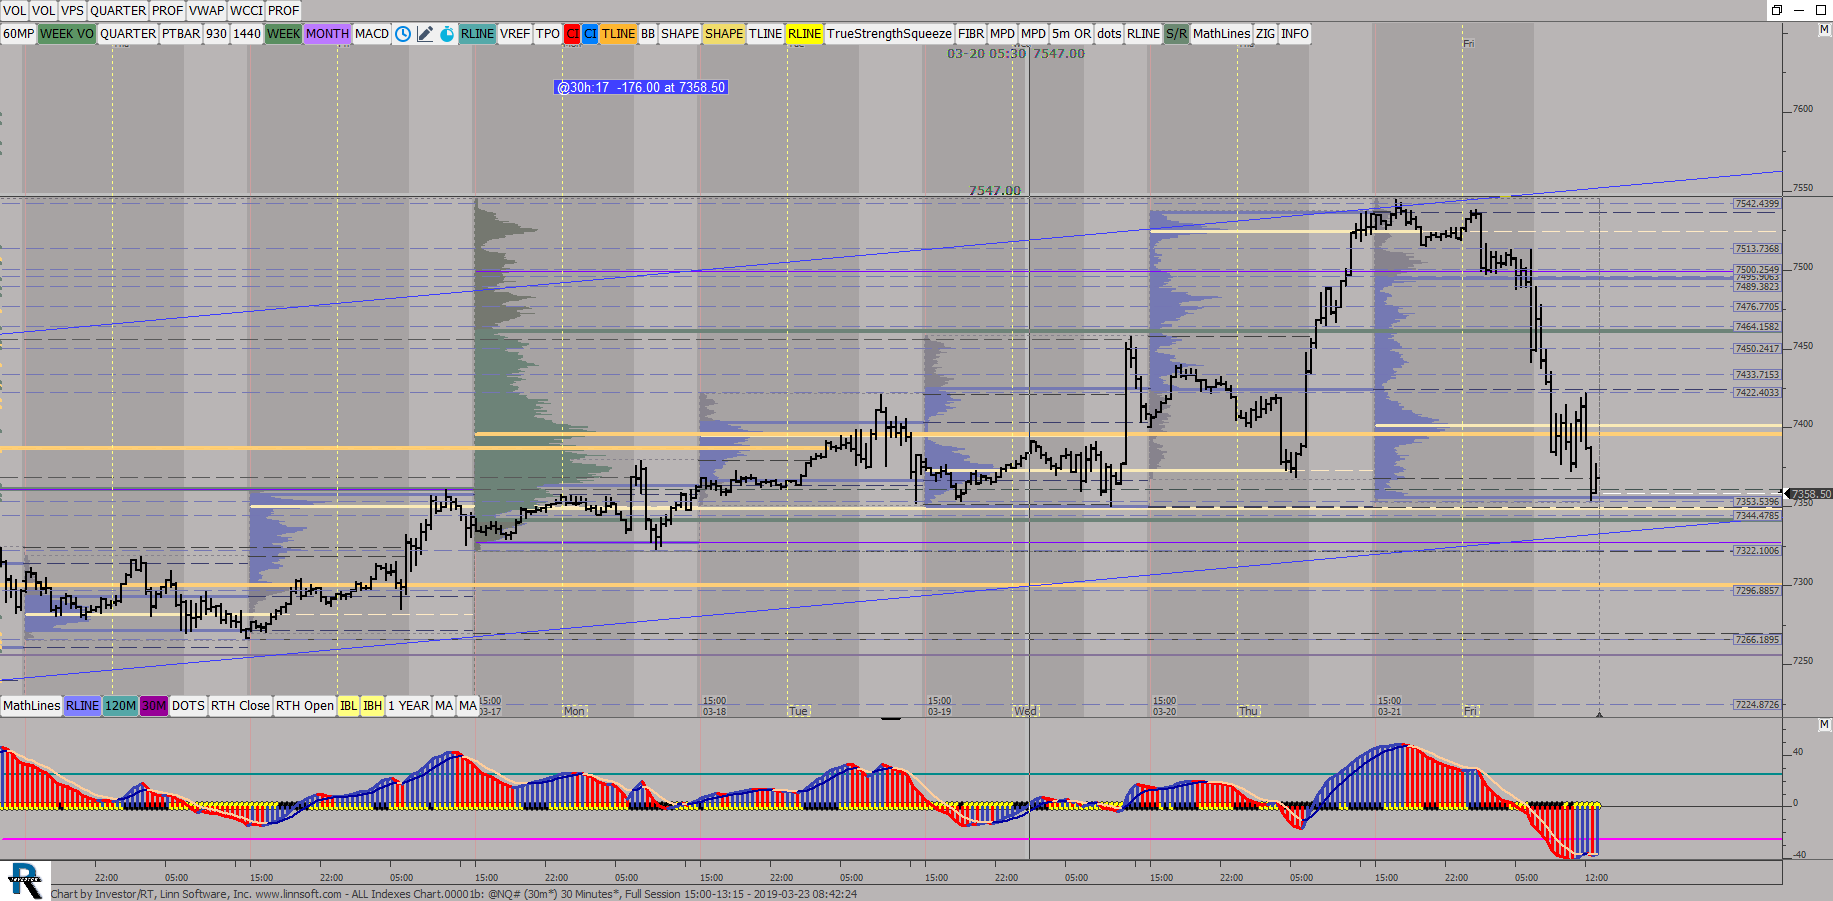 |
ALL Indexes Chart00001b (@NQ#) ES42 [totalcount]
7 years 4 months ago
This chart was uploaded by Investor/RT 13.5.23 showing symbol: @NQ#. |
View |
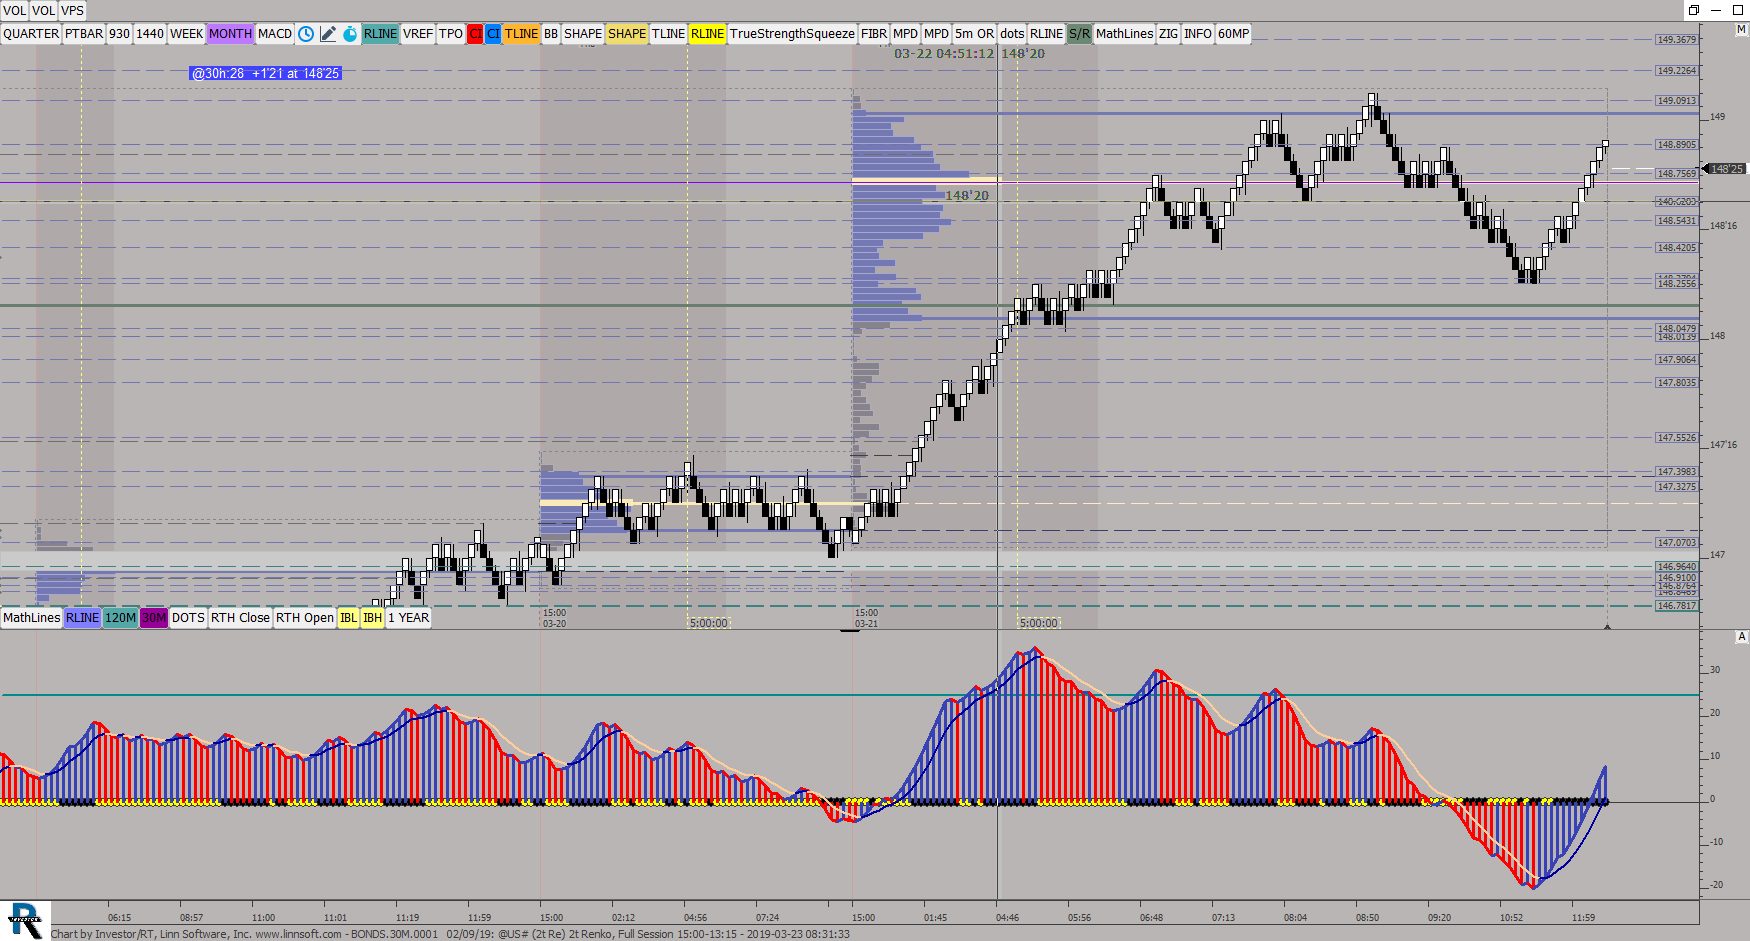 |
BONDS30M0001 02 09 (@US#) ES42 [totalcount]
7 years 4 months ago
30 Min Candles with 24 hour Profiles. This chart was uploaded by Investor/RT 13.5.17 showing symbol: @US#. |
View |
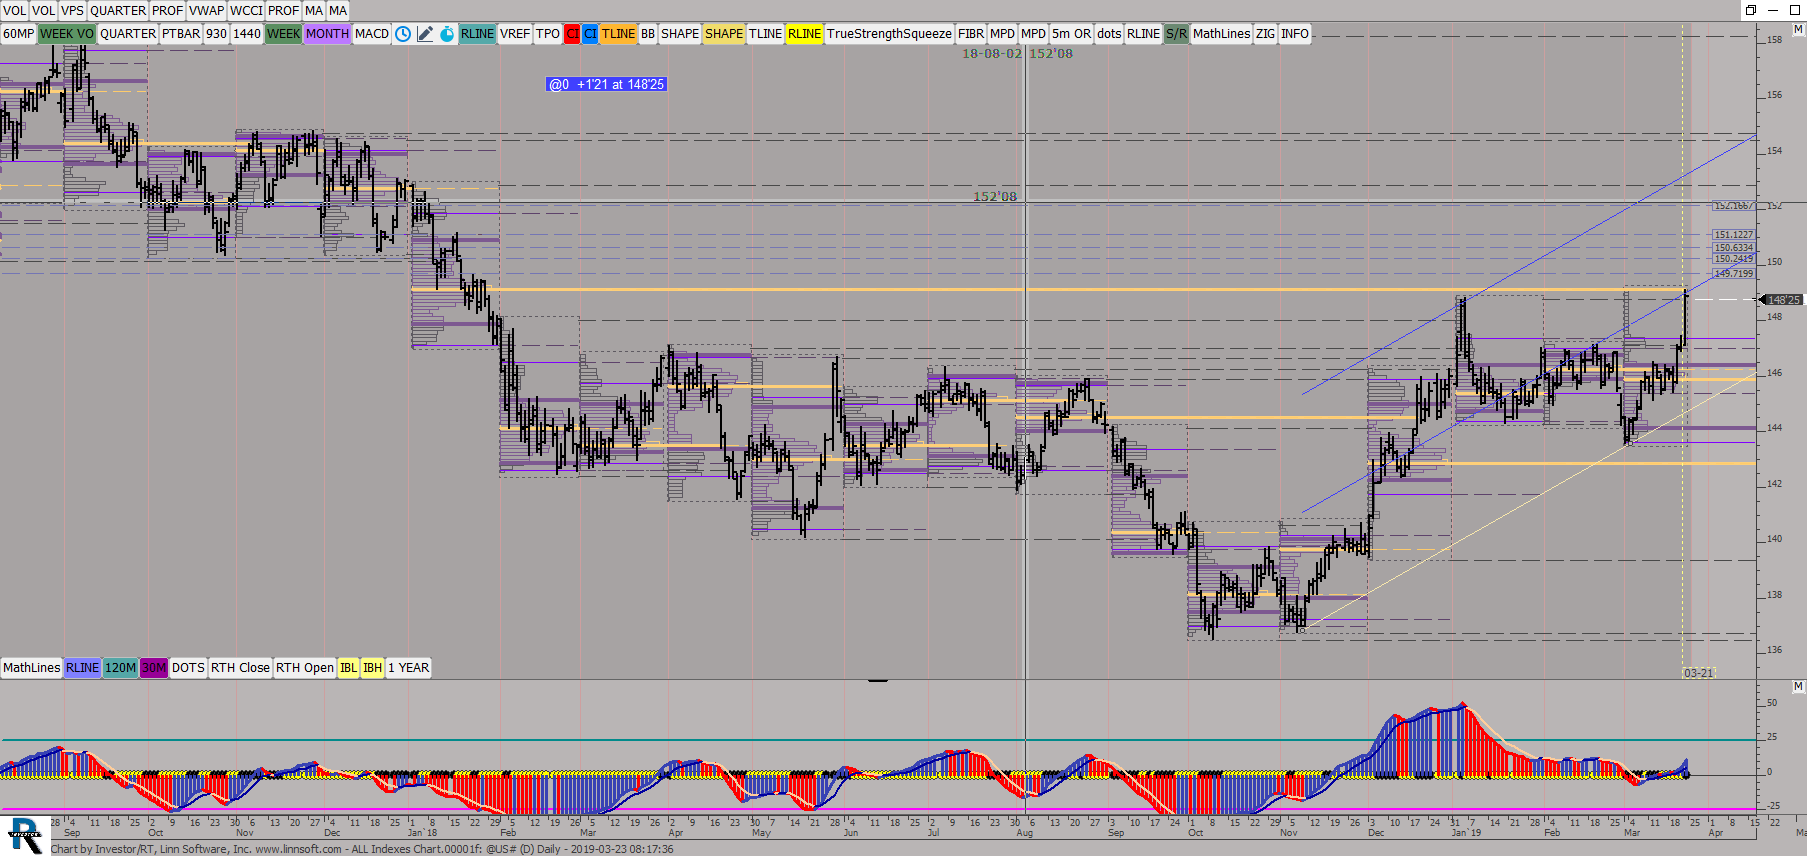 |
ALL Indexes Chart00001f (@US#) ES42 [totalcount]
7 years 4 months ago
This chart was uploaded by Investor/RT 13.5.23 showing symbol: @US#. |
View |
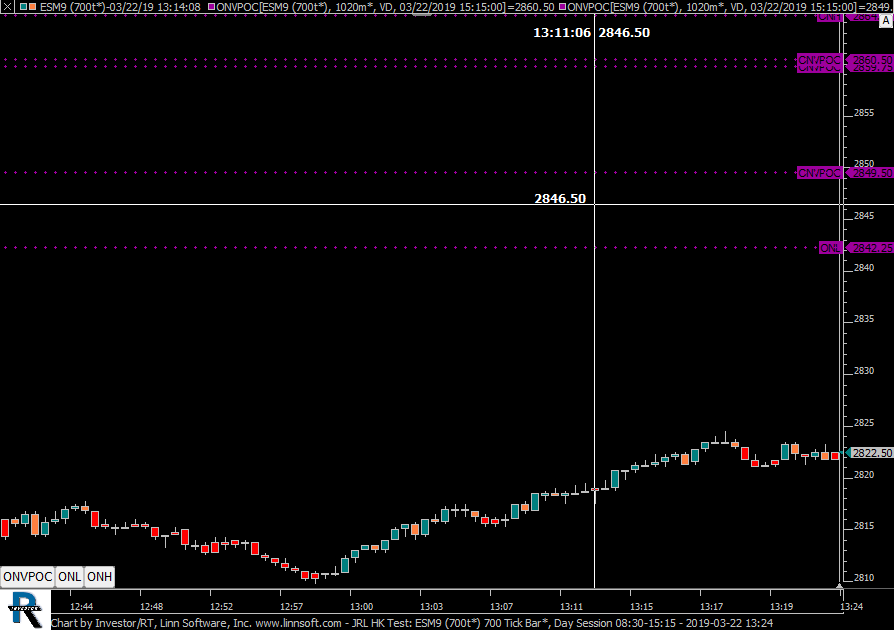 |
JRL HK Test (ESM9) scottz46 [totalcount]
7 years 4 months ago
This chart was uploaded by Investor/RT 13.5.21 showing symbol: ESM9. |
View |
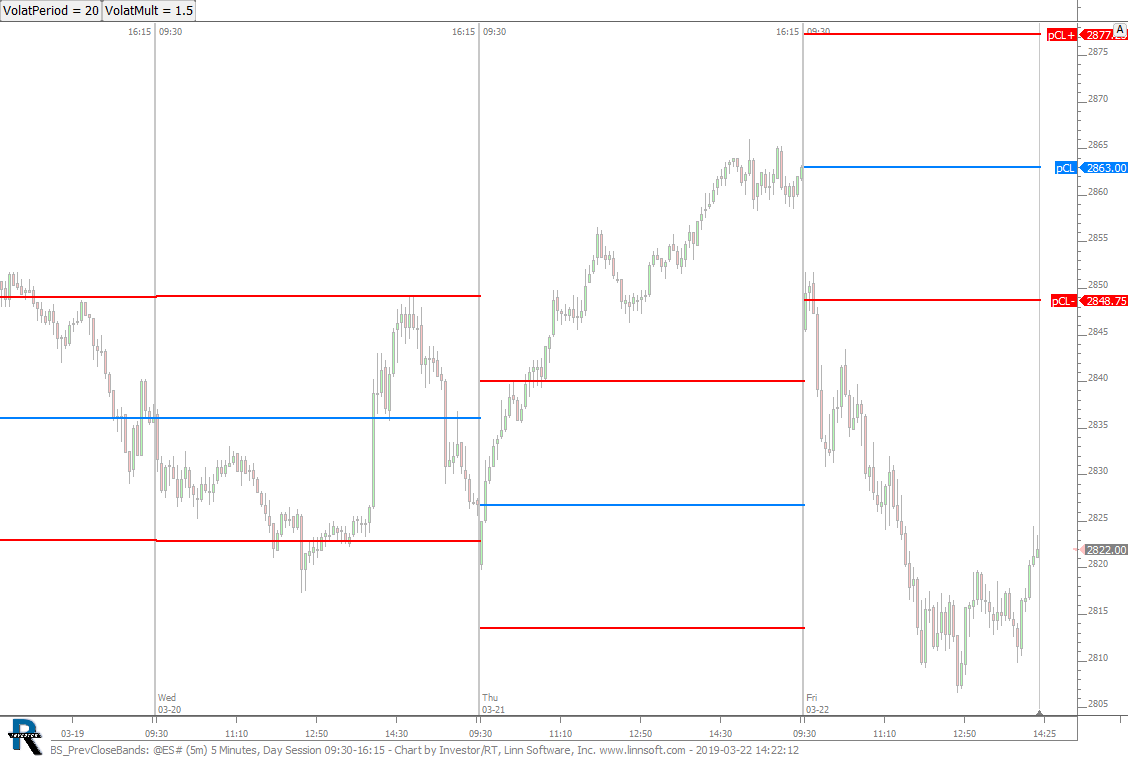 |
BS PrevCloseBands (@ES#) cpayne [totalcount]
7 years 4 months ago
Previous Close Bands. This chart was uploaded by Investor/RT 13.5.23 showing symbol: @ES#. |
View |
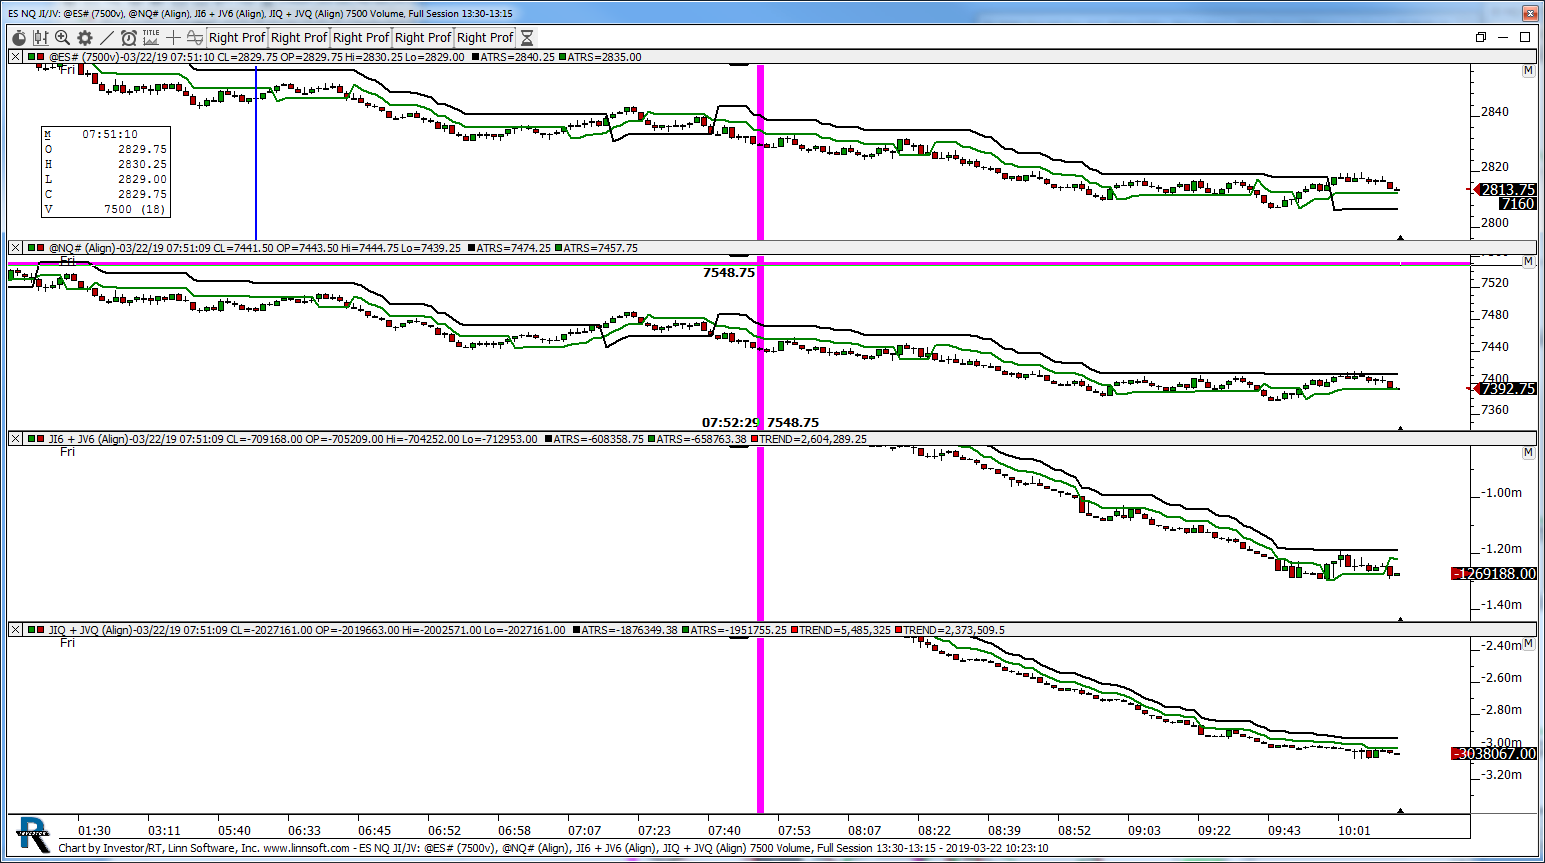 |
ES NQ JI JV (@ES#) kencassorla [totalcount]
7 years 4 months ago
This chart was uploaded by Investor/RT 13.5.21 showing symbol: @ES#. |
View |
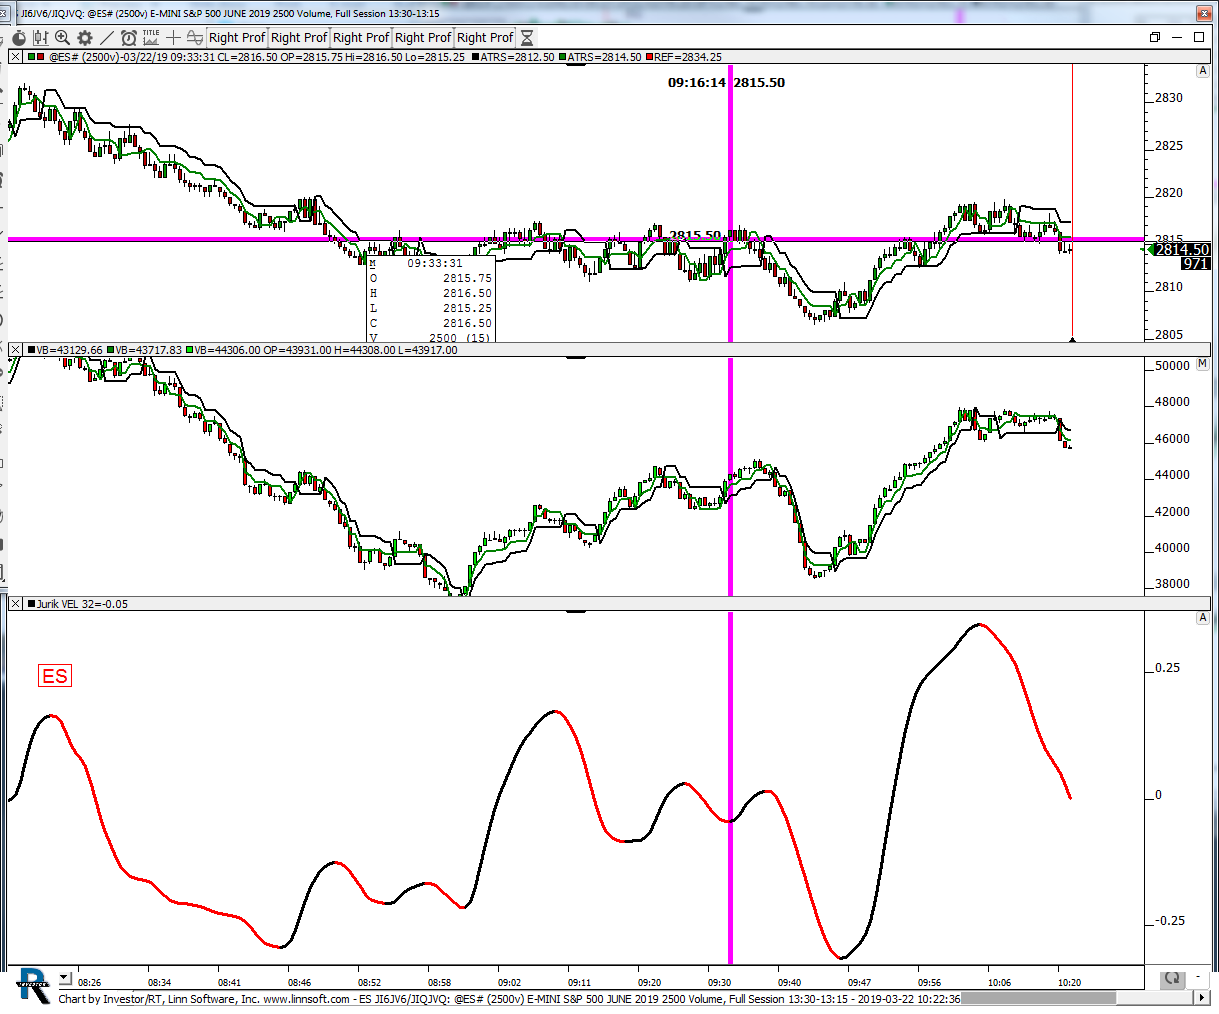 |
ES JI6JV6 JIQJVQ (@ES#) kencassorla [totalcount]
7 years 4 months ago
buy. This chart was uploaded by Investor/RT 13.5.21 showing symbol: @ES#. |
View |
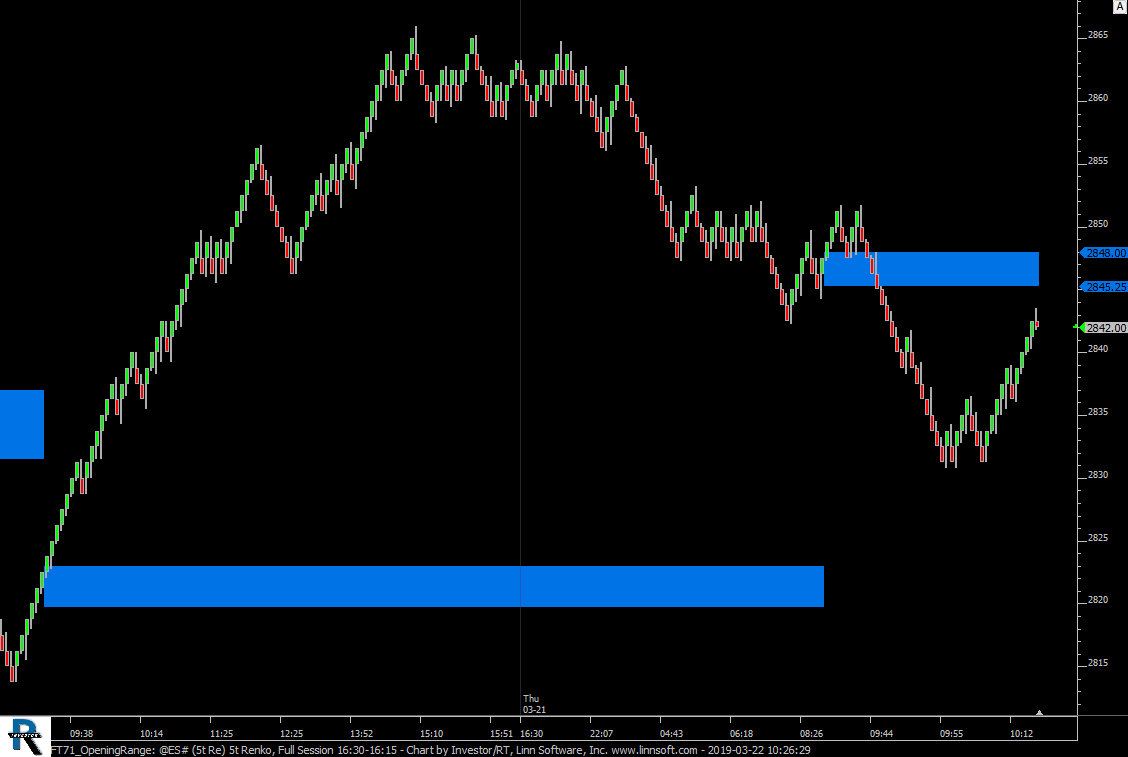 |
FT71 OpeningRange (@ES#) cpayne [totalcount]
7 years 4 months ago
Opening Range - 1 Minute Band. This chart was uploaded by Investor/RT 13.5.23 showing symbol: @ES#. |
View |
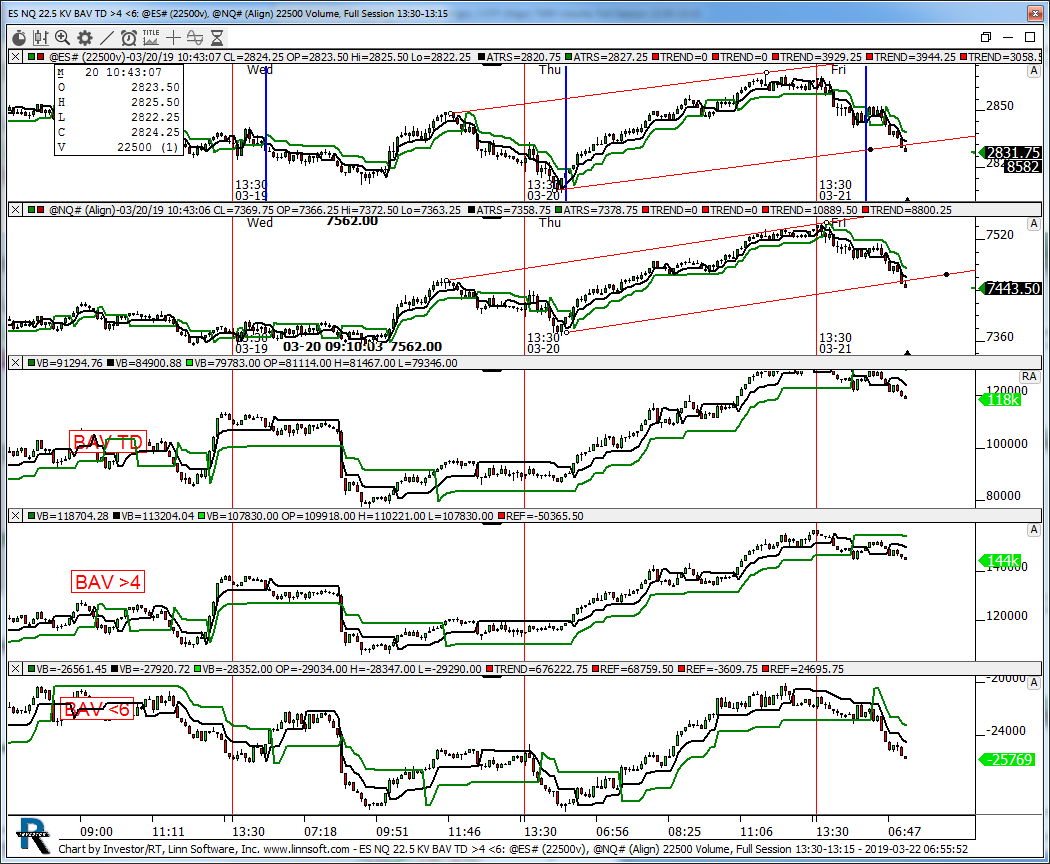 |
ES NQ 225 KV BAV TD 4 6 (@ES#) kencassorla [totalcount]
7 years 4 months ago
22.5 kv. This chart was uploaded by Investor/RT 13.5.16 showing symbol: @ES#. |
View |
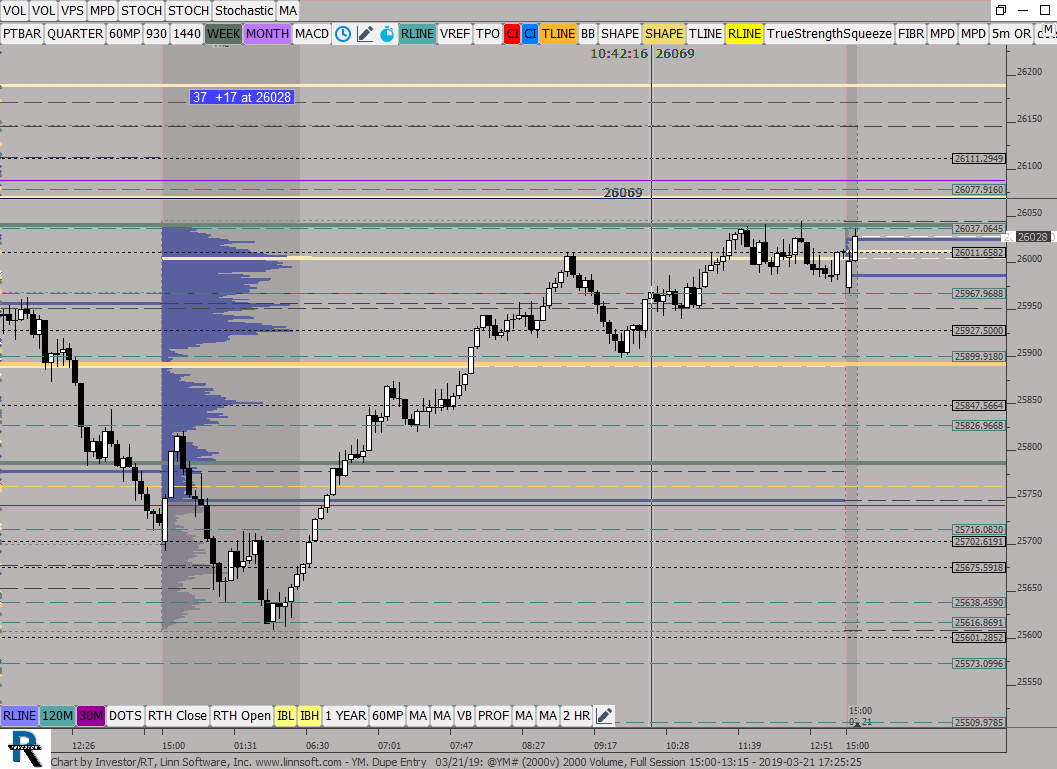 |
YM Dupe Entry 03 21 (@YM#) ES42 [totalcount]
7 years 4 months ago
This chart was uploaded by Investor/RT 13.5.23 showing symbol: @YM#. |
View |
 |
MP WEEKLY VALUE (@ES#) ES42 [totalcount]
7 years 4 months ago
This chart was uploaded by Investor/RT 13.5.23 showing symbol: @ES#. |
View |
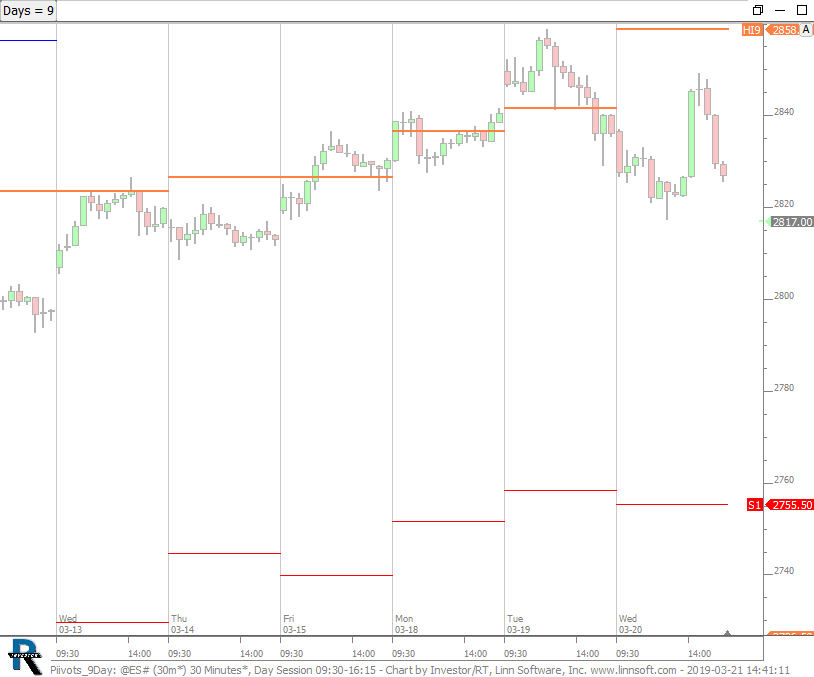 |
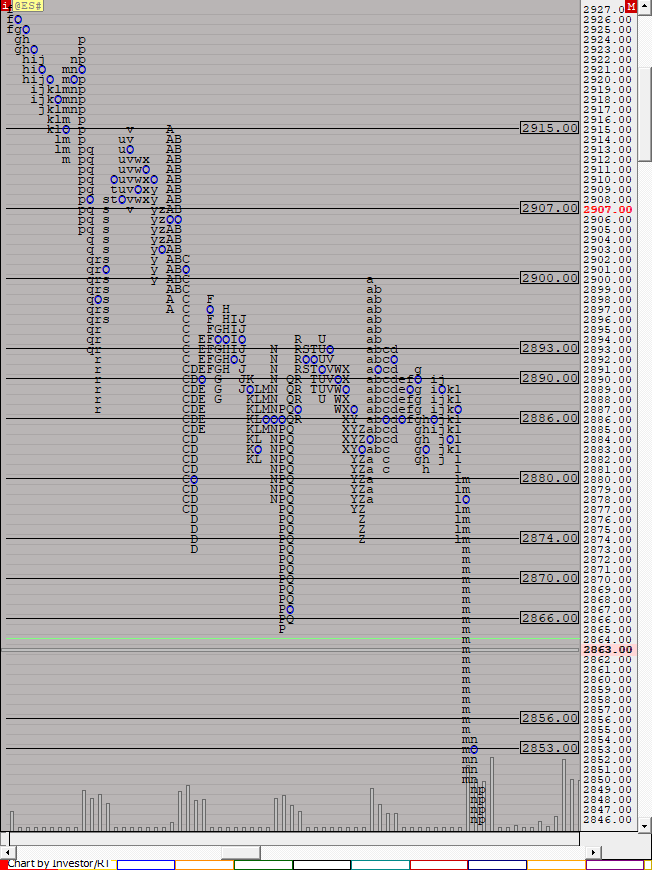
Piivots 9Day (@ES#) cpayne [totalcount]
7 years 4 months ago
Pivot - 9 Day. This chart was uploaded by Investor/RT 13.5.23 showing symbol: @ES#. |
View |