 |
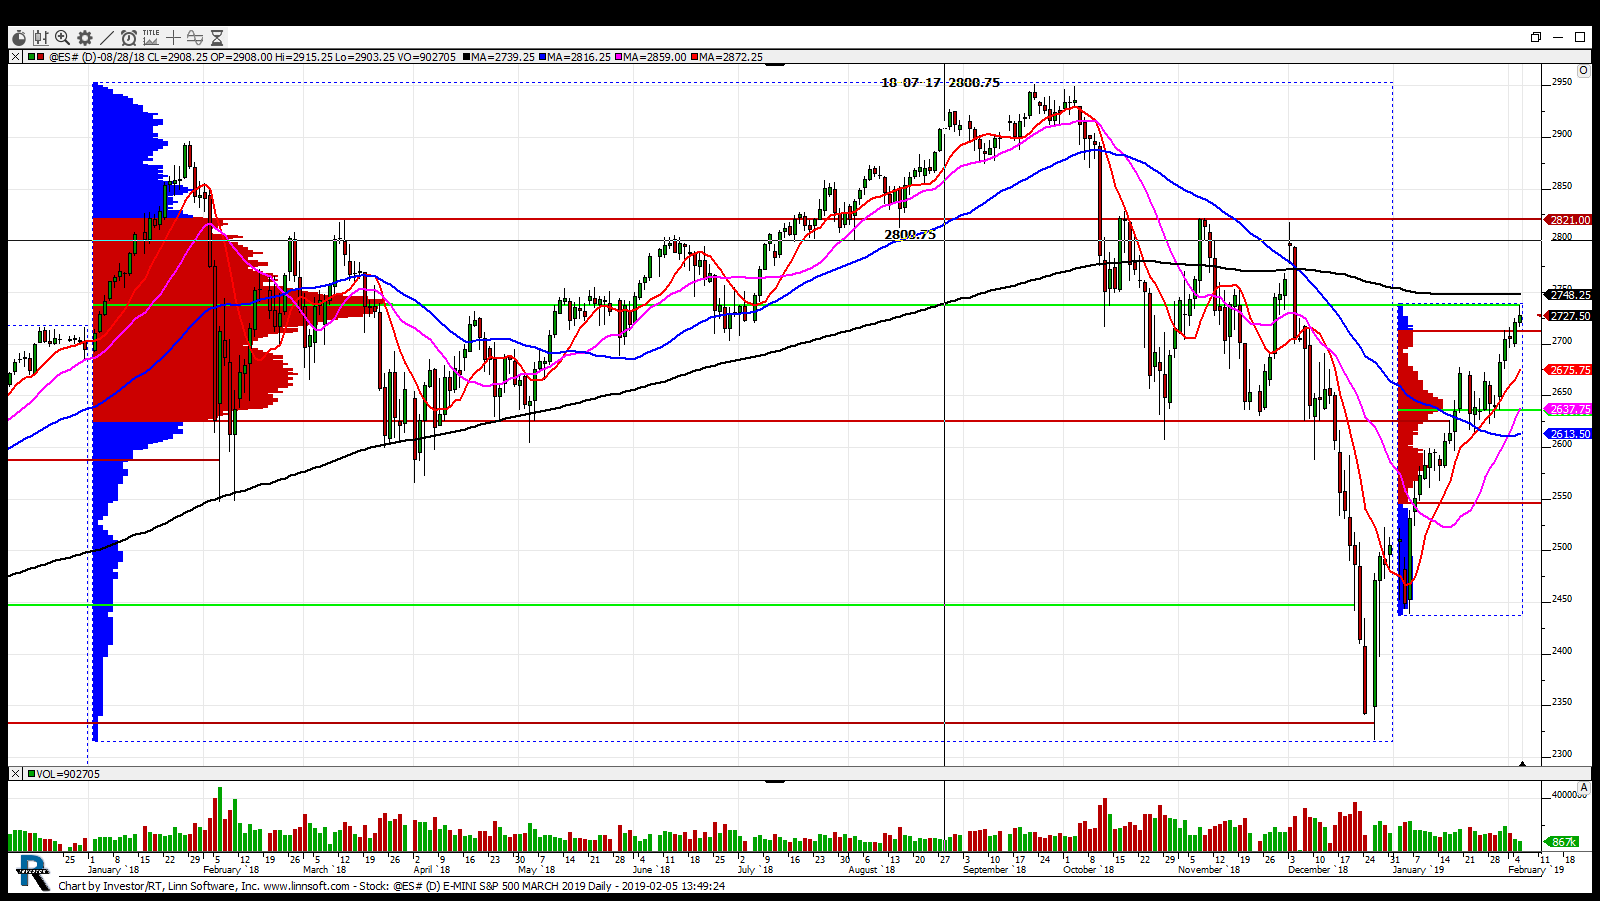
Stock (@ES#) npettinato [totalcount]
7 years 5 months ago
This chart was uploaded by Investor/RT 13.5.17 showing symbol: @ES#. |
View |
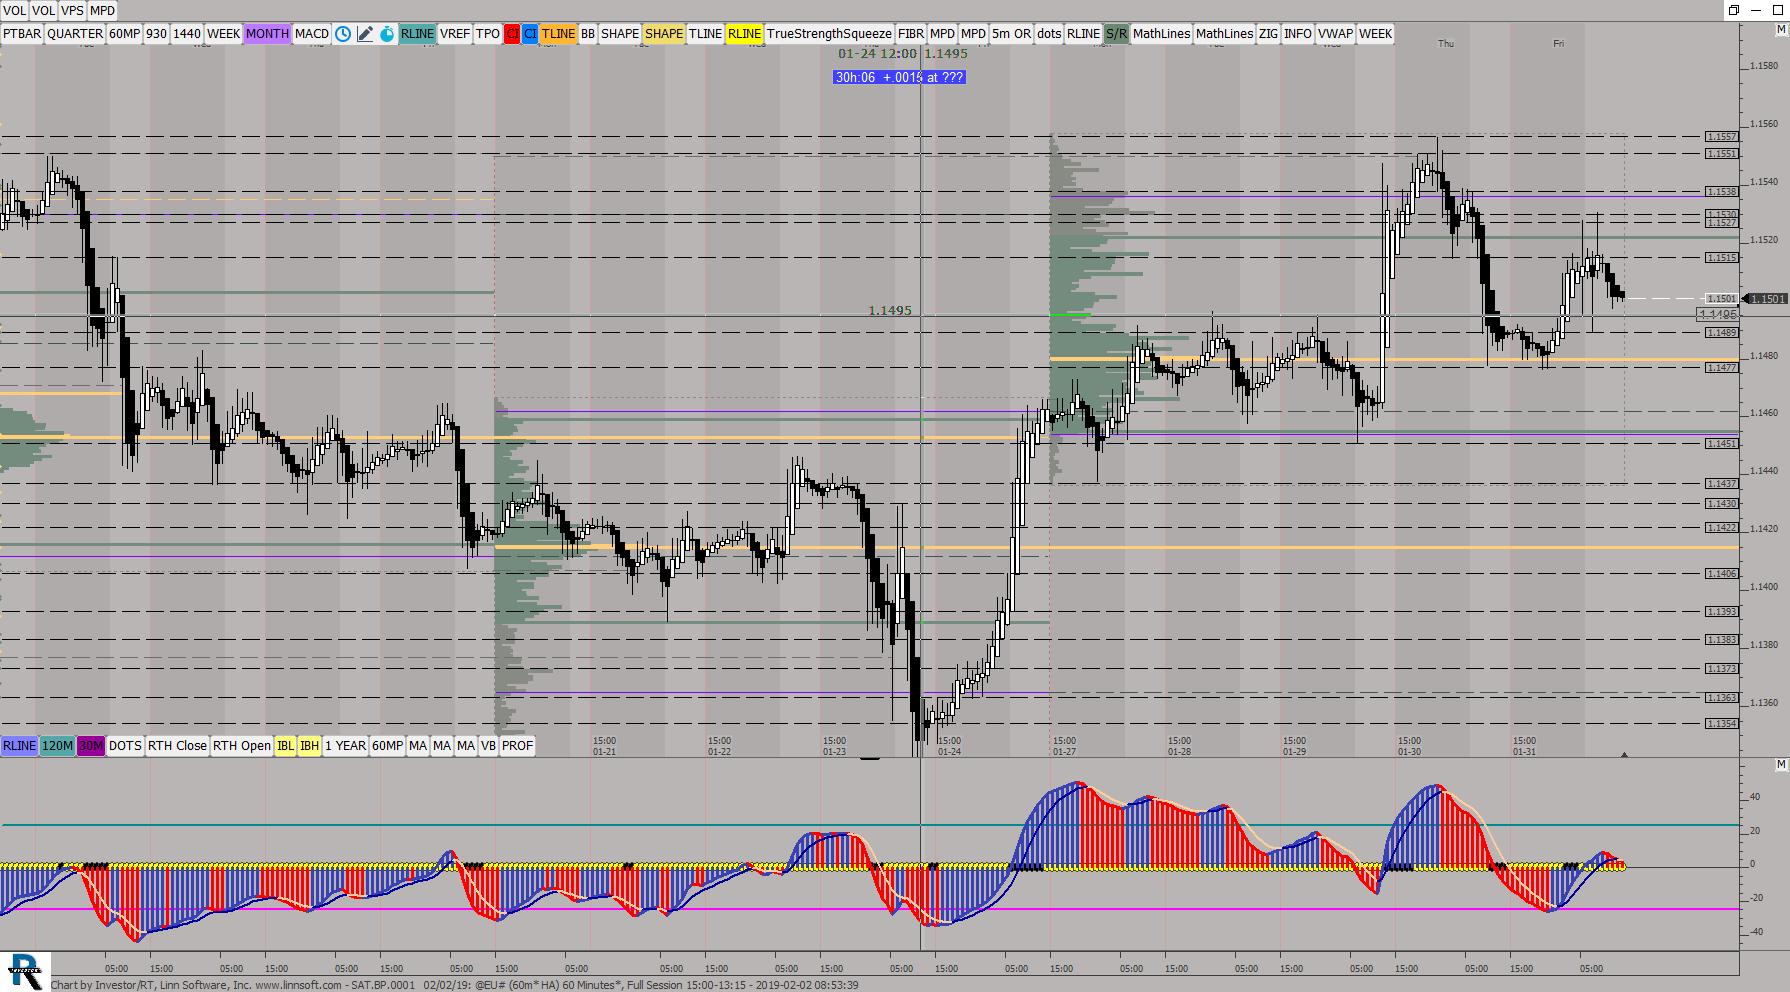 |
SATBP0001 02 02 (@EU#) ES42 [totalcount]
7 years 6 months ago
This chart was uploaded by Investor/RT 13.5.17 showing symbol: @EU#. |
View |
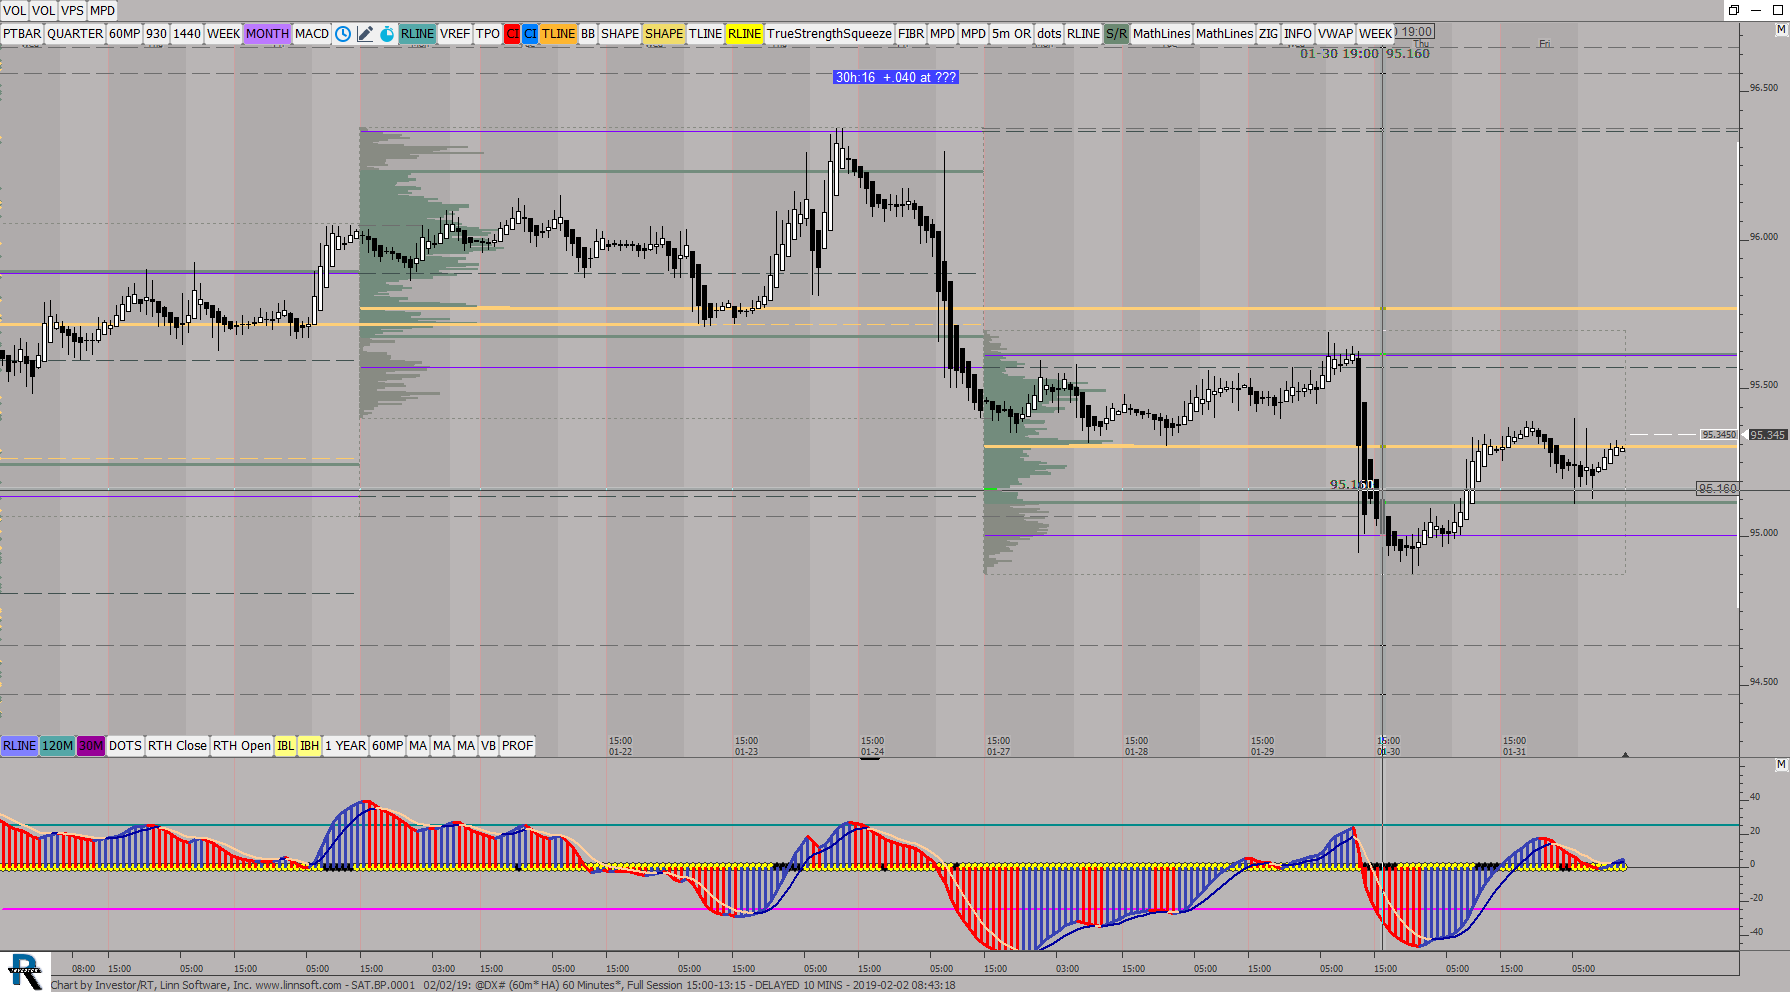 |
SATBP0001 02 02 (@DX#) ES42 [totalcount]
7 years 6 months ago
This chart was uploaded by Investor/RT 13.5.17 showing symbol: @DX#. |
View |
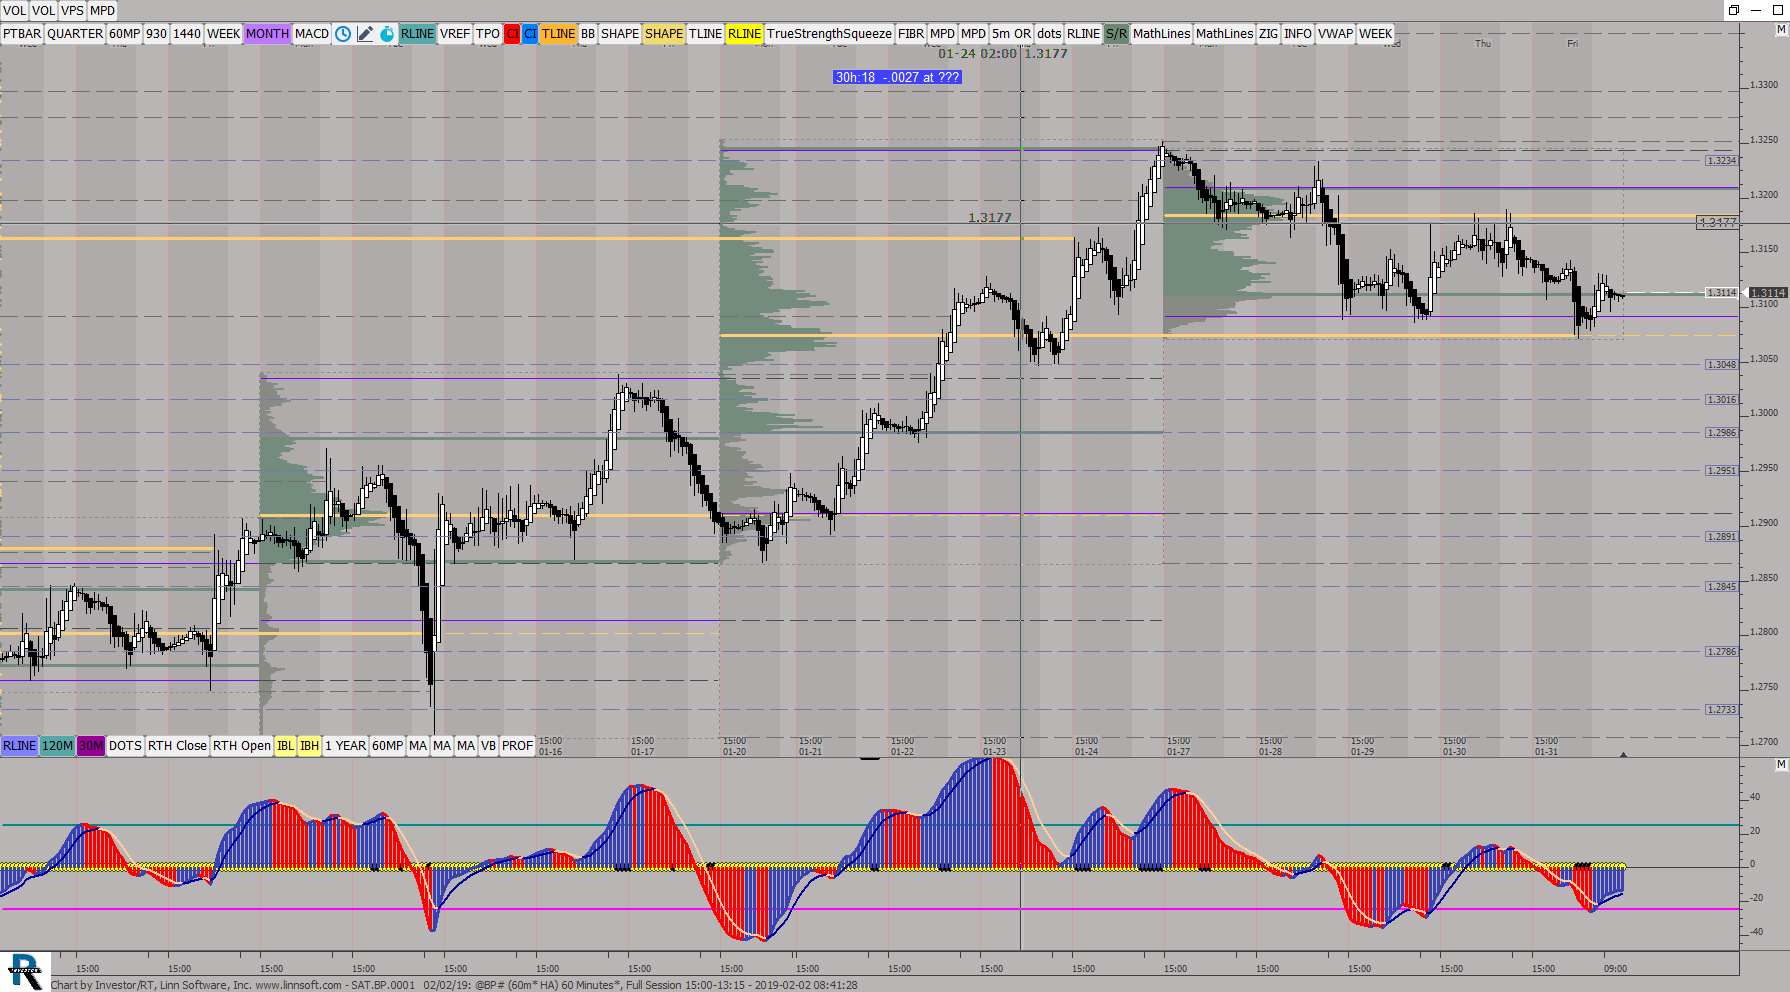 |
SATBP0001 02 02 (@BP#) ES42 [totalcount]
7 years 6 months ago
This chart was uploaded by Investor/RT 13.5.17 showing symbol: @BP#. |
View |
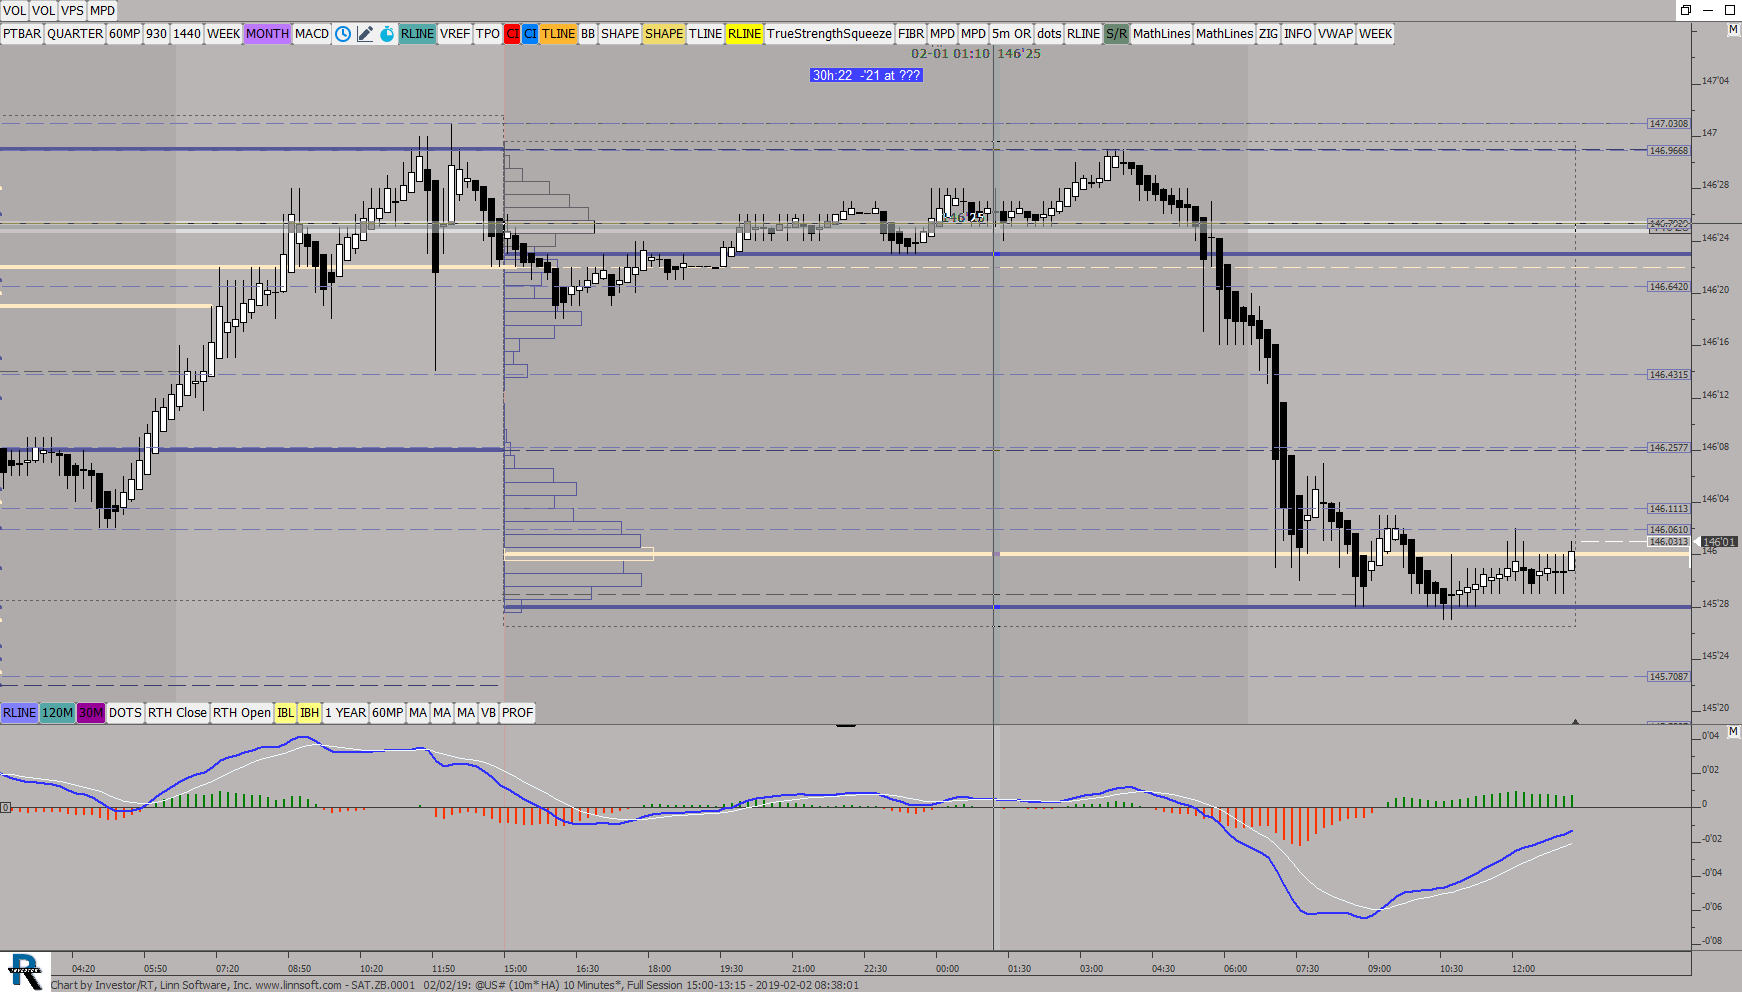 |
SATZB0001 02 02 (@US#) ES42 [totalcount]
7 years 6 months ago
This chart was uploaded by Investor/RT 13.5.17 showing symbol: @US#. |
View |
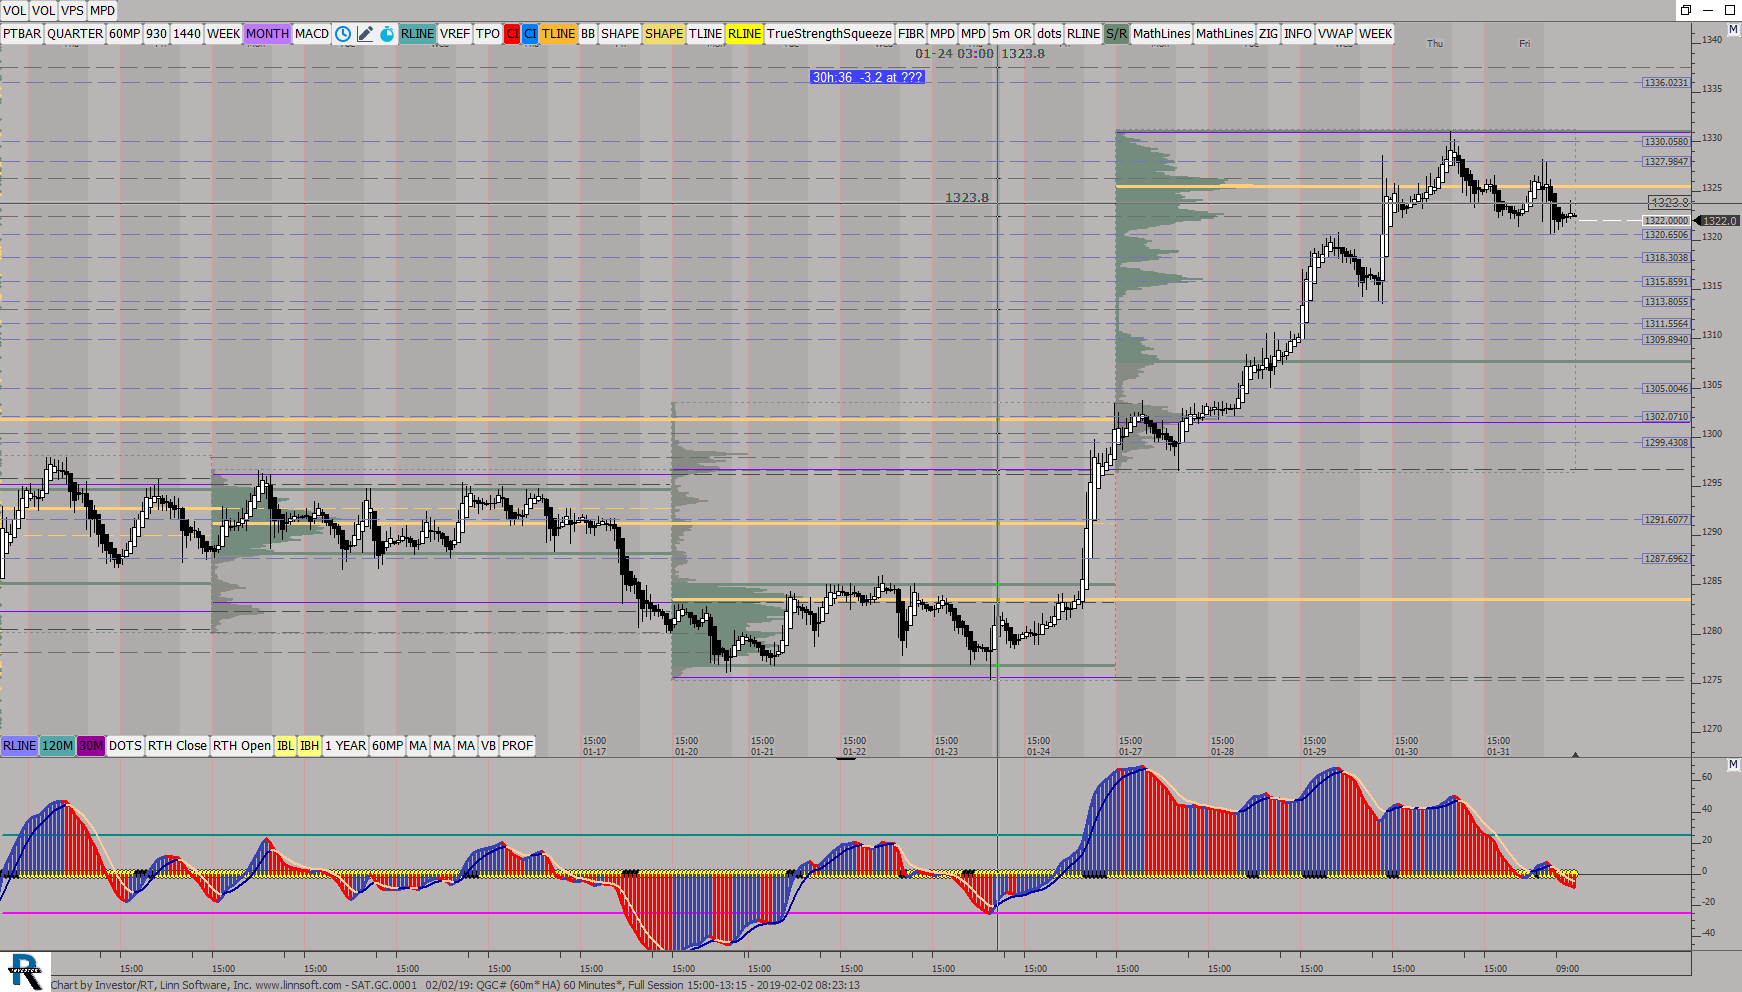 |
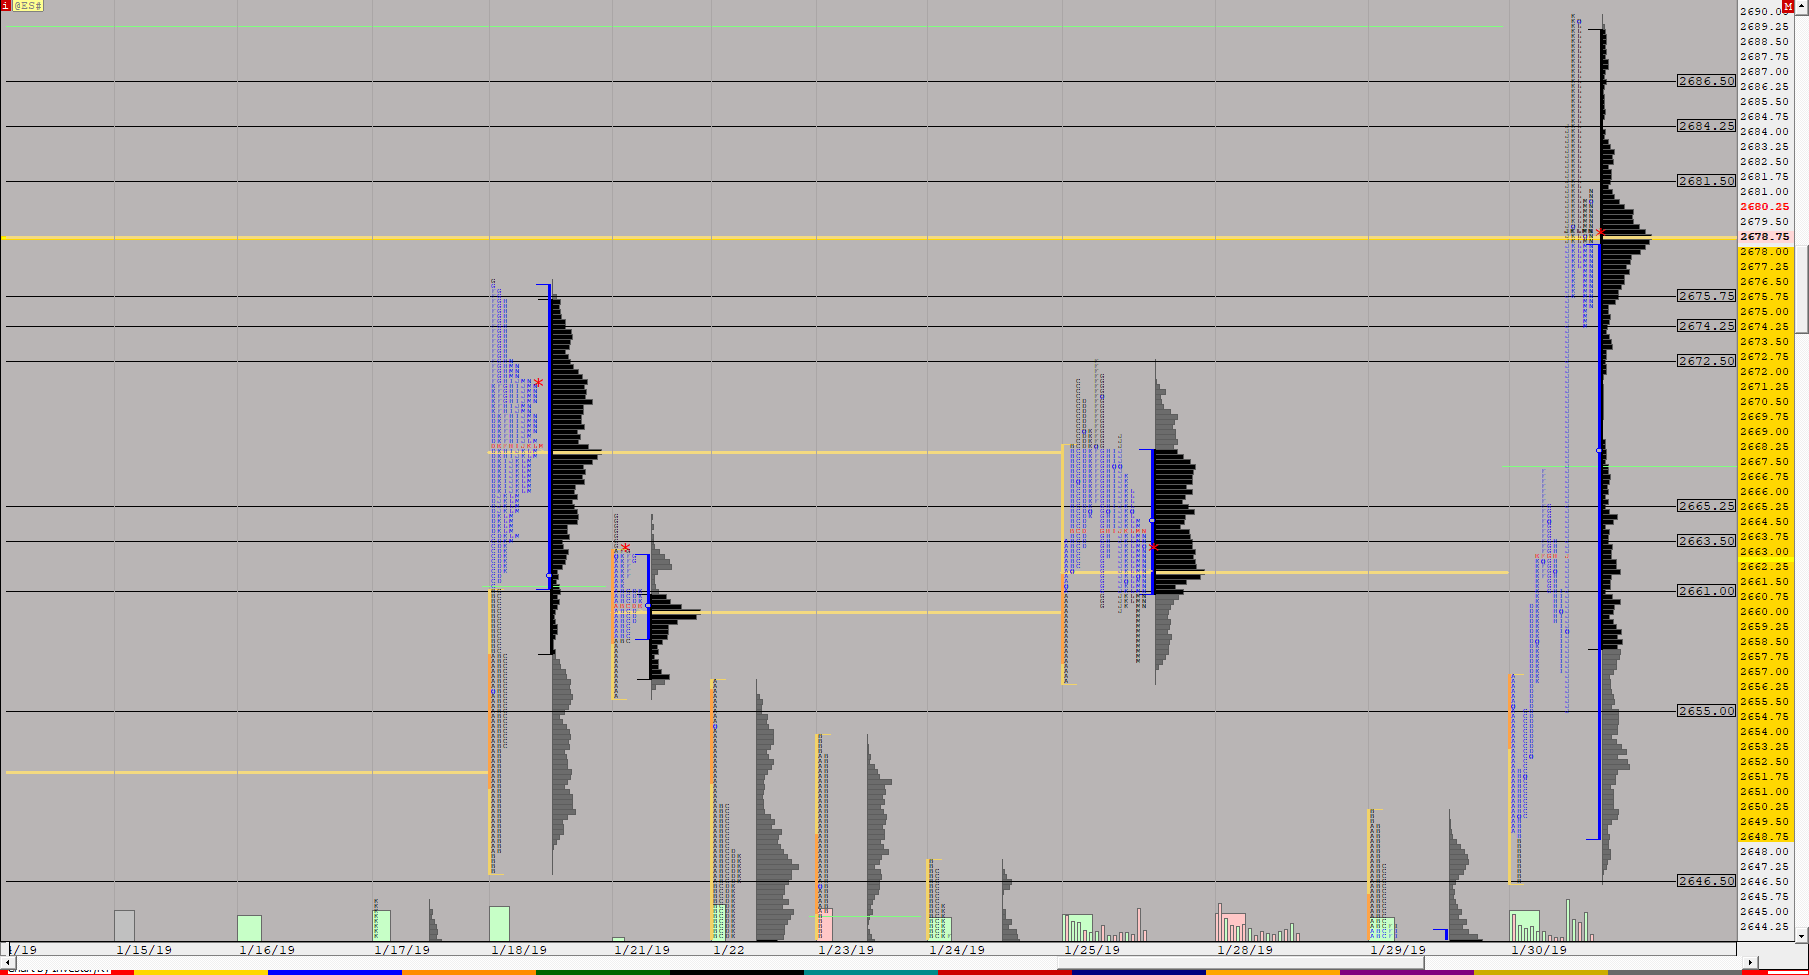
SATGC0001 02 02 (QGC#) ES42 [totalcount]
7 years 6 months ago
Weekly Profiles. This chart was uploaded by Investor/RT 13.5.17 showing symbol: QGC#. |
View |
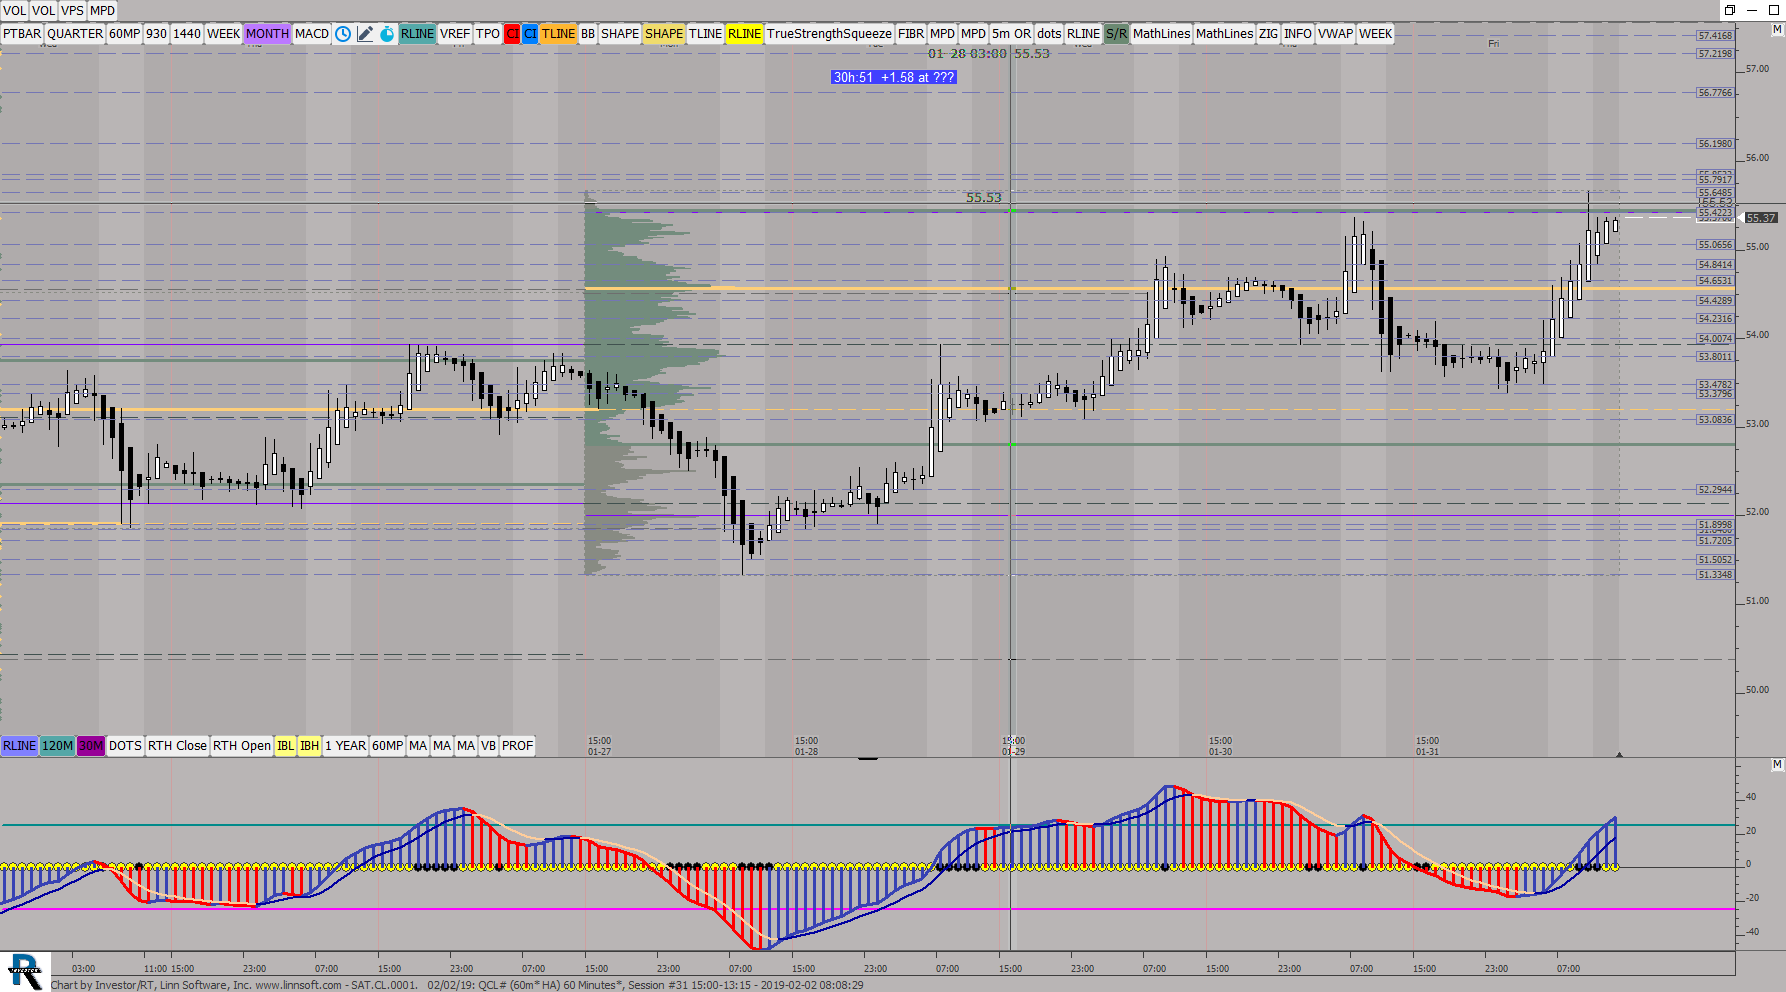 |
SATCL0001 02 02 (QCL#) ES42 [totalcount]
7 years 6 months ago
Weekly Profiles. This chart was uploaded by Investor/RT 13.5.17 showing symbol: QCL#. |
View |
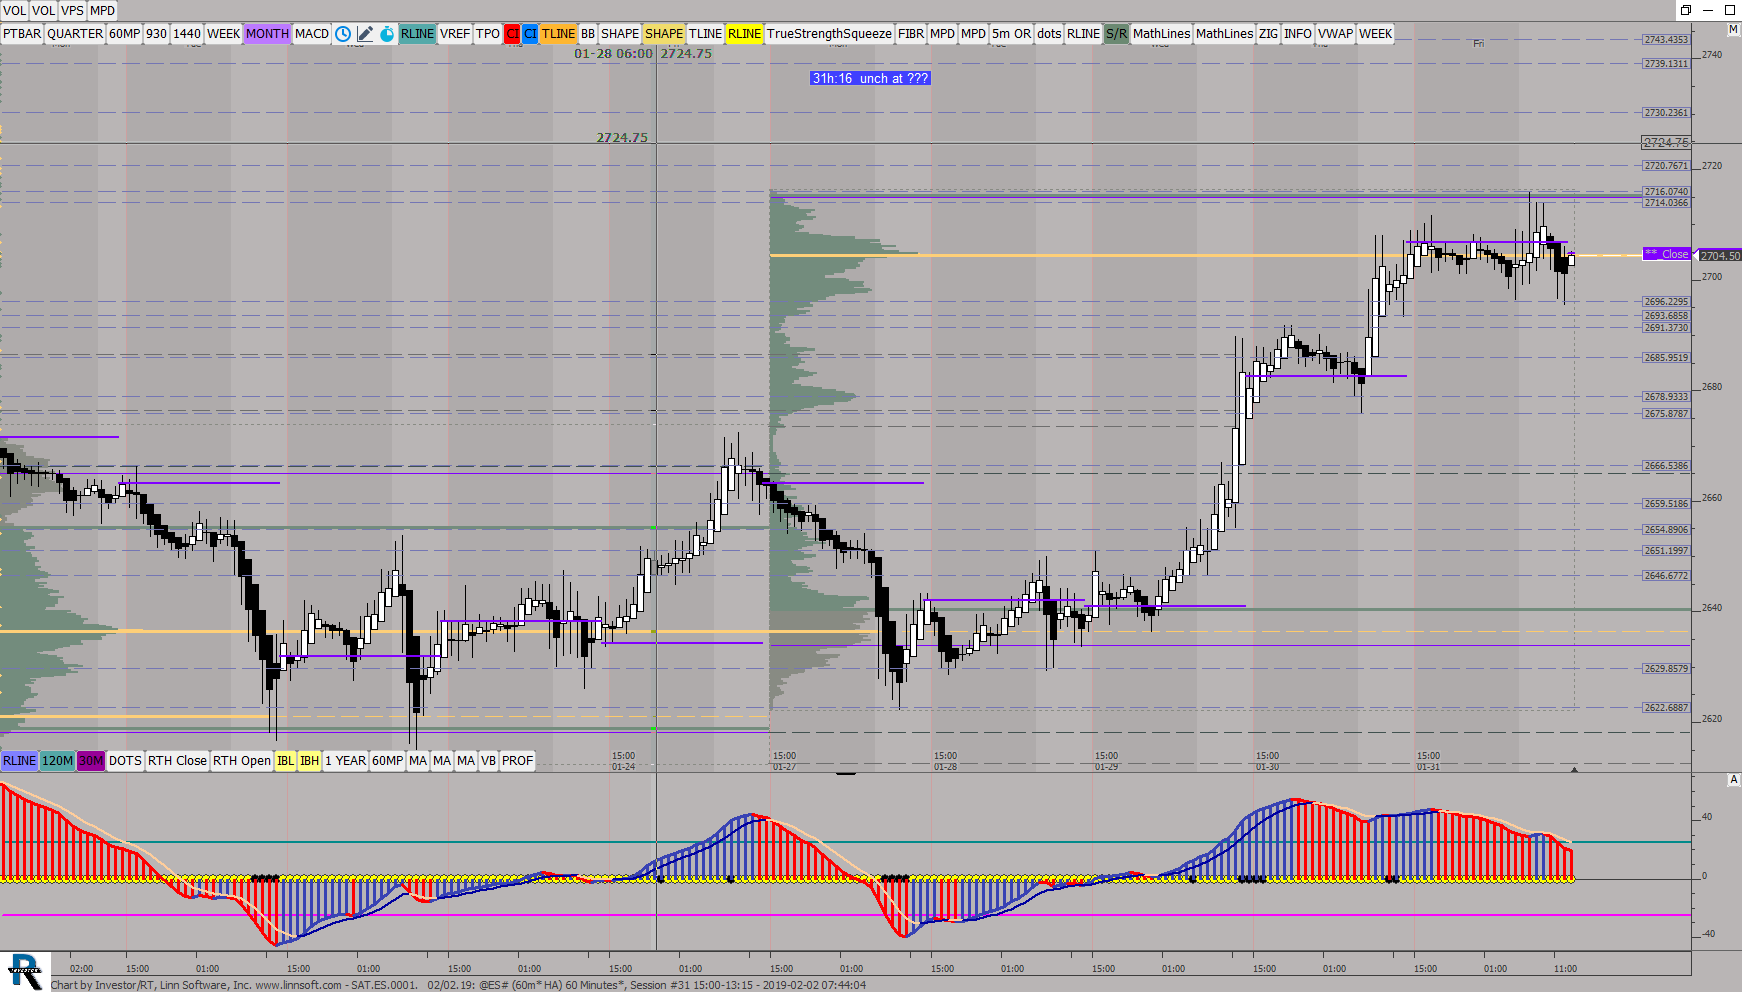 |
SATES0001 02 (@ES#) ES42 [totalcount]
7 years 6 months ago
Week Profile and hourly Candles. This chart was uploaded by Investor/RT 13.5.17 showing symbol: @ES#. |
View |
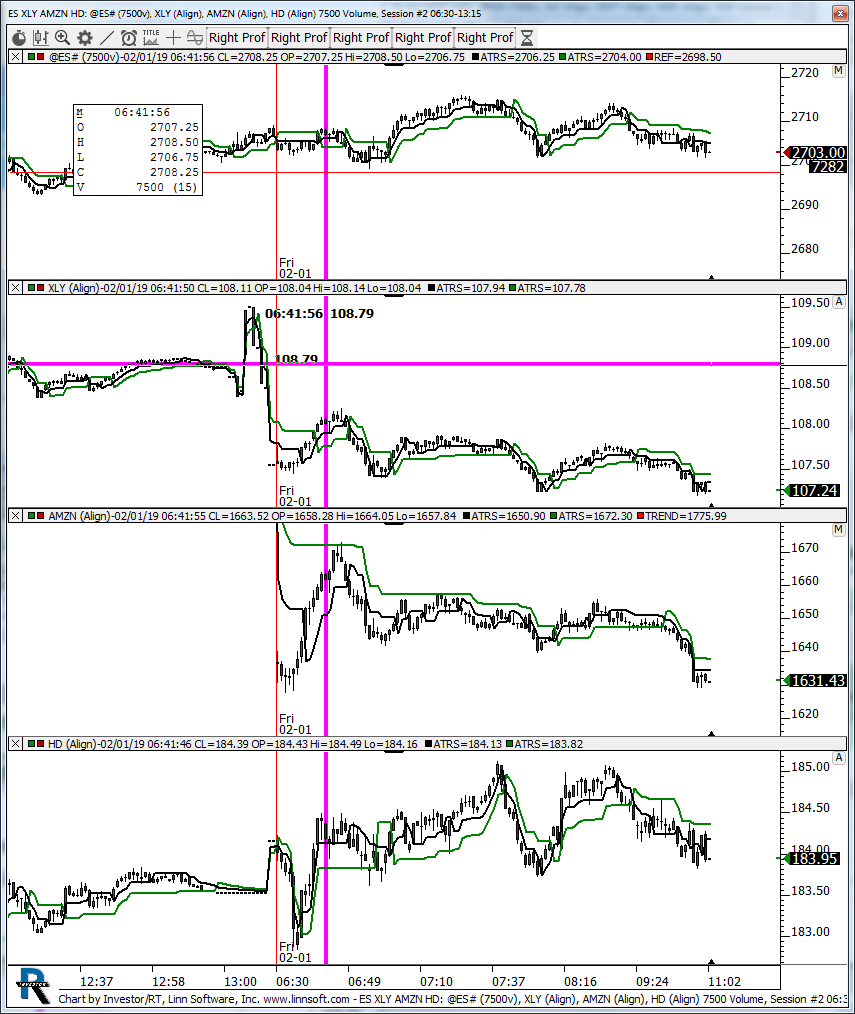 |
ES XLY AMZN HD (@ES#) kencassorla [totalcount]
7 years 6 months ago
xly. This chart was uploaded by Investor/RT 13.5.17 showing symbol: @ES#. |
View |
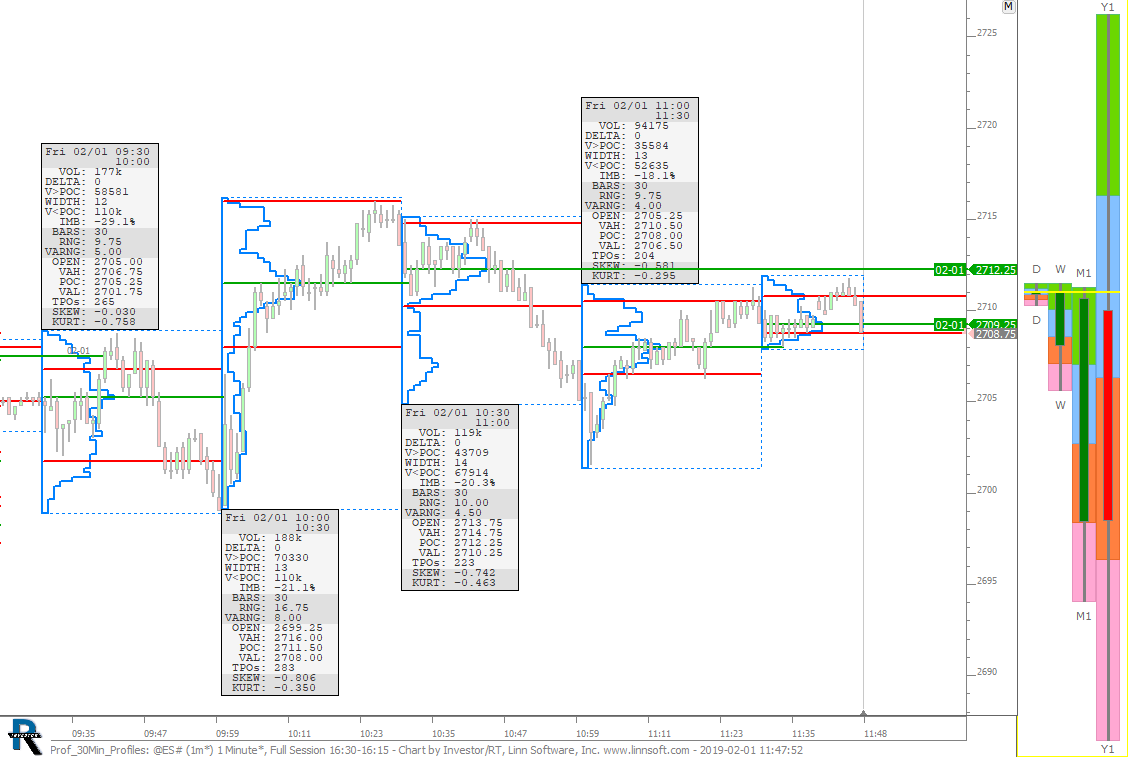 |
Prof 30Min Profiles (@ES#) cpayne [totalcount]
7 years 6 months ago
Profile Indicator - 30 Minute Profiles - 1 Minute TPOs. This chart was uploaded by Investor/RT 13.5.17 showing symbol: @ES#. |
View |
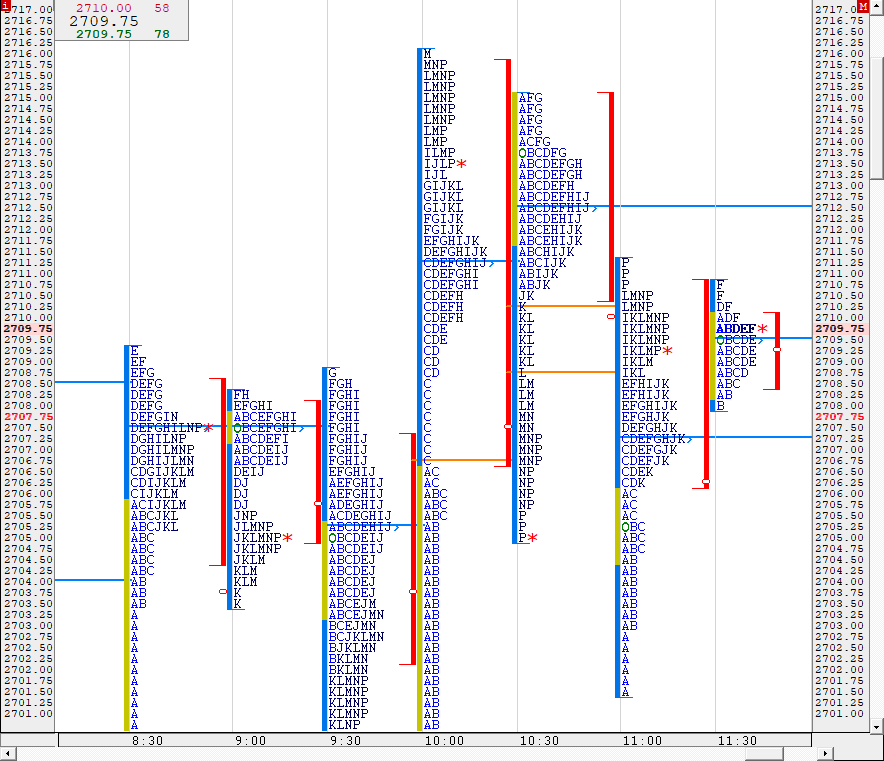 |
TPO 30Min ES (@ES#) cpayne [totalcount]
7 years 6 months ago
30 Minute Profiles - 2 Minute TPOs. This chart was uploaded by Investor/RT 13.5.17 showing symbol: @ES#. |
View |
 |
S R Daily TPOCL (@ES#) ES42 [totalcount]
7 years 6 months ago
This chart was uploaded by Investor/RT 13.5.16 showing symbol: @ES#. |
View |
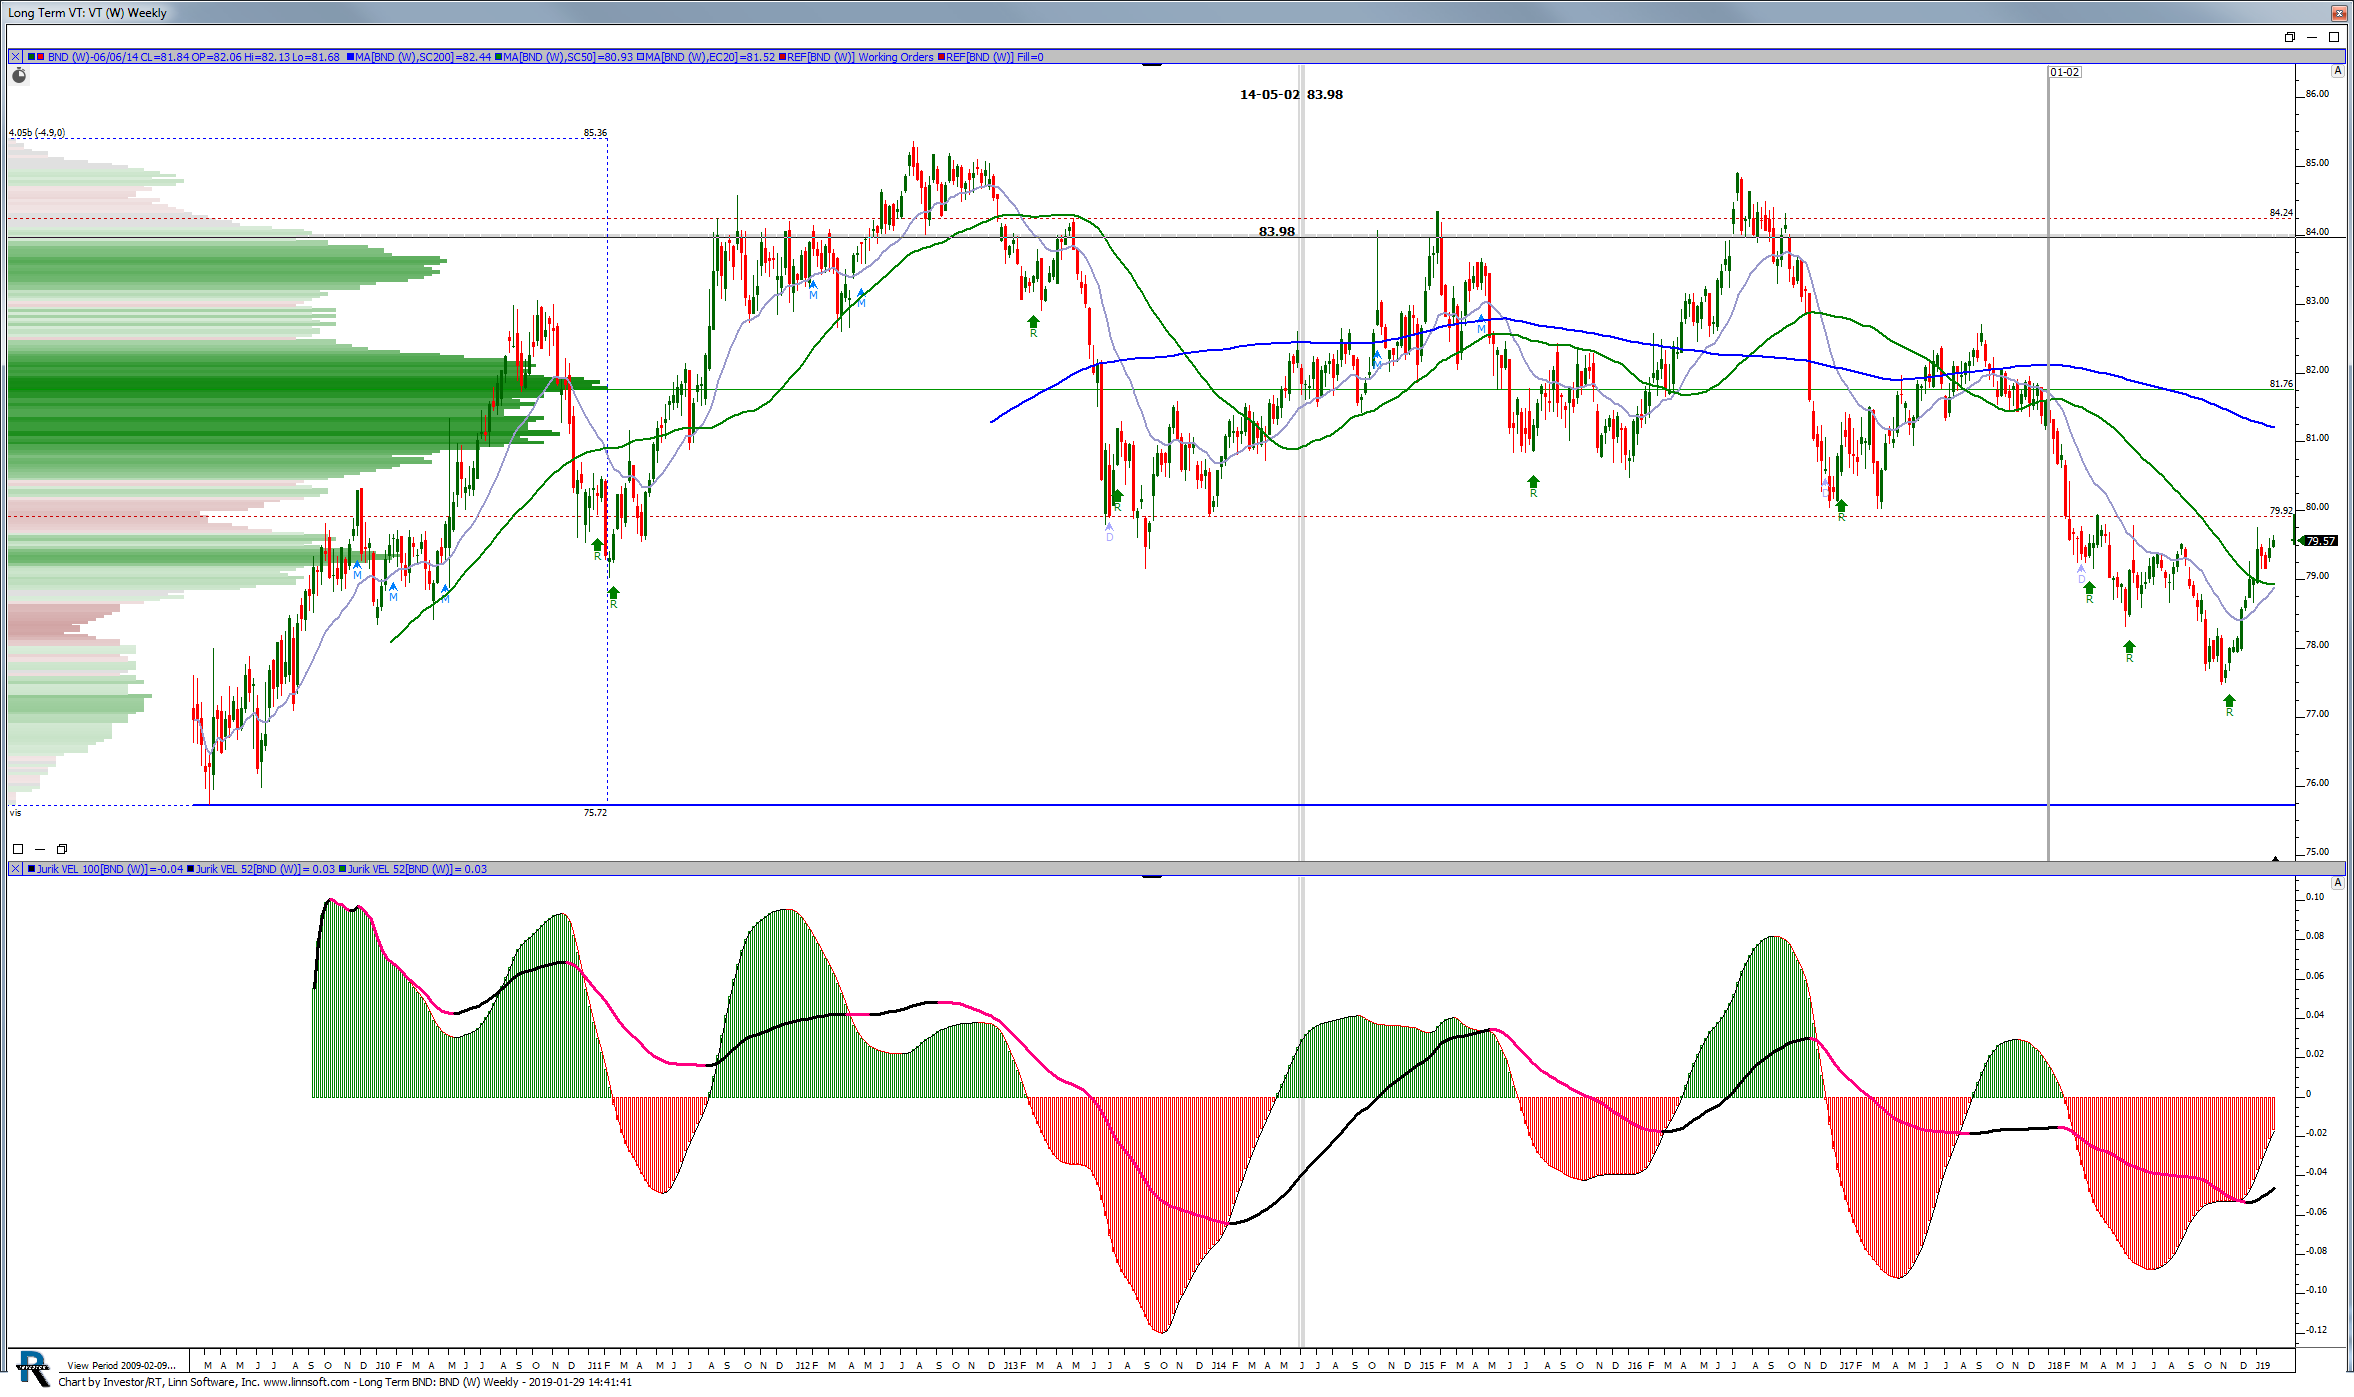 |
Long Term BND (BND) justin-detray [totalcount]
7 years 6 months ago
BND. This chart was uploaded by Investor/RT 13.5.14 showing symbol: BND. |
View |
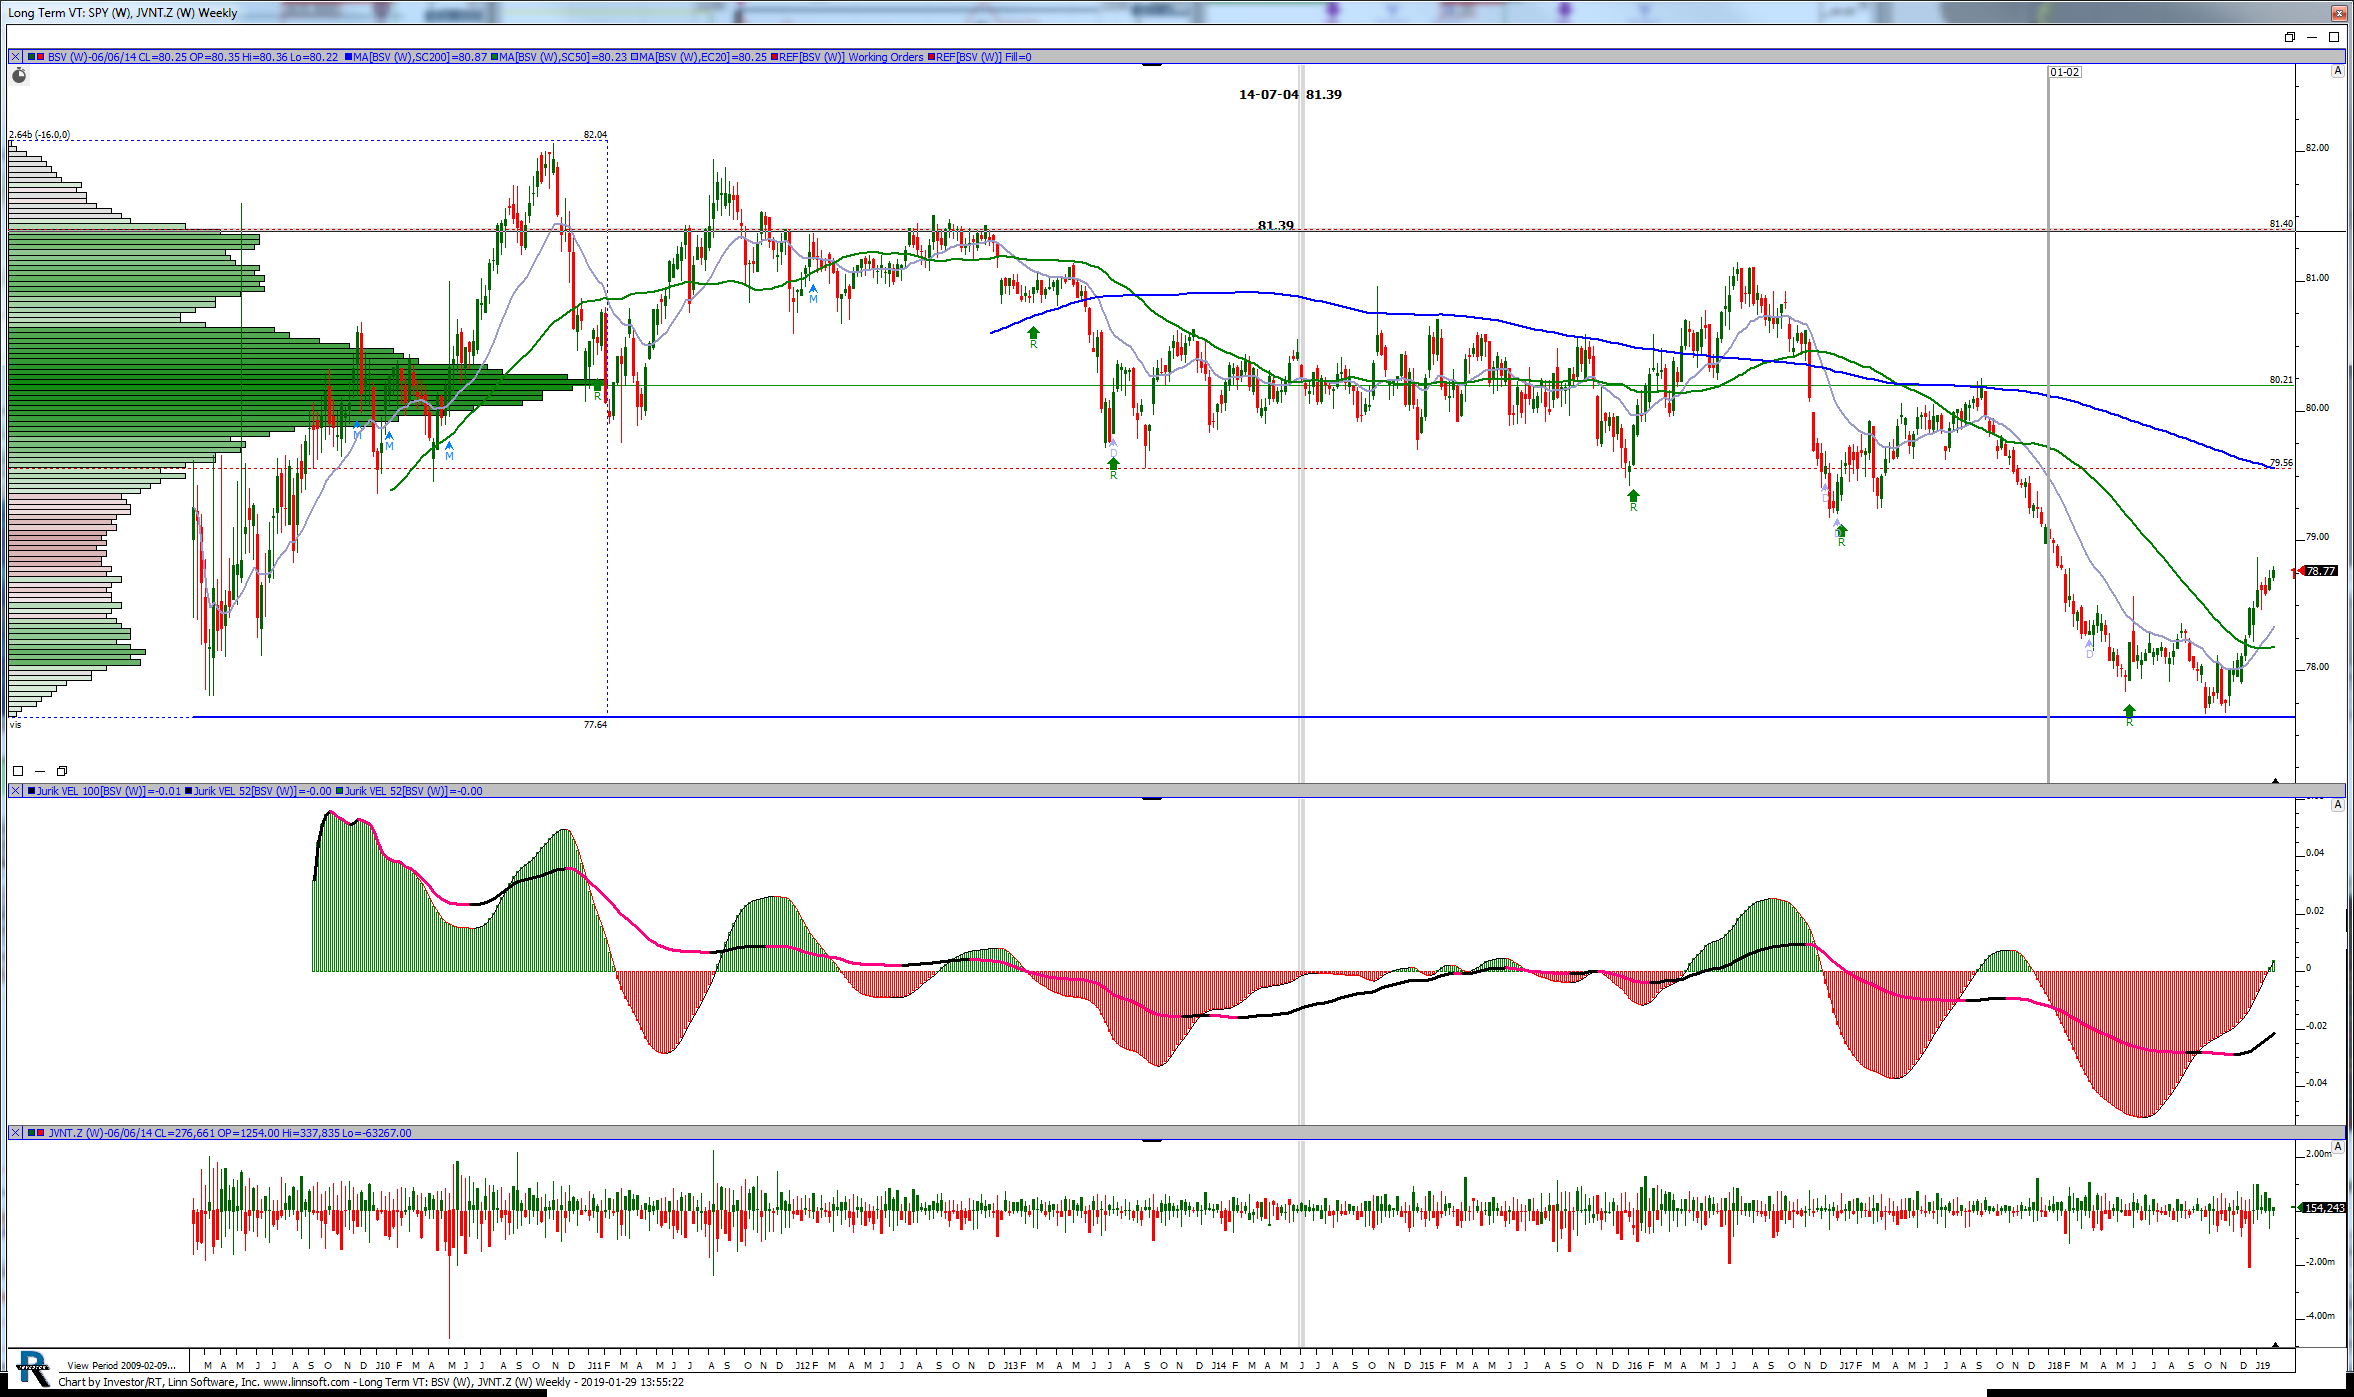 |
Long Term VT (BSV) justin-detray [totalcount]
7 years 6 months ago
BSV. This chart was uploaded by Investor/RT 13.5.14 showing symbol: BSV. |
View |
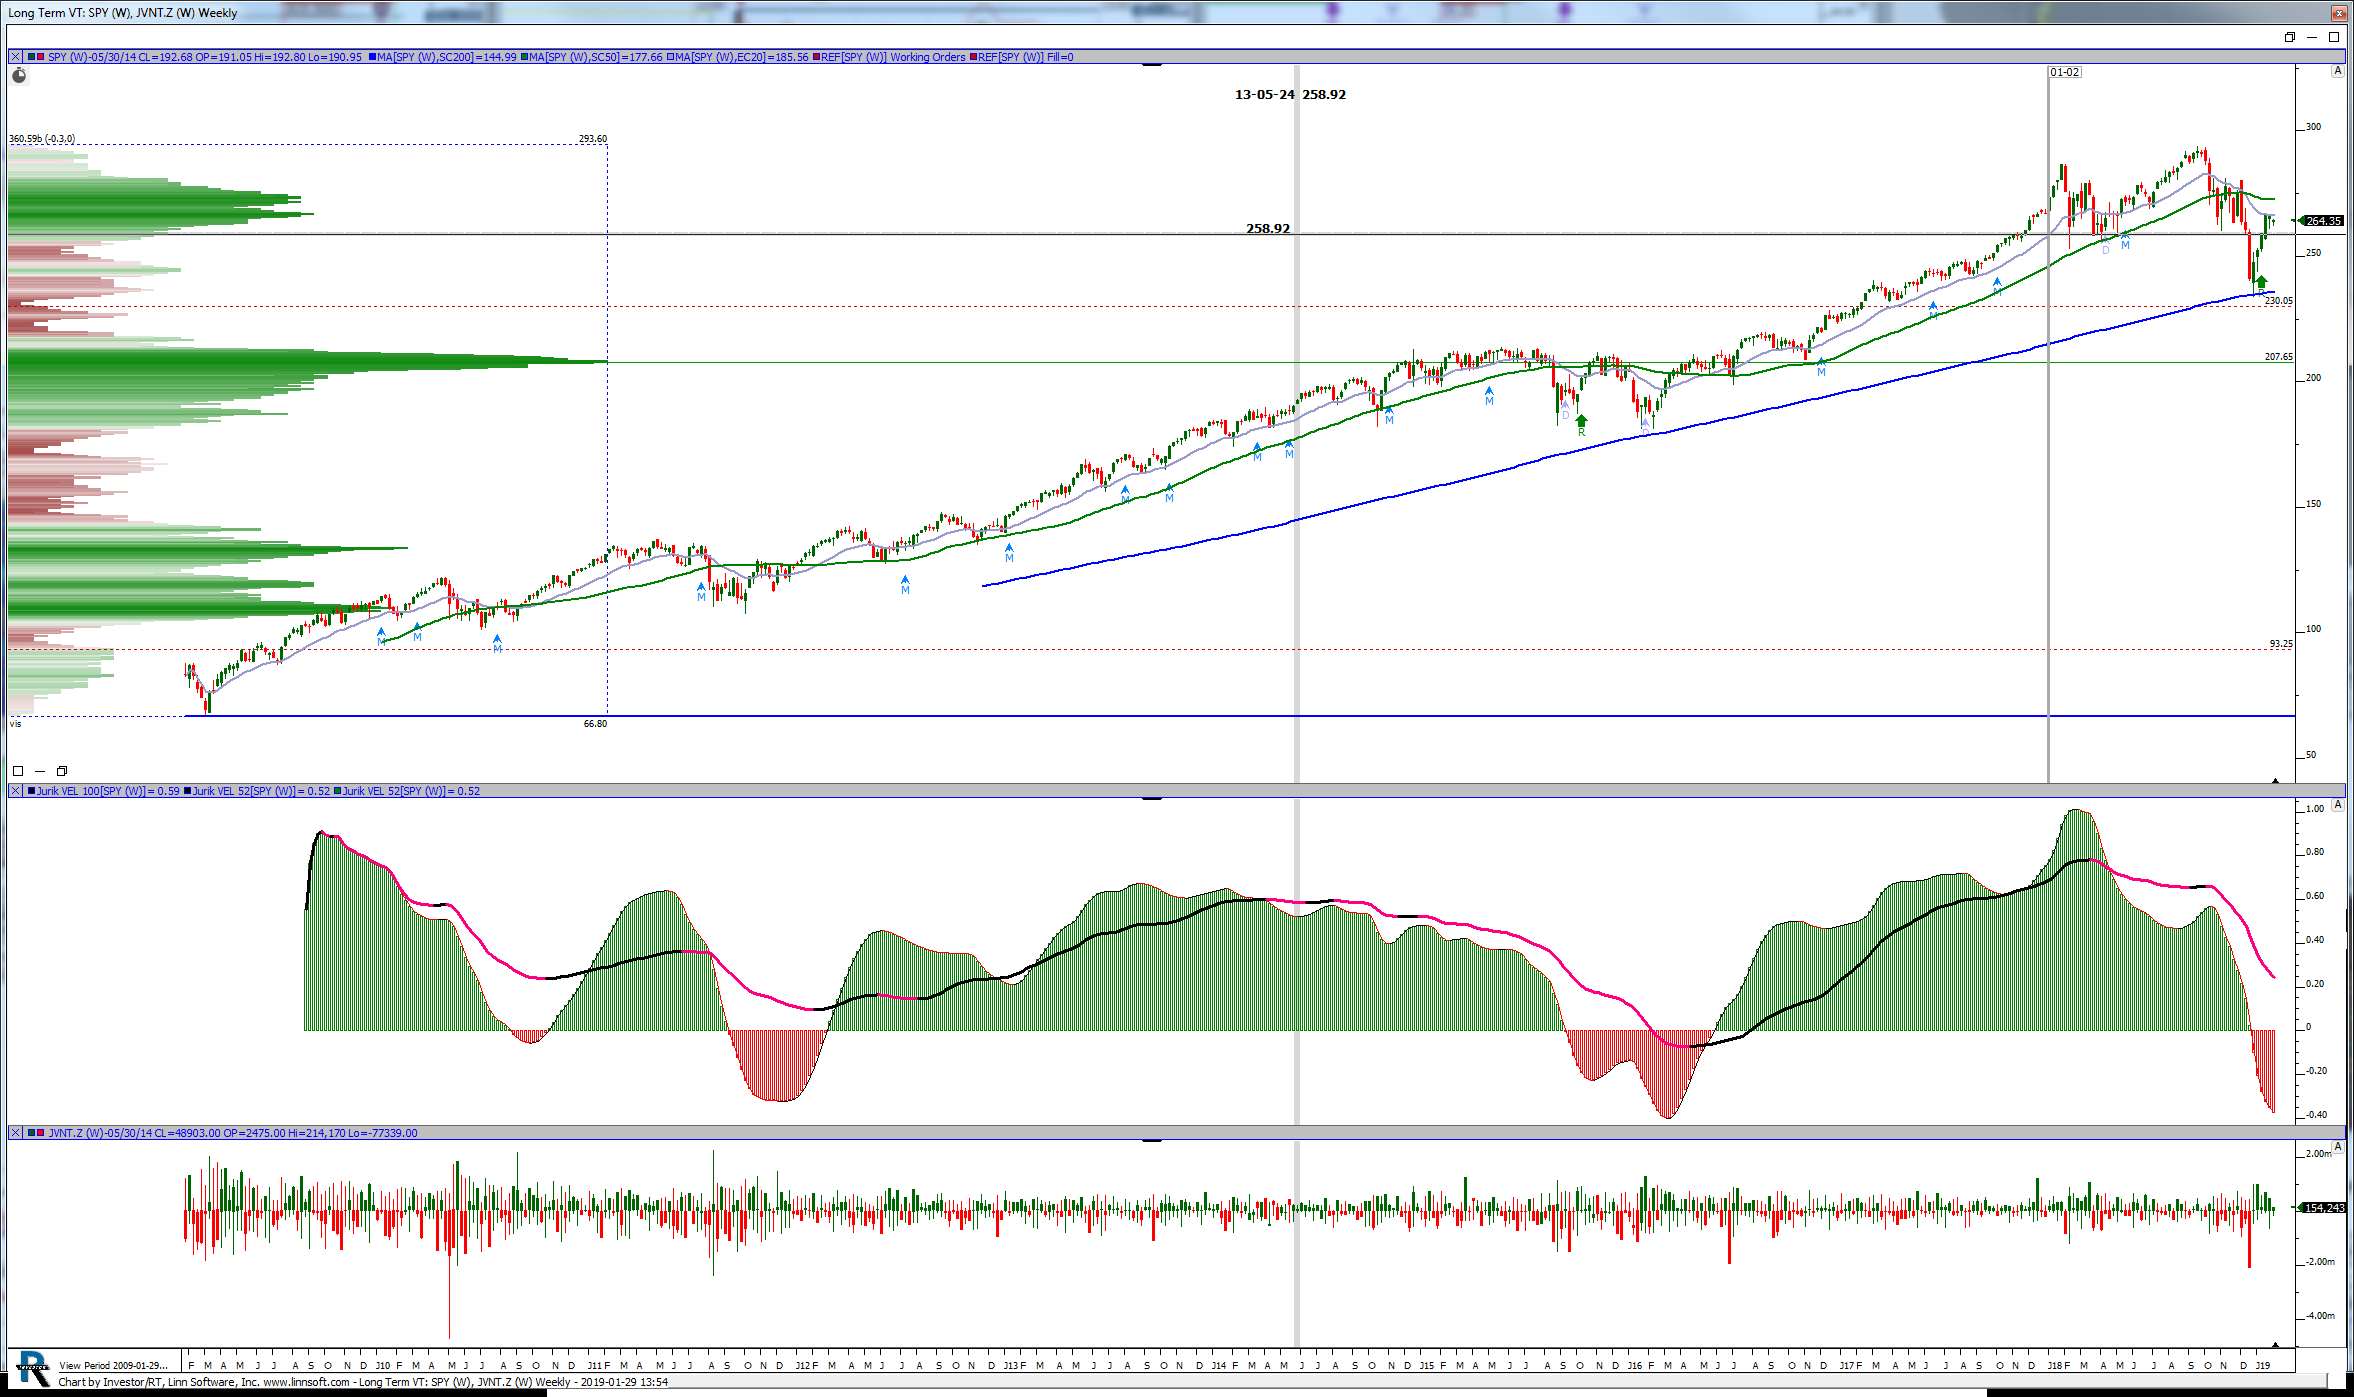 |
Long Term VT (SPY) justin-detray [totalcount]
7 years 6 months ago
SPY. This chart was uploaded by Investor/RT 13.5.14 showing symbol: SPY. |
View |
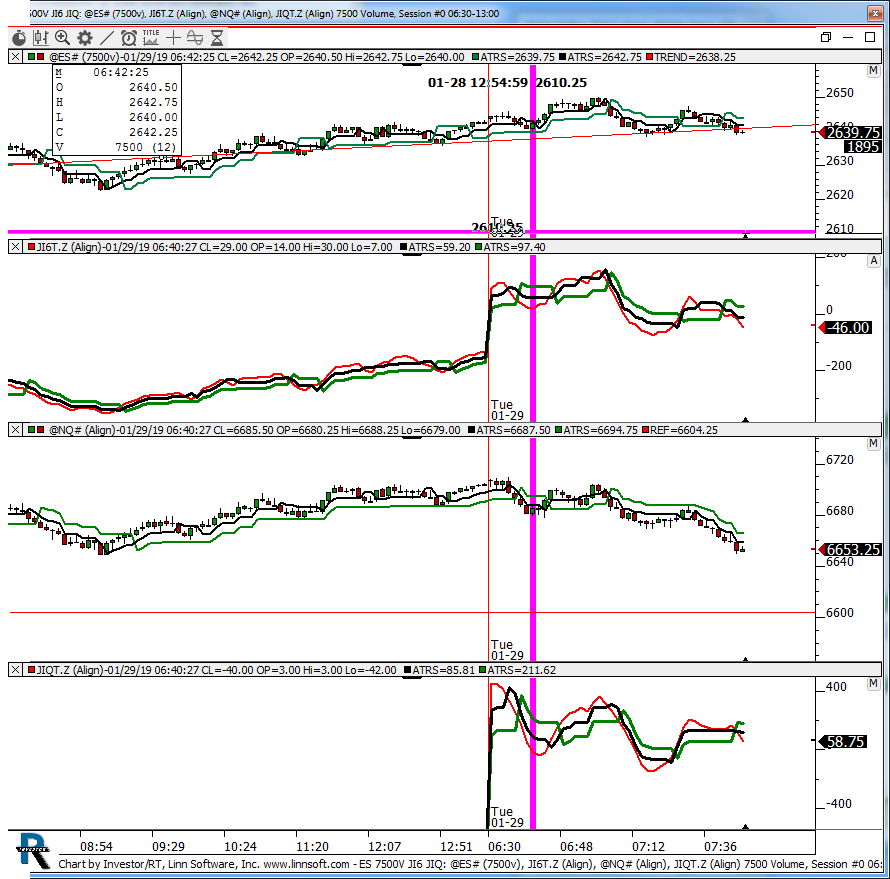 |
ES 7500V JI6 JIQ (@ES#) kencassorla [totalcount]
7 years 6 months ago
ji6 and q. This chart was uploaded by Investor/RT 13.5.13 showing symbol: @ES#. |
View |
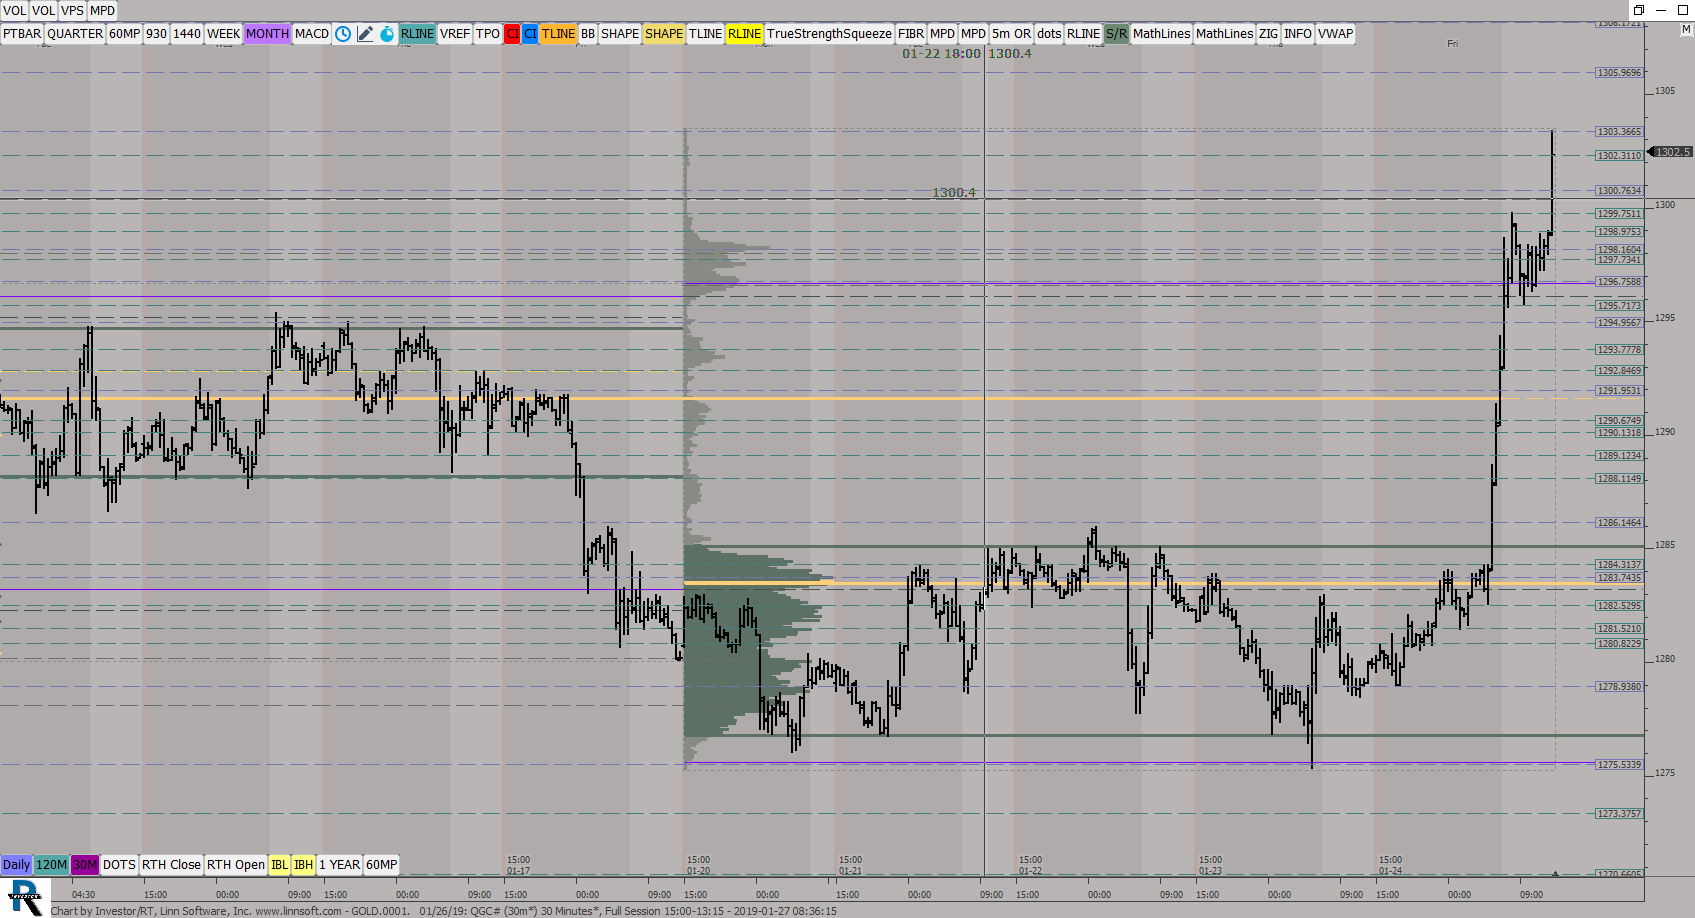 |
GOLD0001 01 26 (QGC#) ES42 [totalcount]
7 years 6 months ago
This chart was uploaded by Investor/RT 13.5.16 showing symbol: QGC#. |
View |
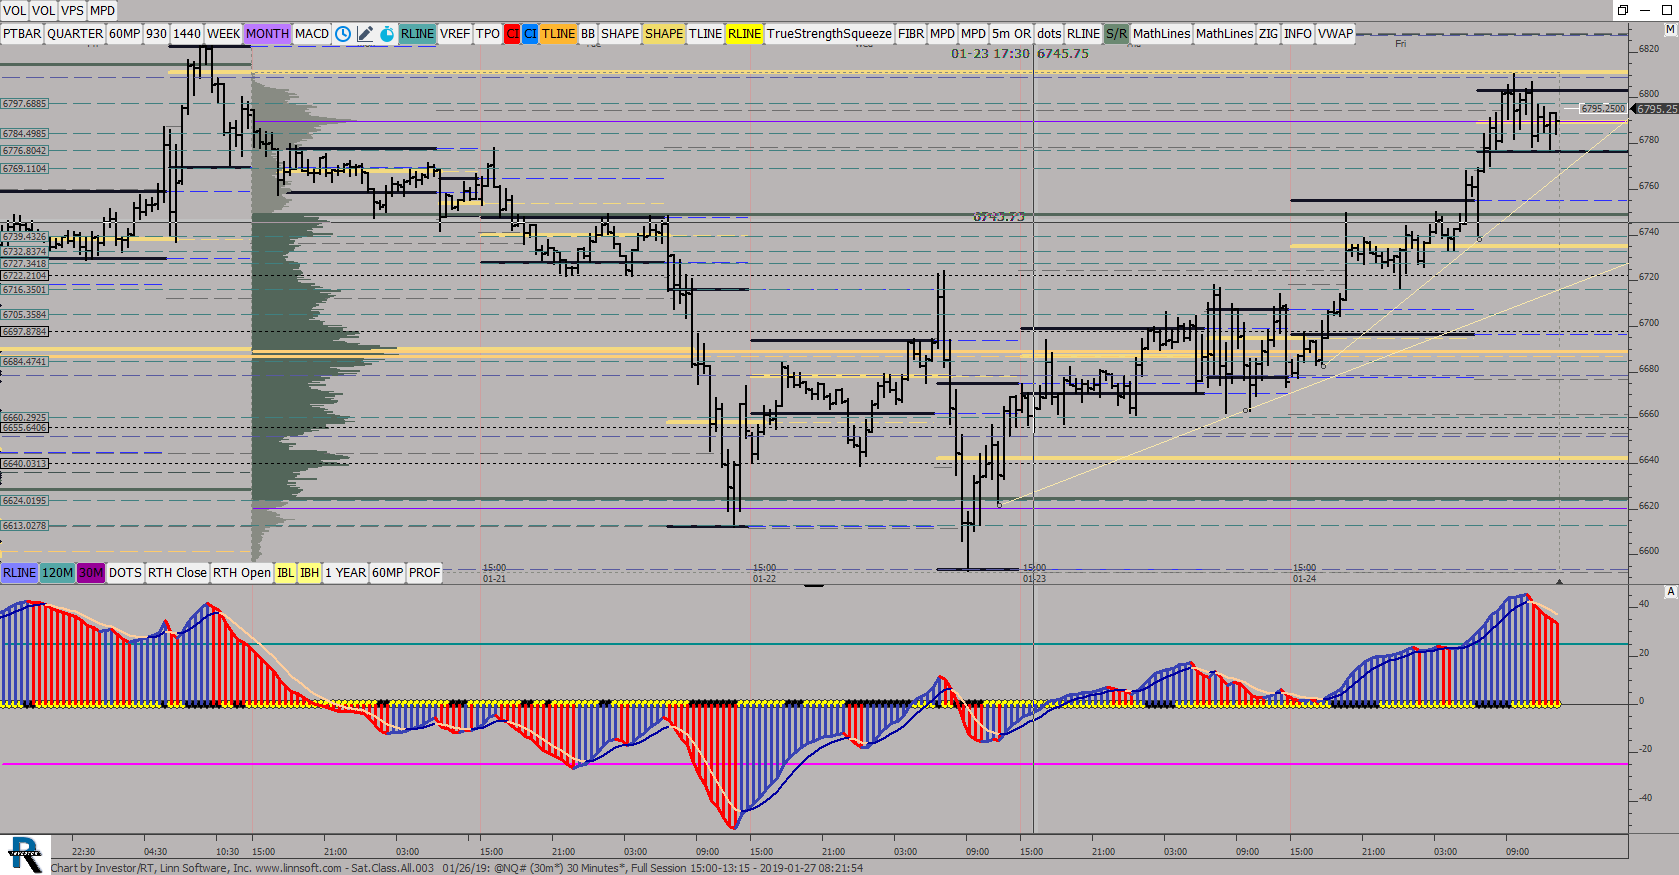 |
SatClassAll003 01 26 (@NQ#) ES42 [totalcount]
7 years 6 months ago
This chart was uploaded by Investor/RT 13.5.16 showing symbol: @NQ#. |
View |
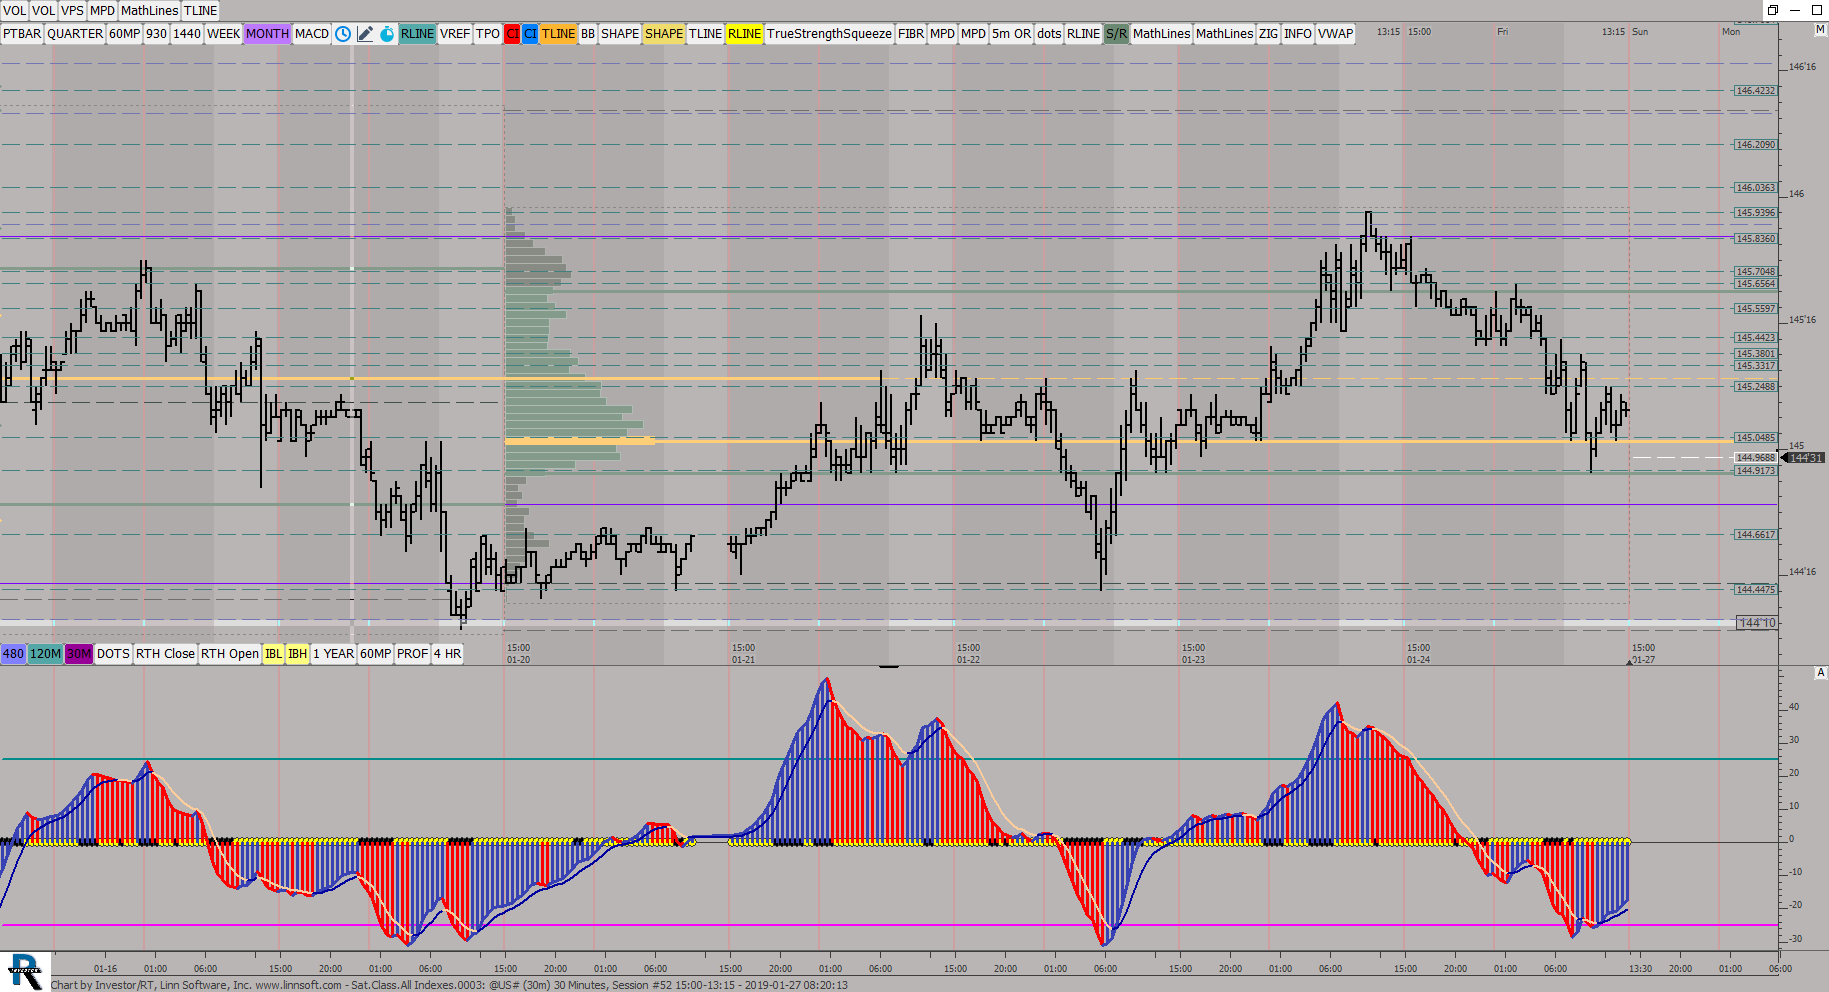 |
SatClassAll Indexes (@US#) ES42 [totalcount]
7 years 6 months ago
This chart was uploaded by Investor/RT 13.5.16 showing symbol: @US#. |
View |
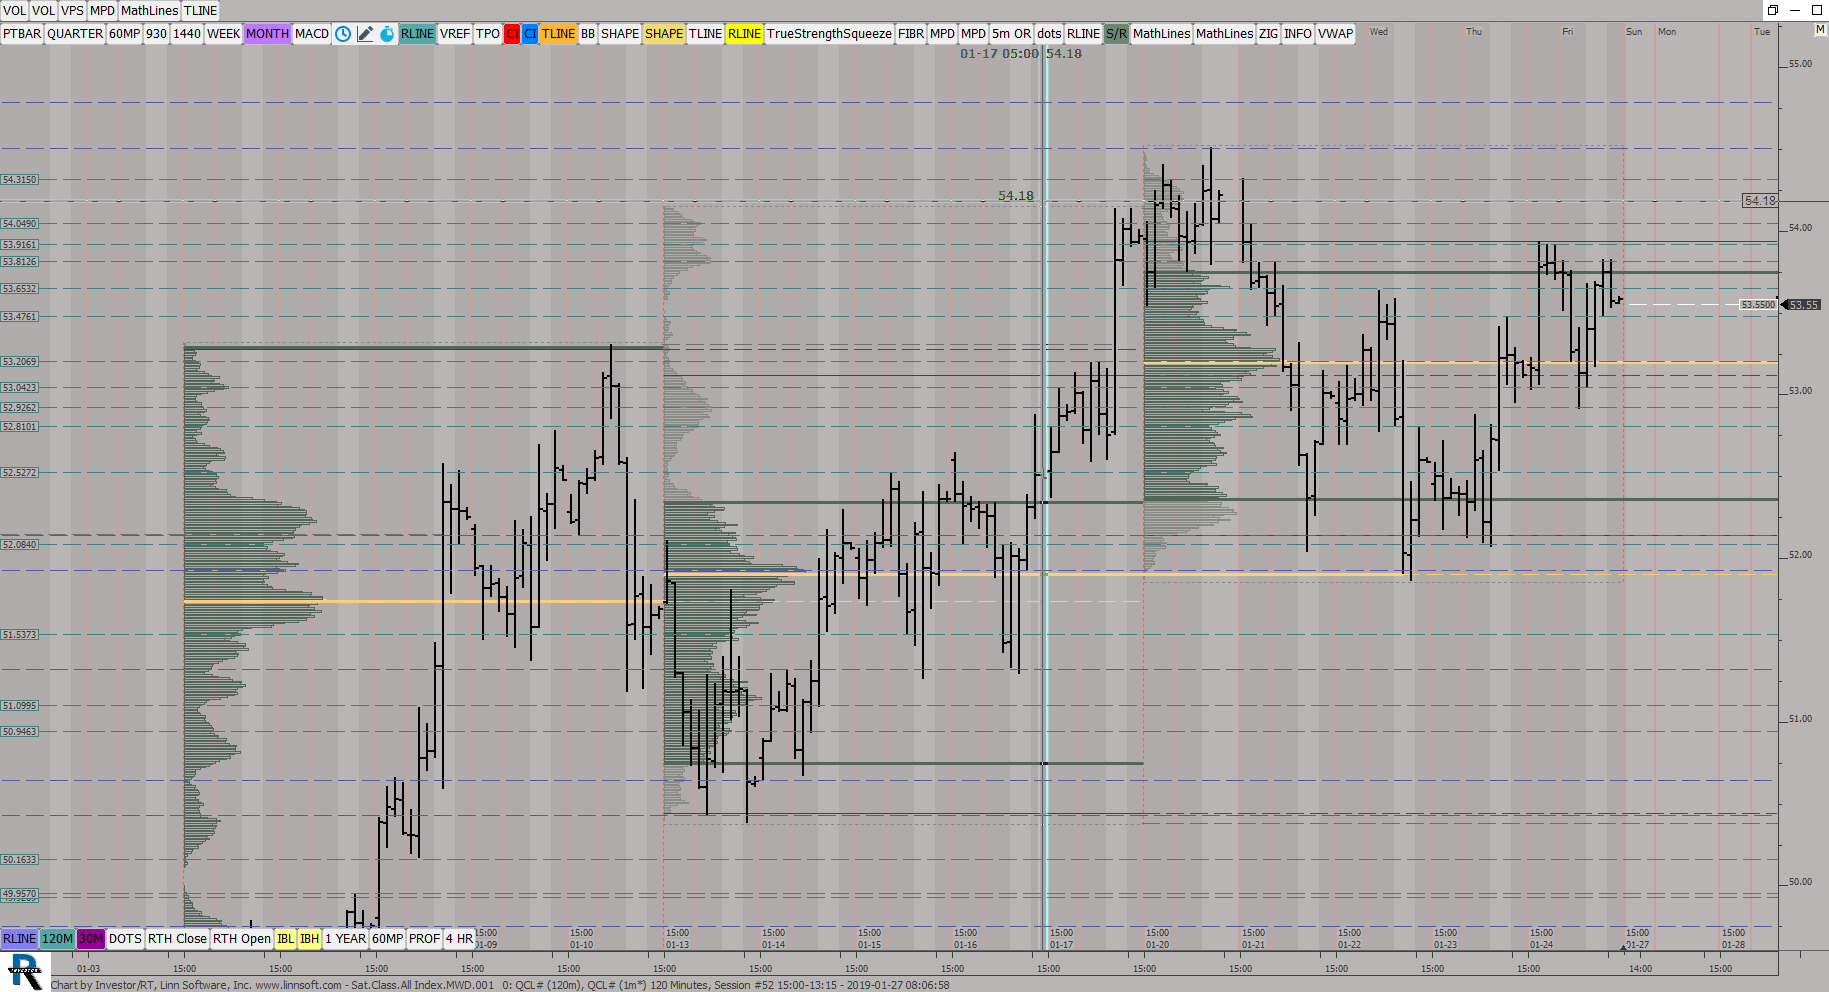 |
SatClassAll IndexMWD001 (QCL#) ES42 [totalcount]
7 years 6 months ago
This chart was uploaded by Investor/RT 13.5.16 showing symbol: QCL#. |
View |
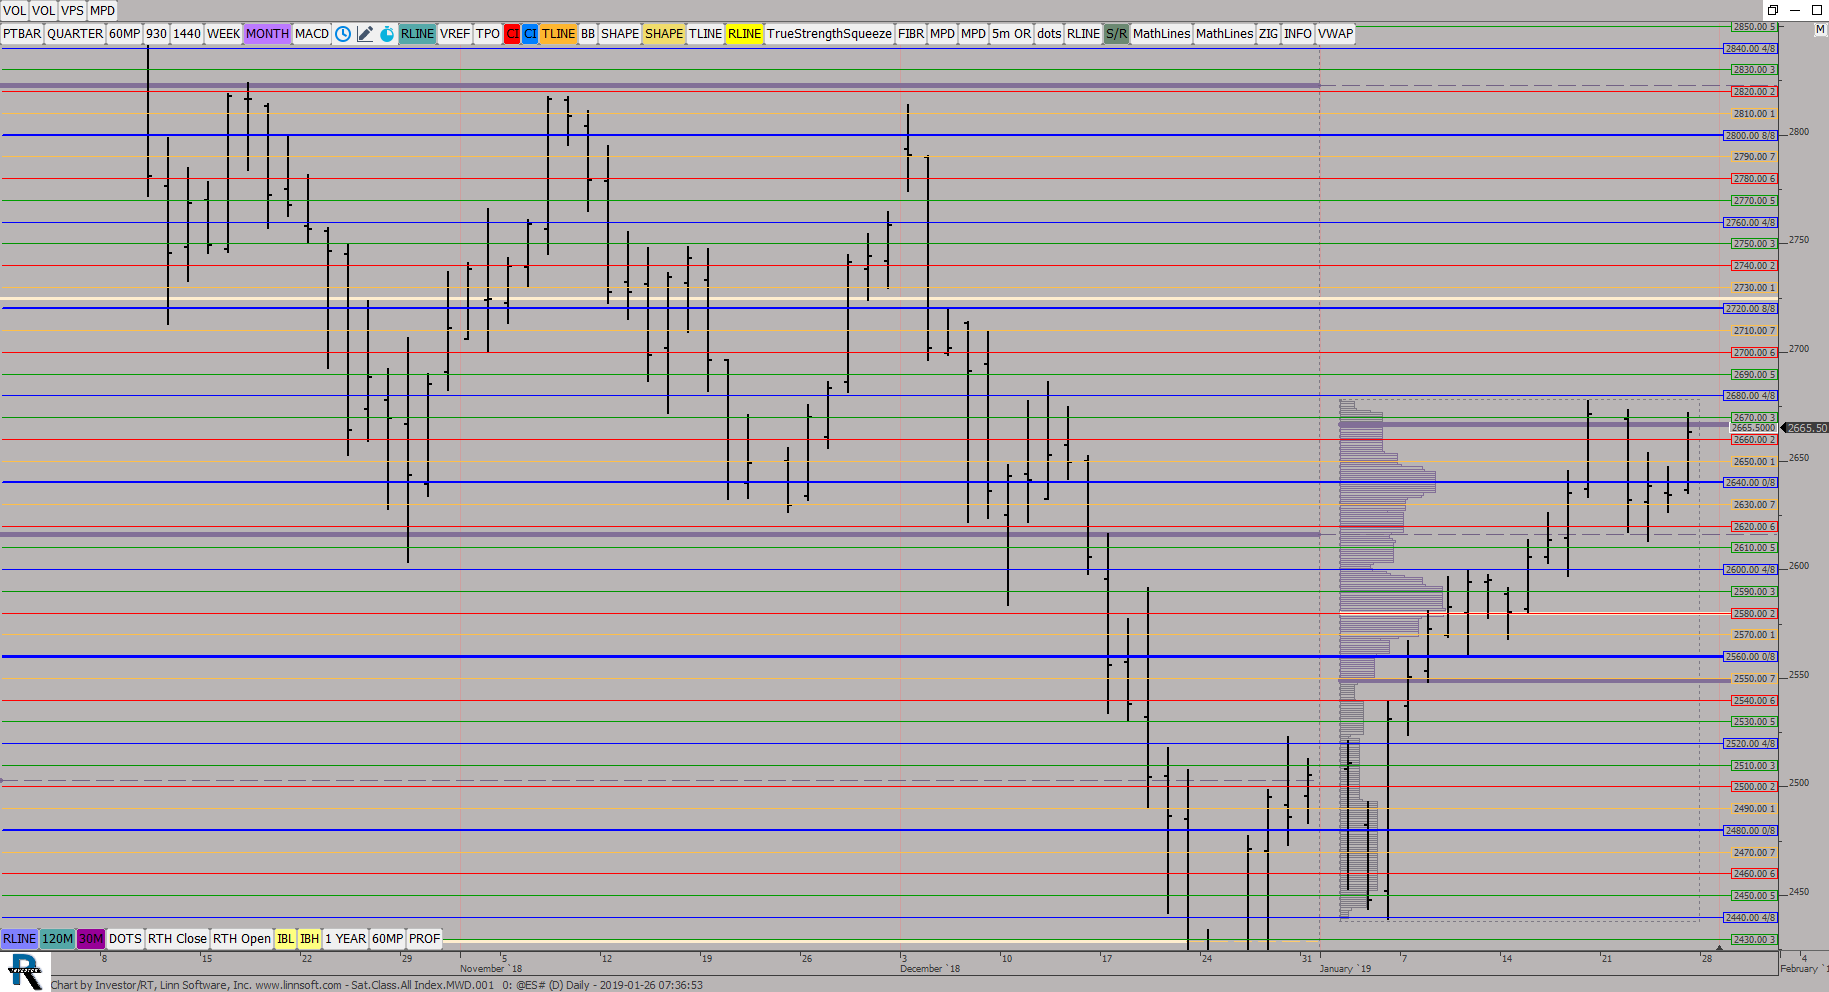 |
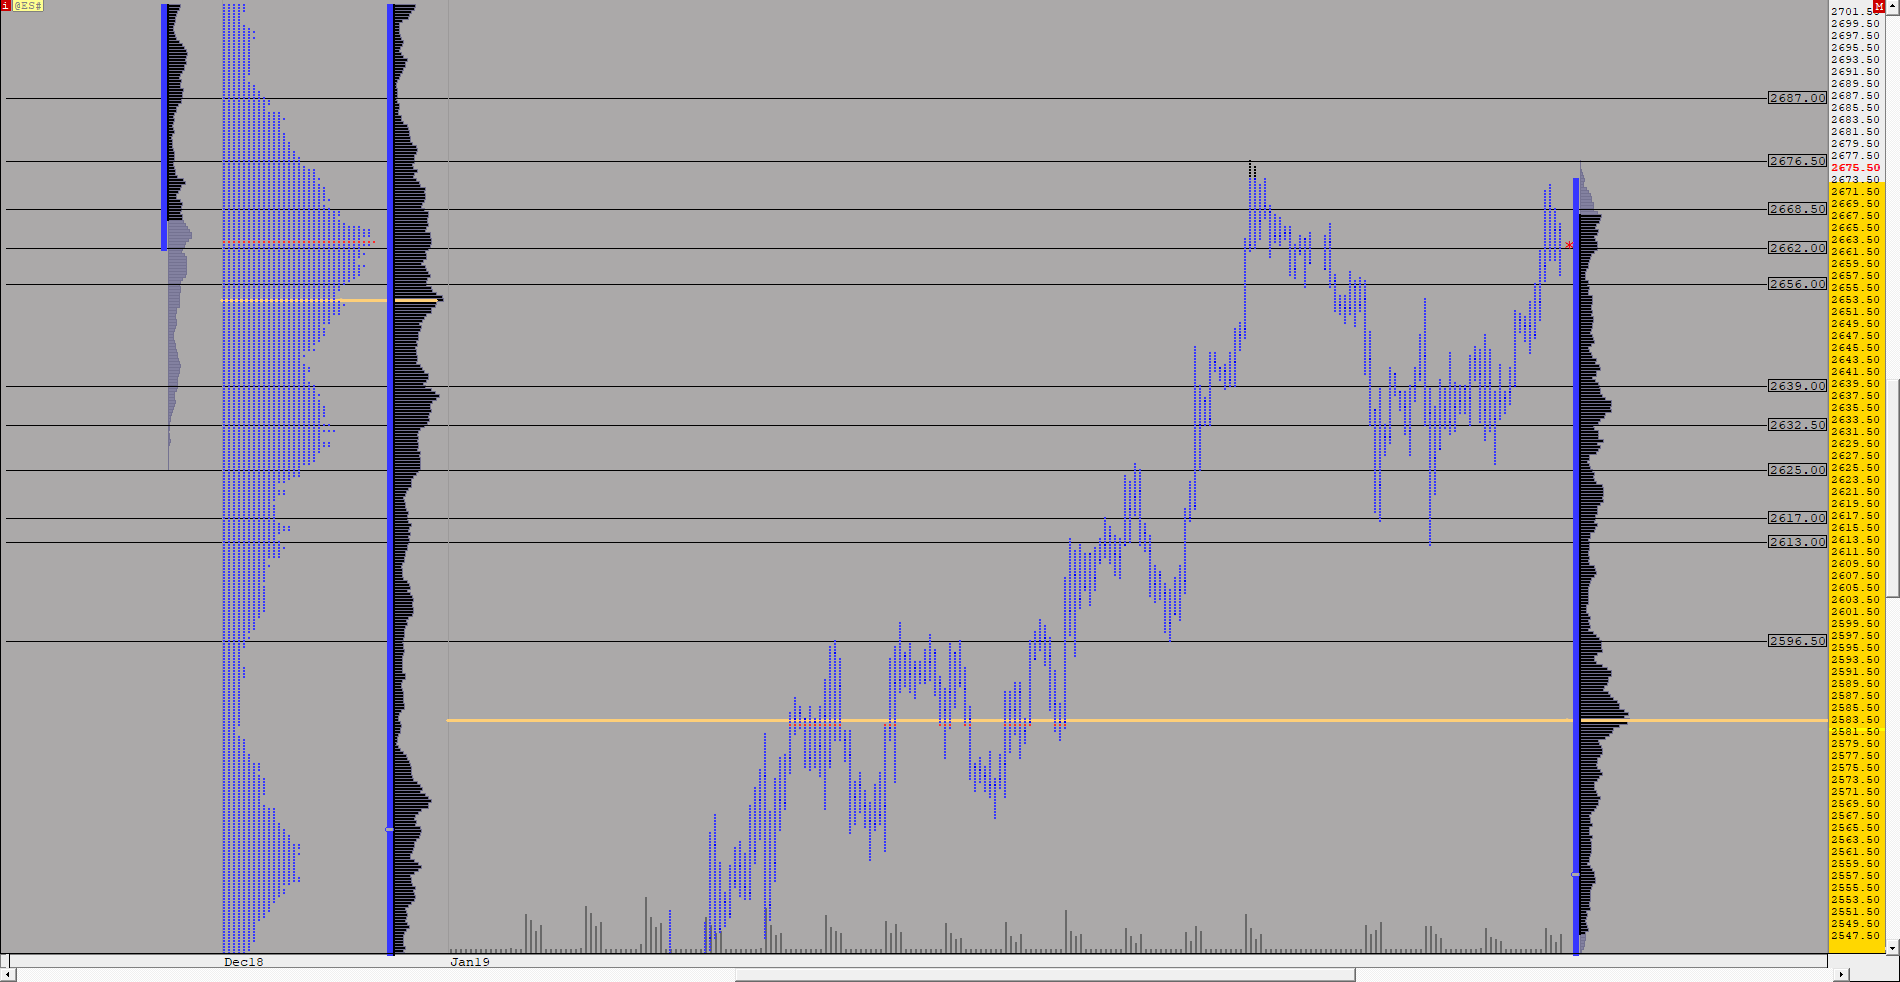
SatClassAll IndexMWD001 (@ES#) ES42 [totalcount]
7 years 6 months ago
This chart was uploaded by Investor/RT 13.5.16 showing symbol: @ES#. |
View |
 |
ESMPMONTHLY 12 01 (@ES#) ES42 [totalcount]
7 years 6 months ago
GOLD Daily Profiles. This chart was uploaded by Investor/RT 13.5.11 showing symbol: @ES#. |
View |
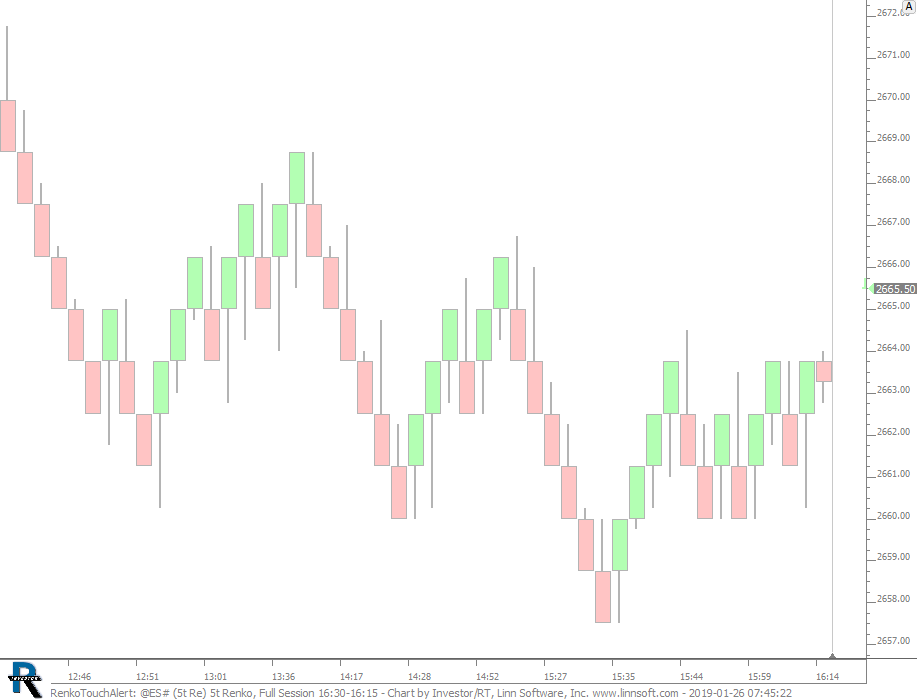 |
RenkoTouchAlert (@ES#) cpayne [totalcount]
7 years 6 months ago
Two Signal Markers Give Audible Alerts When Price Moves Into Previous Renko Body. This chart was uploaded by Investor/RT 13.5.16 showing symbol: @ES#. |
View |
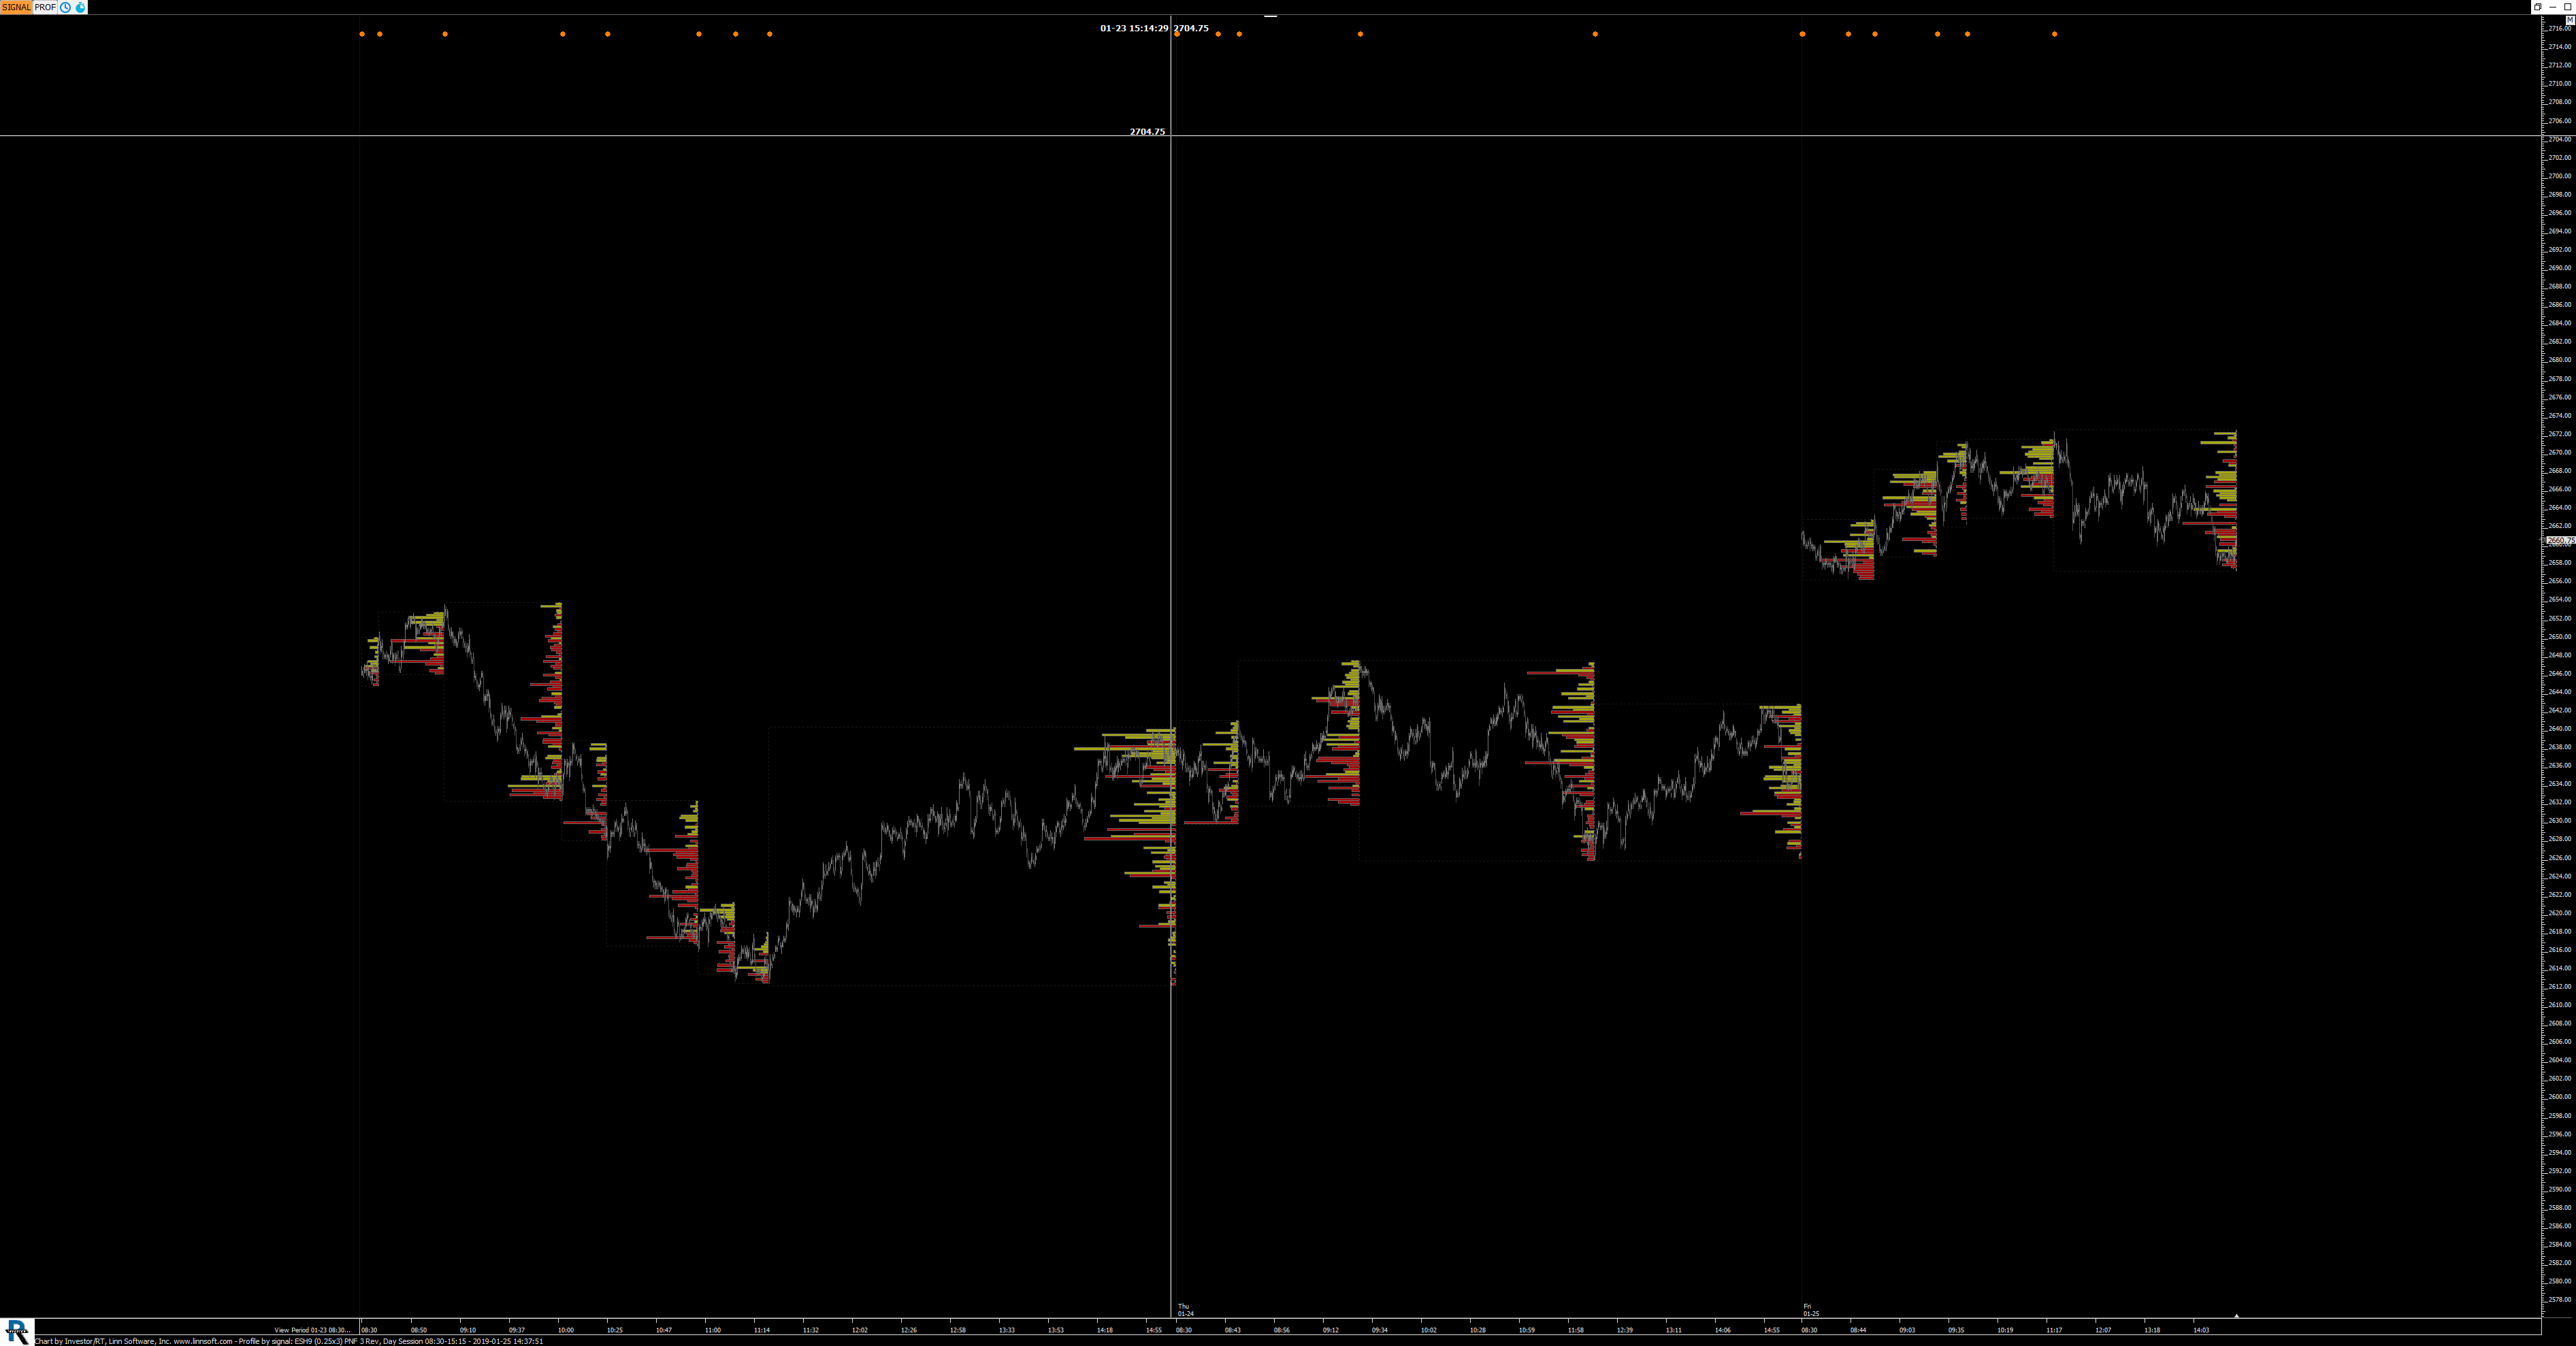 |
Profile by signal (ESH9) ctj0601 [totalcount]
7 years 6 months ago
Profile by signal. This chart was uploaded by Investor/RT 13.5.16 showing symbol: ESH9. |
View |
 |
VS TD TINT (@ES#) cpayne [totalcount]
7 years 11 months ago
1 second chart with TINT and VolumeScope® - Blue Trade Dots for trades >= 100 in size. This chart was uploaded by Investor/RT 13.5.4 showing symbol: @ES#. |
View |