 |
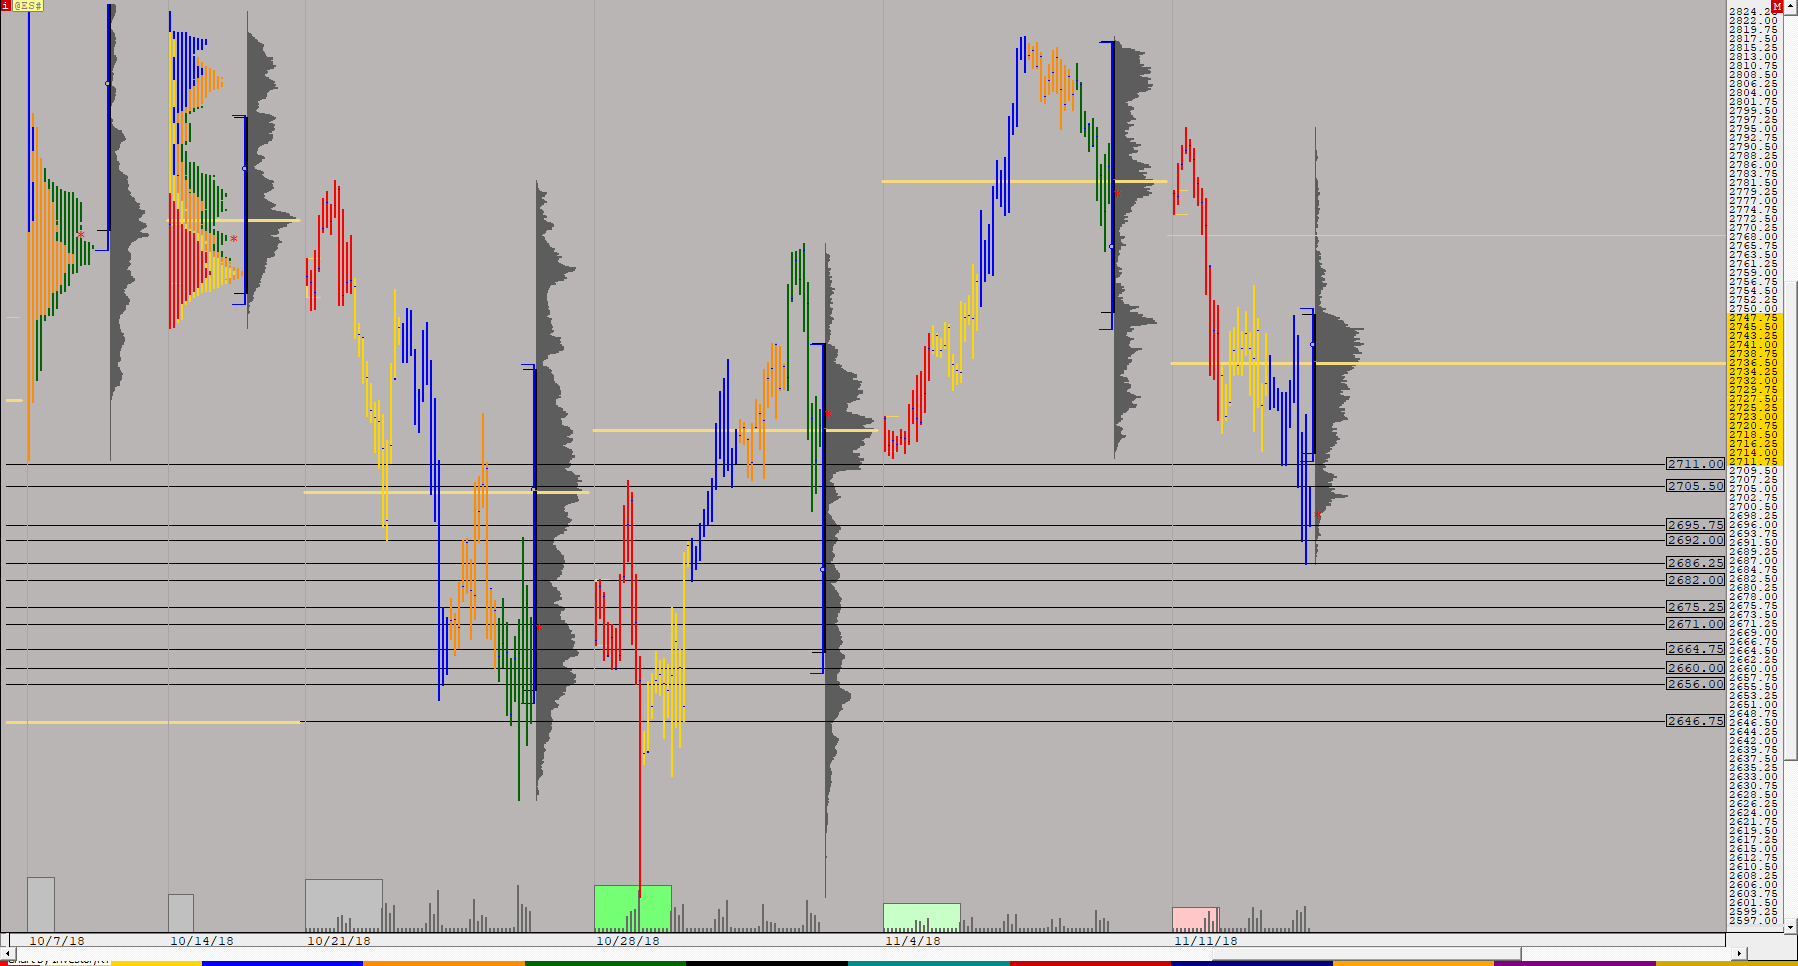
S R ES WEEKLY MP (@ES#) ES42 [totalcount]
7 years 8 months ago
This chart was uploaded by Investor/RT 13.5.10 showing symbol: @ES#. |
View |
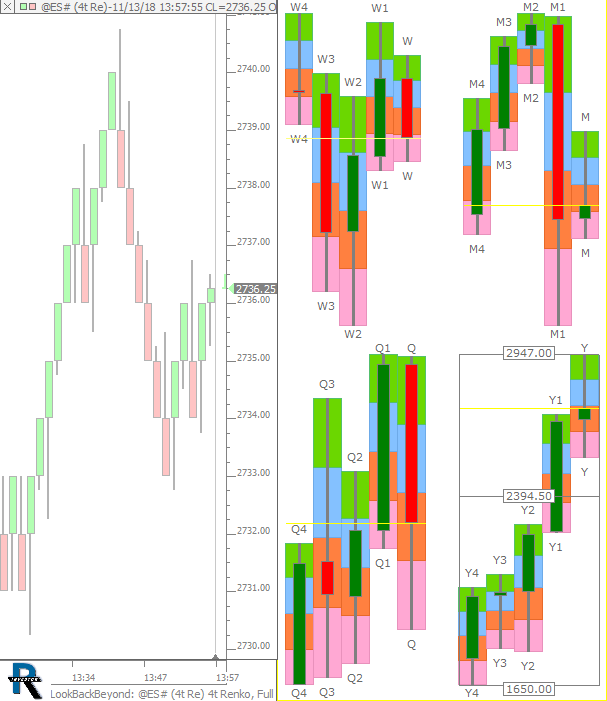 |
LookBackBeyond (@ES#) cpayne [totalcount]
7 years 8 months ago
LookBackCandles and Beyond. This chart was uploaded by Investor/RT 13.5.10 showing symbol: @ES#. |
View |
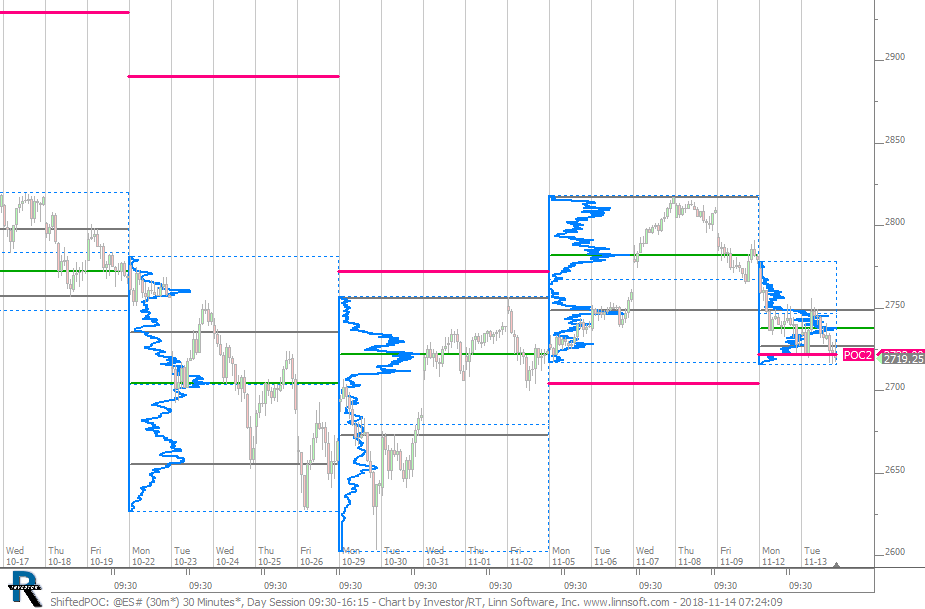 |
ShiftedPOC (@ES#) cpayne [totalcount]
7 years 8 months ago
POC 2 Weeks Back. This chart was uploaded by Investor/RT 13.5.10 showing symbol: @ES#. |
View |
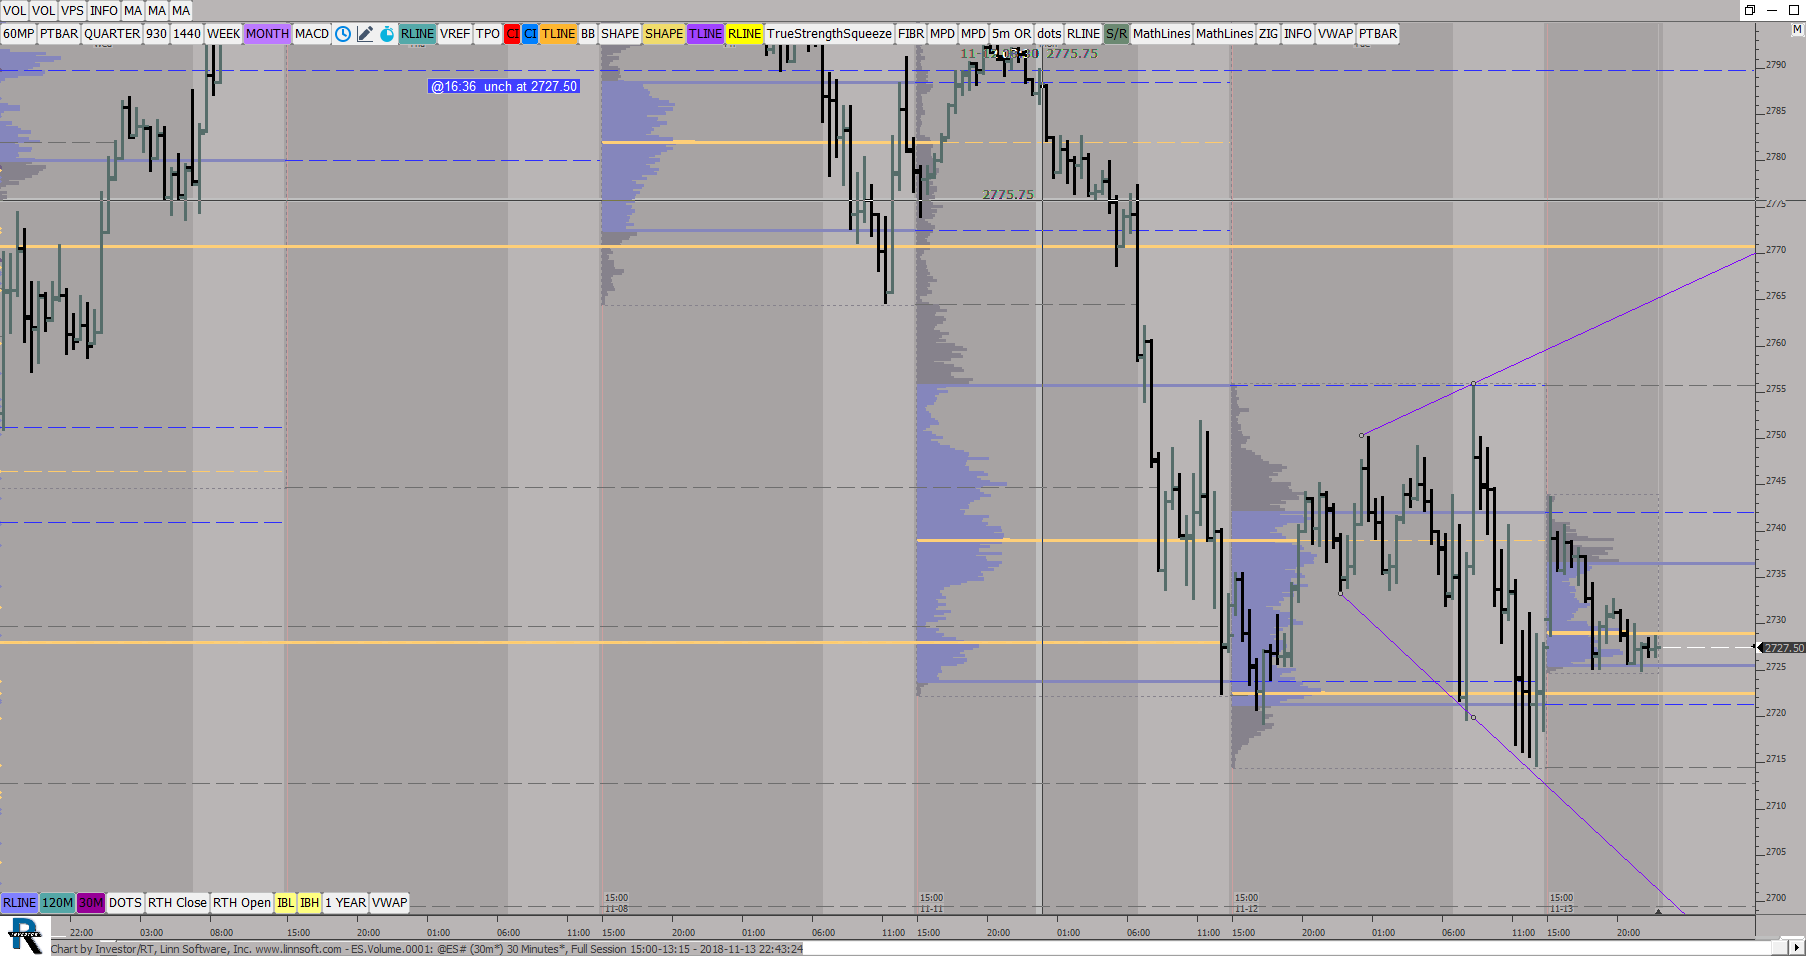 |
ESVolume (@ES#) ES42 [totalcount]
7 years 8 months ago
This chart was uploaded by Investor/RT 13.5.10 showing symbol: @ES#. |
View |
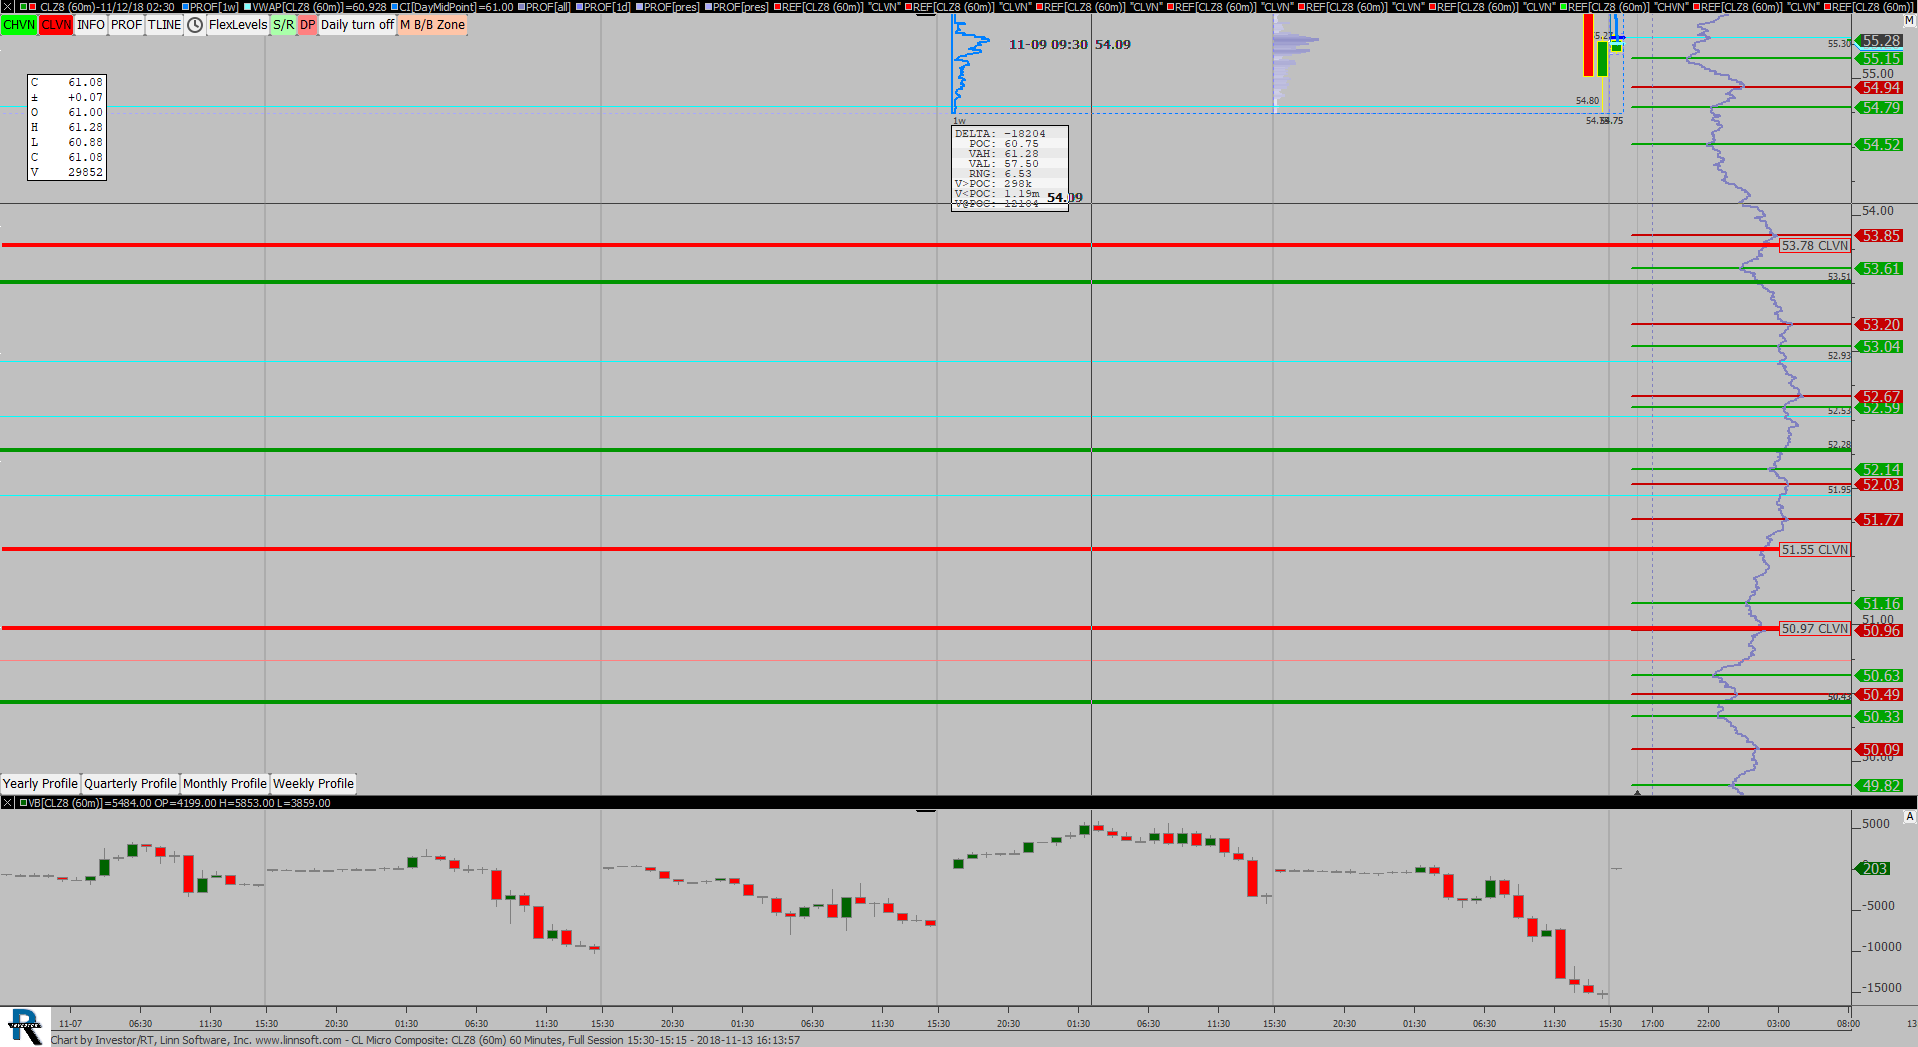 |
CL Micro Composite (CLZ8) scottz46 [totalcount]
7 years 8 months ago
This chart was uploaded by Investor/RT 13.5.7 showing symbol: CLZ8. |
View |
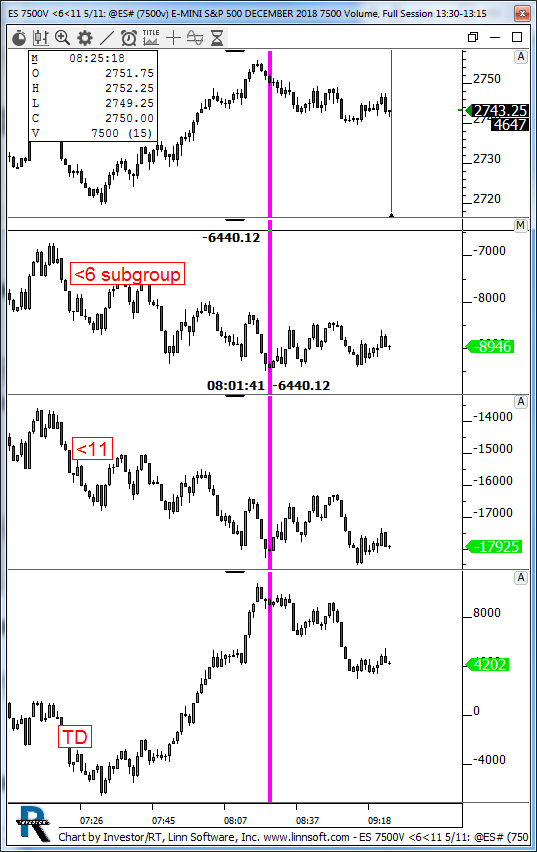 |
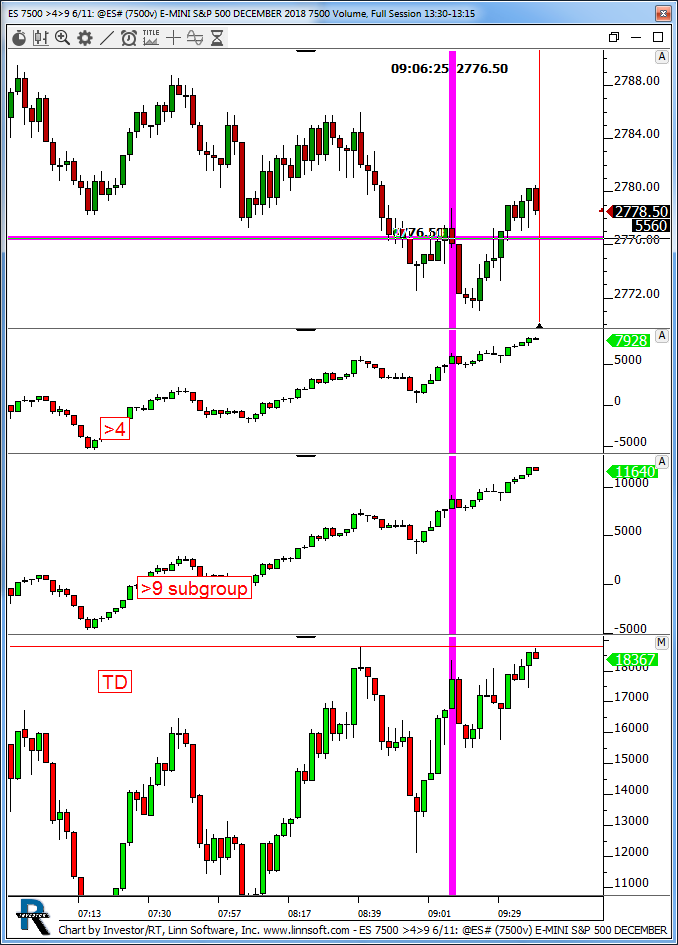
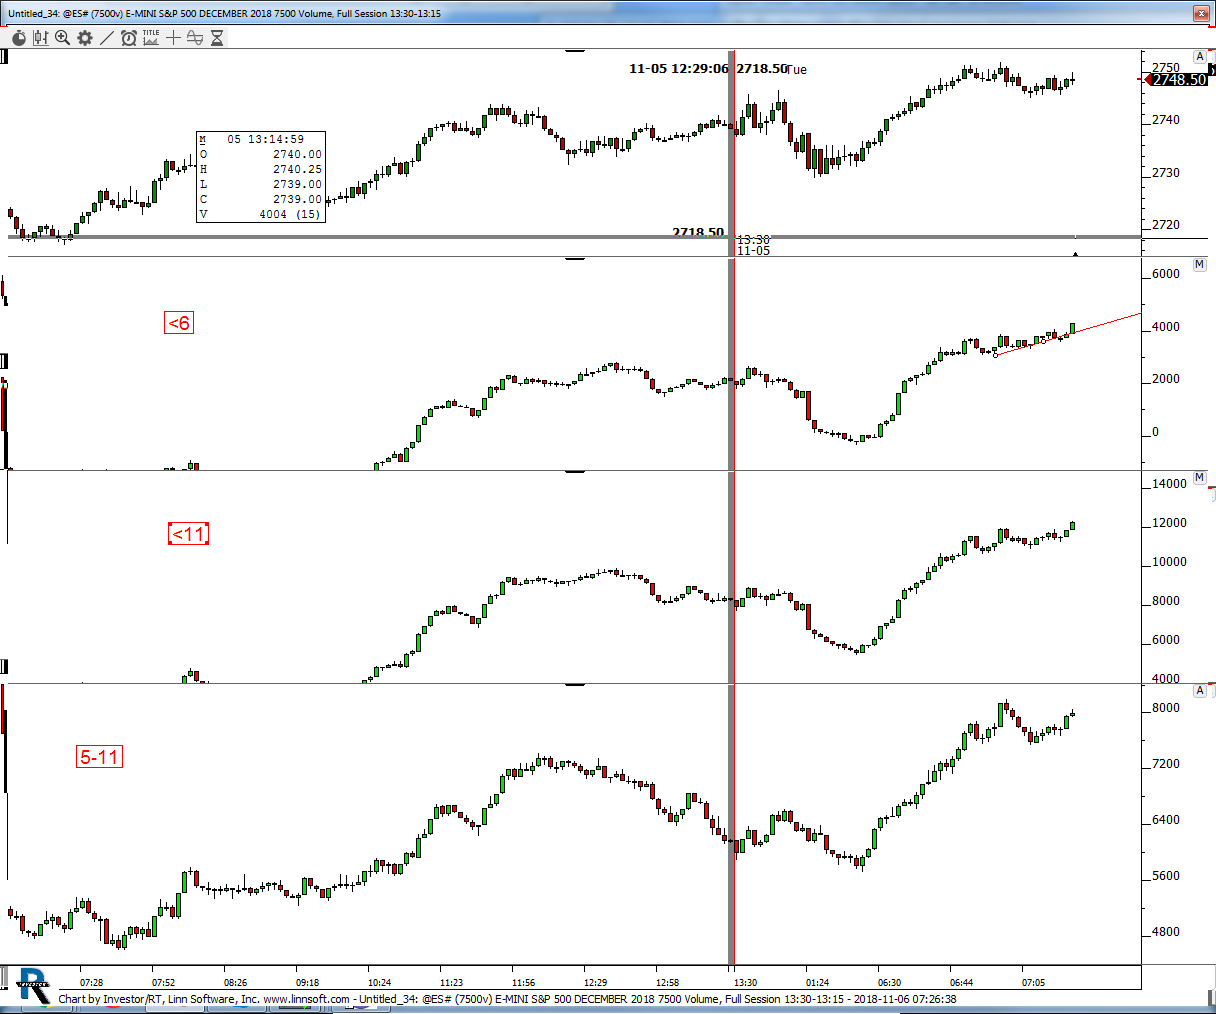
ES 7500V 611 5 (@ES#) kencassorla [totalcount]
7 years 8 months ago
7500v. This chart was uploaded by Investor/RT 13.5.9 showing symbol: @ES#. |
View |
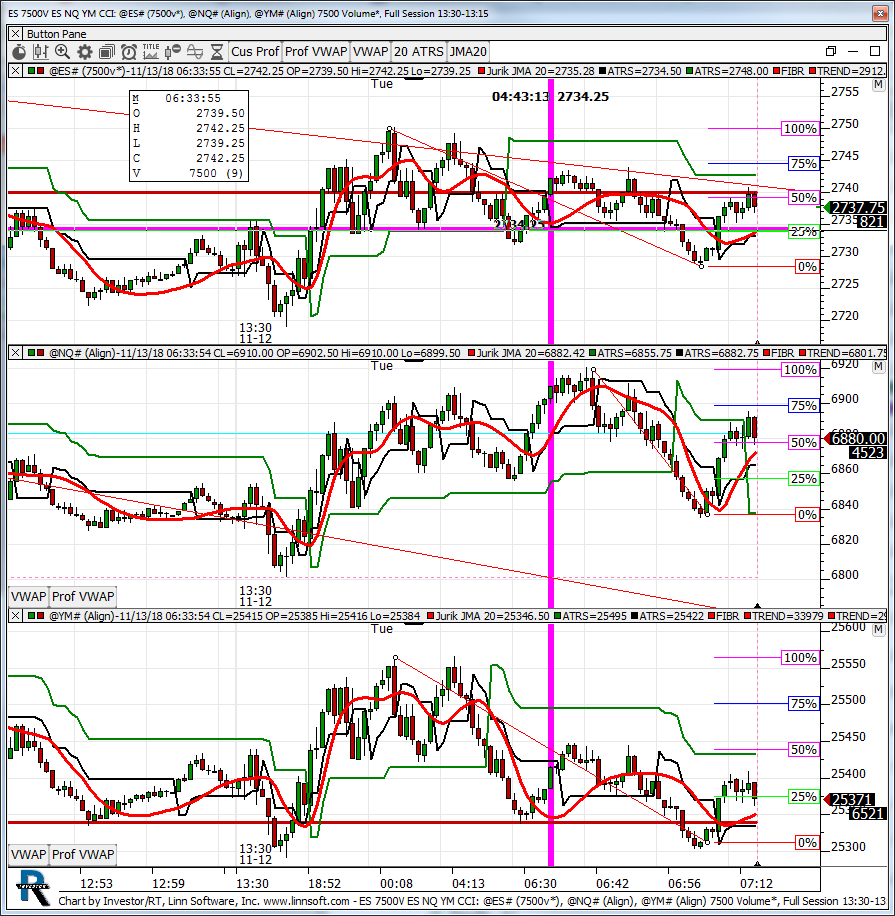 |
ES 7500V ES NQ YM CCI (@ES#) kencassorla [totalcount]
7 years 8 months ago
7500v. This chart was uploaded by Investor/RT 13.3.5 showing symbol: @ES#. |
View |
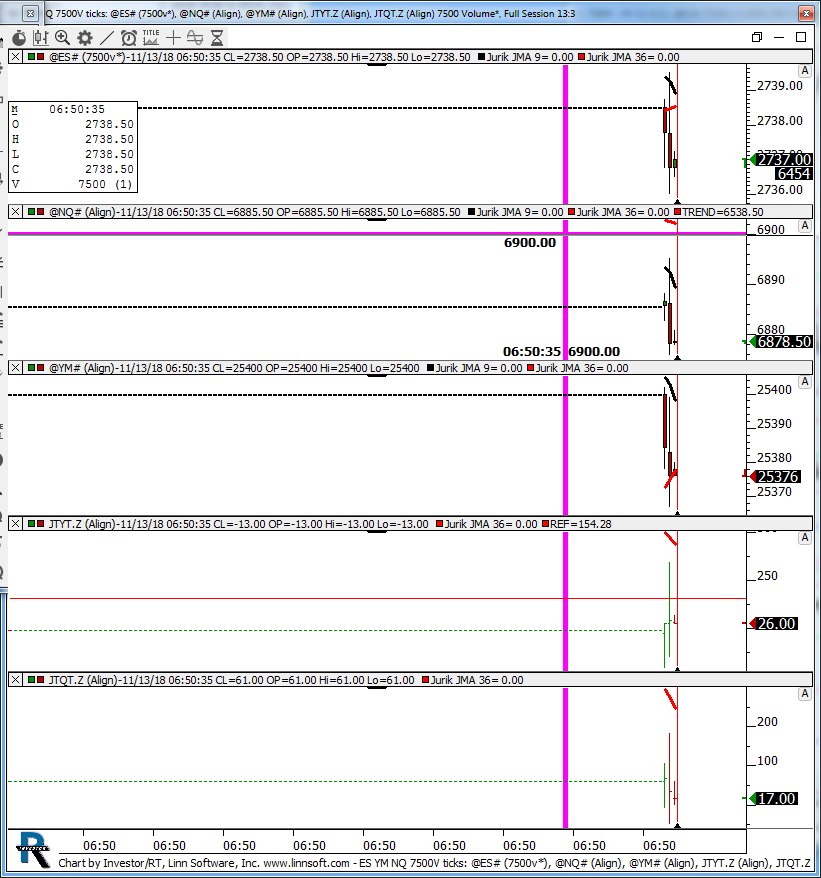 |
ES YM NQ 7500V ticks (@ES#) kencassorla [totalcount]
7 years 8 months ago
3 indexes. This chart was uploaded by Investor/RT 13.5.10 showing symbol: @ES#. |
View |
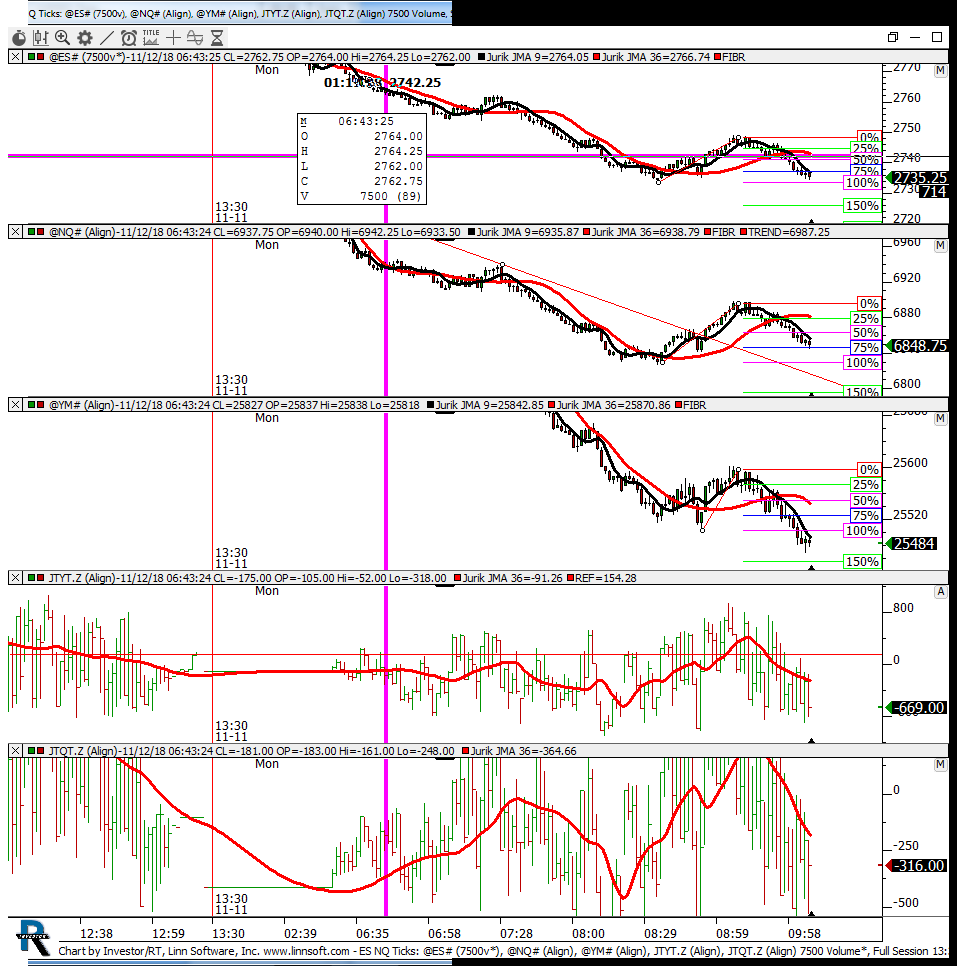 |
ES NQ Ticks (@ES#) kencassorla [totalcount]
7 years 8 months ago
7500V. This chart was uploaded by Investor/RT 13.5.10 showing symbol: @ES#. |
View |
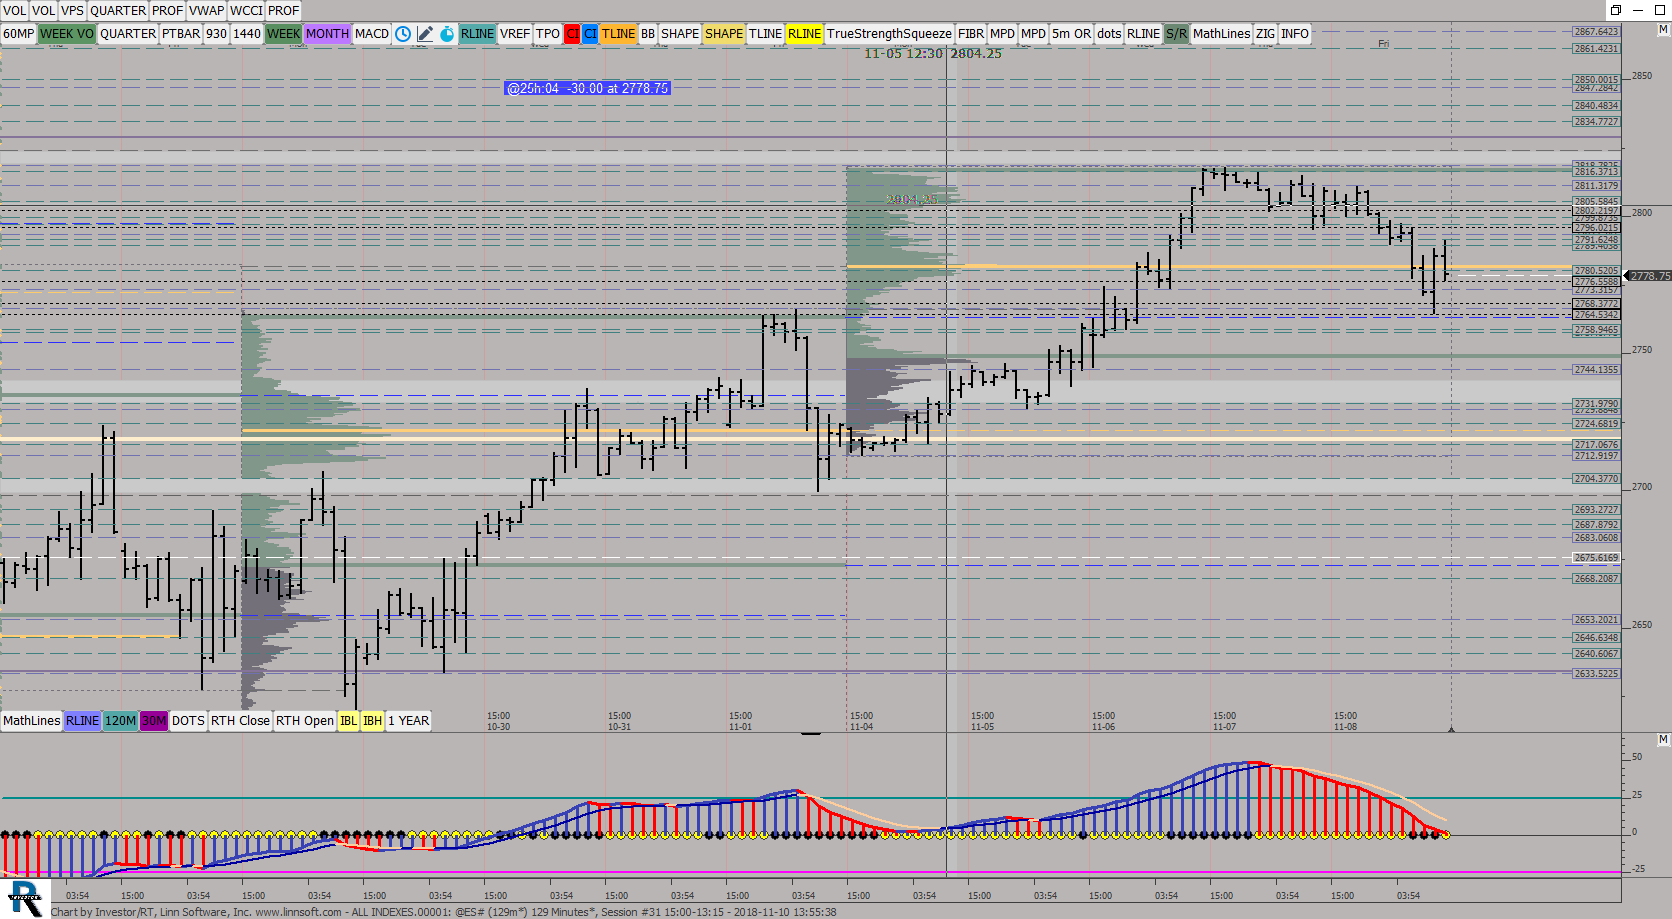 |
All Indexes (@ES#) ES42 [totalcount]
7 years 8 months ago
This chart was uploaded by Investor/RT 13.3.5 showing symbol: @ES#. |
View |
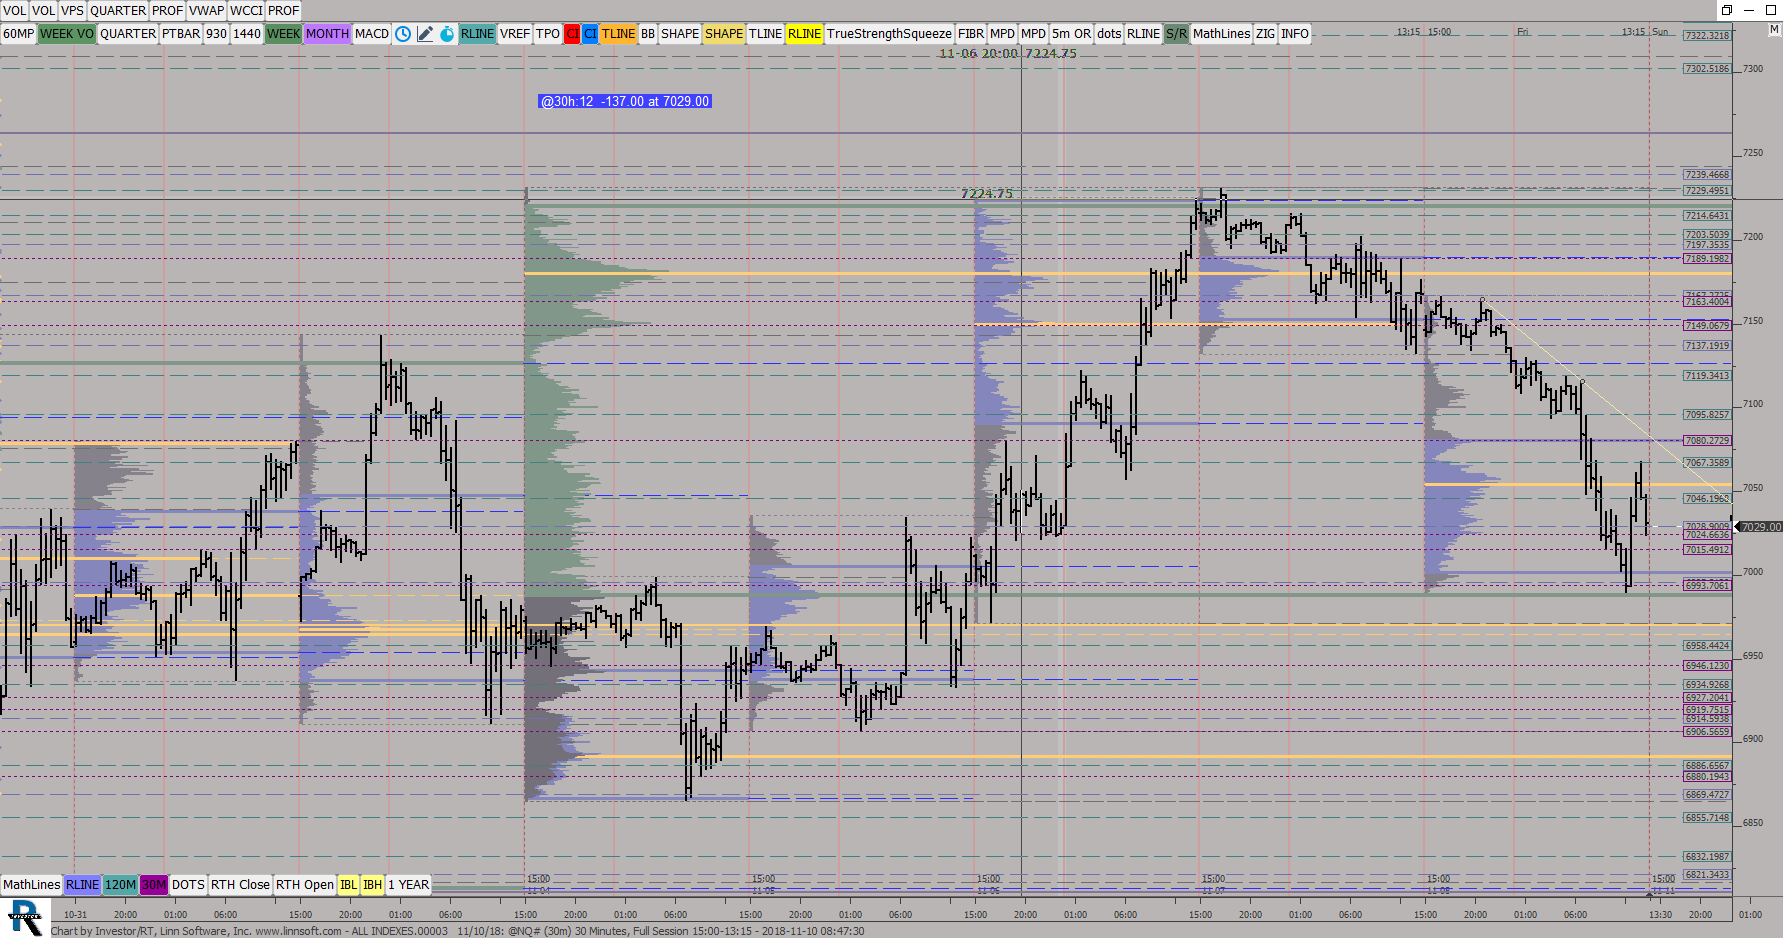 |
ALL INDEXES00003 11 10 (@NQ#) ES42 [totalcount]
7 years 8 months ago
This chart was uploaded by Investor/RT 13.5.10 showing symbol: @NQ#. |
View |
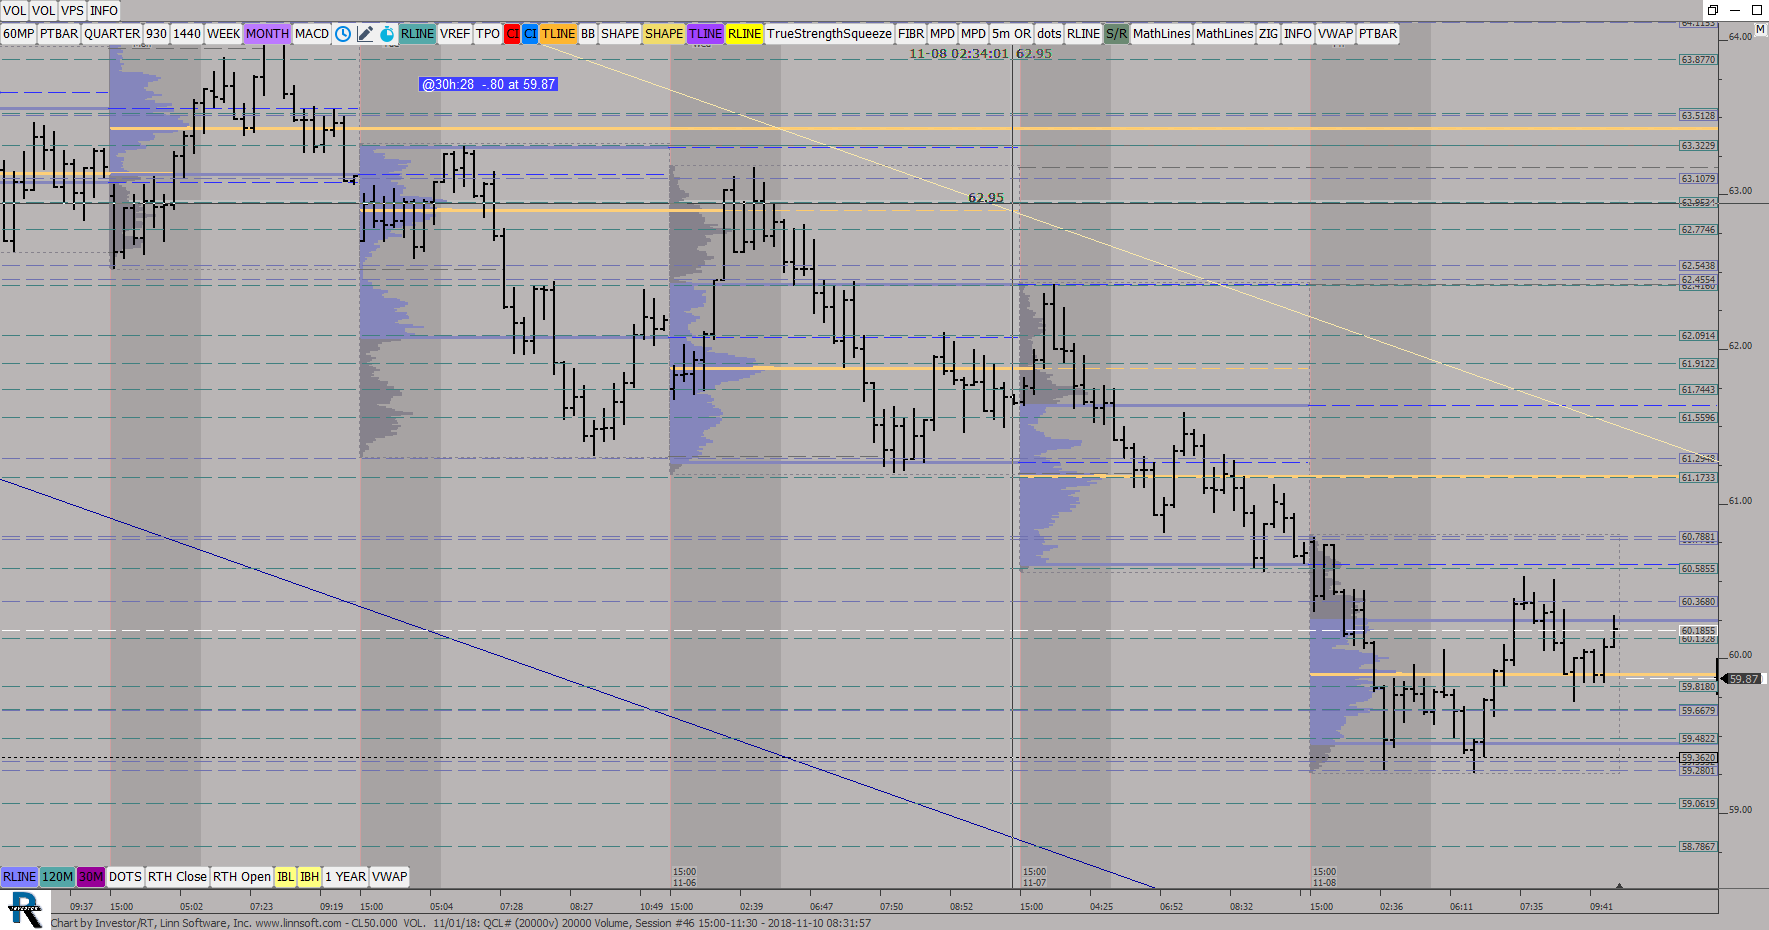 |
CL50000 VOL 11 01 (QCL#) ES42 [totalcount]
7 years 8 months ago
This chart was uploaded by Investor/RT 13.5.10 showing symbol: QCL#. |
View |
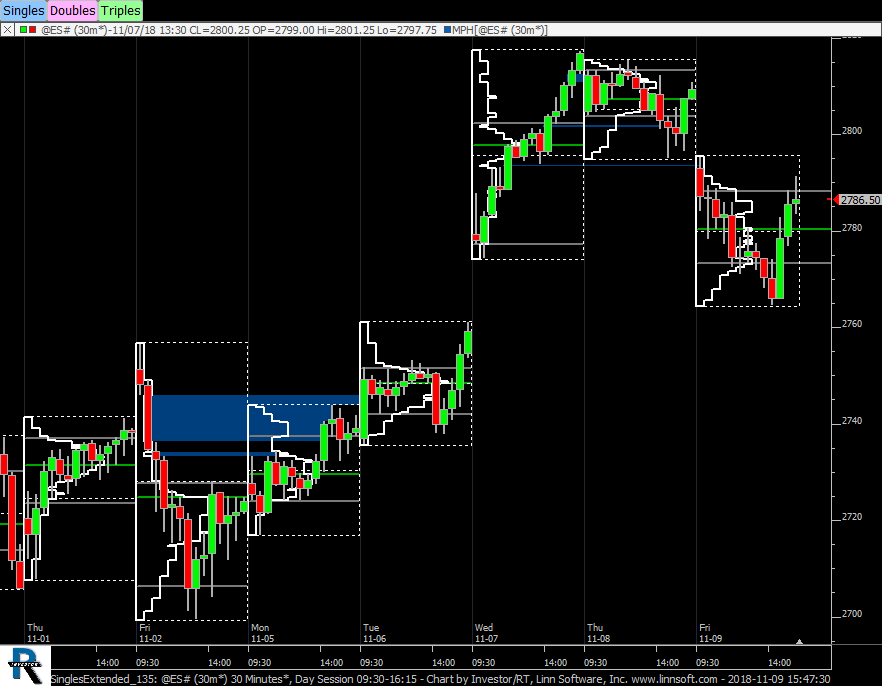 |
SinglesExtended 135 (@ES#) cpayne [totalcount]
7 years 8 months ago
MPH SinglesExtended - Investor/RT 13.5 Webinar. This chart was uploaded by Investor/RT 13.5.9 showing symbol: @ES#. |
View |
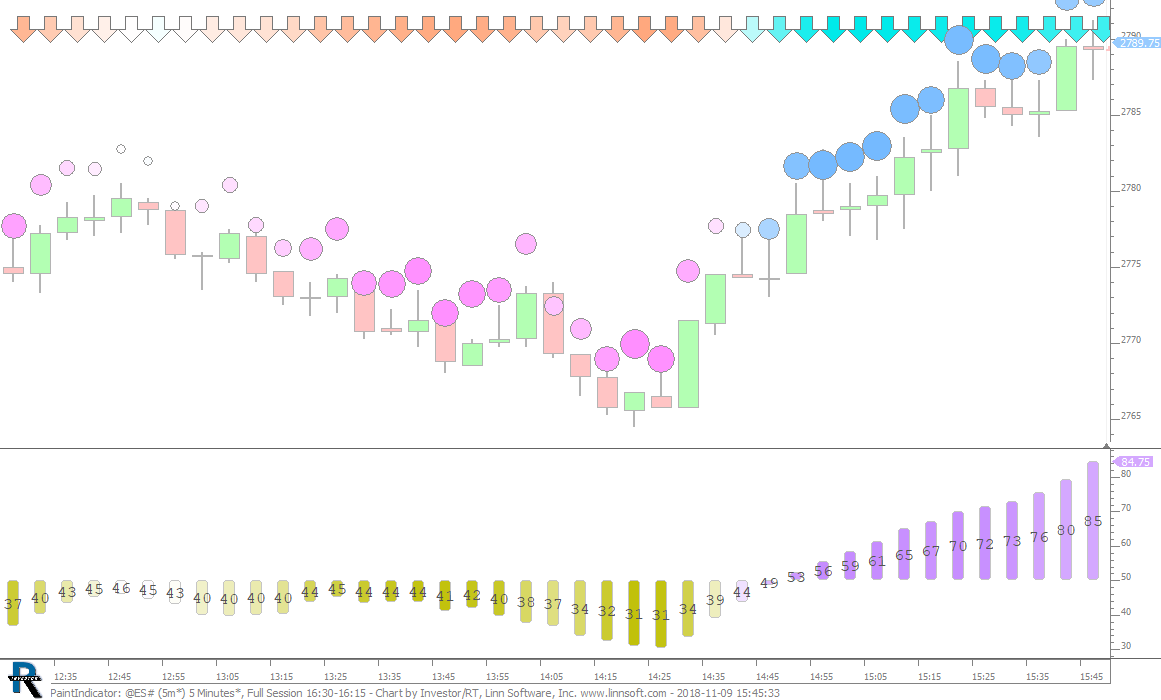 |
PaintIndicator (@ES#) cpayne [totalcount]
7 years 8 months ago
PaintIndicator - Investor/RT 13.5 Webinar. This chart was uploaded by Investor/RT 13.5.9 showing symbol: @ES#. |
View |
 |
ES 7500 49 6 (@ES#) kencassorla [totalcount]
7 years 8 months ago
7500V. This chart was uploaded by Investor/RT 13.5.10 showing symbol: @ES#. |
View |
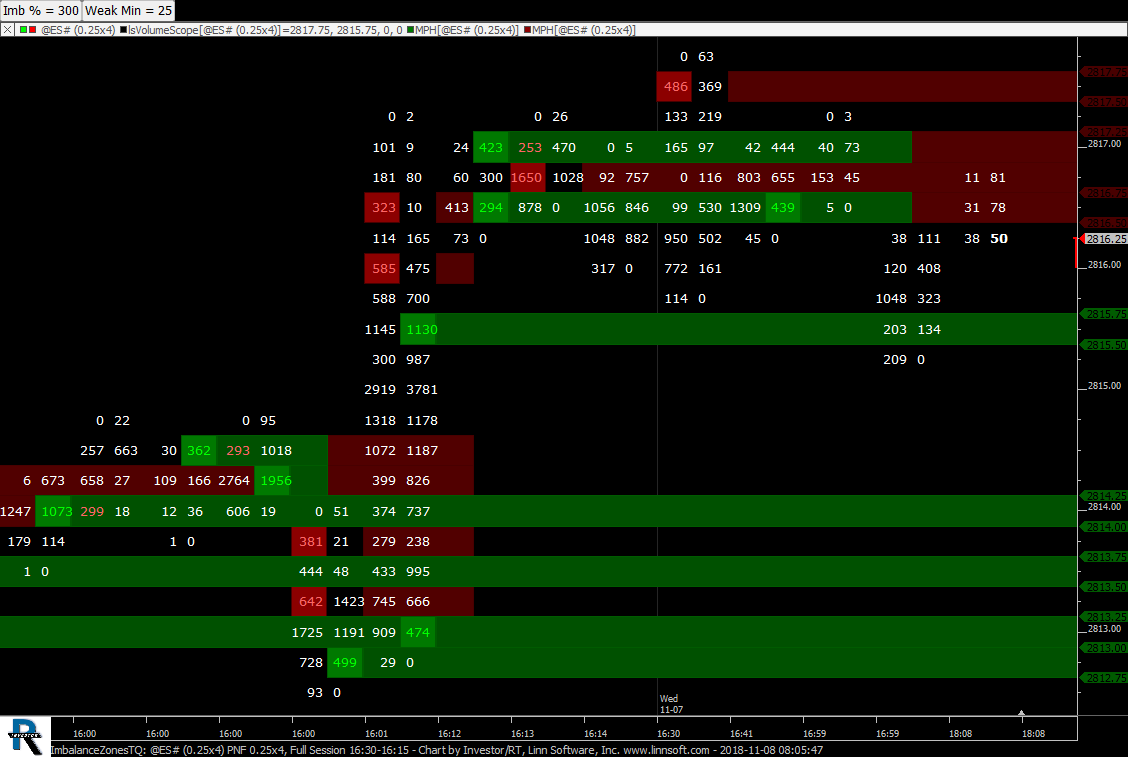 |
ImbalanceZonesTQ (@ES#) cpayne [totalcount]
7 years 8 months ago
This chart was uploaded by Investor/RT 13.5.9 showing symbol: @ES#. |
View |
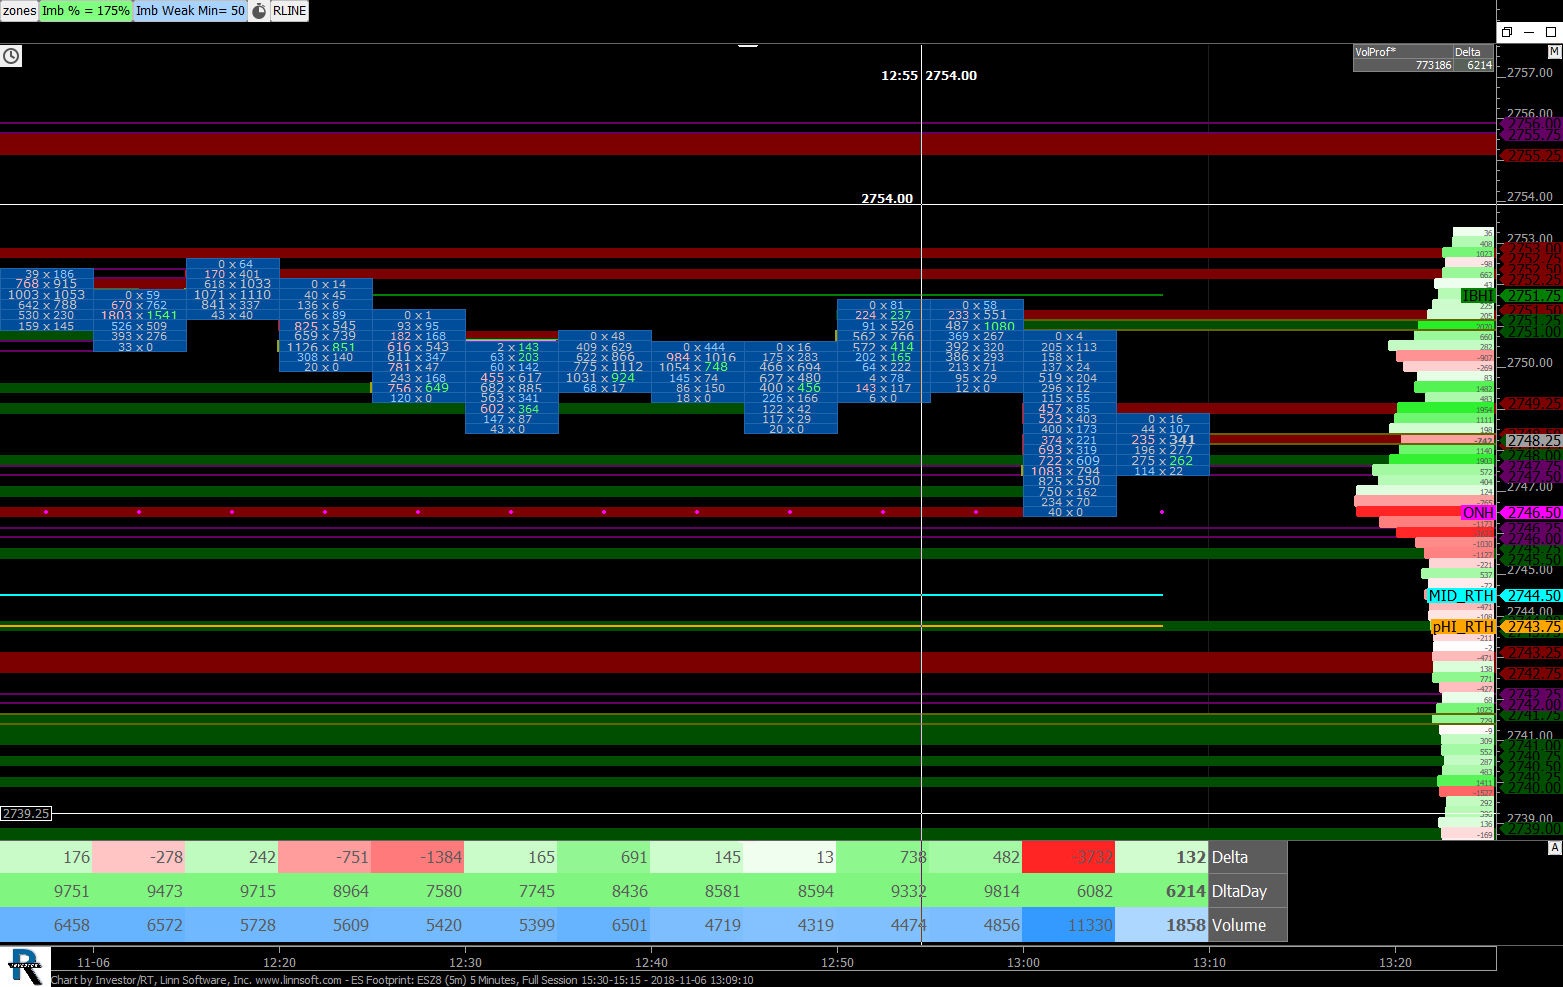 |
ES Footprint (ESZ8) scottz46 [totalcount]
7 years 8 months ago
This chart was uploaded by Investor/RT 13.3.3 showing symbol: ESZ8. |
View |
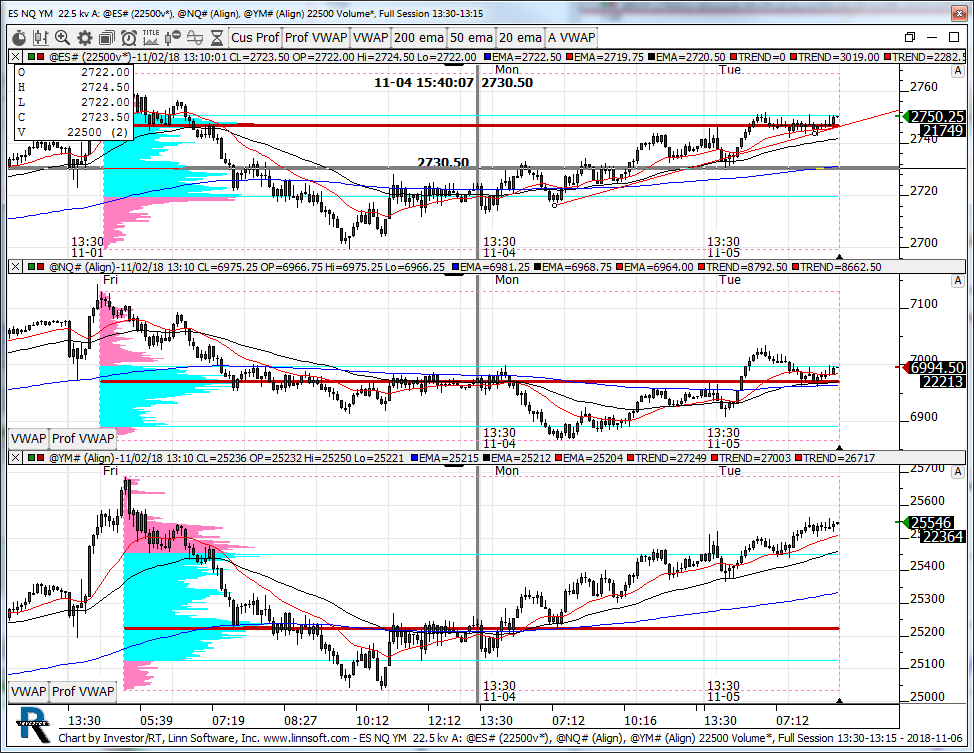 |
ES NQ YM 225 kv A (@ES#) kencassorla [totalcount]
7 years 8 months ago
22.5 kv. This chart was uploaded by Investor/RT 13.3.5 showing symbol: @ES#. |
View |
 |
Untitled (@ES#) kencassorla [totalcount]
7 years 8 months ago
es nq. This chart was uploaded by Investor/RT 12.7.6 showing symbol: @ES#. |
View |
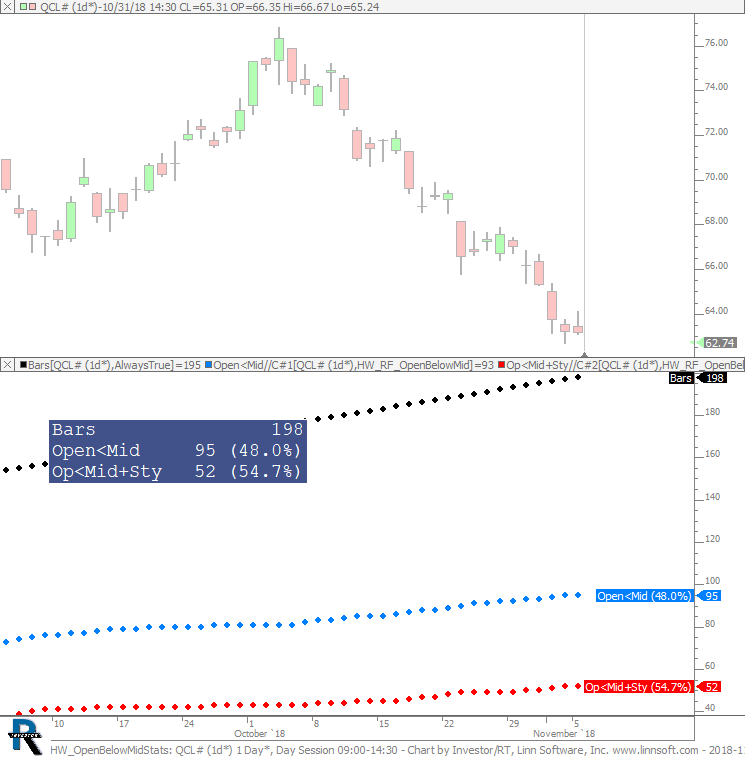 |
HW OpenBelowMidStats (QCL#) cpayne [totalcount]
7 years 8 months ago
Open Below Mid Stats. This chart was uploaded by Investor/RT 13.5.9 showing symbol: QCL#. |
View |
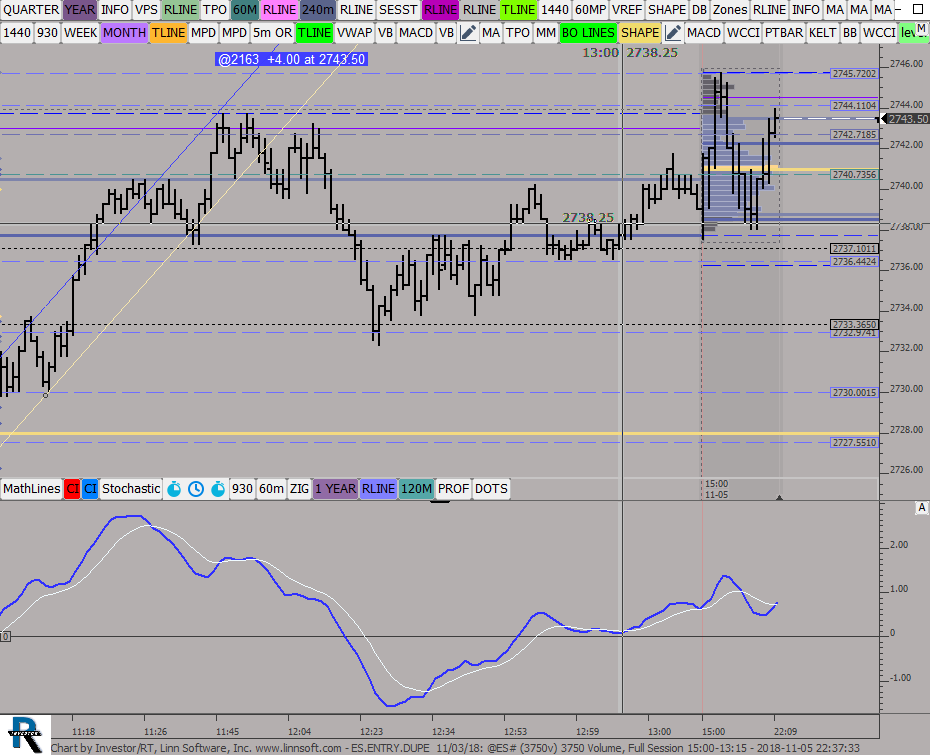 |
ESENTRYDUPE 11 03 (@ES#) ES42 [totalcount]
7 years 8 months ago
This chart was uploaded by Investor/RT 13.5.9 showing symbol: @ES#. |
View |
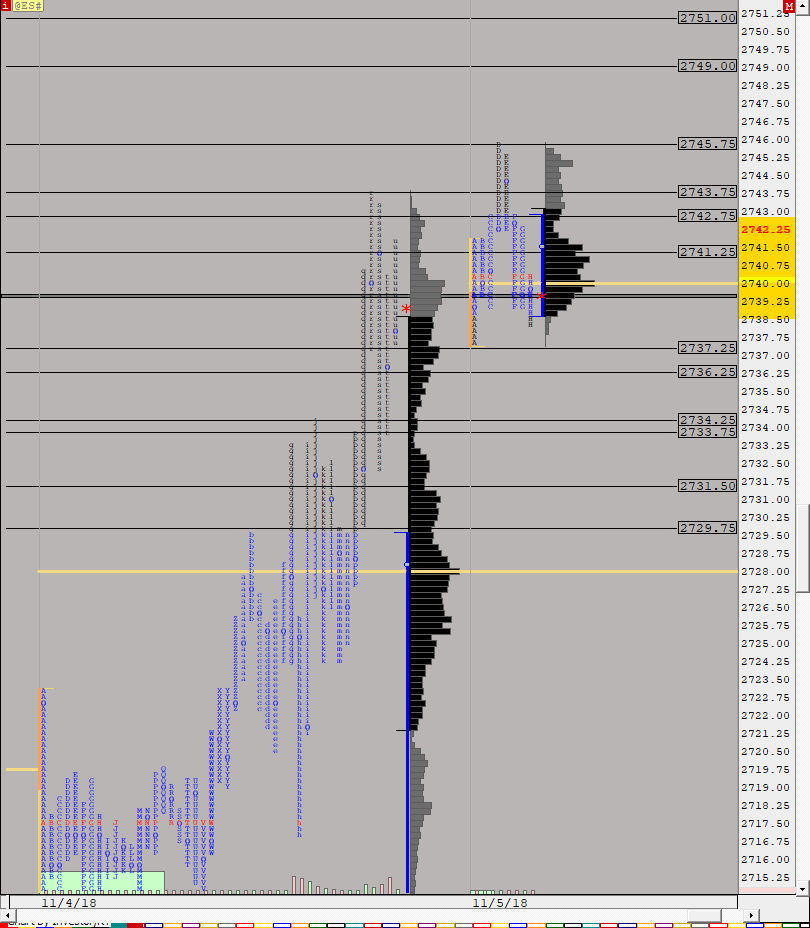 |
S R Daily ESTPO 11 01 (@ES#) ES42 [totalcount]
7 years 8 months ago
This chart was uploaded by Investor/RT 13.5.9 showing symbol: @ES#. |
View |
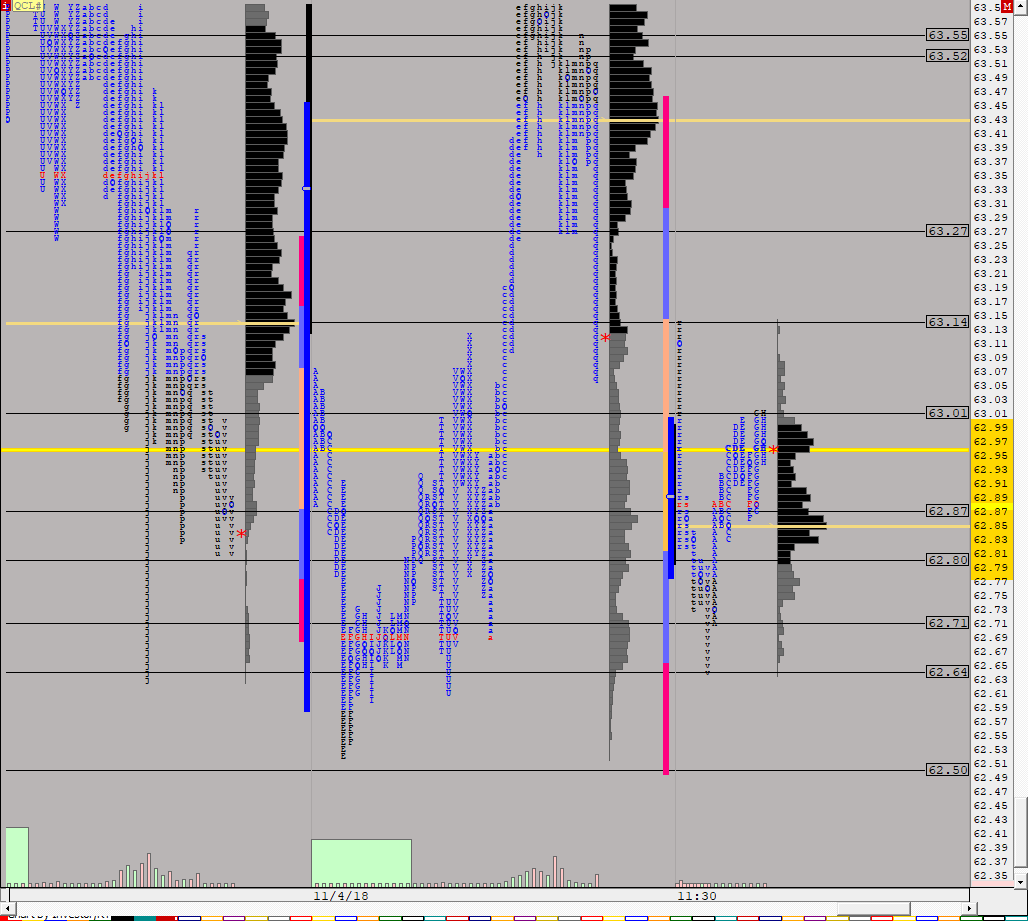 |
S R Daily TPO (QCL#) ES42 [totalcount]
7 years 8 months ago
This chart was uploaded by Investor/RT 13.3.5 showing symbol: QCL#. |
View |
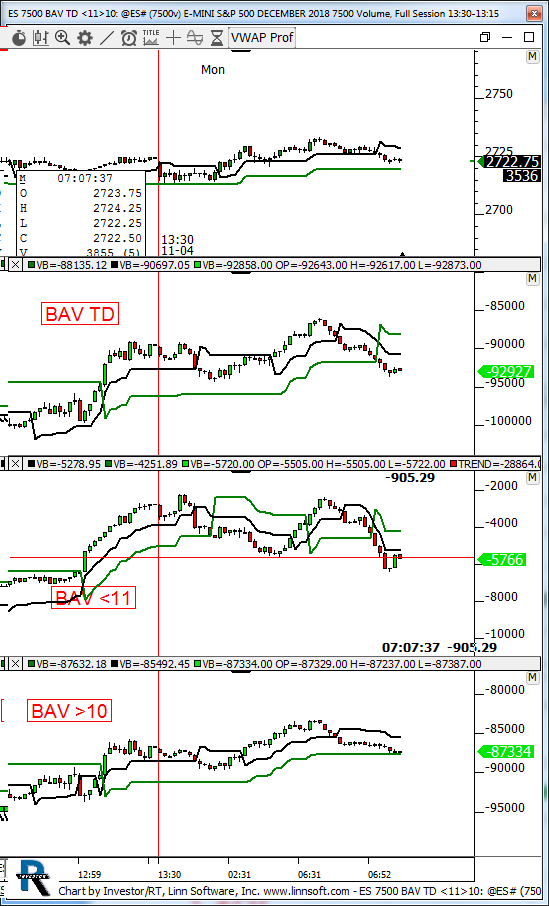 |
ES 7500 BAV TD (@ES#) kencassorla [totalcount]
7 years 8 months ago
7500. This chart was uploaded by Investor/RT 13.3.5 showing symbol: @ES#. |
View |
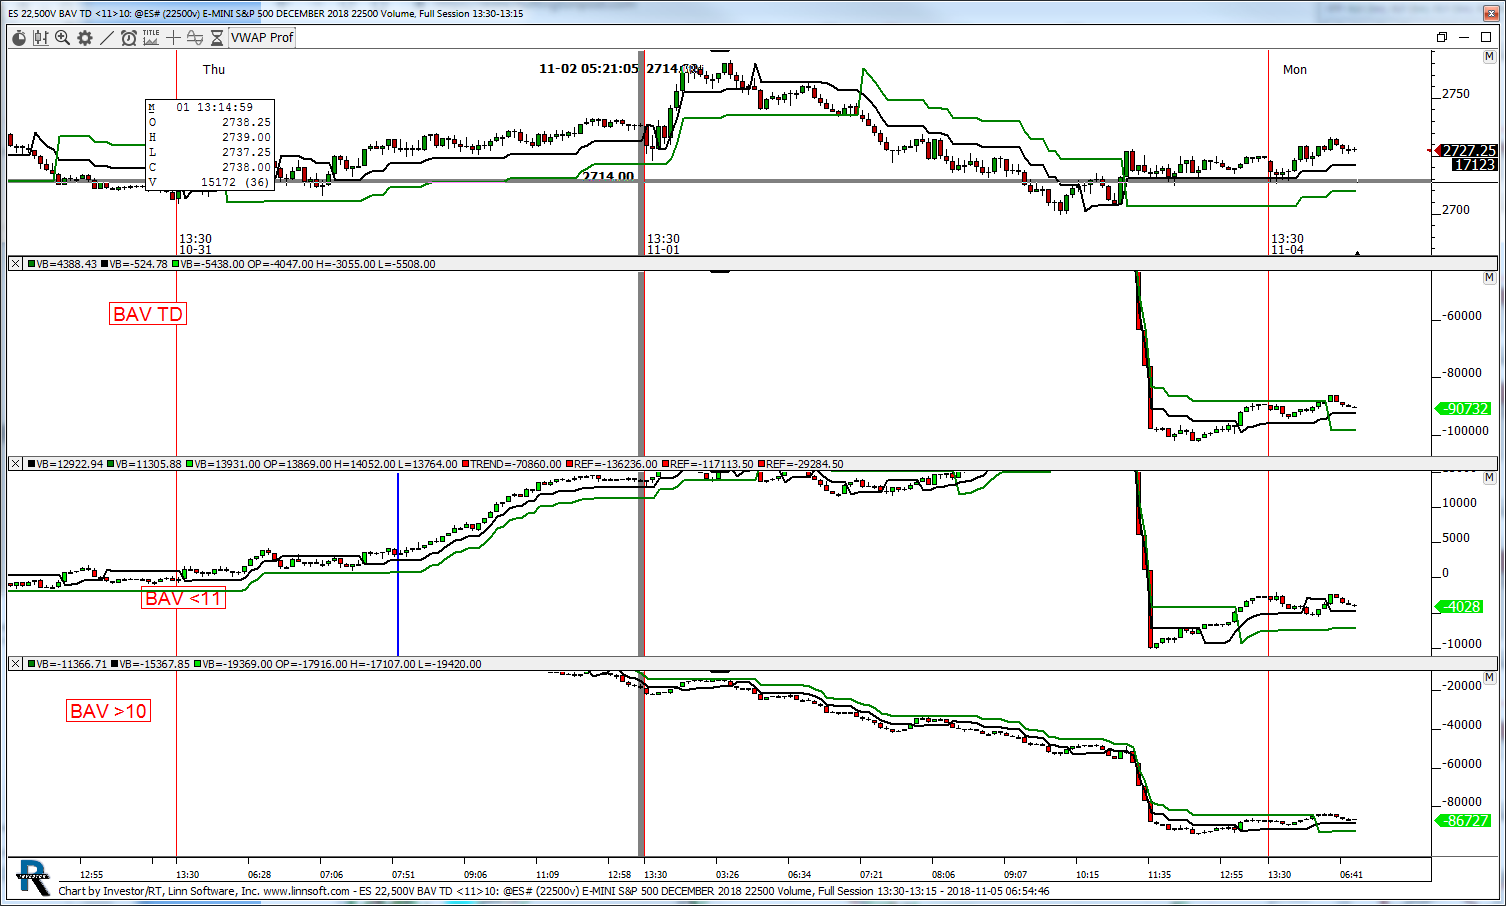 |
ES 22500V BAV TD (@ES#) kencassorla [totalcount]
7 years 8 months ago
22.5 KV. This chart was uploaded by Investor/RT 13.5.9 showing symbol: @ES#. |
View |