 |
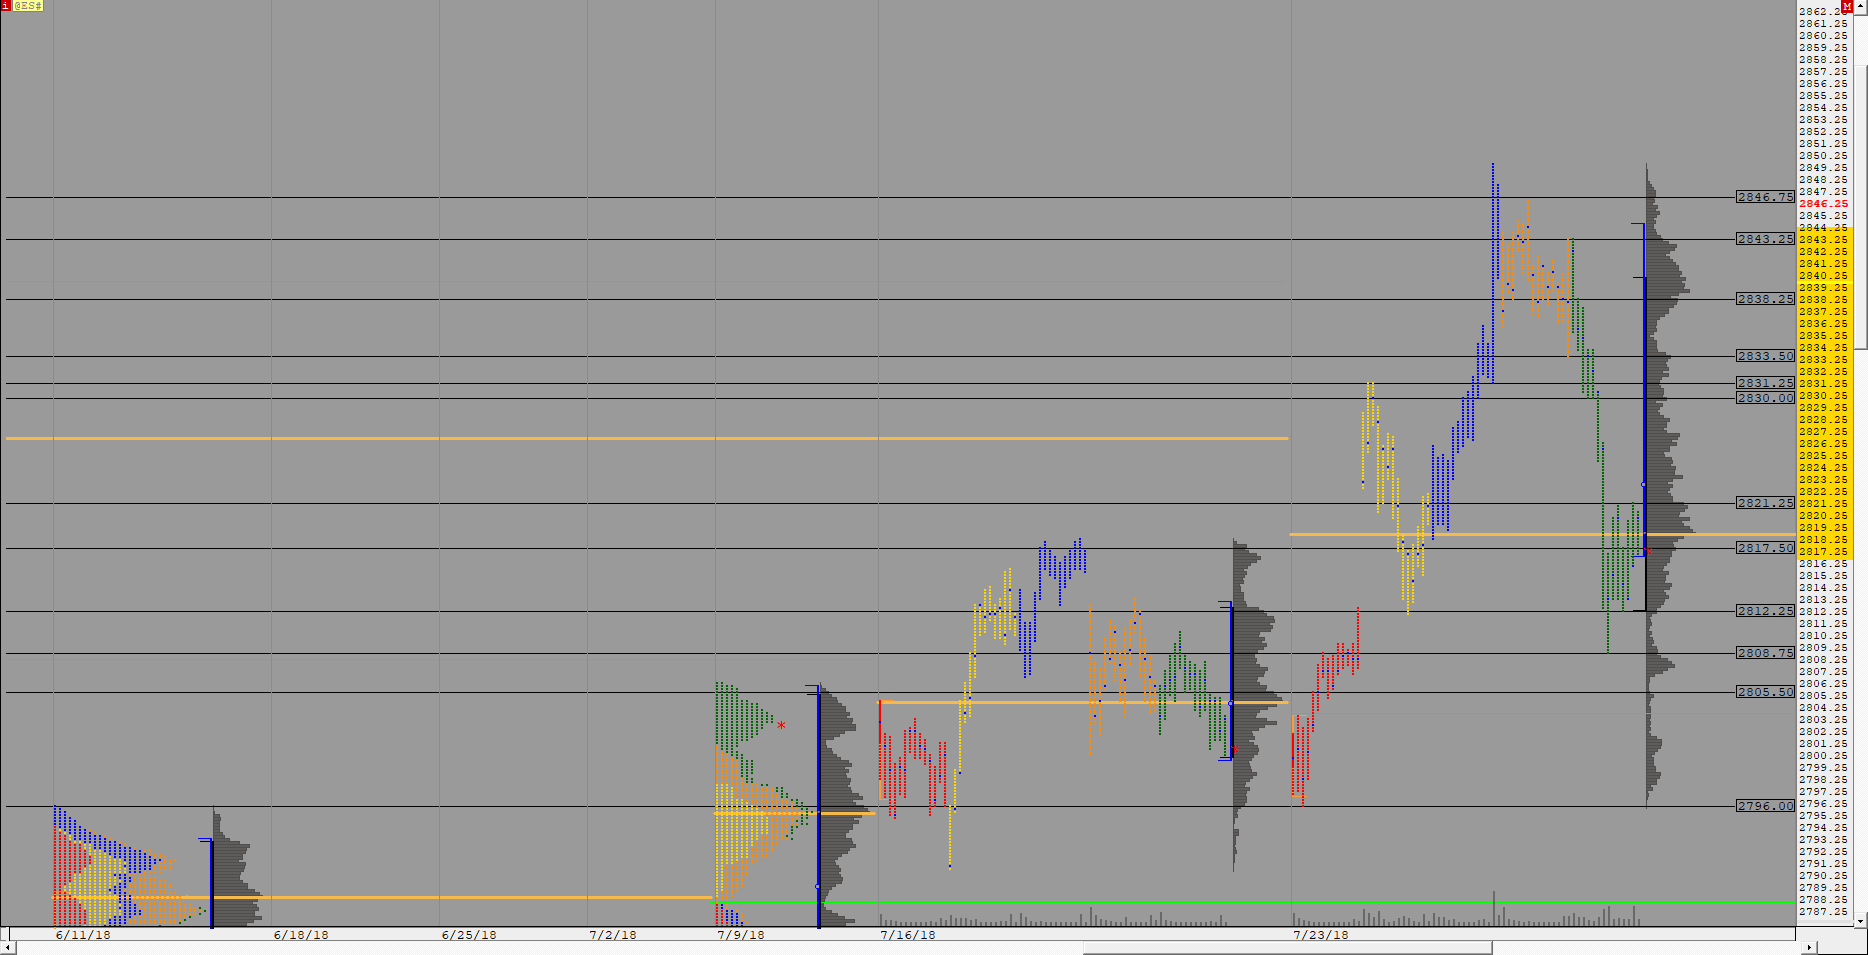
MP WEEKLY RTH (@ES#) ES42 [totalcount]
8 years 4 days ago
This chart was uploaded by Investor/RT 13.3.5 showing symbol: @ES#. |
View |
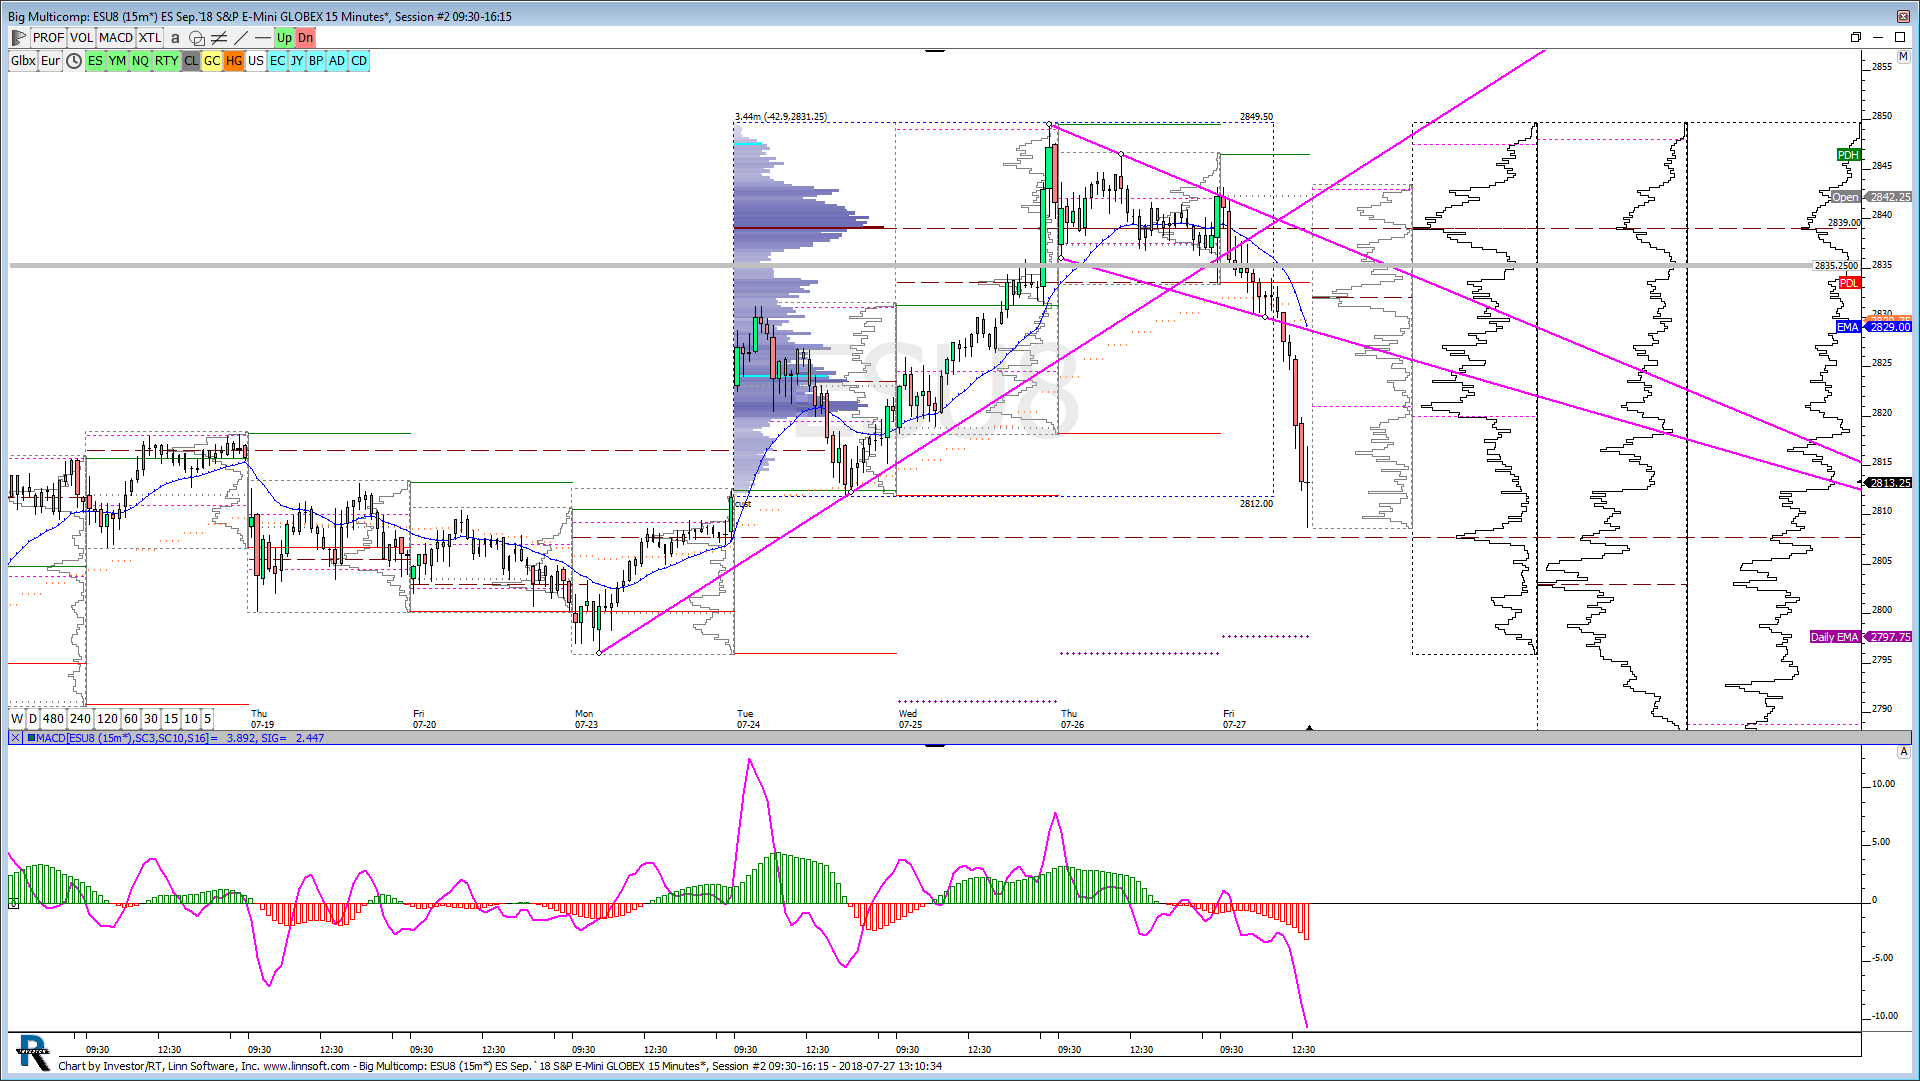 |
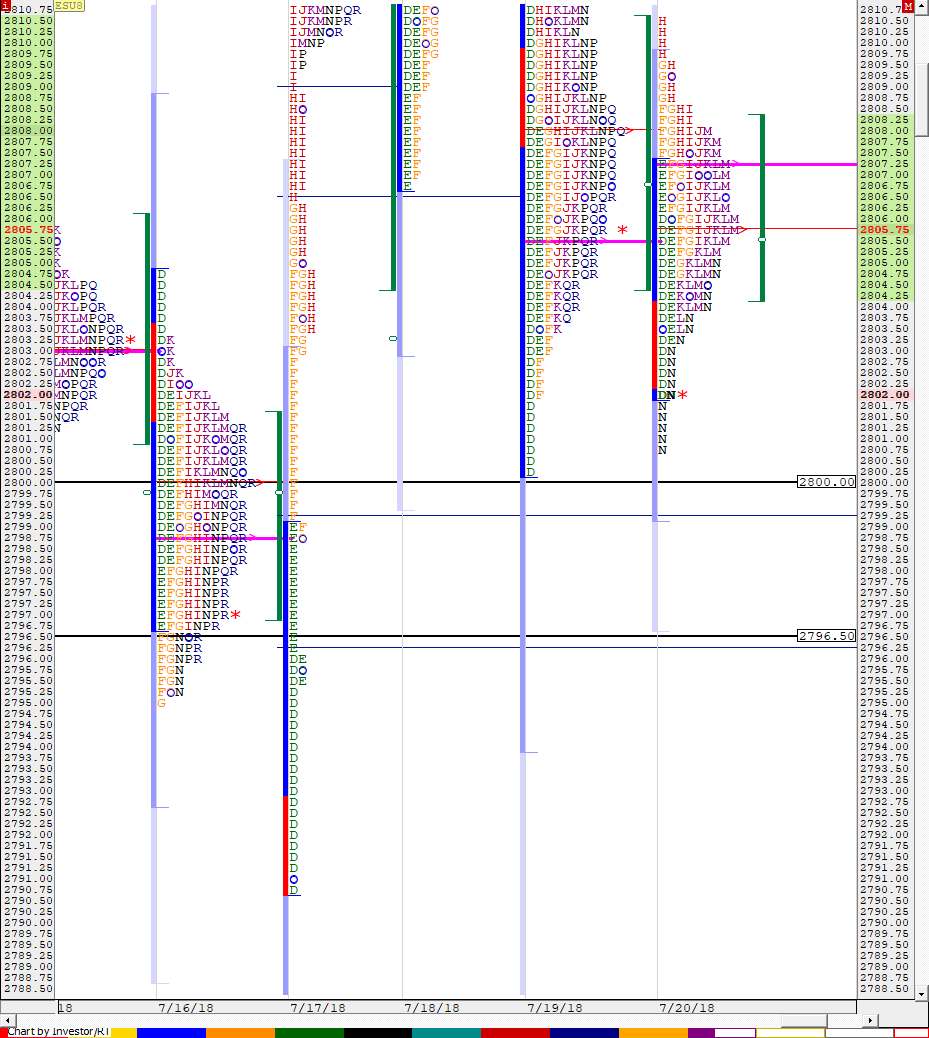
Big Multicomp (ESU8) carlosleon2005 [totalcount]
8 years 5 days ago
This chart was uploaded by Investor/RT 13.3.5 showing symbol: ESU8. |
View |
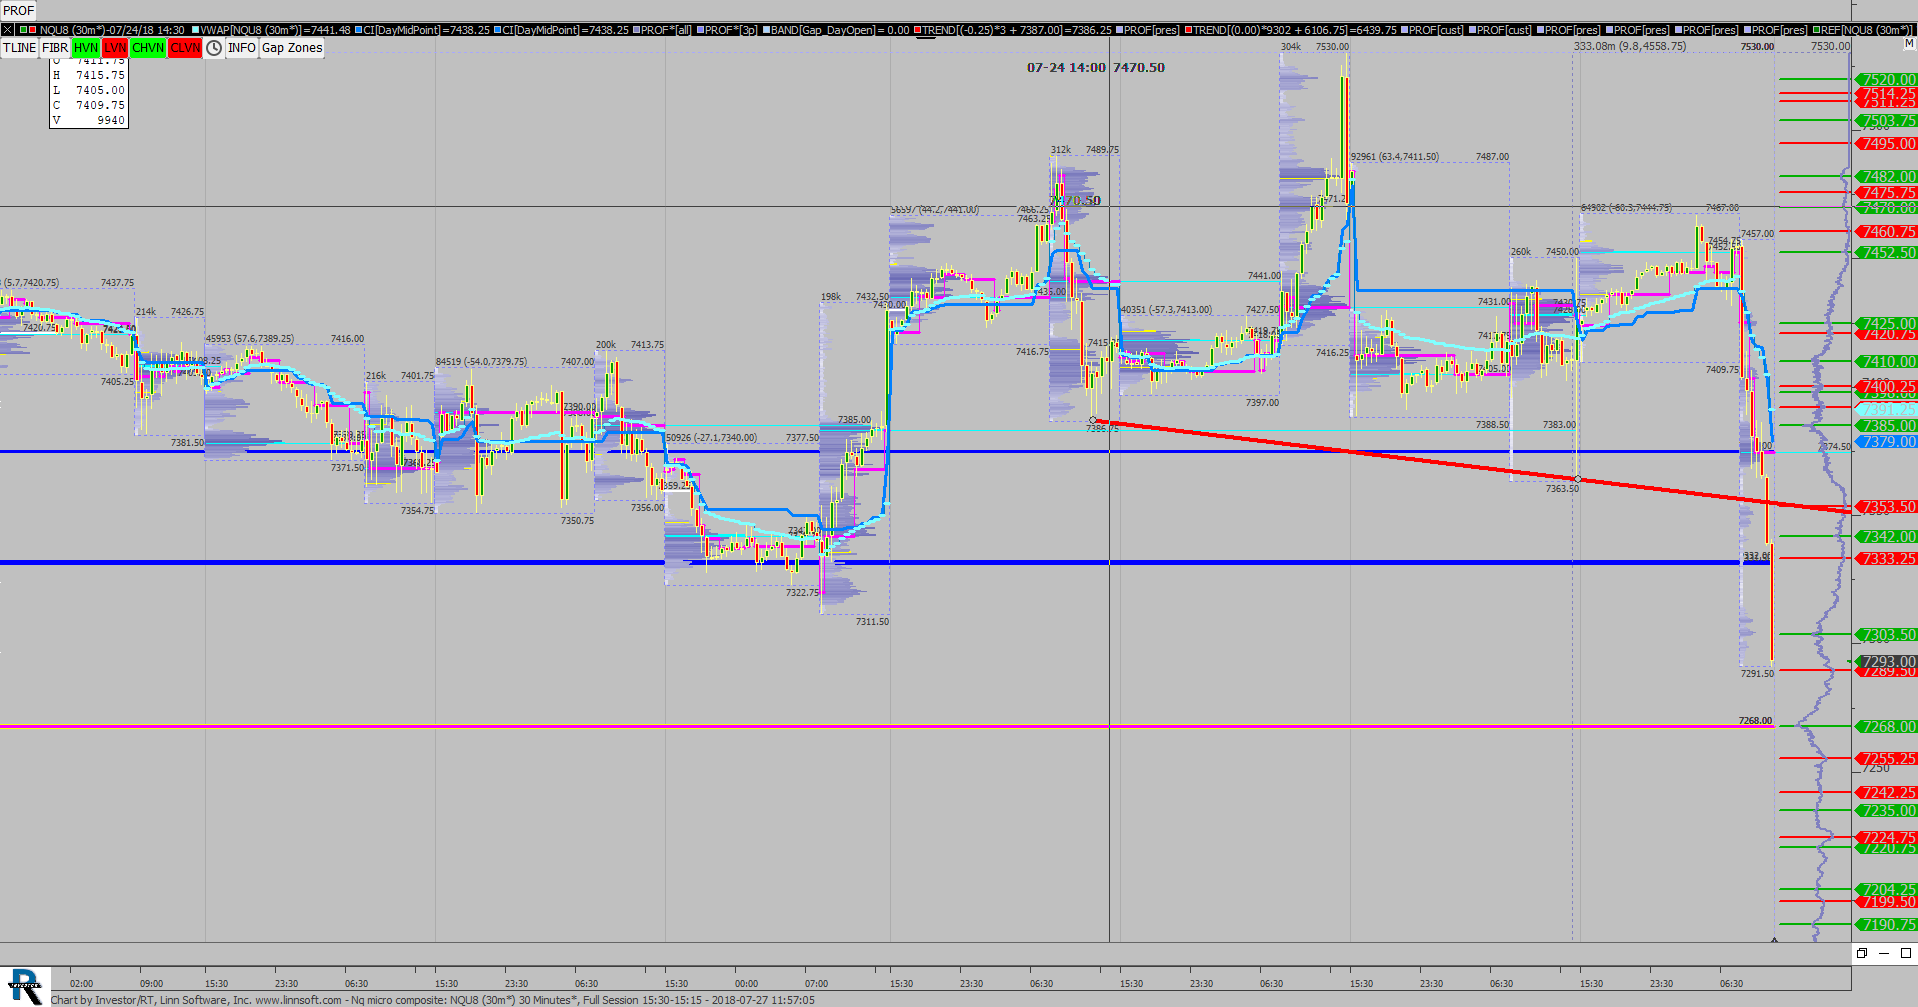 |
Nq micro composite (NQU8) scottz46 [totalcount]
8 years 5 days ago
This chart was uploaded by Investor/RT 13.3.3 showing symbol: NQU8. |
View |
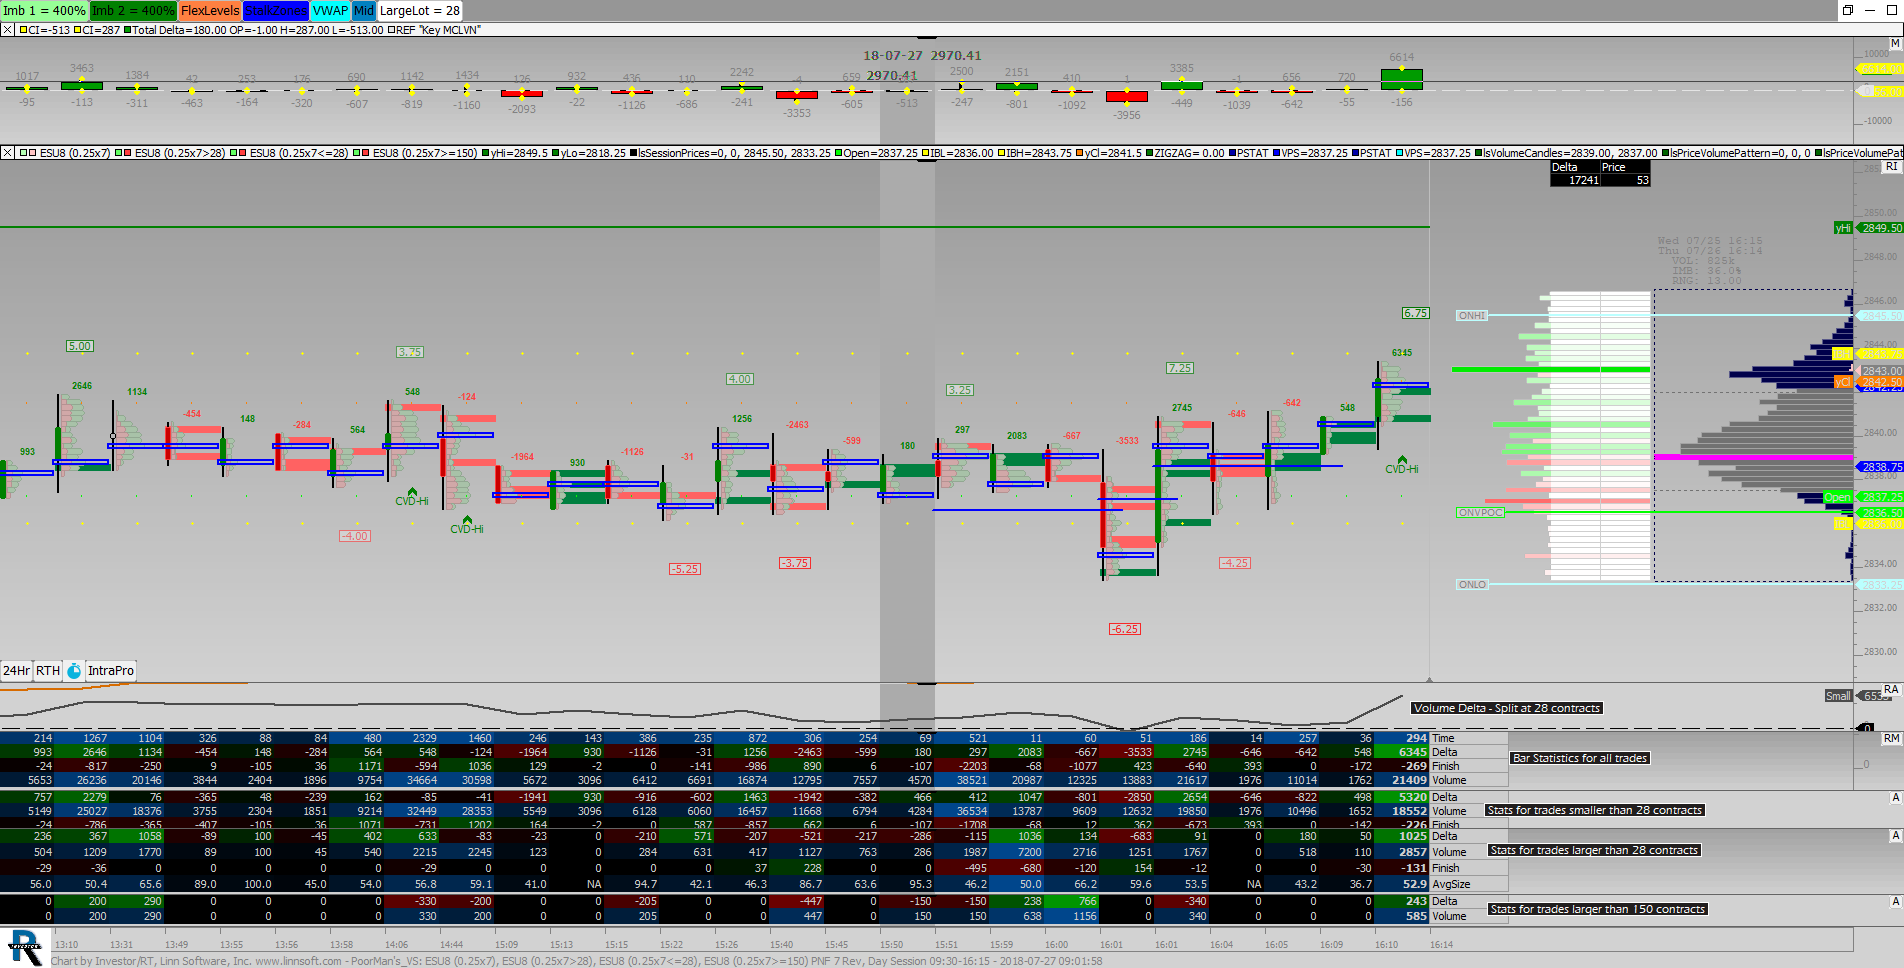 |
PoorMans VS (ESU8) SPetkov [totalcount]
8 years 5 days ago
This chart was uploaded by Investor/RT 13.3.4 showing symbol: ESU8. |
View |
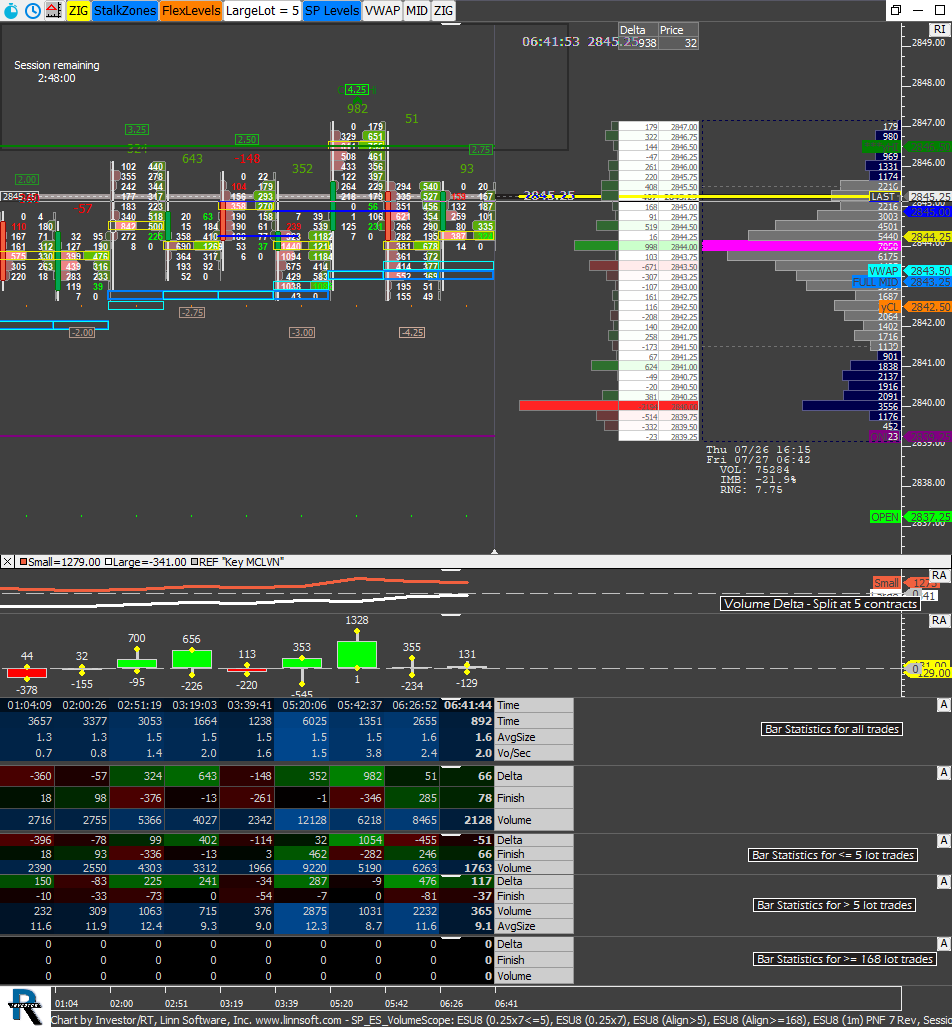 |
SP ES VolumeScope (ESU8) SPetkov [totalcount]
8 years 5 days ago
This chart was uploaded by Investor/RT 13.3.5 showing symbol: ESU8. |
View |
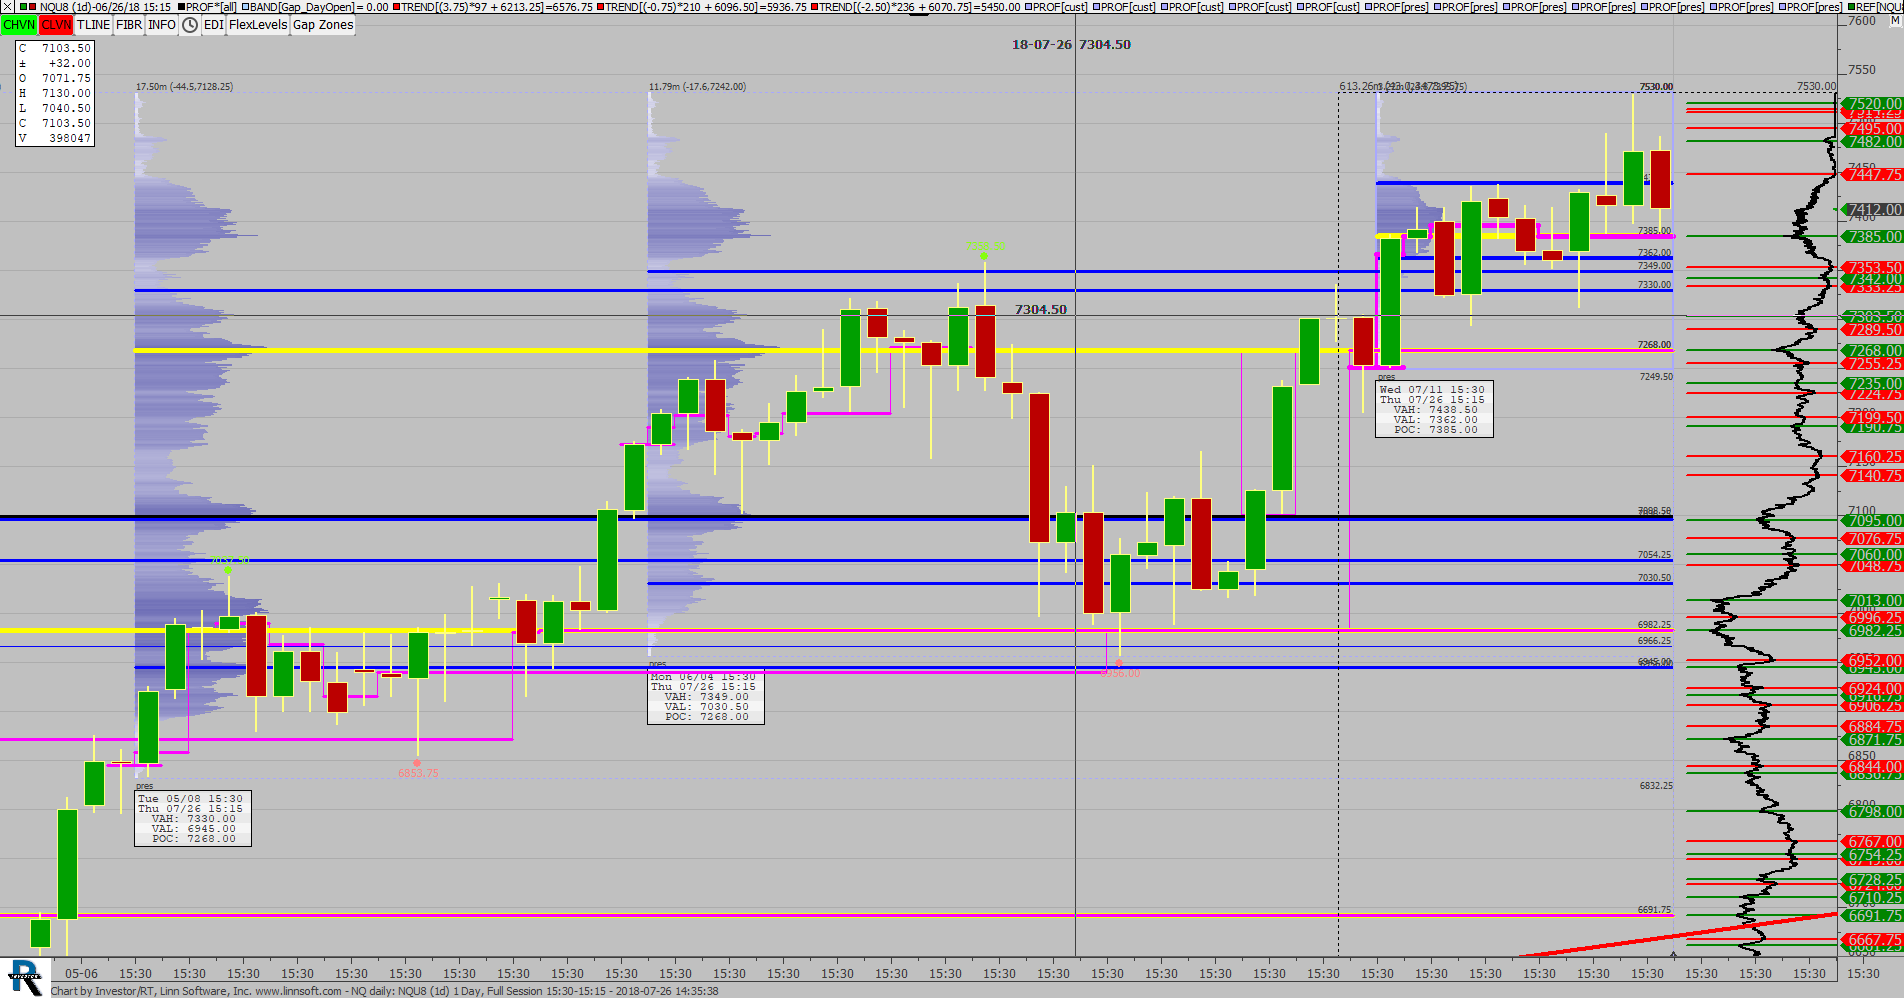 |
NQ daily (NQU8) scottz46 [totalcount]
8 years 6 days ago
This chart was uploaded by Investor/RT 13.3.3 showing symbol: NQU8. |
View |
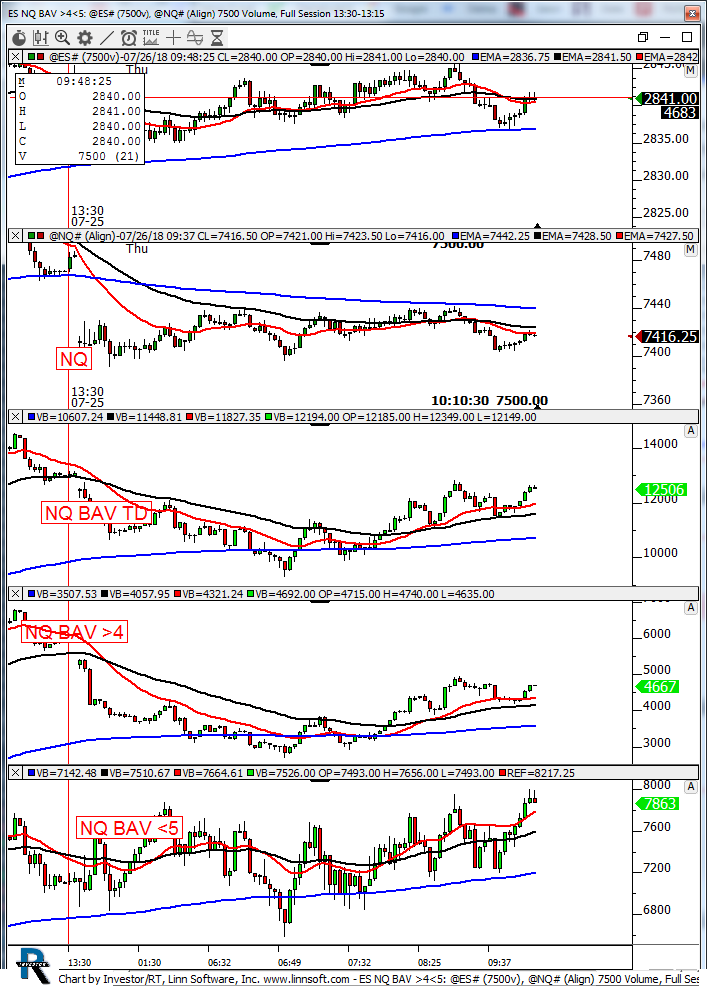 |
ES NQ BAV (@ES#) kencassorla [totalcount]
8 years 6 days ago
es / nq. This chart was uploaded by Investor/RT 13.3.5 showing symbol: @ES#. |
View |
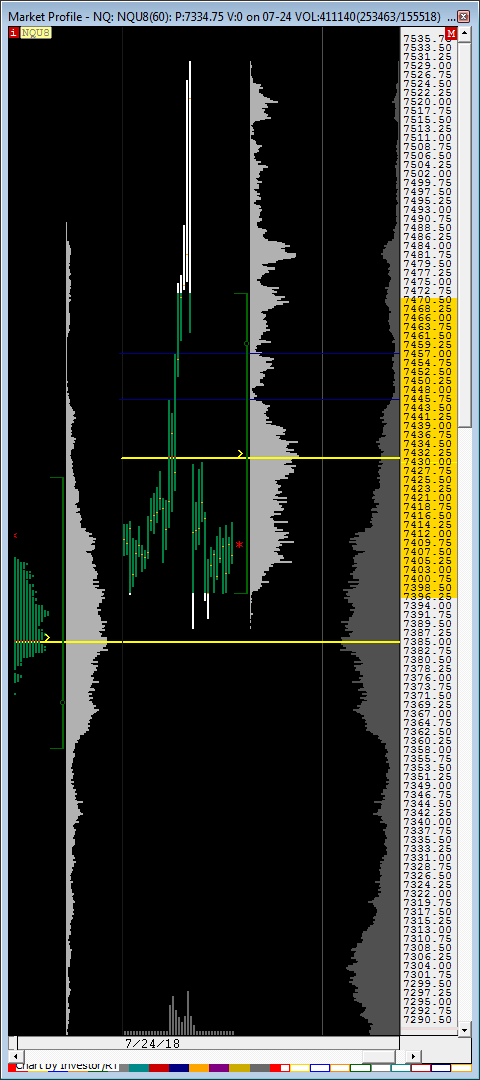 |
Market Profile NQ (NQU8) carlosleon2005 [totalcount]
8 years 6 days ago
This chart was uploaded by Investor/RT 13.3.5 showing symbol: NQU8. |
View |
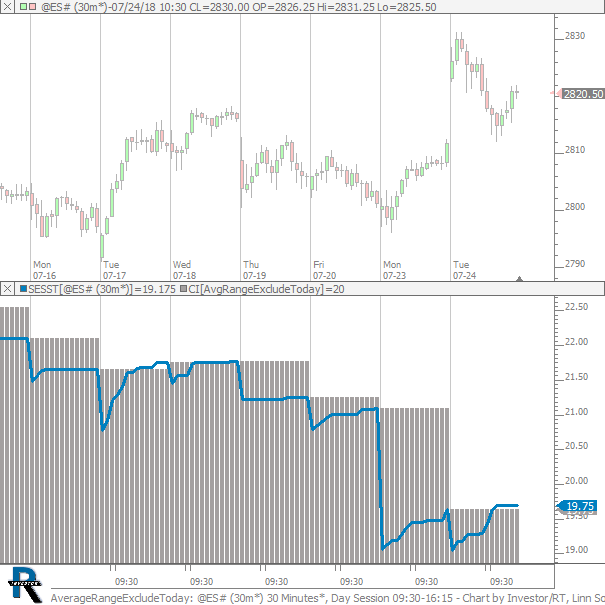 |
AverageRangeExcludeToday (@ES#) cpayne [totalcount]
8 years 1 week ago
Average Range of Last 20 Days - Excluding Current Partial Session. This chart was uploaded by Investor/RT 13.5.1 showing symbol: @ES#. |
View |
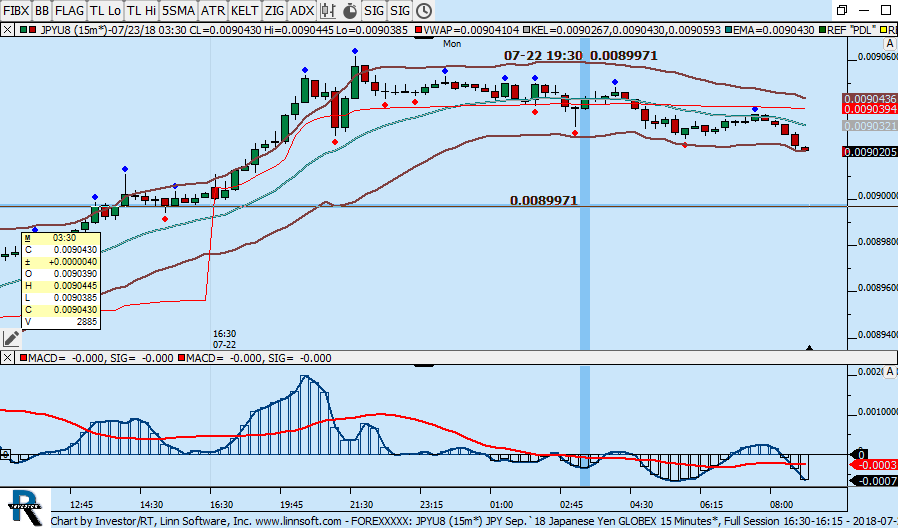 |
FOREXXXXX (JPYU8) boris-libman [totalcount]
8 years 1 week ago
This chart was uploaded by Investor/RT 13.3.5 showing symbol: JPYU8. |
View |
 |
ES Layout002c (@ES#) ES42 [totalcount]
8 years 1 week ago
This chart was uploaded by Investor/RT 13.3.1 showing symbol: @ES#. |
View |
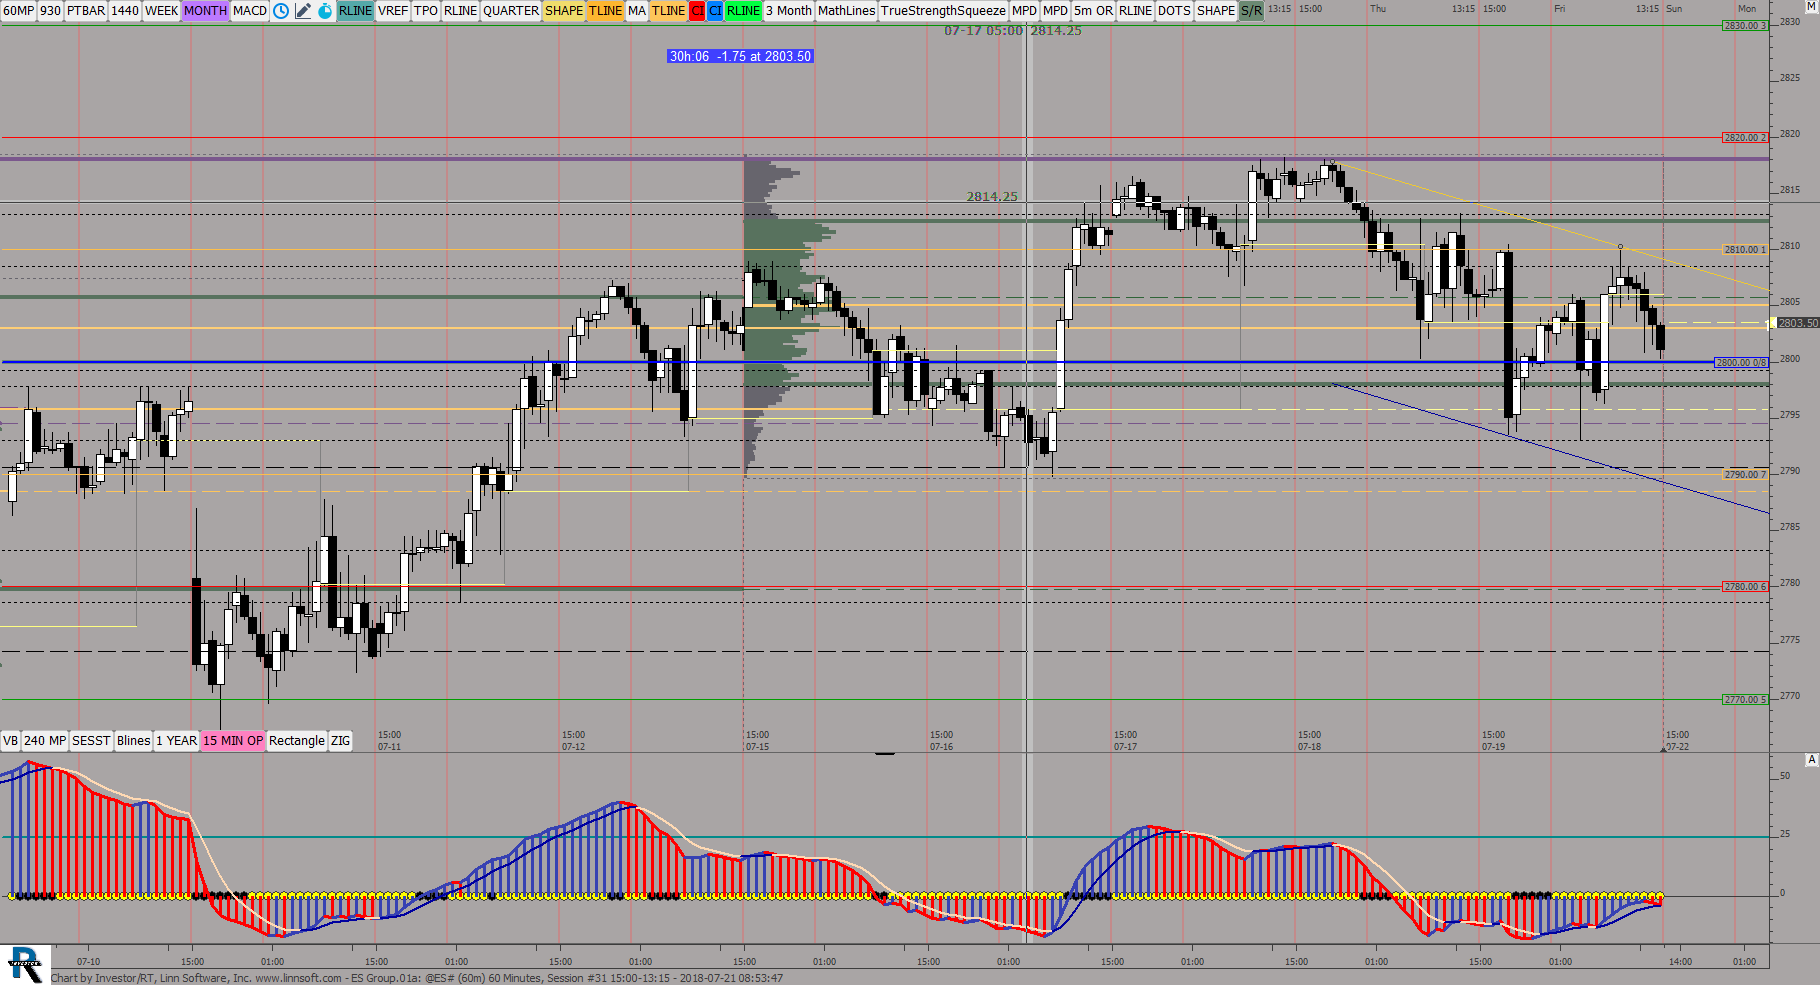 |
ES Group01a (@ES#) ES42 [totalcount]
8 years 1 week ago
This chart was uploaded by Investor/RT 13.3.5 showing symbol: @ES#. |
View |
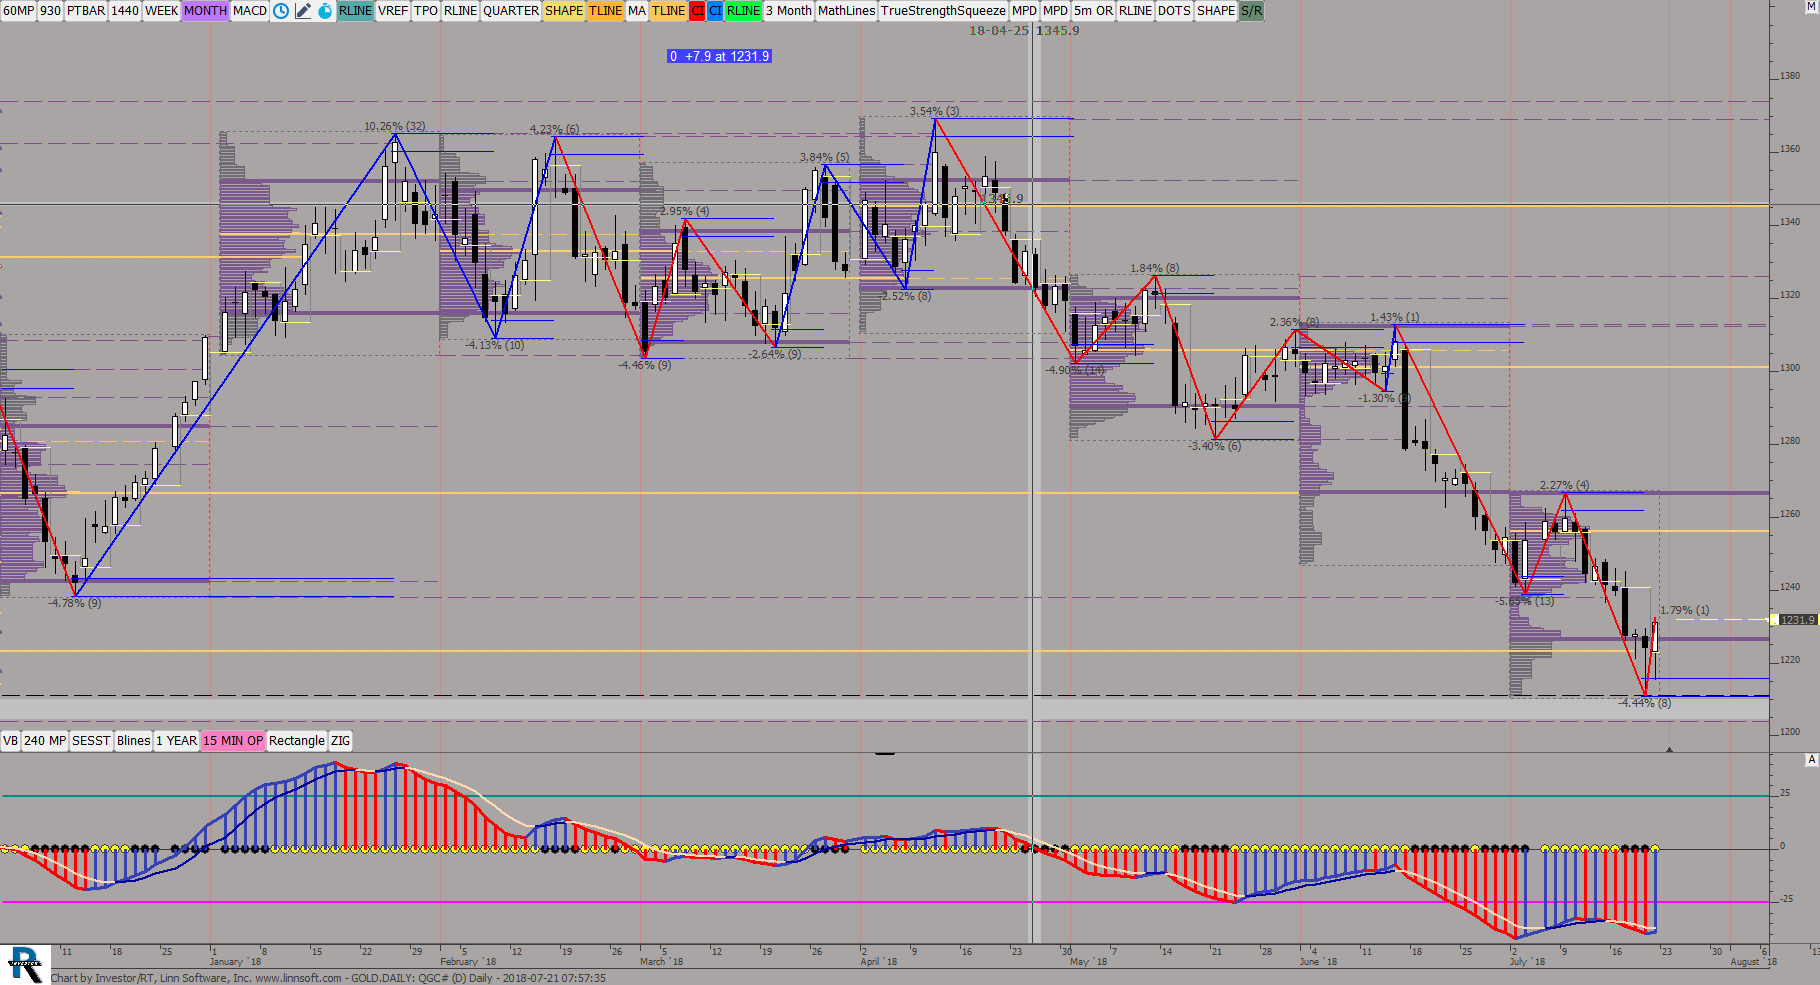 |
GOLDDAILY (QGC#) ES42 [totalcount]
8 years 1 week ago
This chart was uploaded by Investor/RT 13.3.5 showing symbol: QGC#. |
View |
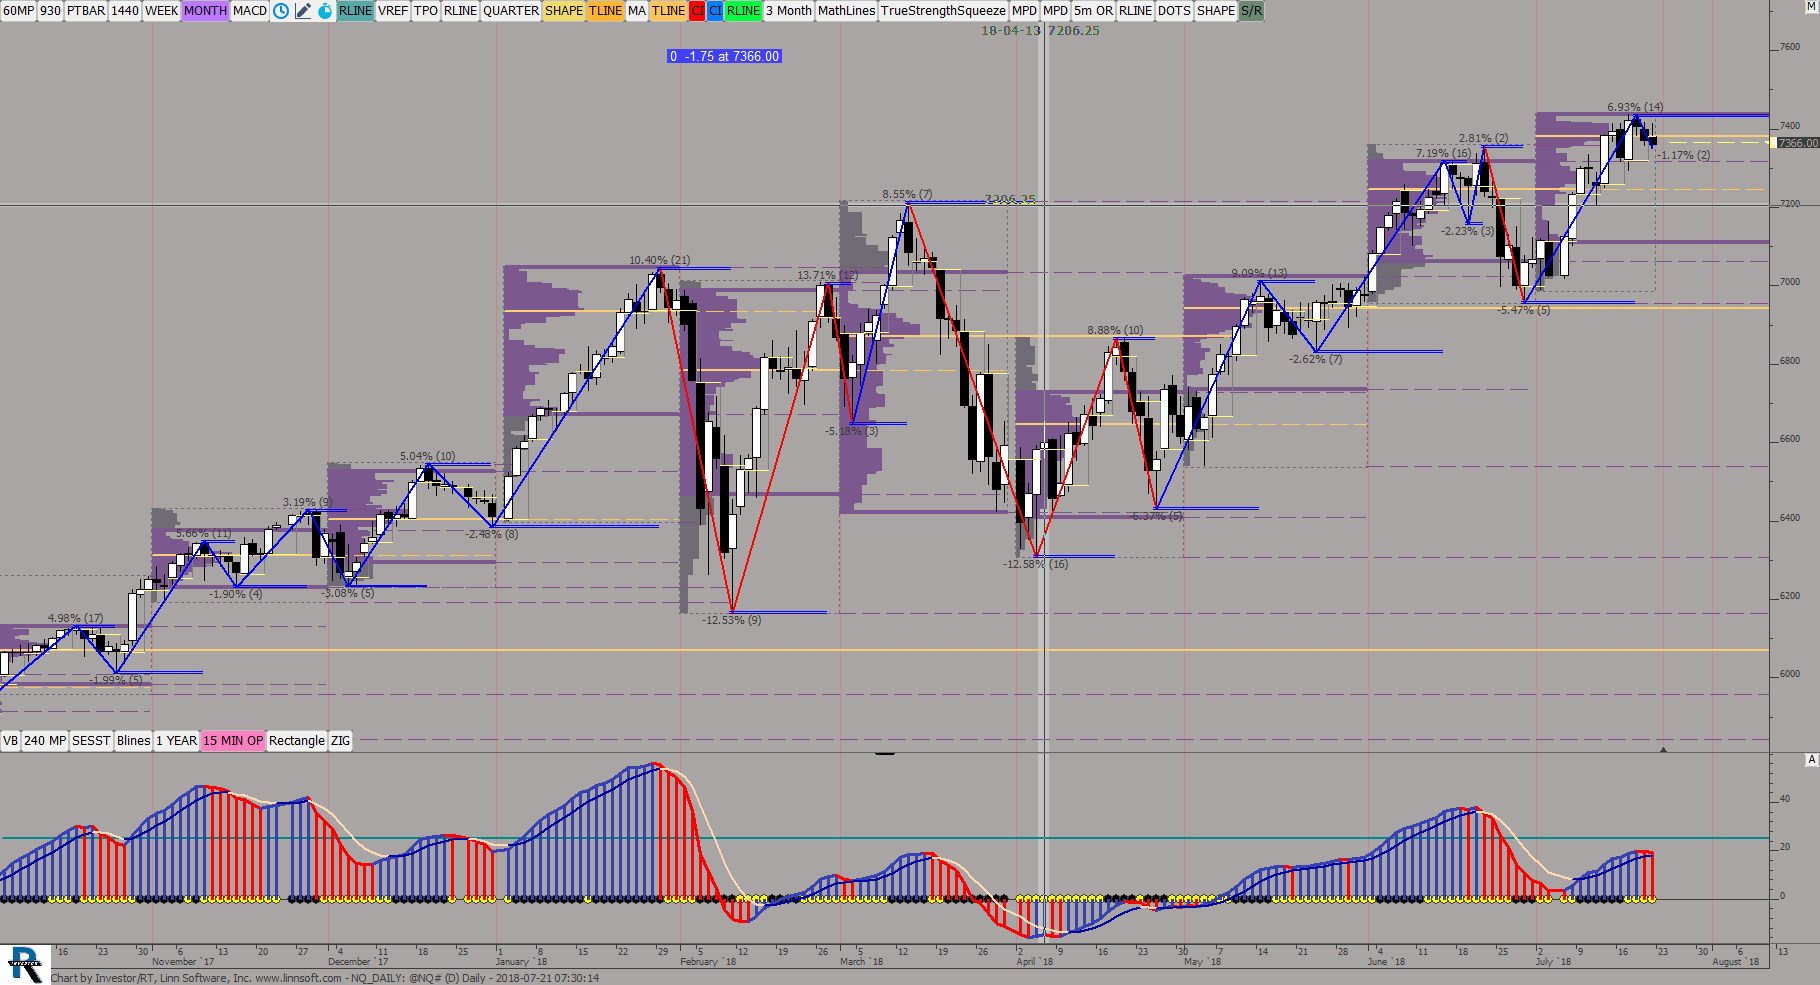 |
NQ DAILY (@NQ#) ES42 [totalcount]
8 years 1 week ago
This chart was uploaded by Investor/RT 13.3.5 showing symbol: @NQ#. |
View |
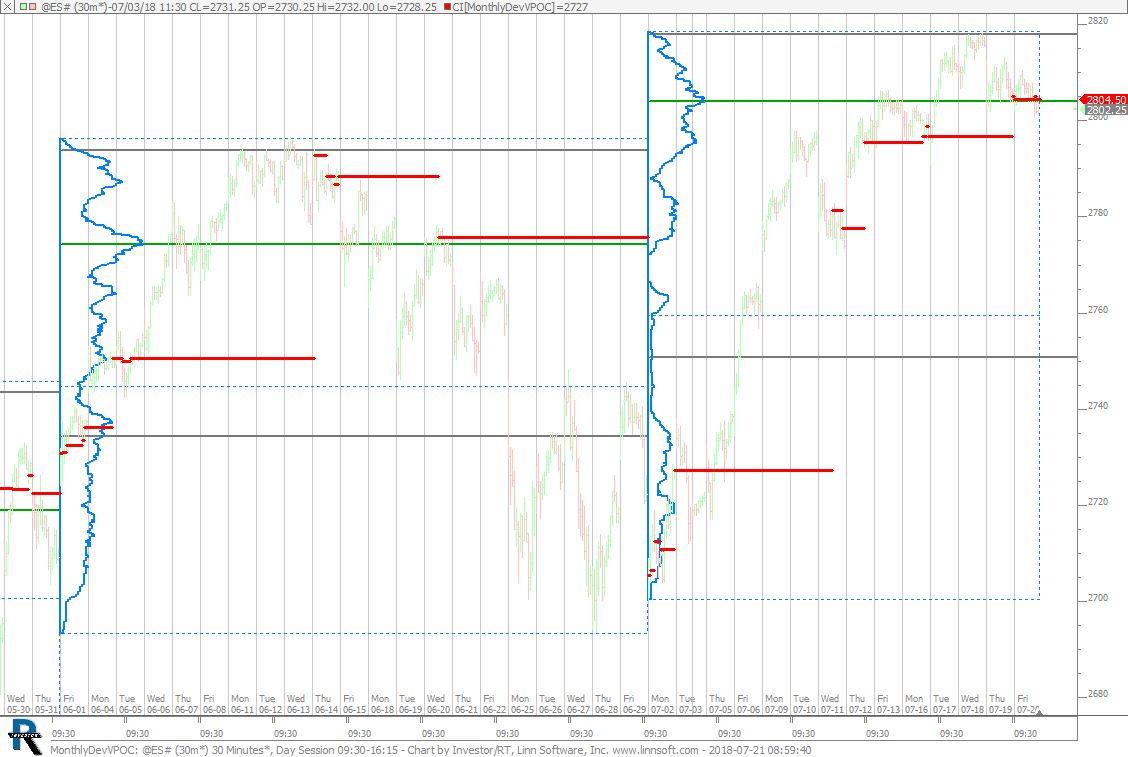 |
MonthlyDevVPOC (@ES#) cpayne [totalcount]
8 years 1 week ago
Time-Based Monthly Profiles - Dev VPOC. This chart was uploaded by Investor/RT 13.5.1 showing symbol: @ES#. |
View |
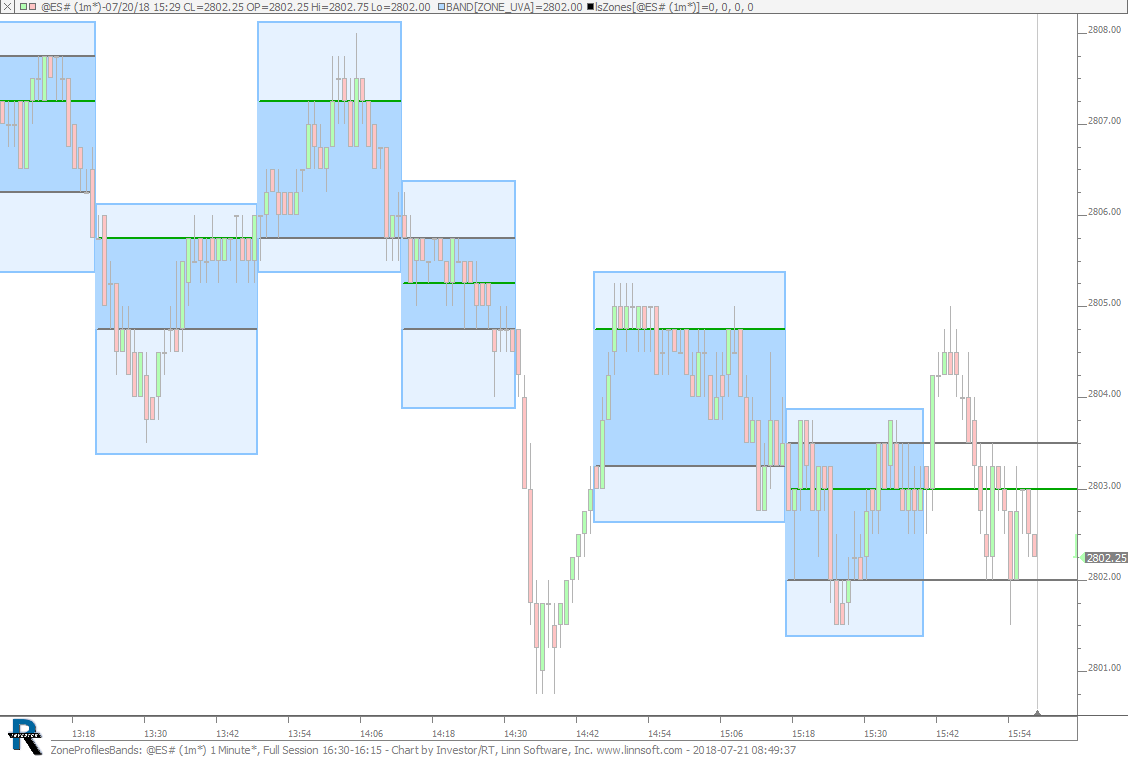 |
ZoneProfilesBands (@ES#) cpayne [totalcount]
8 years 1 week ago
Zone Profiles with VA Bands. This chart was uploaded by Investor/RT 13.5.1 showing symbol: @ES#. |
View |
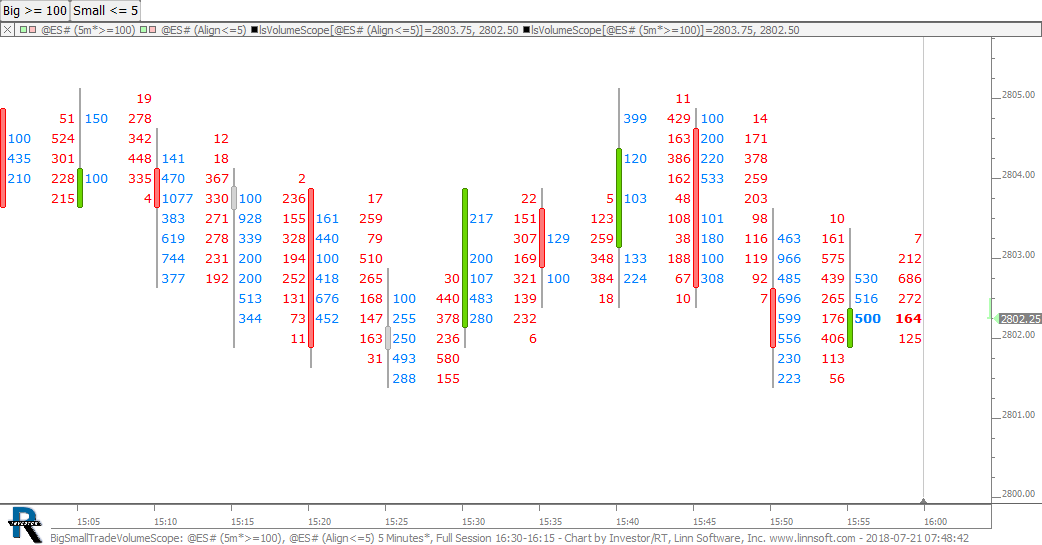 |
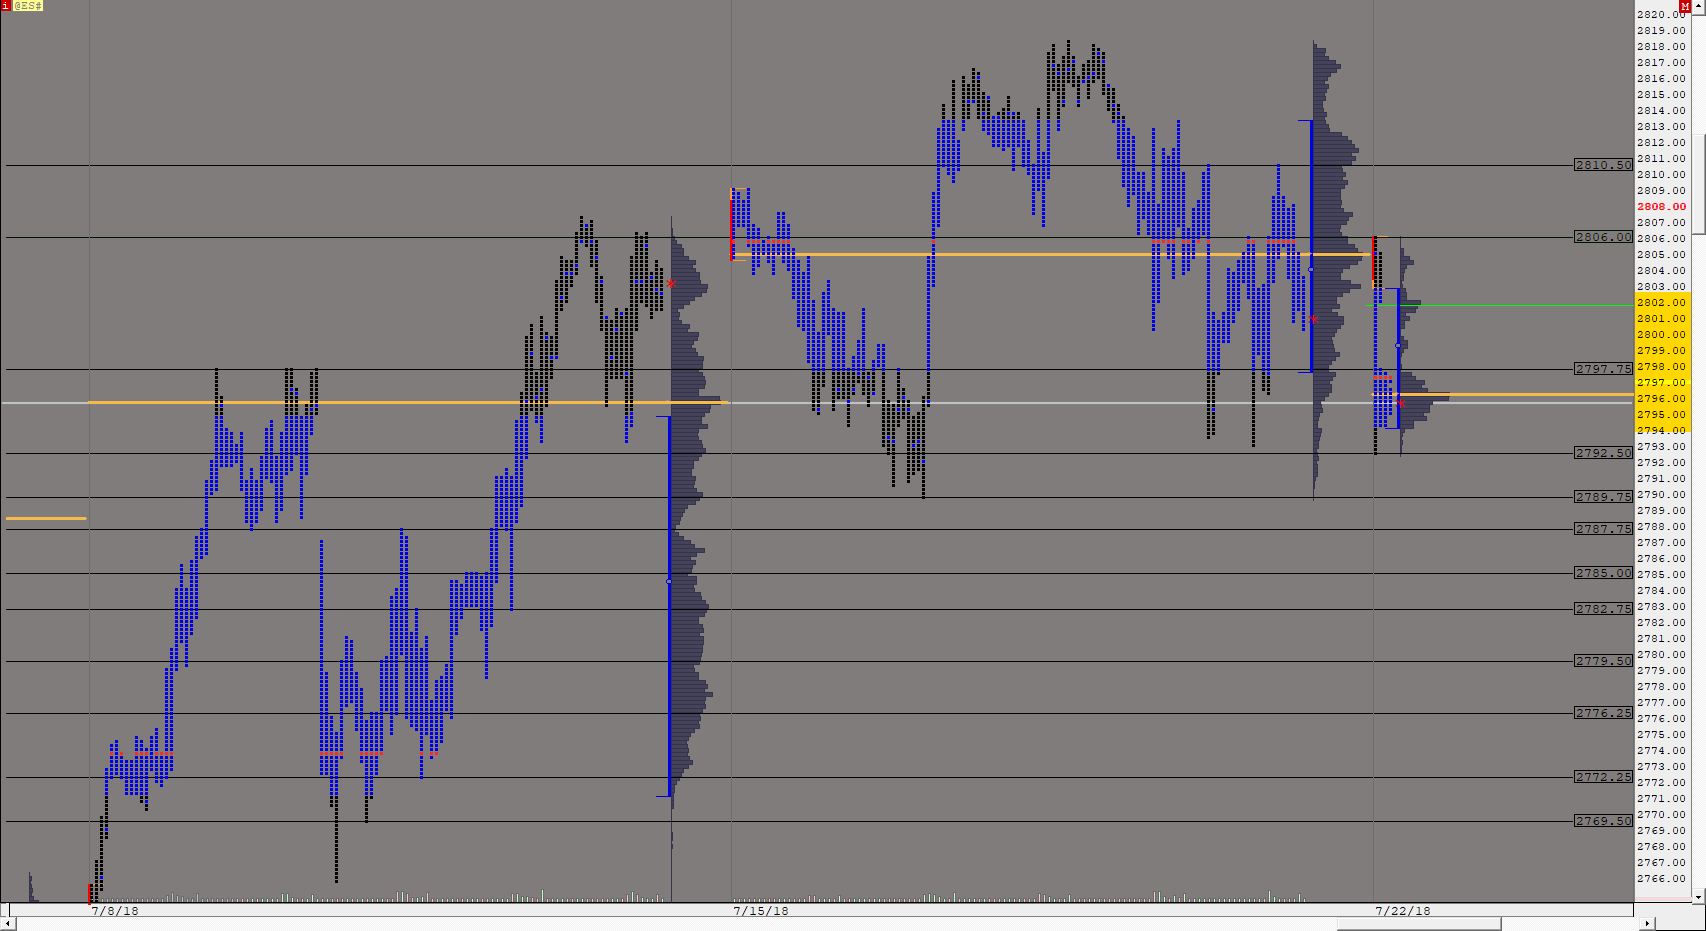
BigSmallTradeVolumeScope (@ES#) cpayne [totalcount]
8 years 1 week ago
Big Trades in Blue. Small Trades in Red. Use buttons to control sizes. This chart was uploaded by Investor/RT 13.5.1 showing symbol: @ES#. |
View |
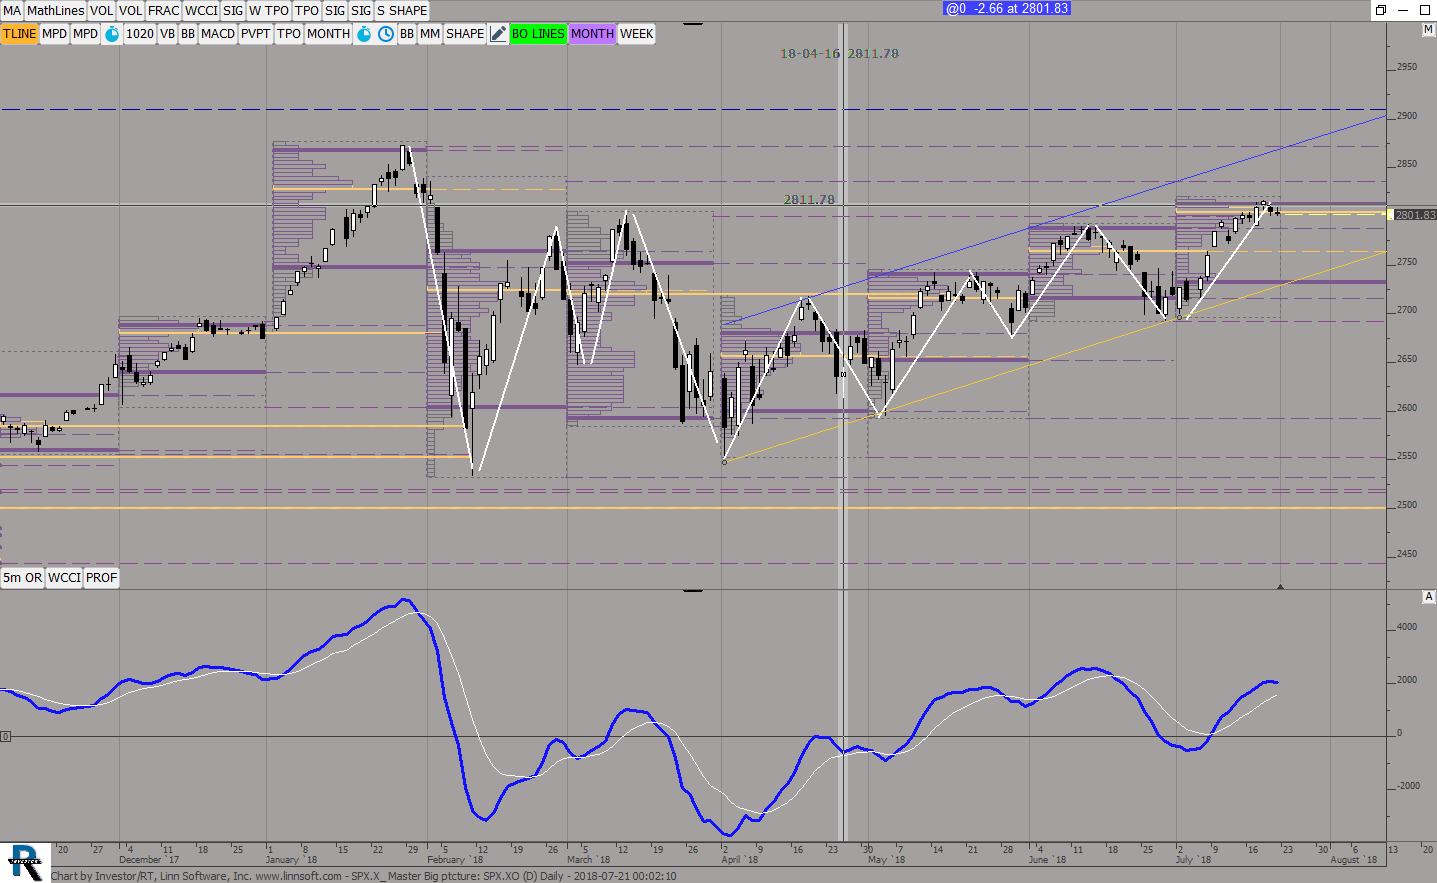 |
SPXX Master Big ptcture (SPX.XO) ES42 [totalcount]
8 years 1 week ago
This chart was uploaded by Investor/RT 13.3.5 showing symbol: SPX.XO. |
View |
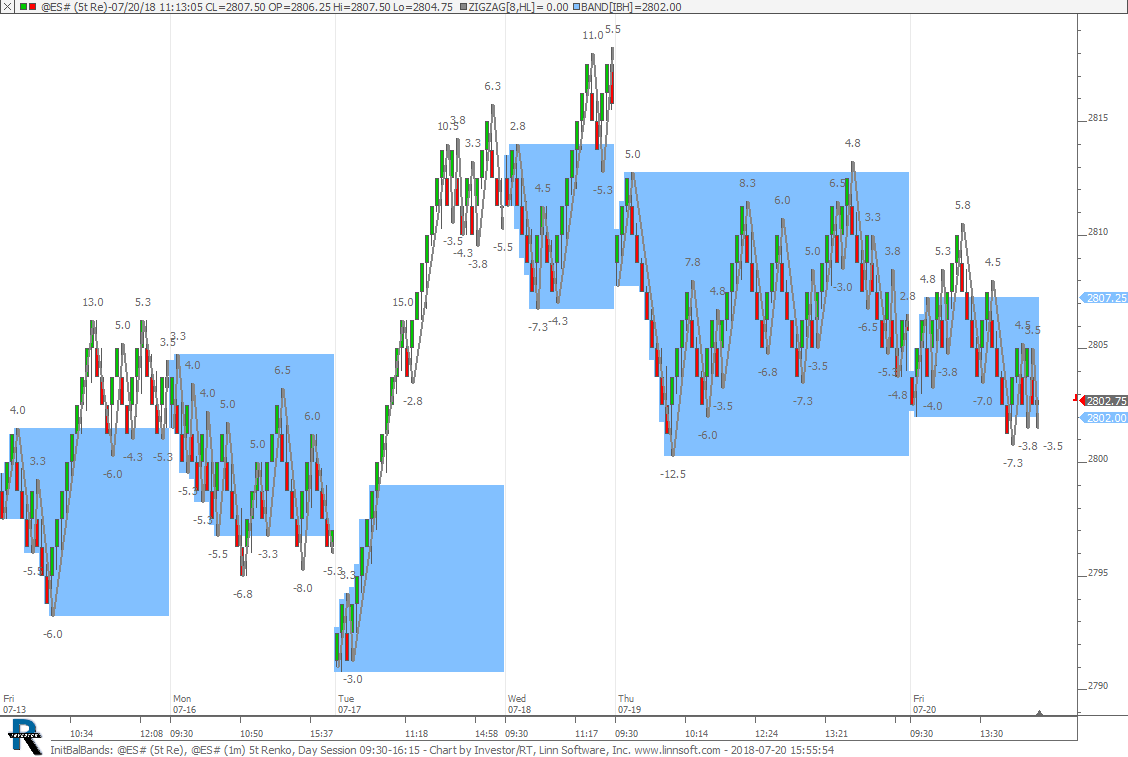 |
InitBalBands (@ES#) cpayne [totalcount]
8 years 1 week ago
Initial Balance Bands. This chart was uploaded by Investor/RT 13.5.1 showing symbol: @ES#. |
View |
 |
ES TPO (ESU8) scottz46 [totalcount]
8 years 1 week ago
This chart was uploaded by Investor/RT 13.3.3 showing symbol: ESU8. |
View |
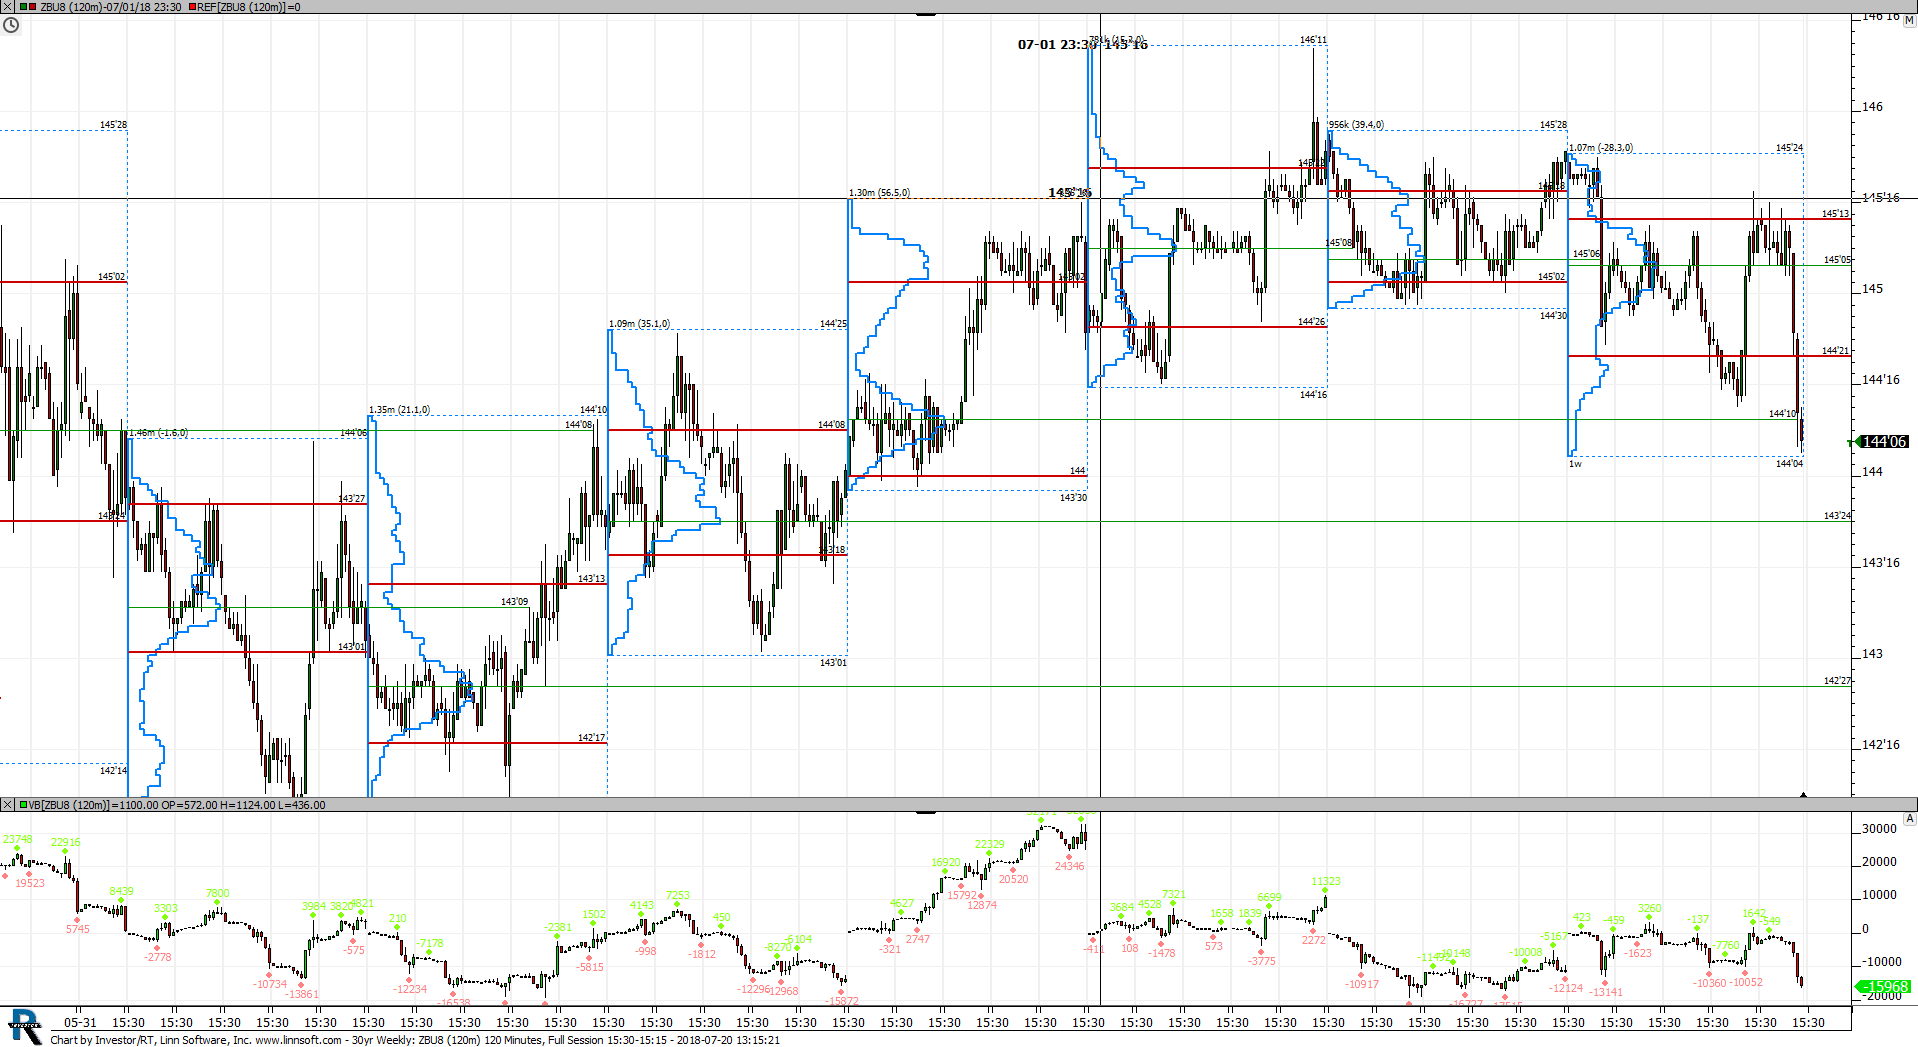 |
30yr Weekly (ZBU8) scottz46 [totalcount]
8 years 1 week ago
This chart was uploaded by Investor/RT 13.3.3 showing symbol: ZBU8. |
View |
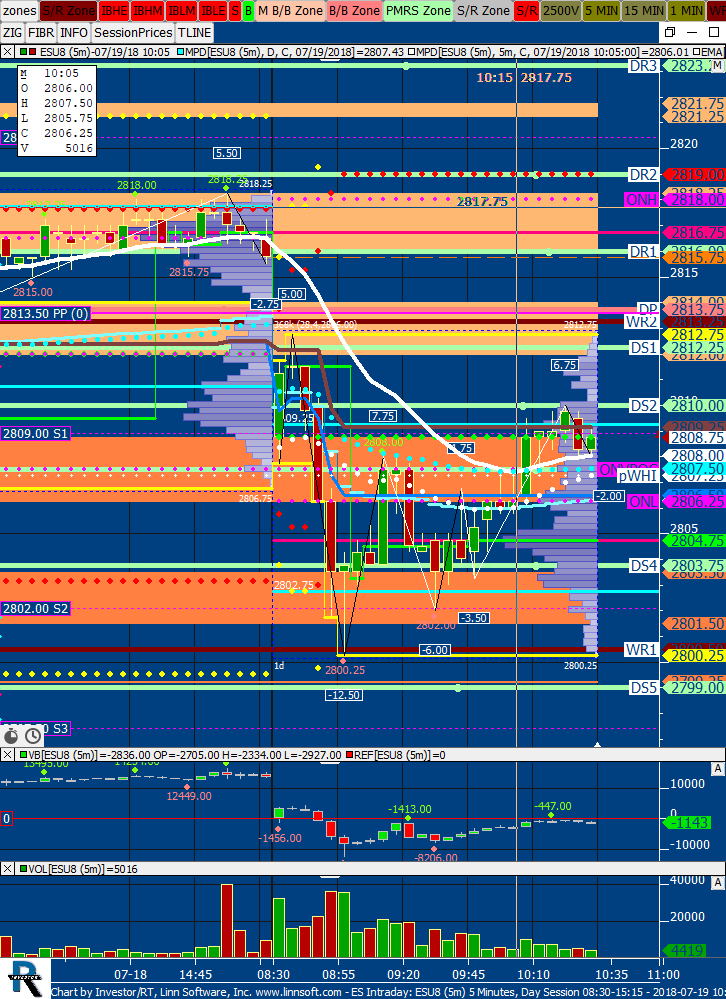 |
ES Intraday (ESU8) scottz46 [totalcount]
8 years 1 week ago
This chart was uploaded by Investor/RT 13.3.3 showing symbol: ESU8. |
View |
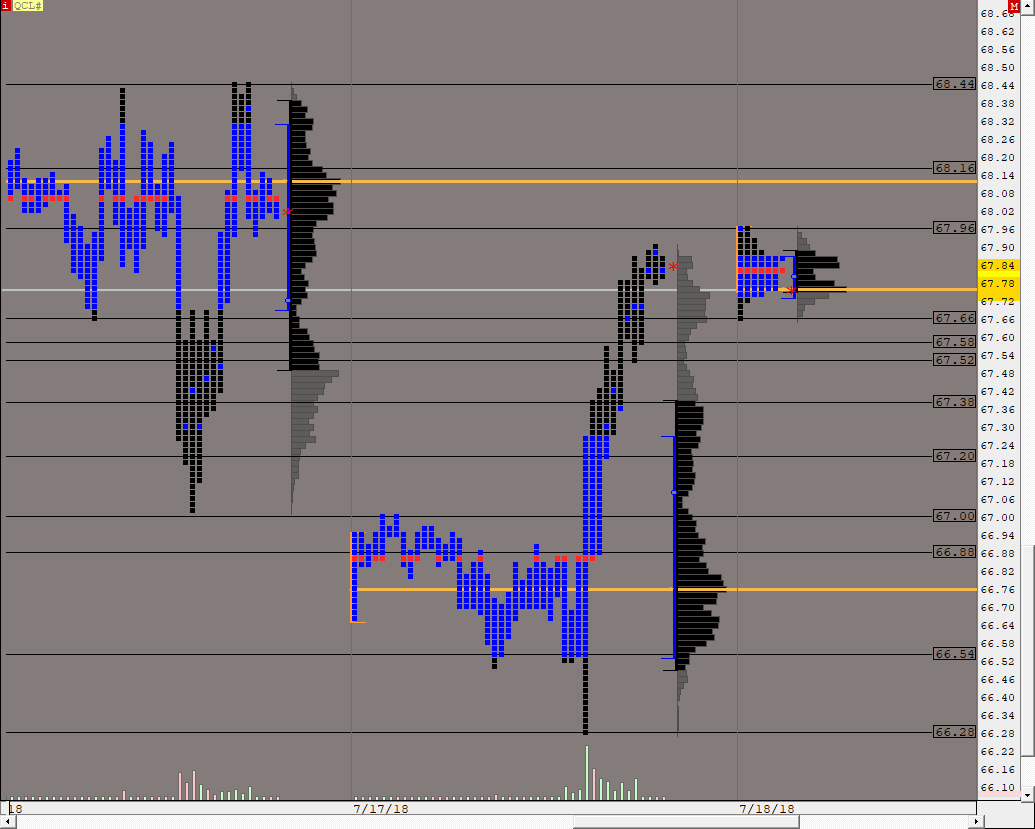 |
MP CL MONTHLY (QCL#) ES42 [totalcount]
8 years 2 weeks ago
This chart was uploaded by Investor/RT 13.3.5 showing symbol: QCL#. |
View |
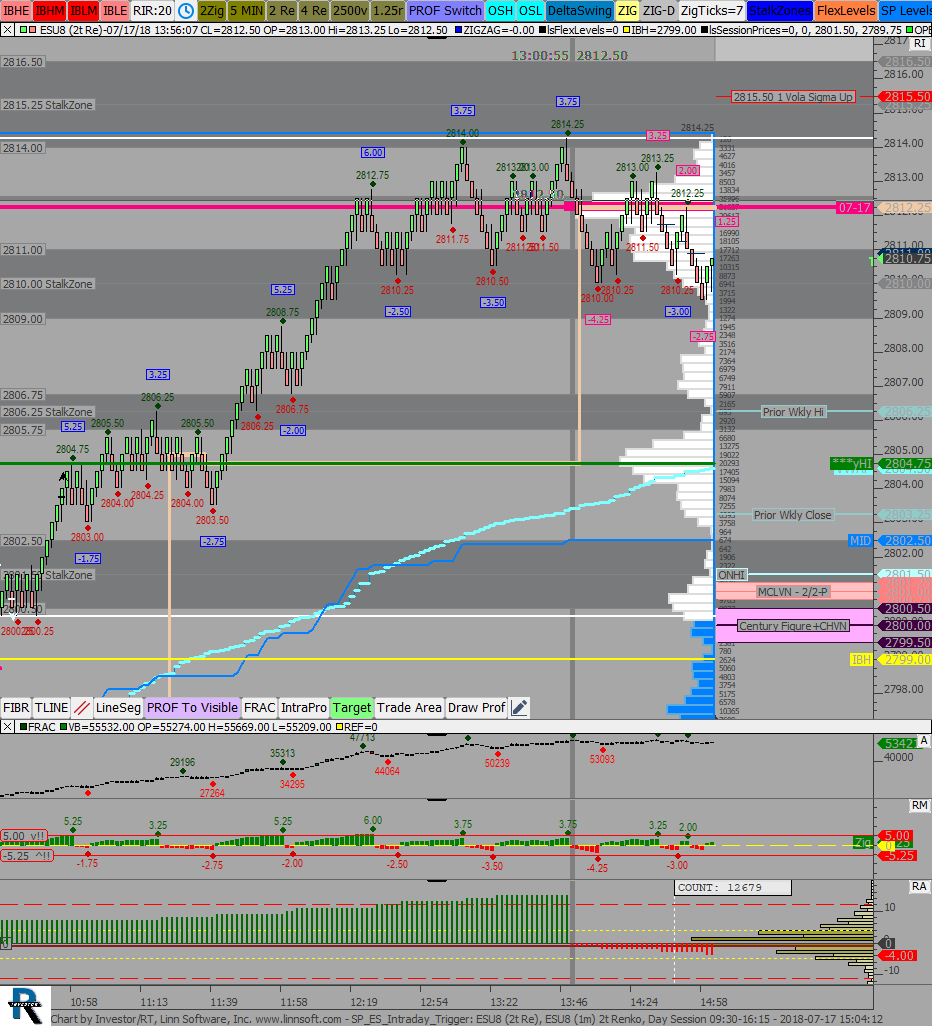 |
SP ES Intraday Trigger (ESU8) SPetkov [totalcount]
8 years 2 weeks ago
This chart was uploaded by Investor/RT 13.3.5 showing symbol: ESU8. |
View |
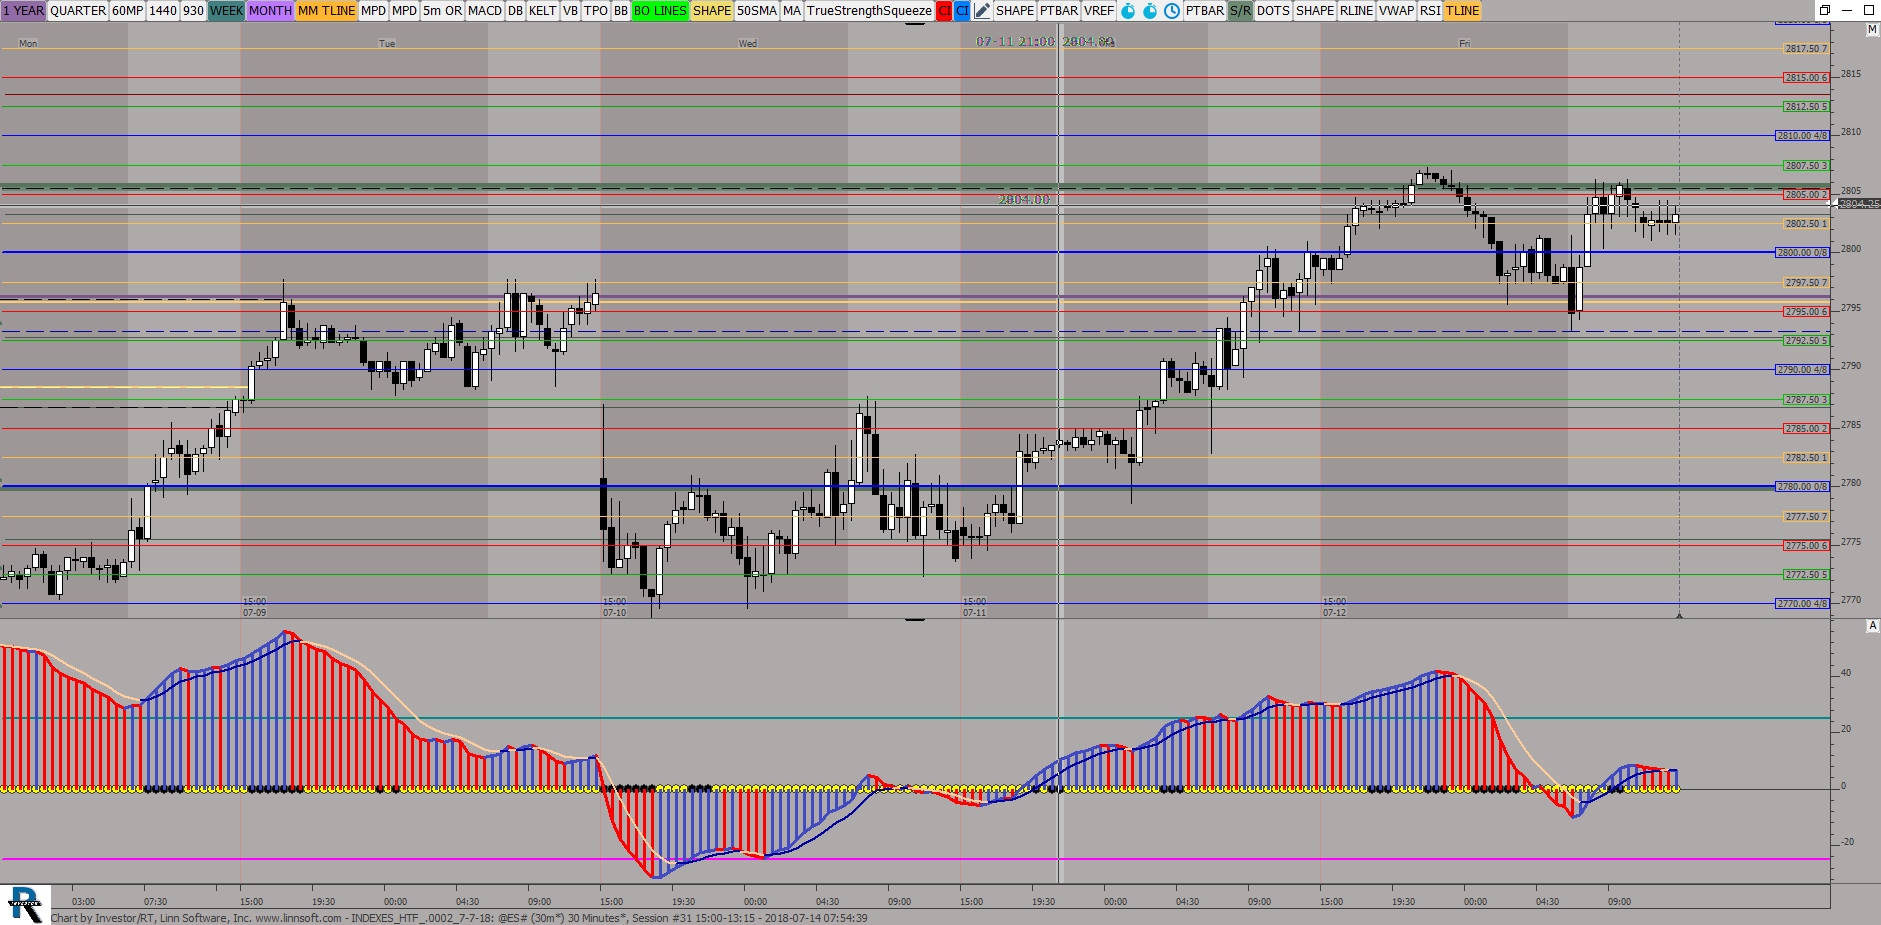 |
INDEXES HTF 0002 7 7 (@ES#) ES42 [totalcount]
8 years 2 weeks ago
This chart was uploaded by Investor/RT 13.3.5 showing symbol: @ES#. |
View |