 |
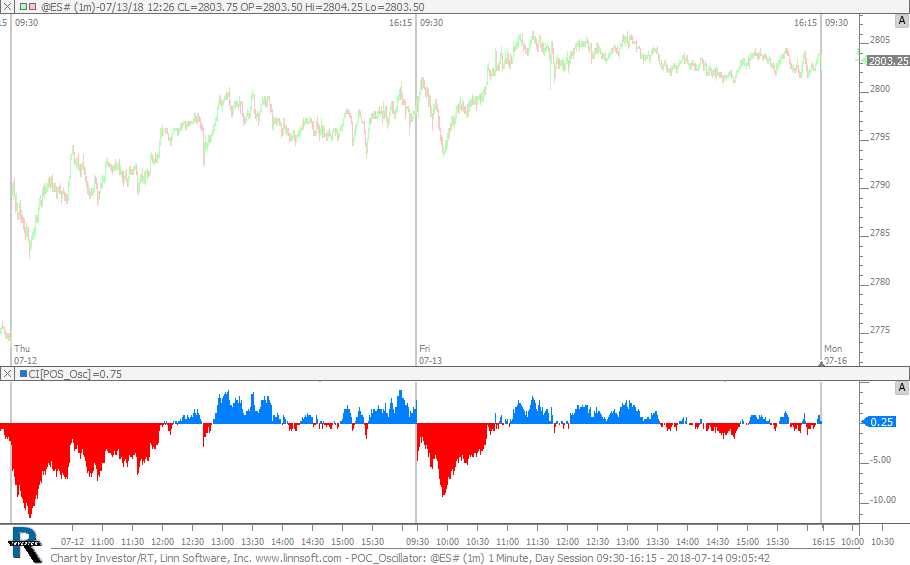
POC Oscillator (@ES#) cpayne [totalcount]
8 years 2 weeks ago
POC Oscillator (CL - POC). This chart was uploaded by Investor/RT 13.5.1 showing symbol: @ES#. |
View |
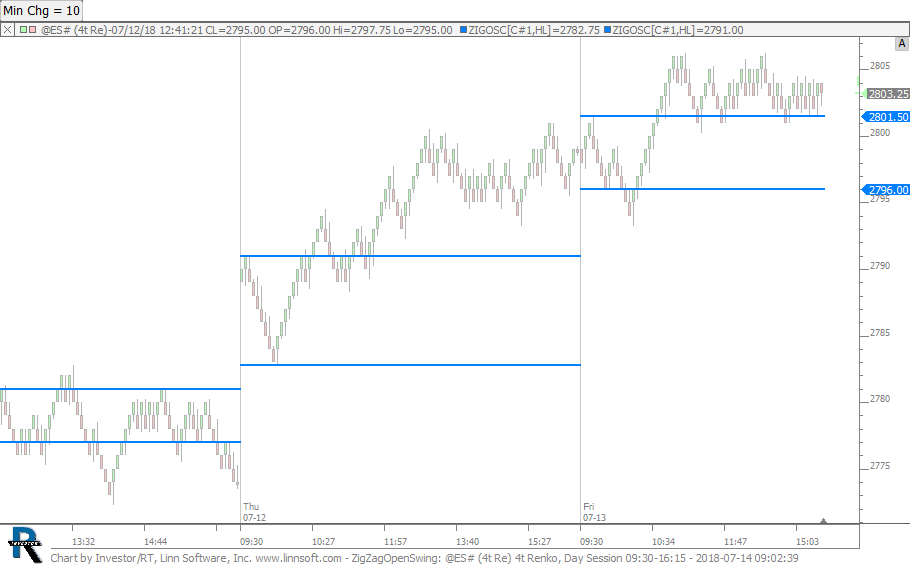 |
ZigZagOpenSwing (@ES#) cpayne [totalcount]
8 years 2 weeks ago
Zig Zag Open Swing High and Low. This chart was uploaded by Investor/RT 13.5.1 showing symbol: @ES#. |
View |
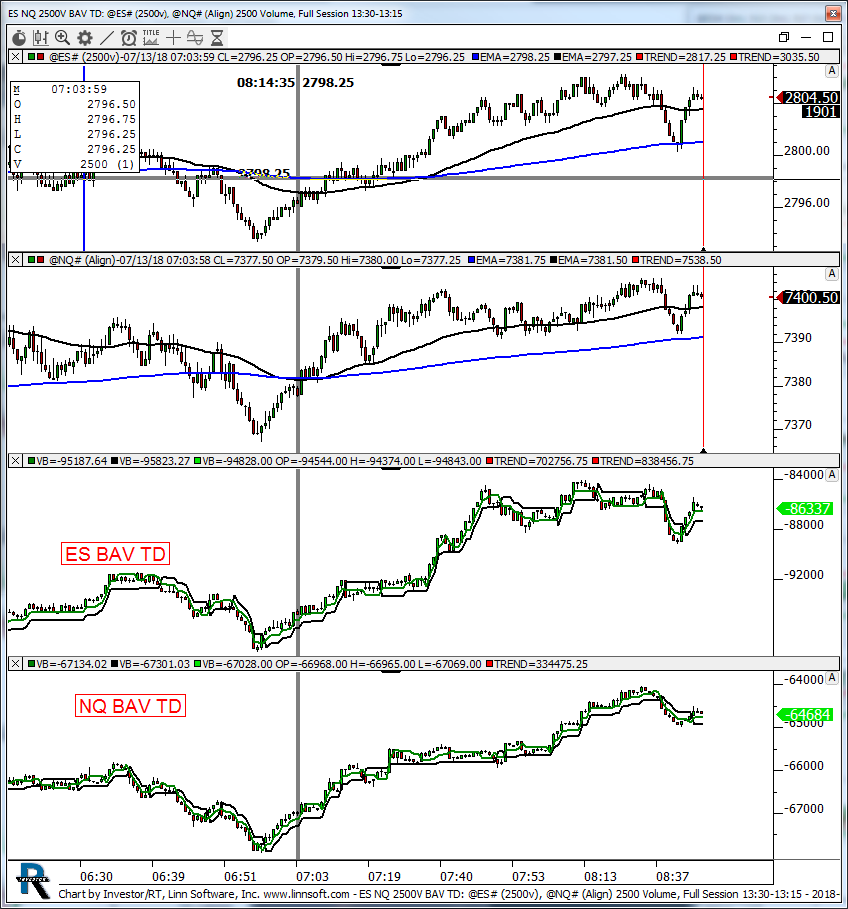 |
ES NQ 2500V BAV TD (@ES#) kencassorla [totalcount]
8 years 2 weeks ago
2500v. This chart was uploaded by Investor/RT 13.3.5 showing symbol: @ES#. |
View |
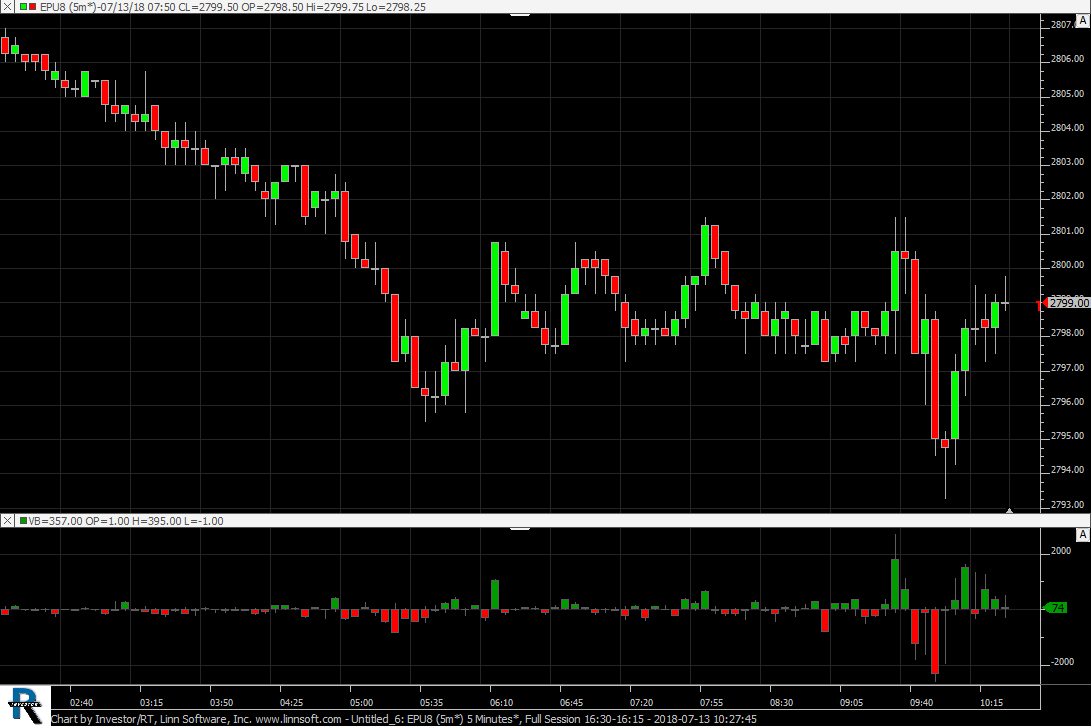 |
Untitled 6 (EPU8) jabartley [totalcount]
8 years 2 weeks ago
This chart was uploaded by Investor/RT 13.3.5 showing symbol: EPU8. |
View |
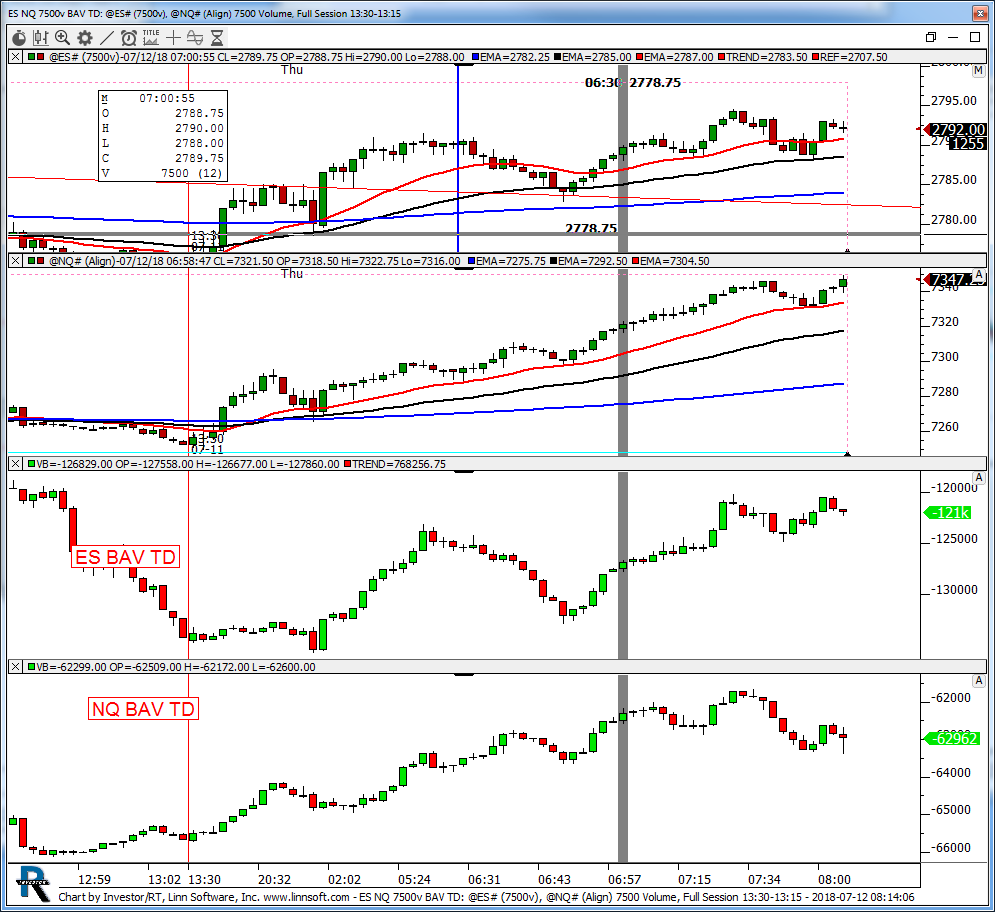 |
ES NQ 7500v BAV TD (@ES#) kencassorla [totalcount]
8 years 2 weeks ago
es/nq 7500v. This chart was uploaded by Investor/RT 13.3.5 showing symbol: @ES#. |
View |
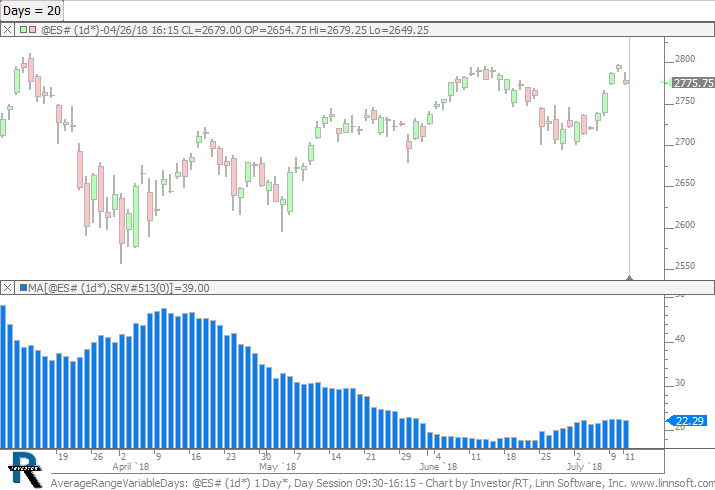 |
AverageRangeVariableDays (@ES#) cpayne [totalcount]
8 years 3 weeks ago
Average Range - Variable Days. This chart was uploaded by Investor/RT 13.5.1 showing symbol: @ES#. |
View |
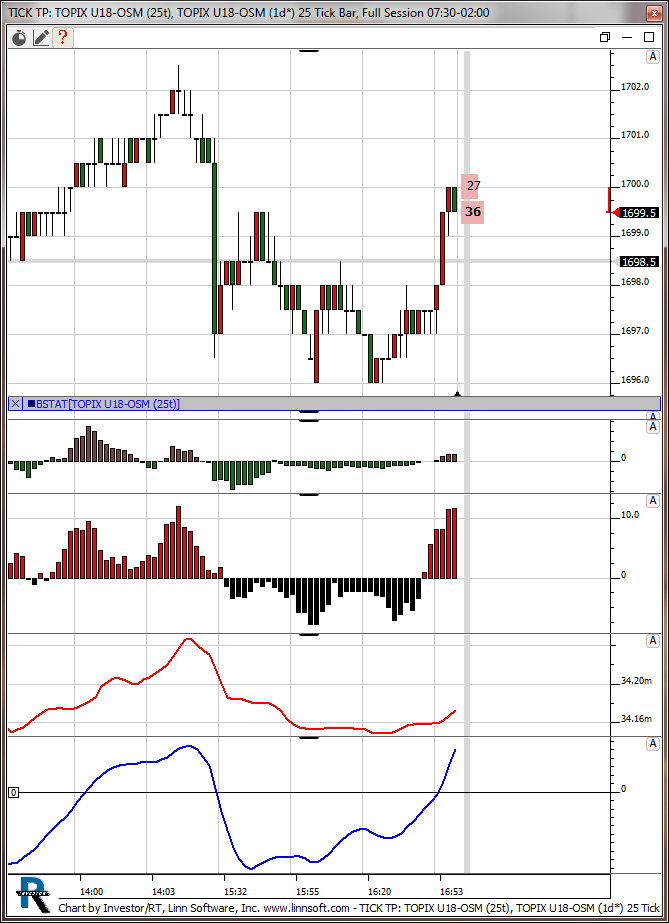 |
TICK TP (TOPIX U18-OSM) Hitoshi Kosaki [totalcount]
8 years 3 weeks ago
This chart was uploaded by Investor/RT 13.3.5 showing symbol: TOPIX U18-OSM. |
View |
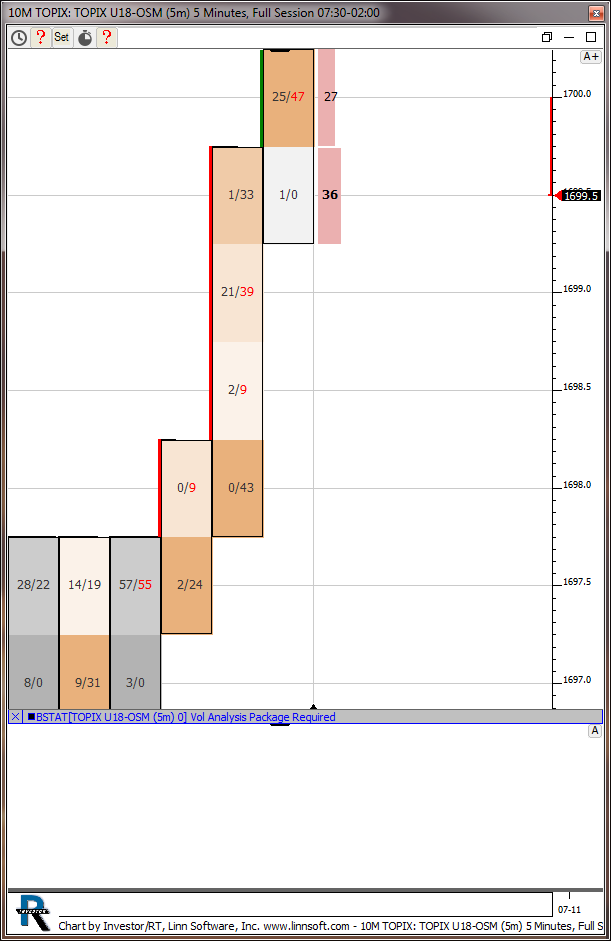 |
10M TOPIX (TOPIX U18-OSM) Hitoshi Kosaki [totalcount]
8 years 3 weeks ago
This chart was uploaded by Investor/RT 13.3.5 showing symbol: TOPIX U18-OSM. |
View |
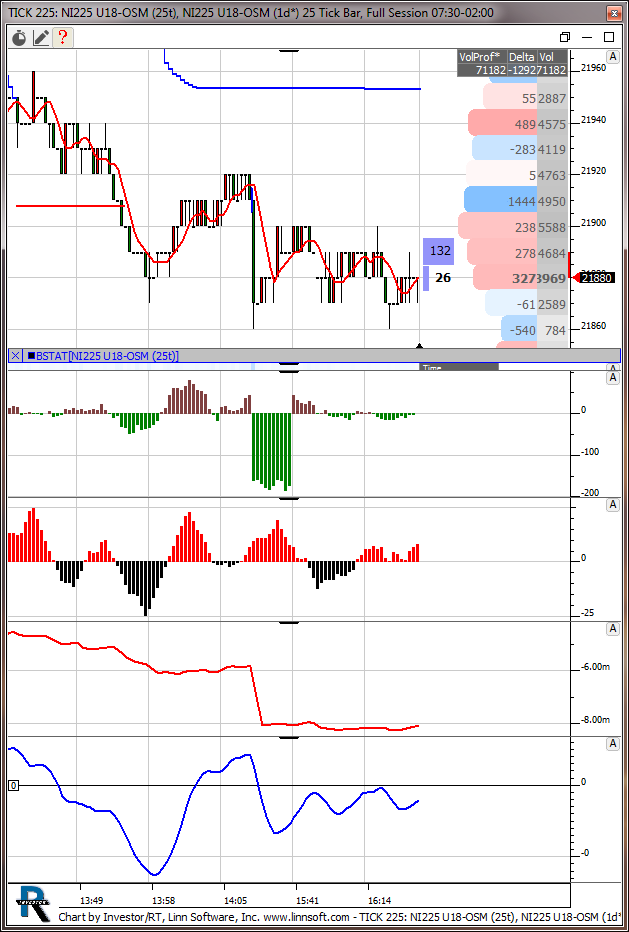 |
TICK 225 (NI225 U18-OSM) Hitoshi Kosaki [totalcount]
8 years 3 weeks ago
This chart was uploaded by Investor/RT 13.3.5 showing symbol: NI225 U18-OSM. |
View |
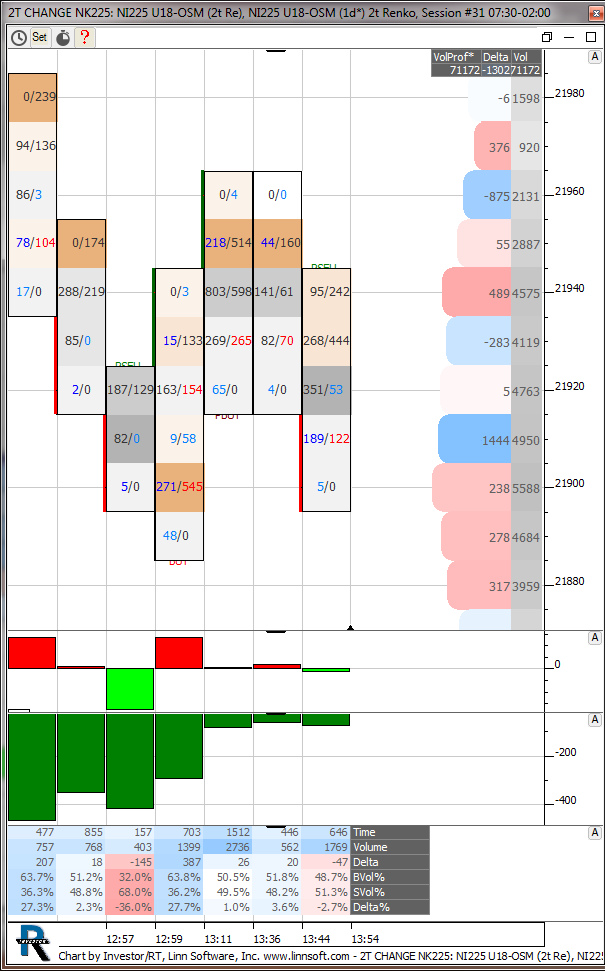 |
2T CHANGE NK225 (NI225 U18-OSM) Hitoshi Kosaki [totalcount]
8 years 3 weeks ago
This chart was uploaded by Investor/RT 13.3.5 showing symbol: NI225 U18-OSM. |
View |
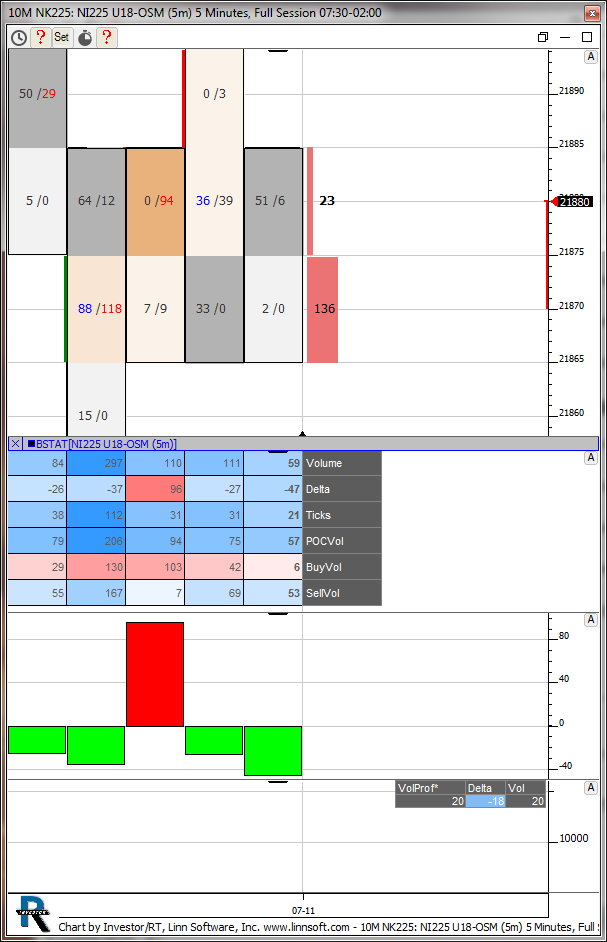 |
10M NK225 (NI225 U18-OSM) Hitoshi Kosaki [totalcount]
8 years 3 weeks ago
This chart was uploaded by Investor/RT 13.3.5 showing symbol: NI225 U18-OSM. |
View |
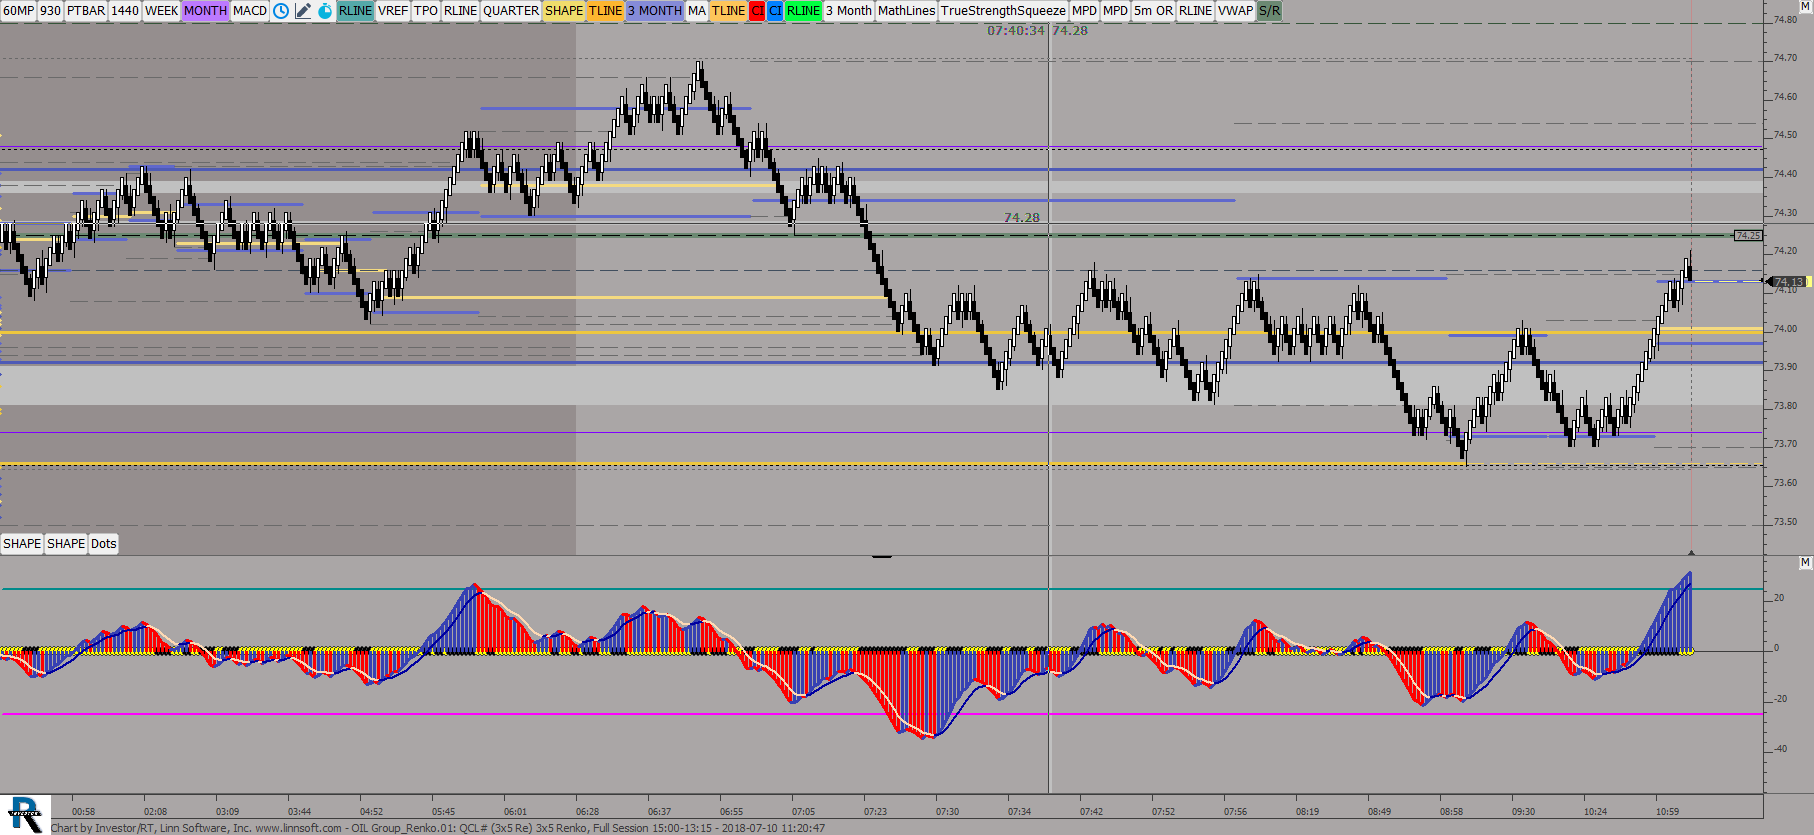 |
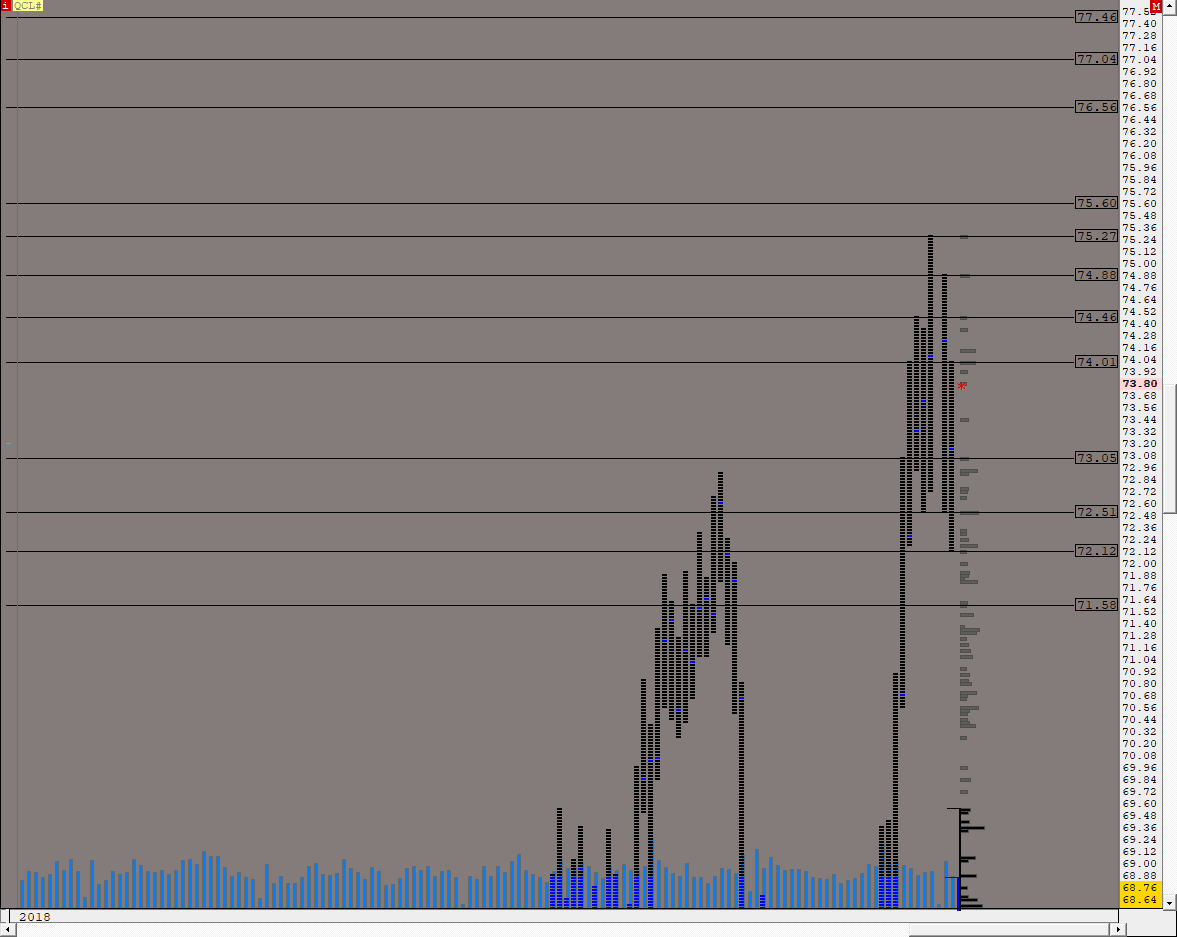
OIL Group Renko (QCL#) ES42 [totalcount]
8 years 3 weeks ago
This chart was uploaded by Investor/RT 13.3.5 showing symbol: QCL#. |
View |
 |
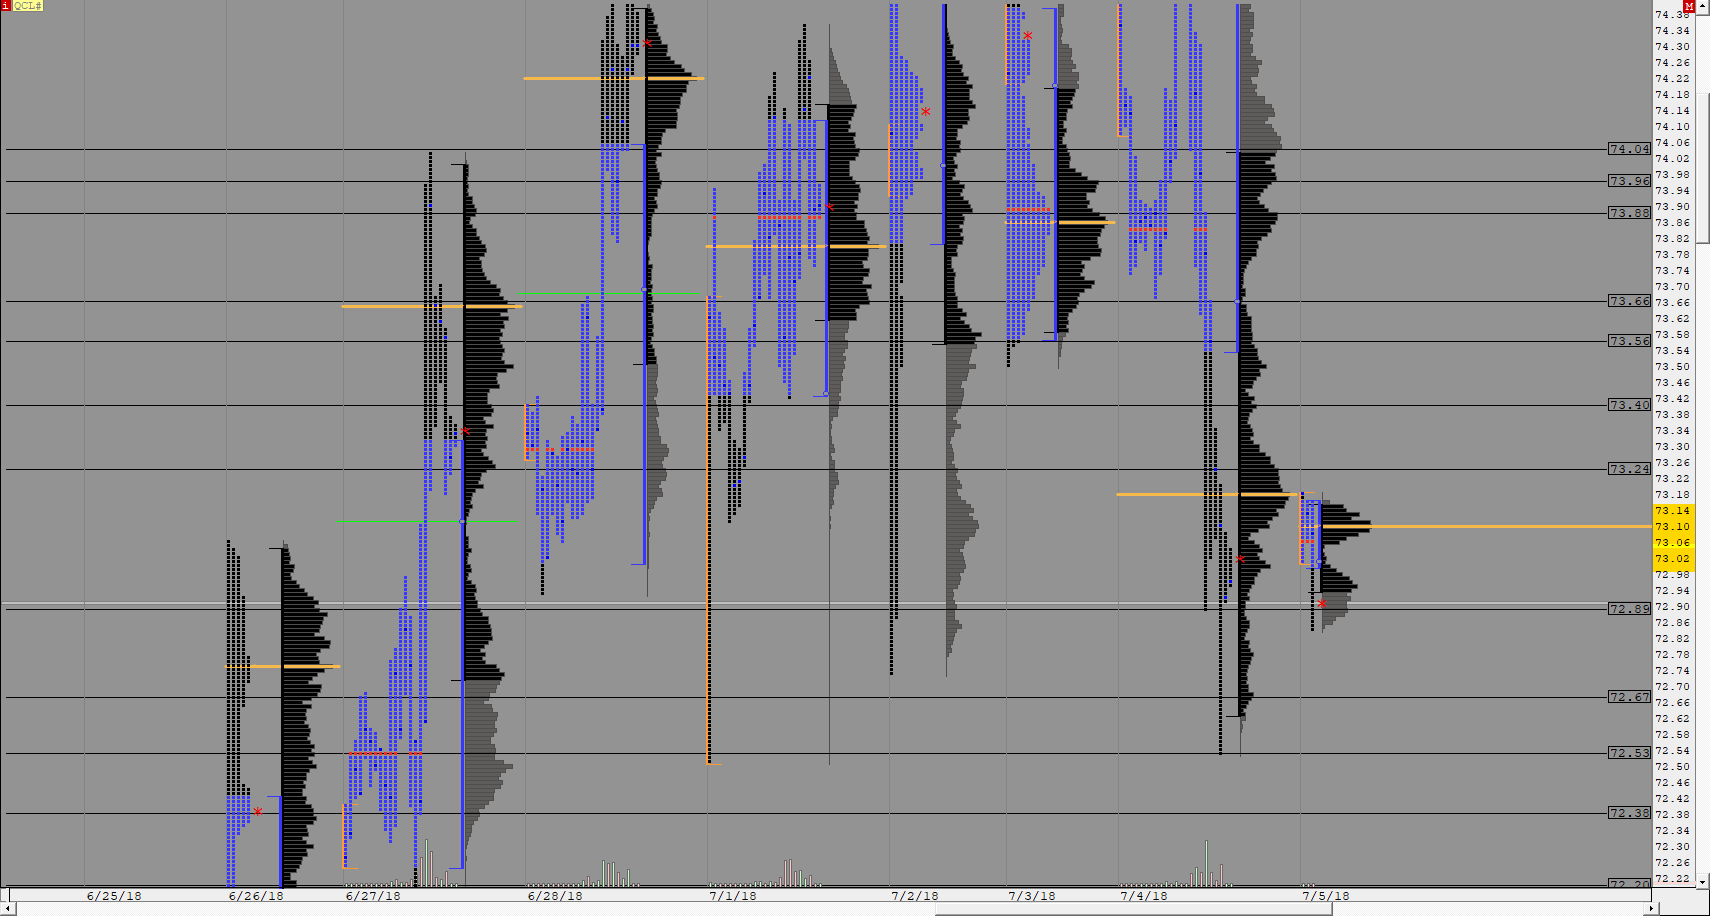
MP CL GLOBEX VALUE DAILY (QCL#) ES42 [totalcount]
8 years 3 weeks ago
This chart was uploaded by Investor/RT 13.3.5 showing symbol: QCL#. |
View |
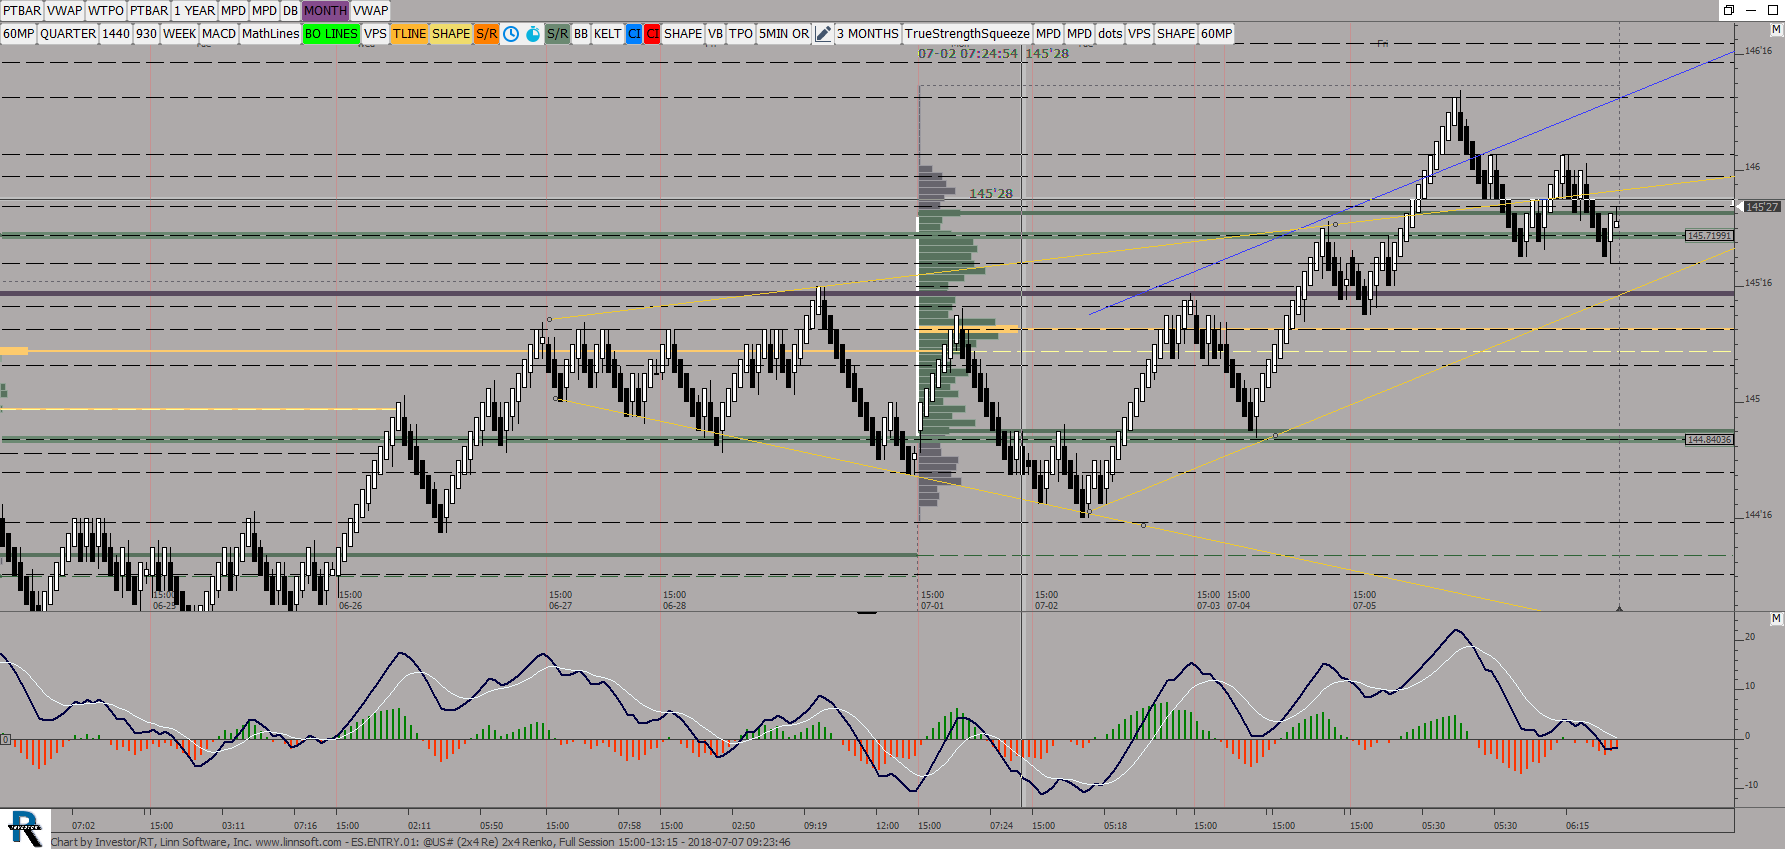 |
ESENTRY (@US#) ES42 [totalcount]
8 years 3 weeks ago
This chart was uploaded by Investor/RT 13.3.5 showing symbol: @US#. |
View |
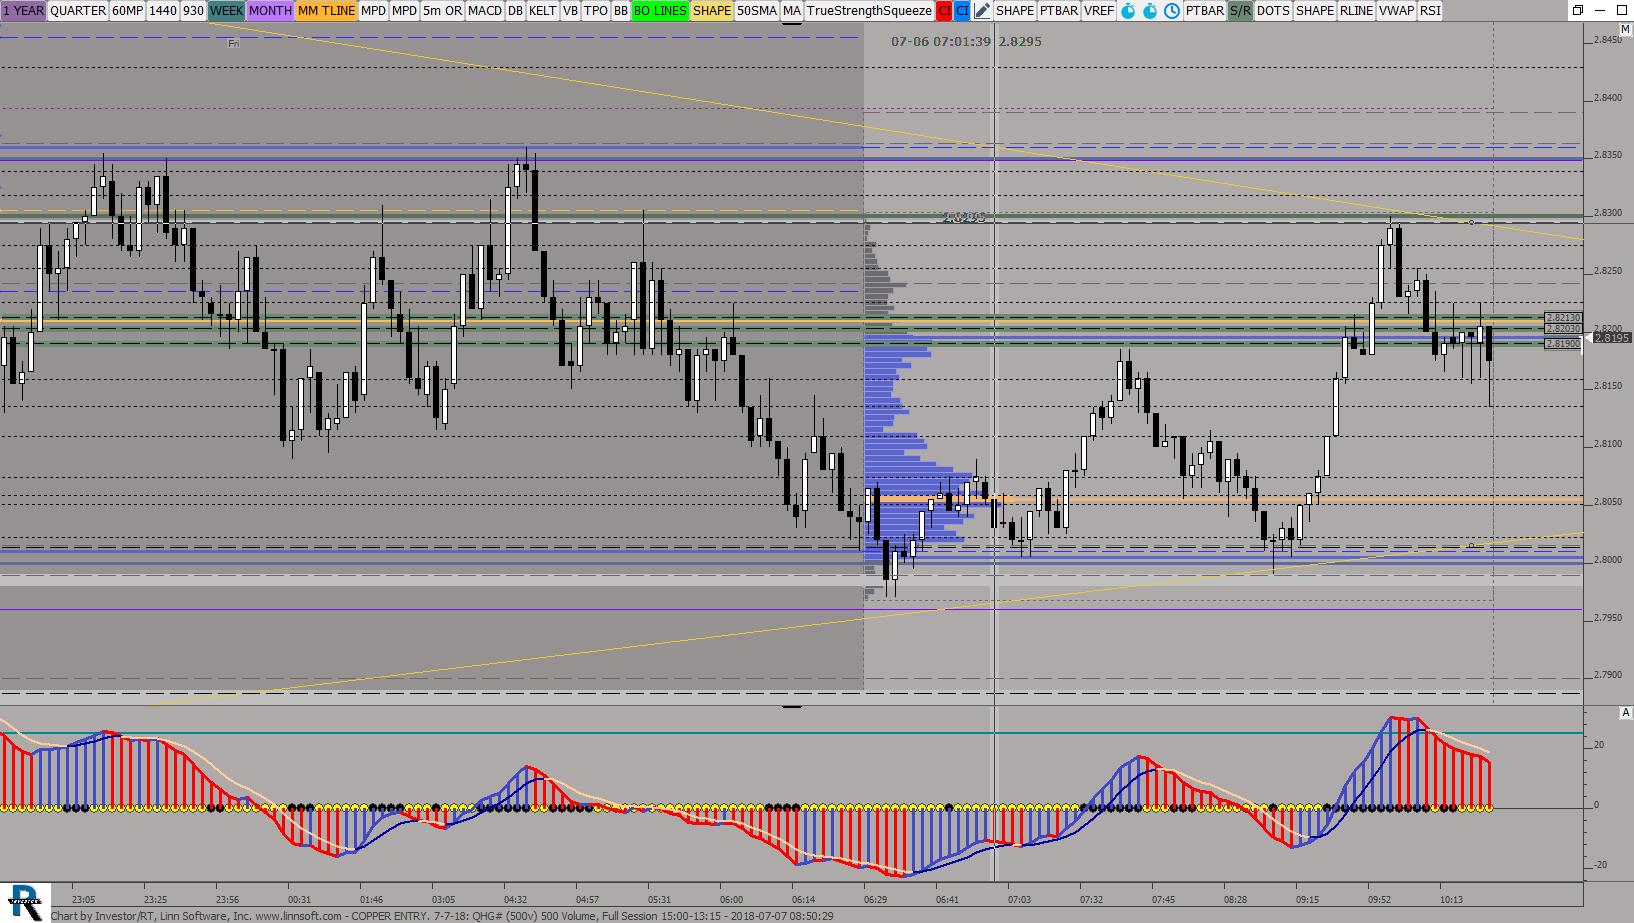 |
COPPER ENTRY 7 7 (QHG#) ES42 [totalcount]
8 years 3 weeks ago
This chart was uploaded by Investor/RT 13.3.5 showing symbol: QHG#. |
View |
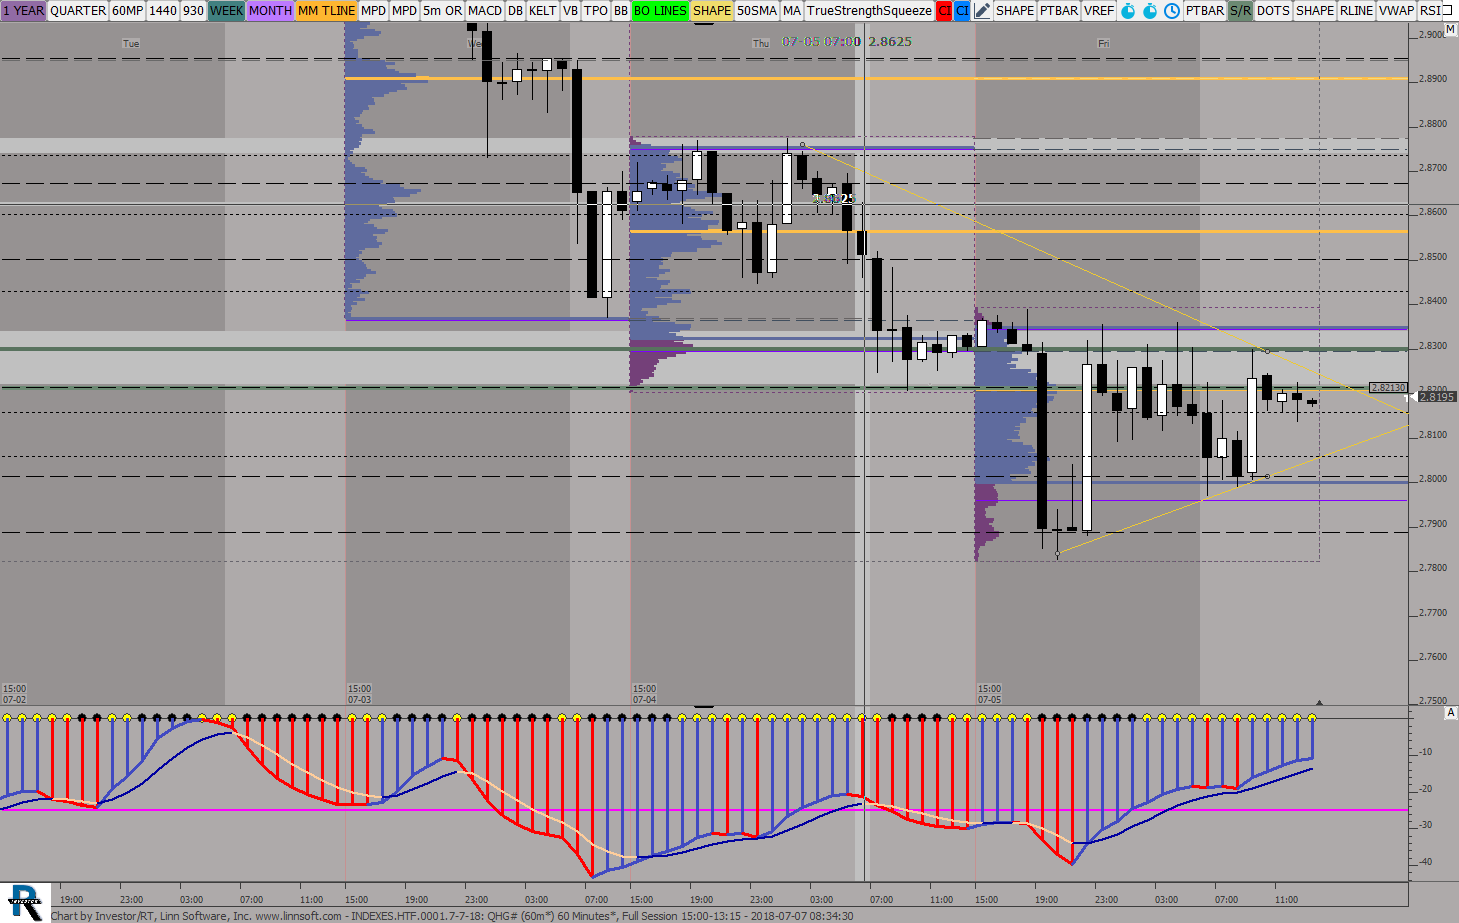 |
INDEXESHTF00017 7 (QHG#) ES42 [totalcount]
8 years 3 weeks ago
This chart was uploaded by Investor/RT 13.3.5 showing symbol: QHG#. |
View |
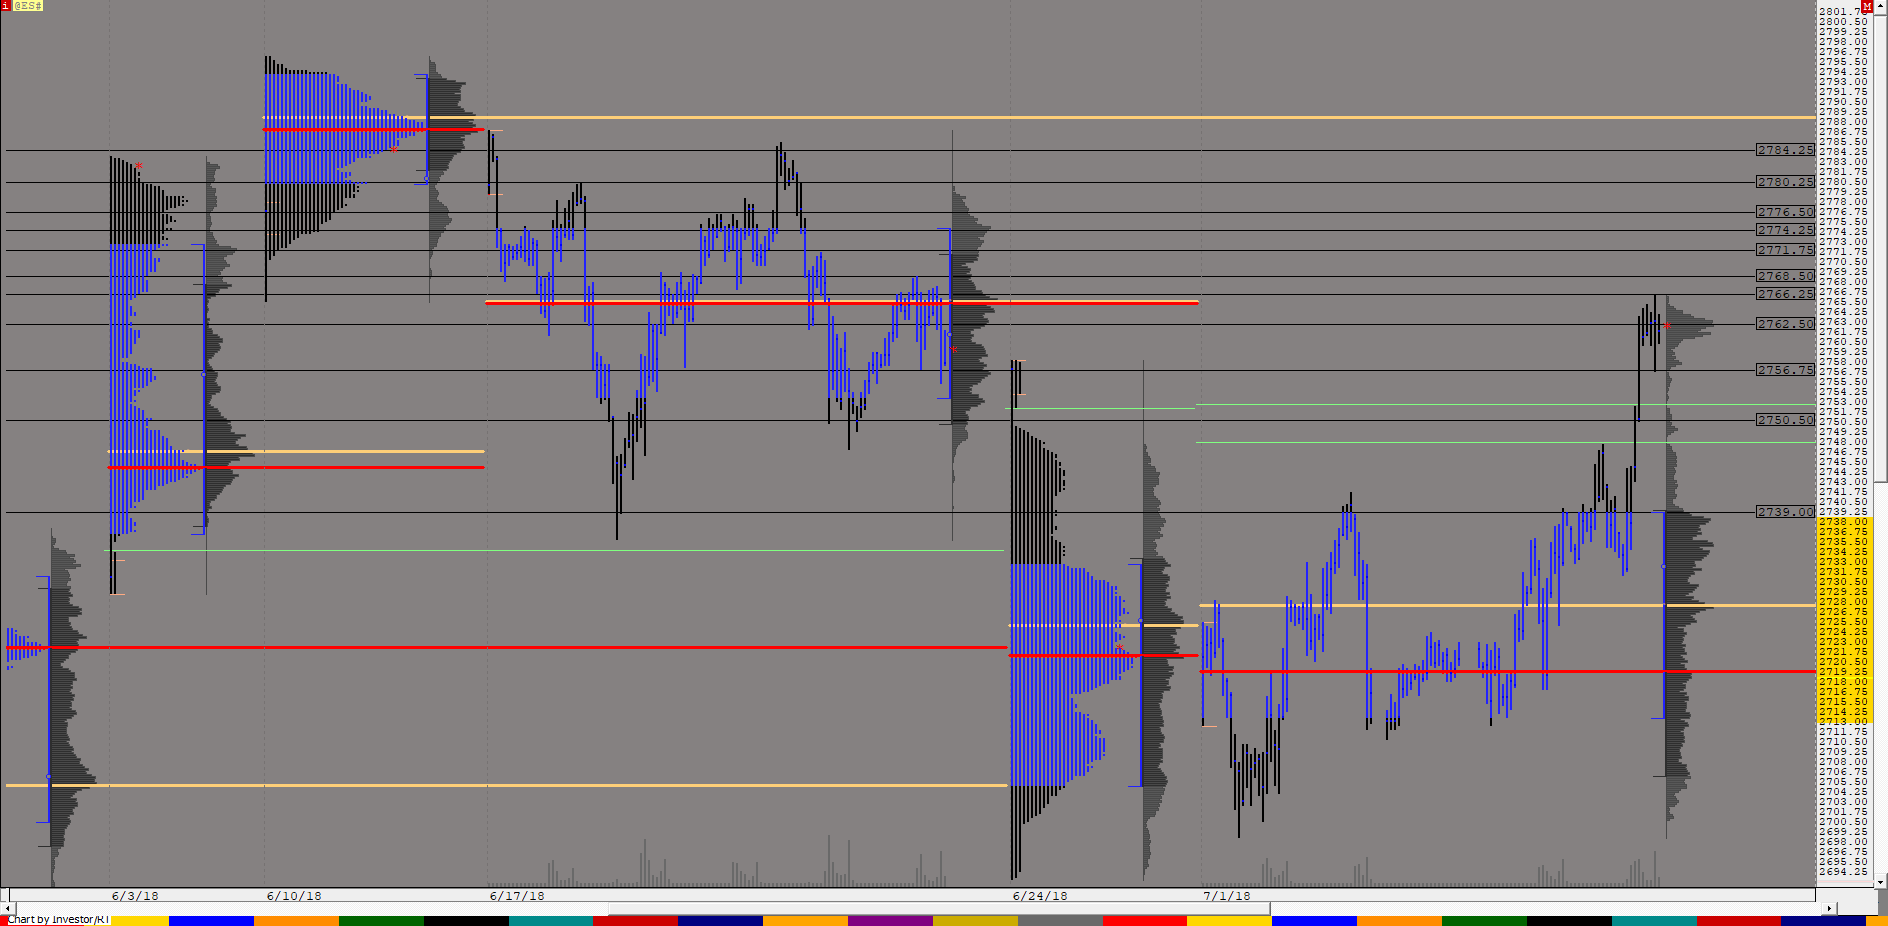 |
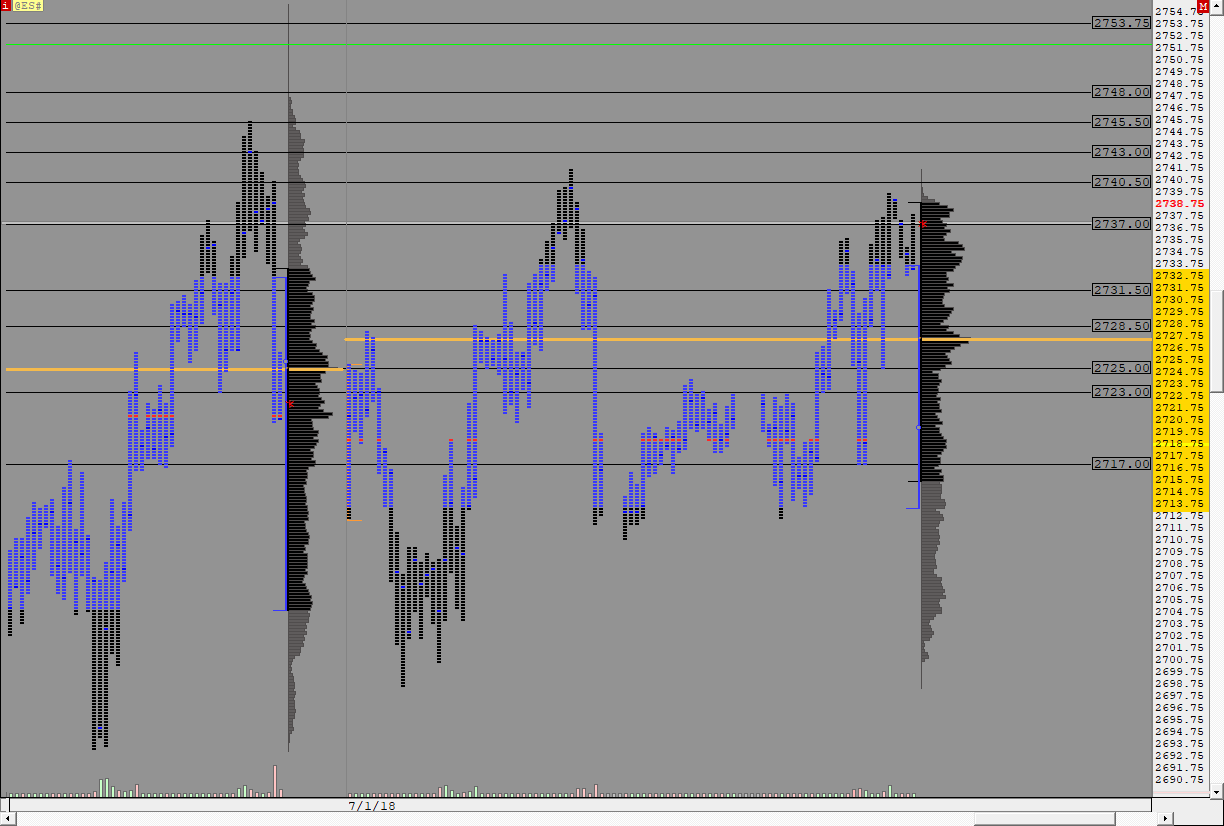
Market ProfileWEEKLYClass (@ES#) ES42 [totalcount]
8 years 3 weeks ago
This chart was uploaded by Investor/RT 13.3.5 showing symbol: @ES#. |
View |
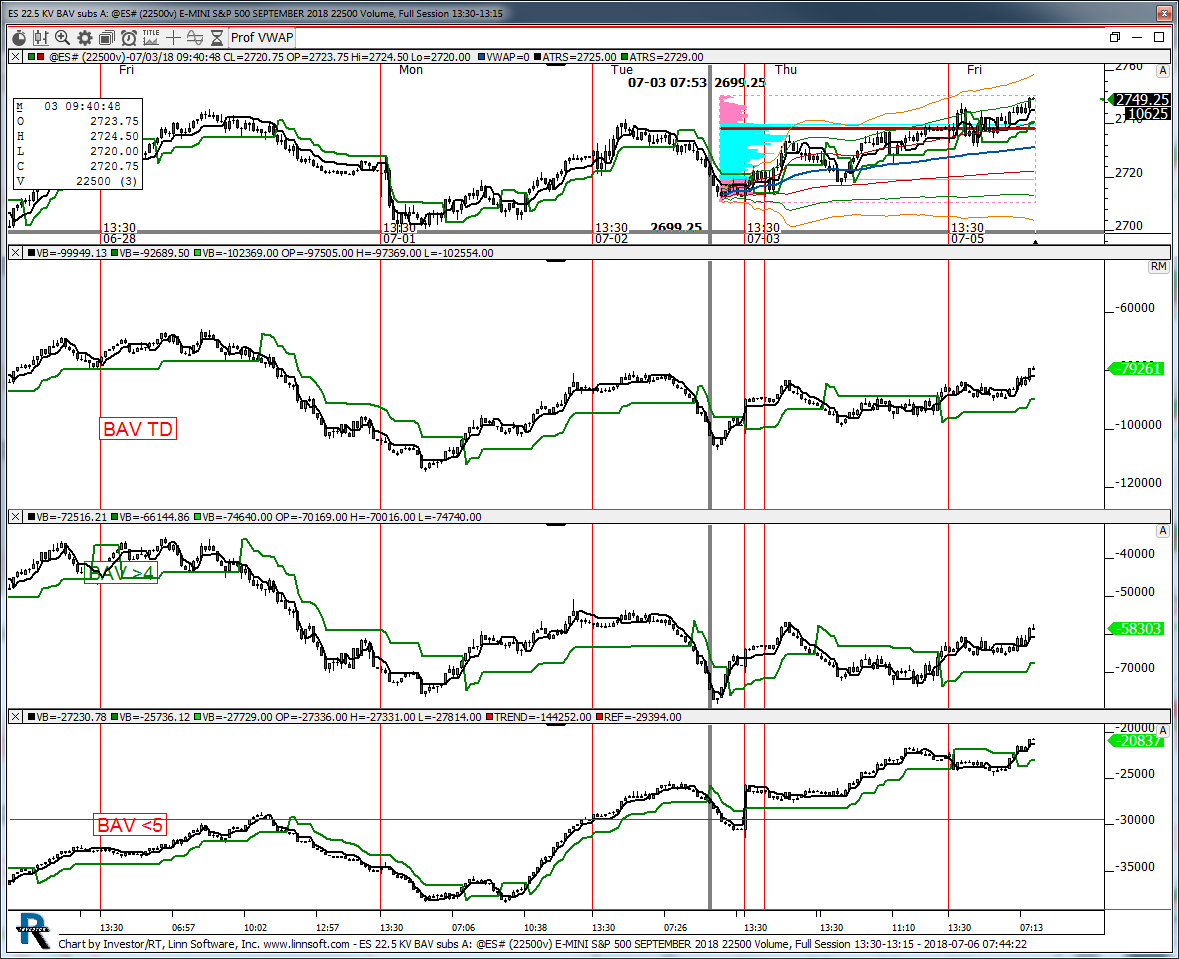 |
ES 225 KV BAV subs A (@ES#) kencassorla [totalcount]
8 years 3 weeks ago
22.5 kv. This chart was uploaded by Investor/RT 13.3.4 showing symbol: @ES#. |
View |
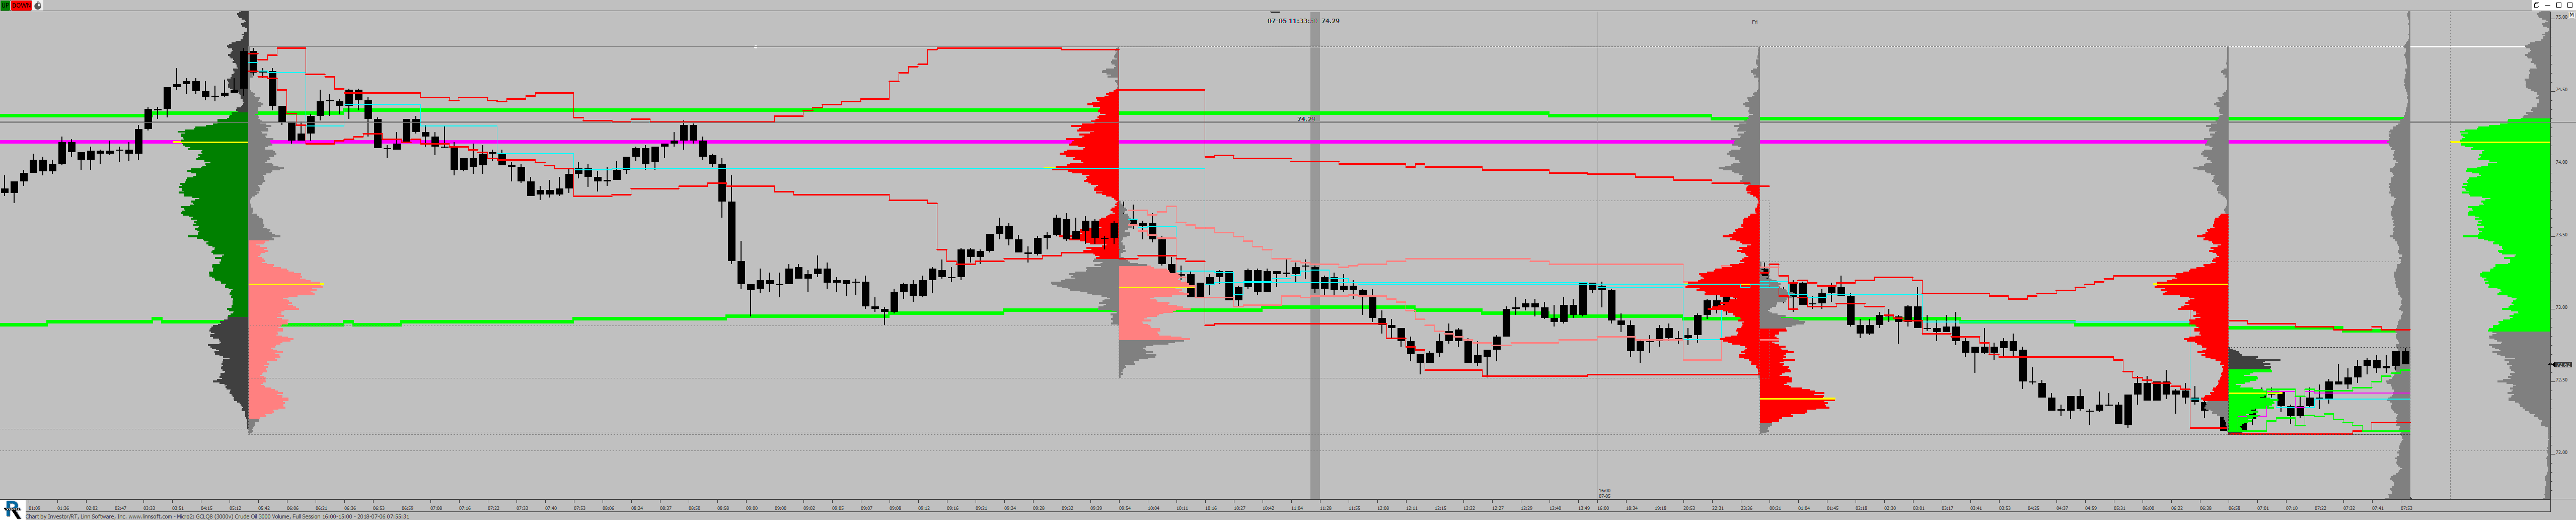 |
Micro2 (GCLQ8) jjpadg [totalcount]
8 years 3 weeks ago
This chart was uploaded by Investor/RT 13.3.5 showing symbol: GCLQ8. |
View |
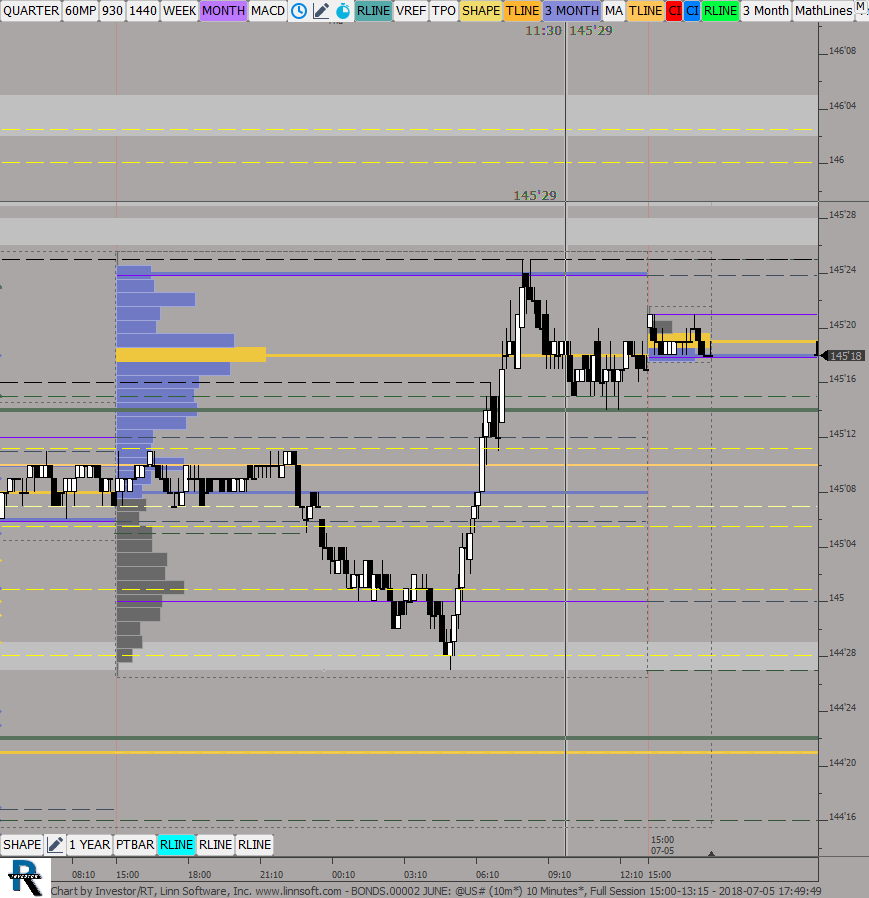 |
BONDS00002 JUNE (@US#) ES42 [totalcount]
8 years 3 weeks ago
This chart was uploaded by Investor/RT 13.3.4 showing symbol: @US#. |
View |
 |
OIL Group01c (QCL#) ES42 [totalcount]
8 years 3 weeks ago
This chart was uploaded by Investor/RT 13.3.5 showing symbol: QCL#. |
View |
 |
ES Group01d (@ES#) ES42 [totalcount]
8 years 3 weeks ago
This chart was uploaded by Investor/RT 13.3.5 showing symbol: @ES#. |
View |
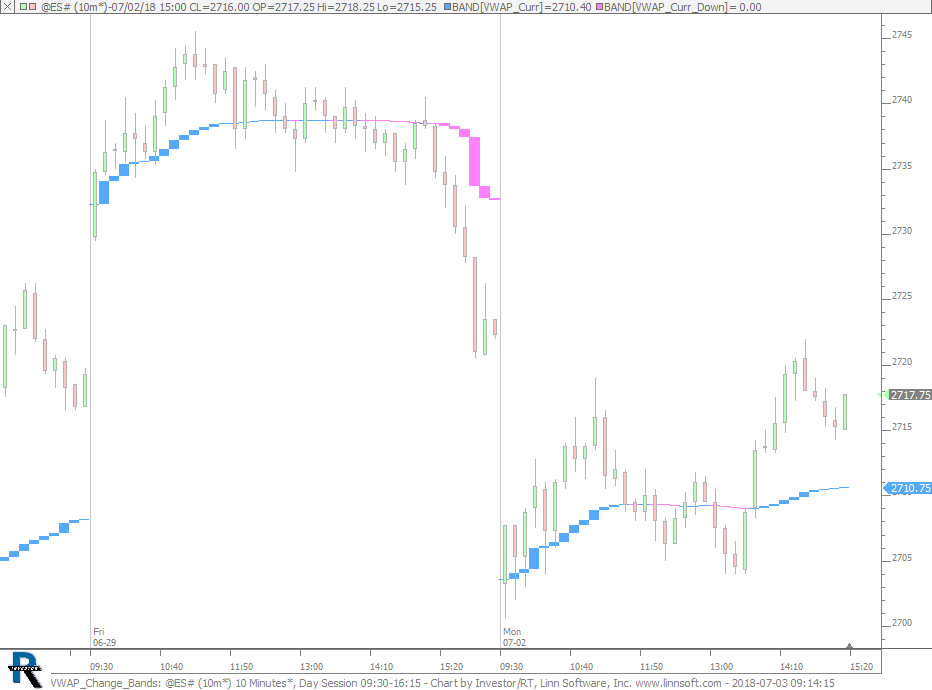 |
VWAP Change Bands (@ES#) cpayne [totalcount]
8 years 4 weeks ago
VWAP Change Bands. This chart was uploaded by Investor/RT 13.3.5 showing symbol: @ES#. |
View |
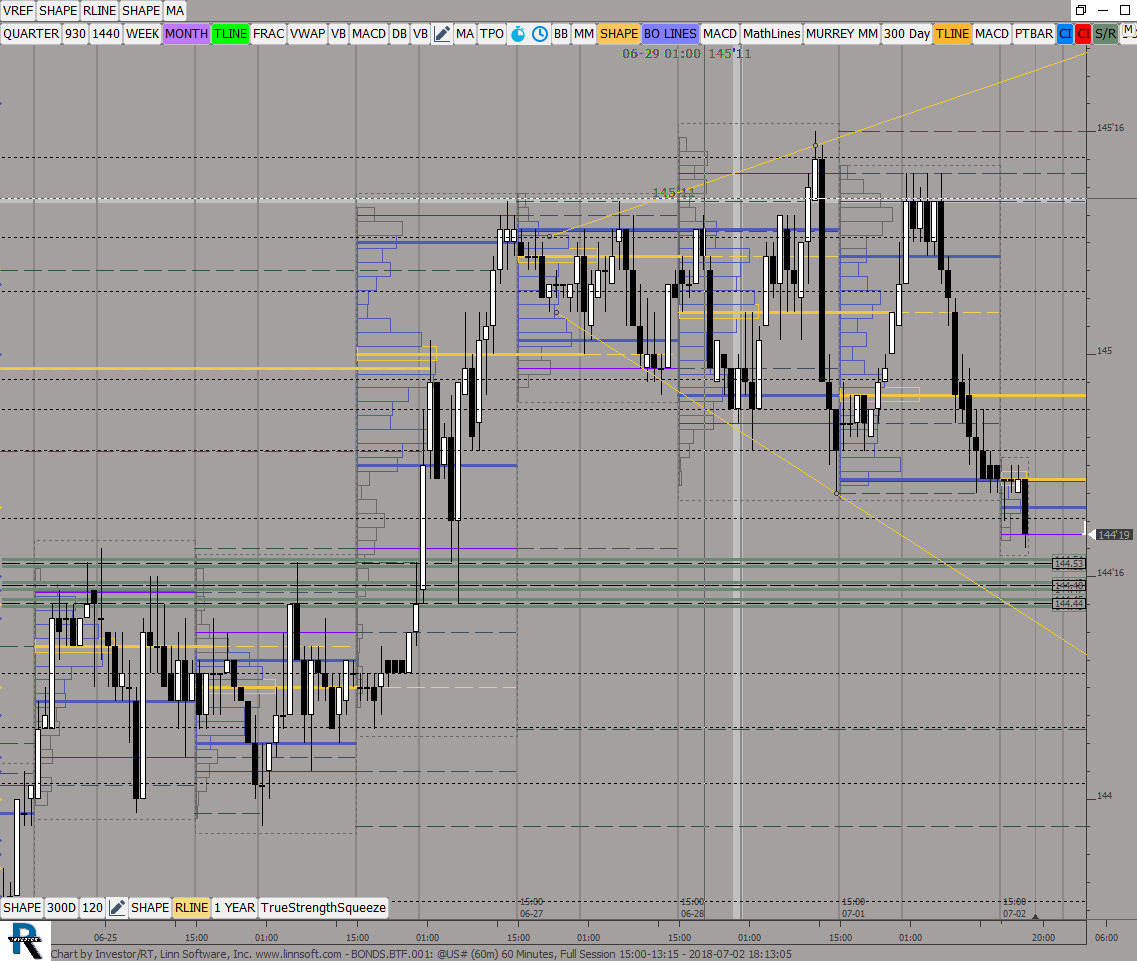 |
BONDSBTF (@US#) ES42 [totalcount]
8 years 1 month ago
This chart was uploaded by Investor/RT 13.3.5 showing symbol: @US#. |
View |
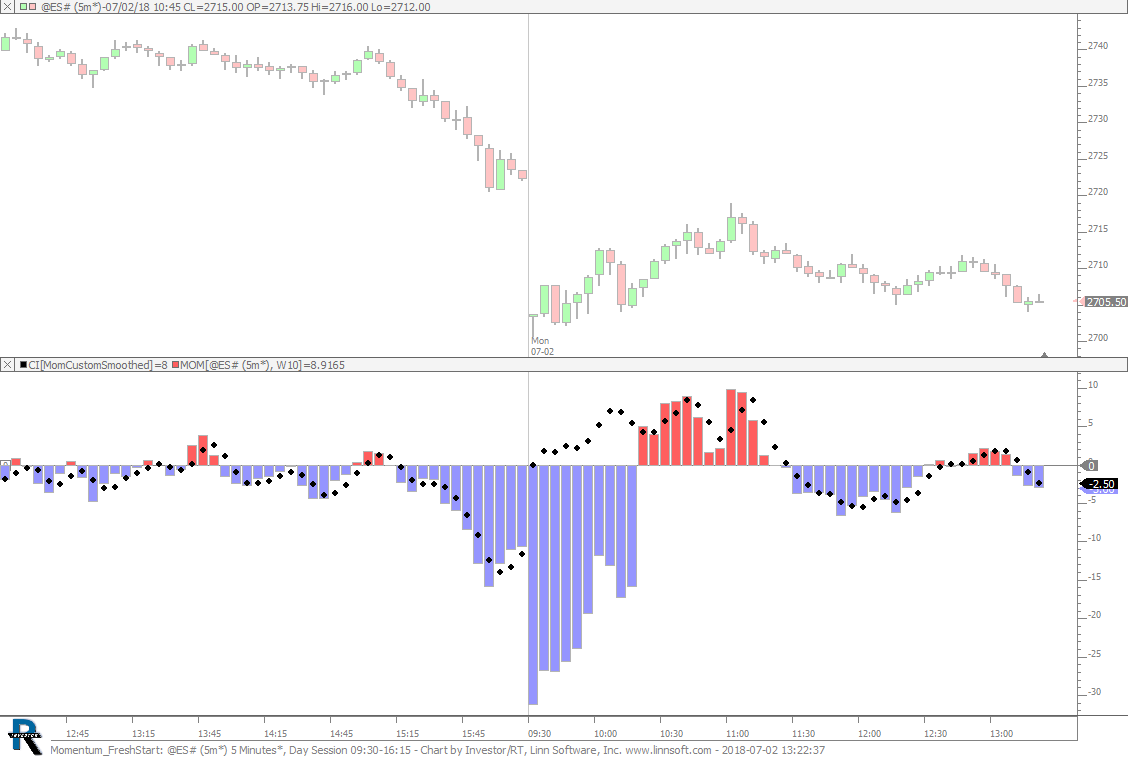 |
Momentum FreshStart (@ES#) cpayne [totalcount]
8 years 1 month ago
Momentum with Fresh Start. This chart was uploaded by Investor/RT 13.3.5 showing symbol: @ES#. |
View |