 |
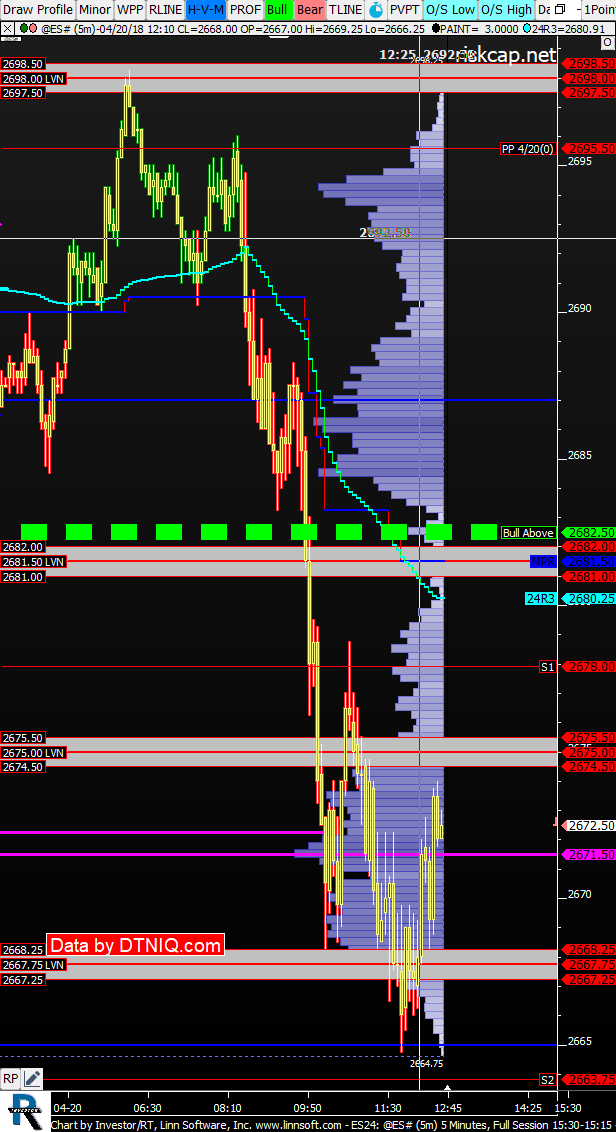
ES24 (@ES#) riskcap [totalcount]
8 years 3 months ago
This chart was uploaded by Investor/RT 13.2.8 showing symbol: @ES#. |
View |
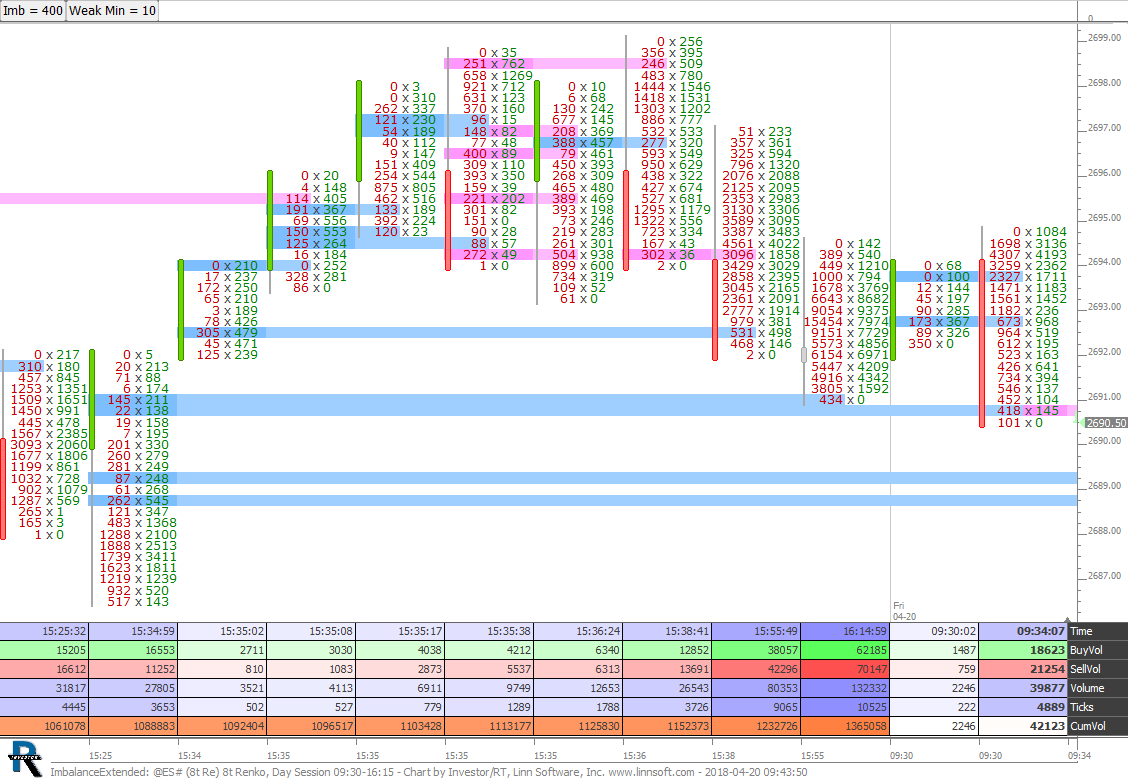 |
ImbalanceExtended (@ES#) cpayne [totalcount]
8 years 3 months ago
This chart was uploaded by Investor/RT 13.2.8 showing symbol: @ES#. |
View |
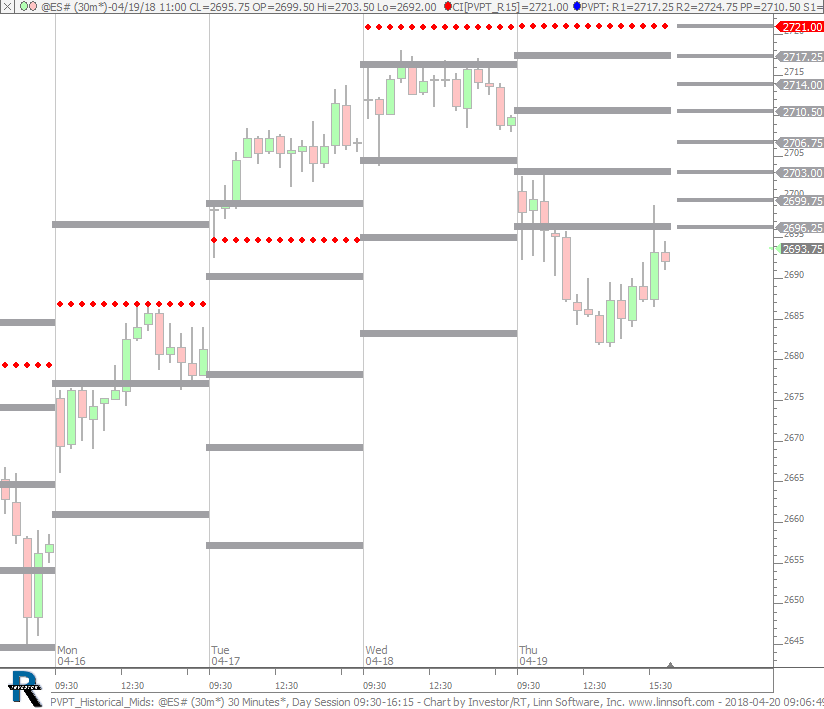 |
PVPT Historical Mids (@ES#) cpayne [totalcount]
8 years 3 months ago
Pivot Point - Historical R 1.5. This chart was uploaded by Investor/RT 13.2.8 showing symbol: @ES#. |
View |
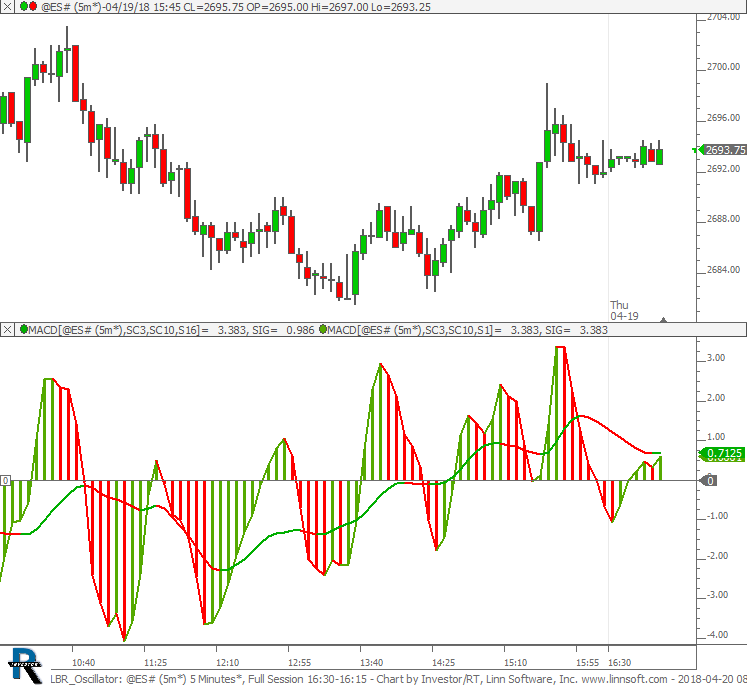 |
LBR Oscillator (@ES#) cpayne [totalcount]
8 years 3 months ago
LBR 3/10 Oscillator - Linda Bradford Rashke Three Ten Oscillator (310). This chart was uploaded by Investor/RT 13.2.8 showing symbol: @ES#. |
View |
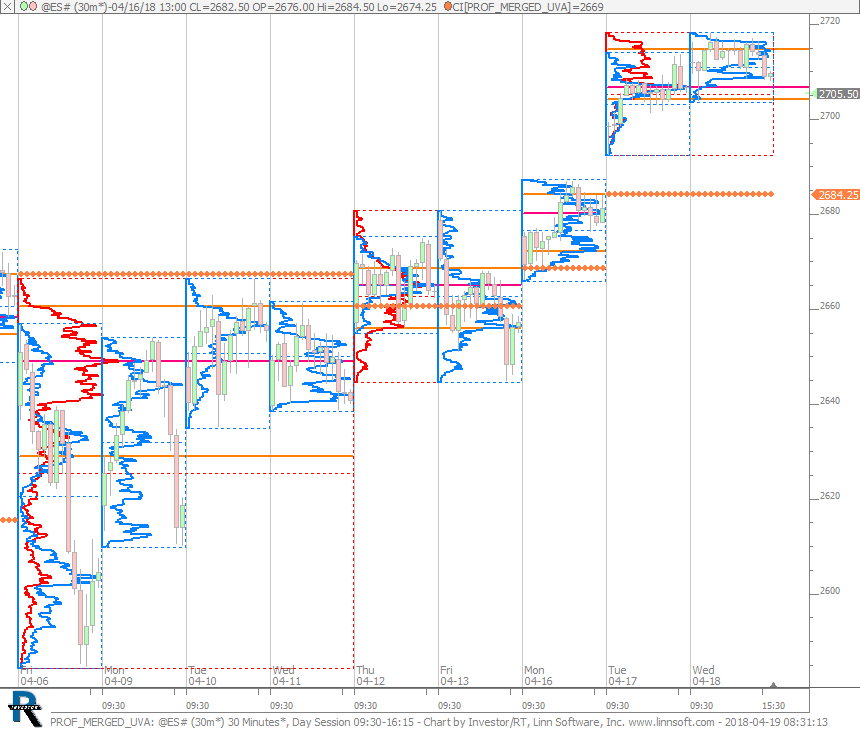 |
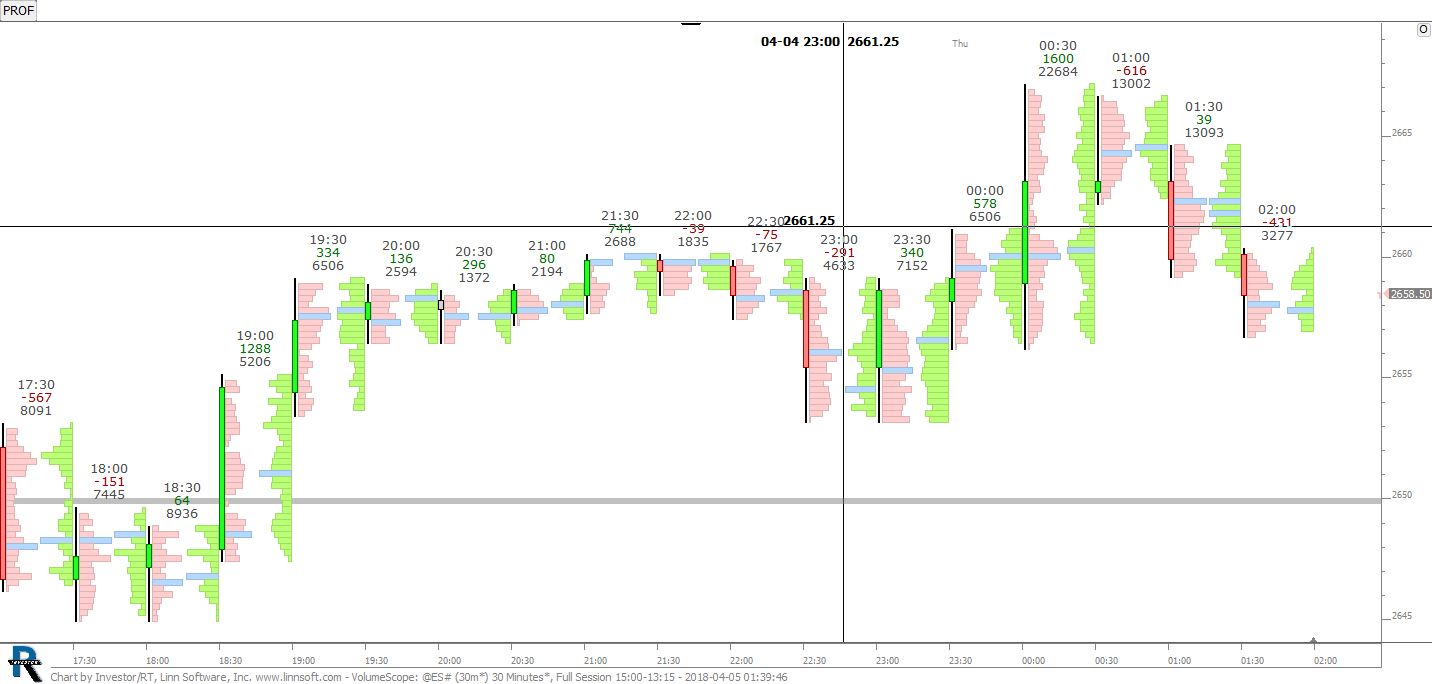
PROF MERGED UVA (@ES#) cpayne [totalcount]
8 years 3 months ago
This chart was uploaded by Investor/RT 13.2.8 showing symbol: @ES#. |
View |
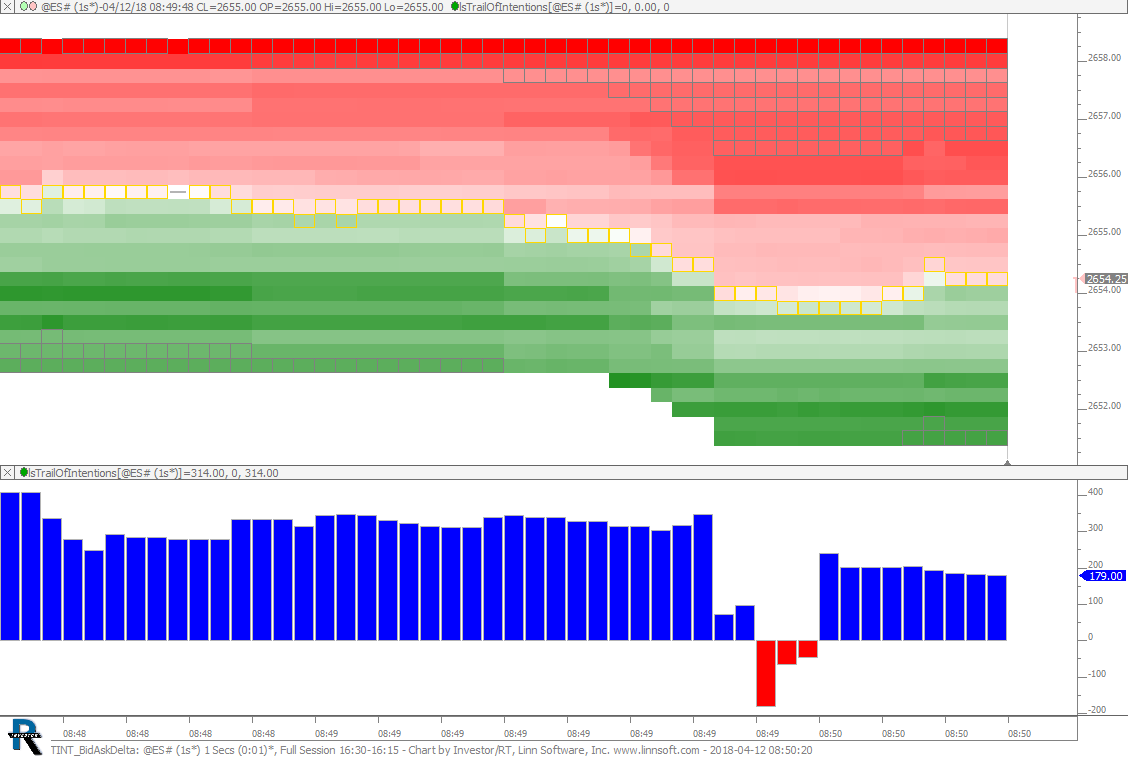 |
TINT BidAskDelta (@ES#) cpayne [totalcount]
8 years 3 months ago
TINT with bid size minus ask size in lower pane. This chart was uploaded by Investor/RT 13.2.8 showing symbol: @ES#. |
View |
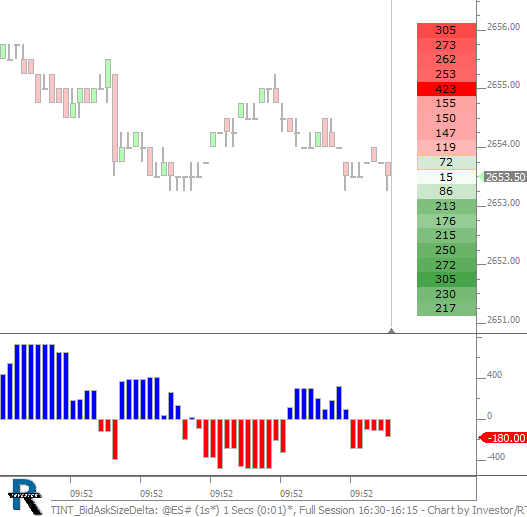 |
TINT BidAskSizeDelta (@ES#) cpayne [totalcount]
8 years 3 months ago
Trail of Intentions. Plotting difference between bid sizes and ask sizes in lower pane. This chart was uploaded by Investor/RT 13.2.7 showing symbol: @ES#. |
View |
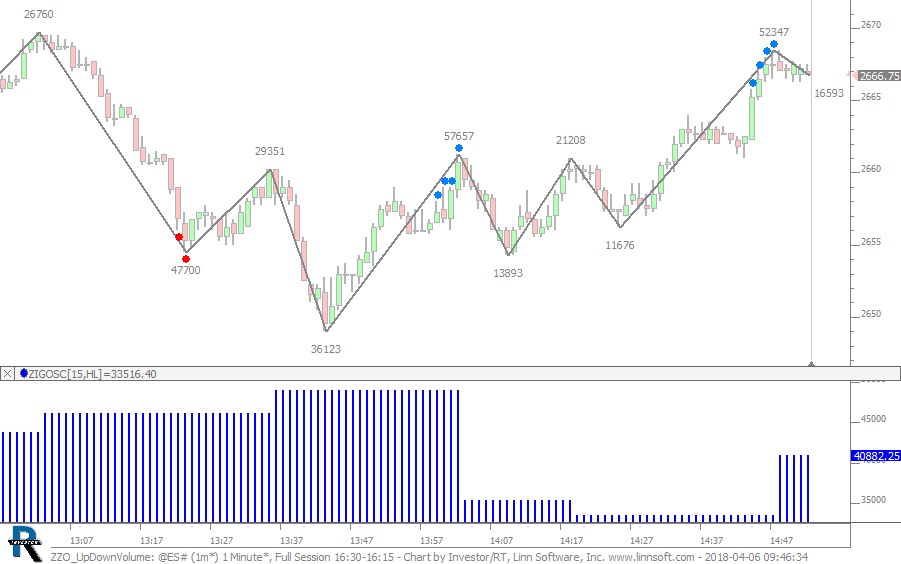 |
ZZO UpDownVolume (@ES#) cpayne [totalcount]
8 years 3 months ago
Big Volume Up Move. This chart was uploaded by Investor/RT 13.2.7 showing symbol: @ES#. |
View |
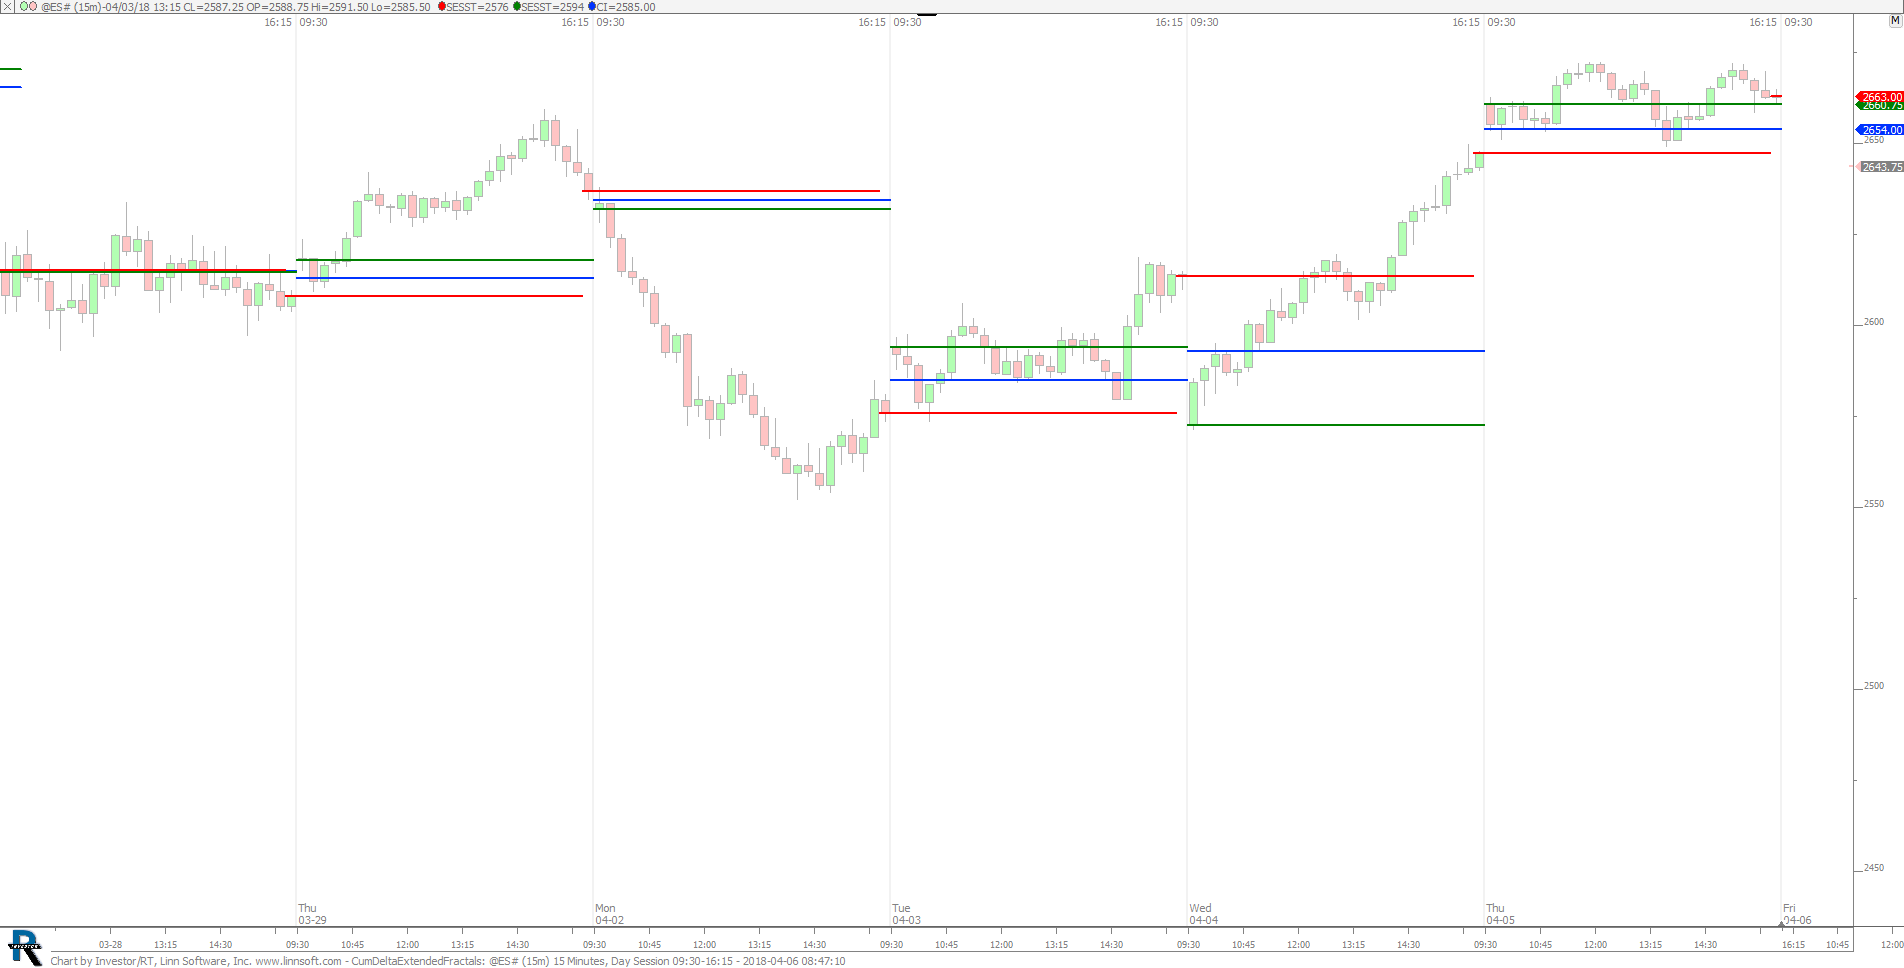 |
CumDeltaExtendedFractals (@ES#) 2 scooke [totalcount]
8 years 3 months ago
This chart was uploaded by Investor/RT 13.2.8 showing symbol: @ES#. |
View |
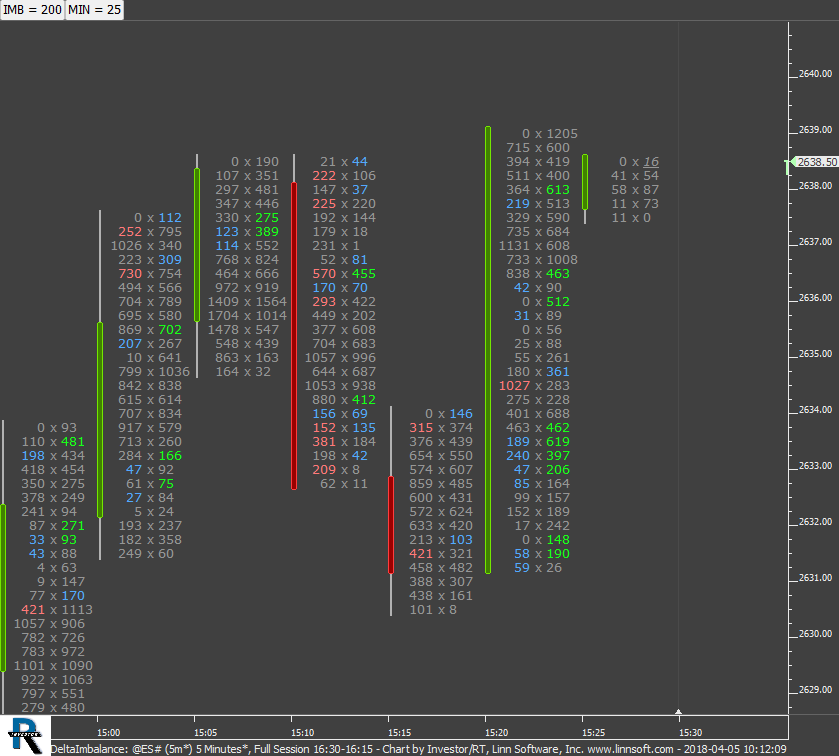 |
DeltaImbalance (@ES#) cpayne [totalcount]
8 years 3 months ago
Delta Imbalance - Use Buttons To Control IMB percent and MIN weak side volume. This chart was uploaded by Investor/RT 13.2.7 showing symbol: @ES#. |
View |
 |
VolumeScope (@ES#) 2 ES42 [totalcount]
8 years 3 months ago
This chart was uploaded by Investor/RT 13.2.8 showing symbol: @ES#. |
View |
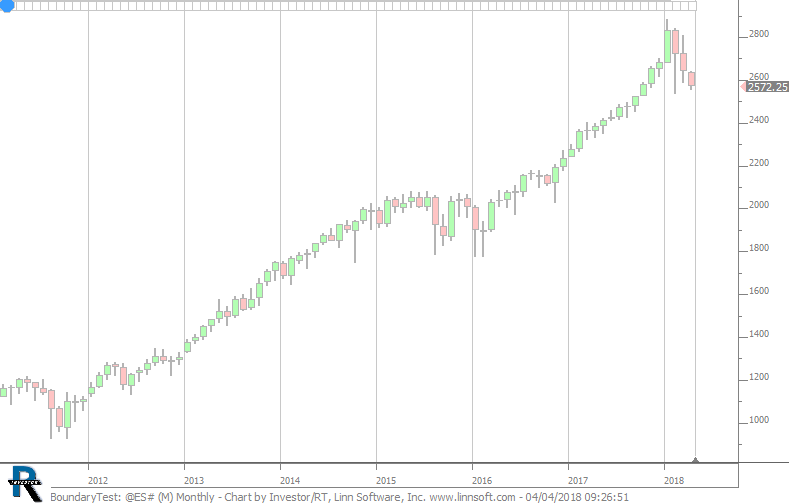 |
BoundaryTest (@ES#) cpayne [totalcount]
8 years 3 months ago
Boundaries Testing. This chart was uploaded by Investor/RT 13.2.7 showing symbol: @ES#. |
View |
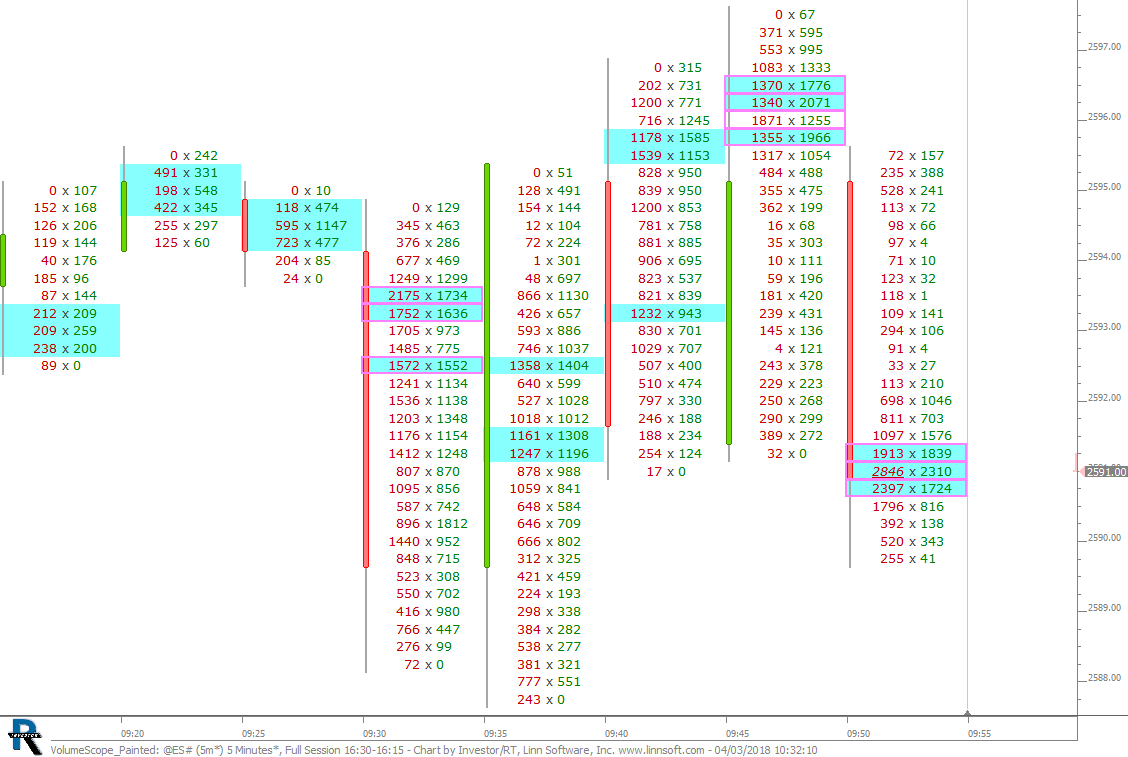 |
VolumeScope Painted (@ES#) cpayne [totalcount]
8 years 4 months ago
Highest 3 volume prices painted blue. Volume above 3000 highlighted in pink. This chart was uploaded by Investor/RT 13.2.7 showing symbol: @ES#. |
View |
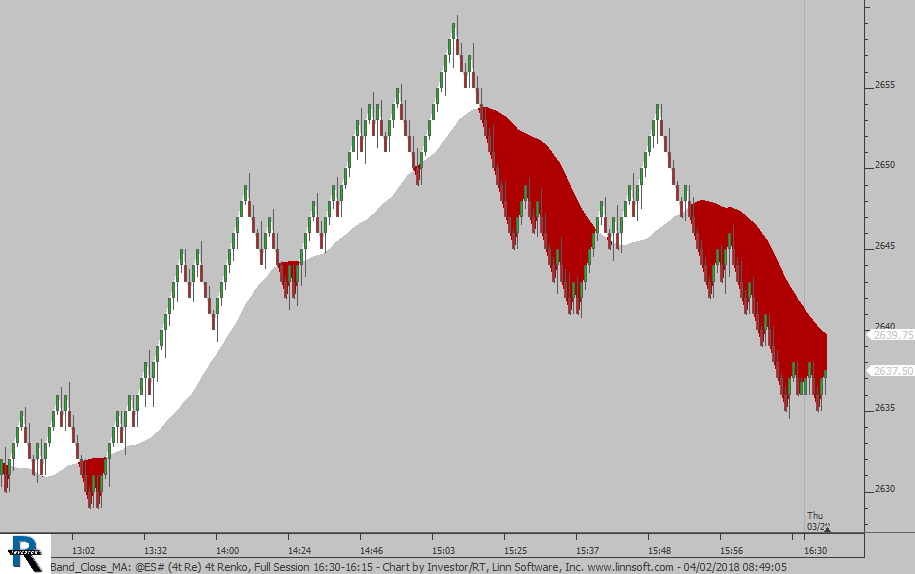 |
Band Close MA (@ES#) cpayne [totalcount]
8 years 4 months ago
Band between close and moving average. This chart was uploaded by Investor/RT 13.2.7 showing symbol: @ES#. |
View |
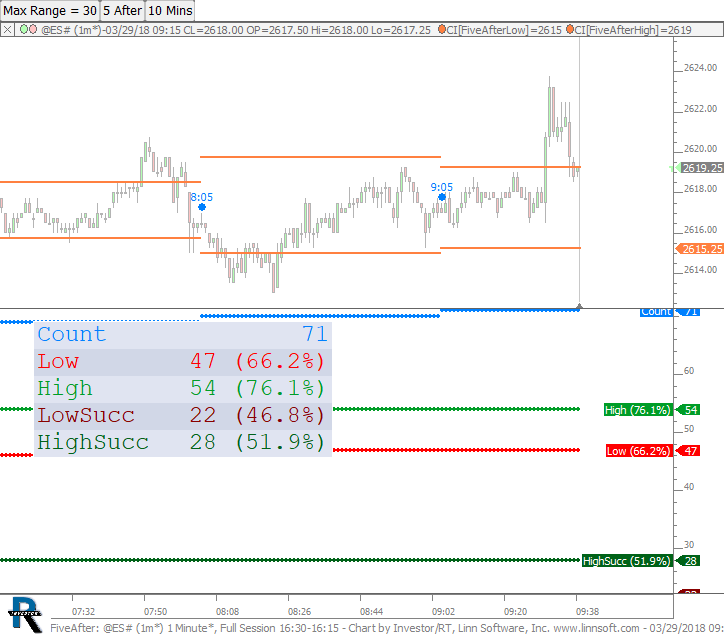 |
FiveAfter (@ES#) cpayne [totalcount]
8 years 4 months ago
IB every hour. This chart was uploaded by Investor/RT 13.2.7 showing symbol: @ES#. |
View |
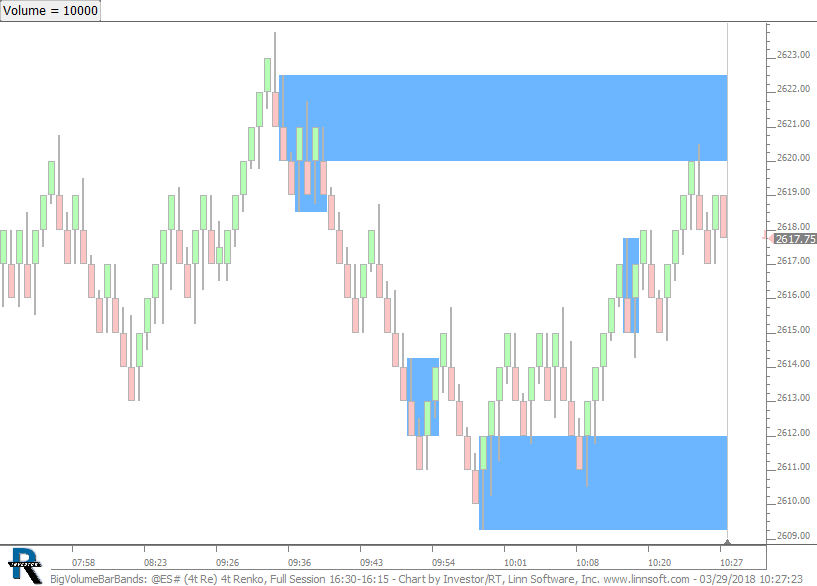 |
BigVolumeBarBands (@ES#) cpayne [totalcount]
8 years 4 months ago
Extends the range of high volume bars until filled. Volume level is dictated by button at top. This chart was uploaded by Investor/RT 13.2.7 showing symbol: @ES#. |
View |
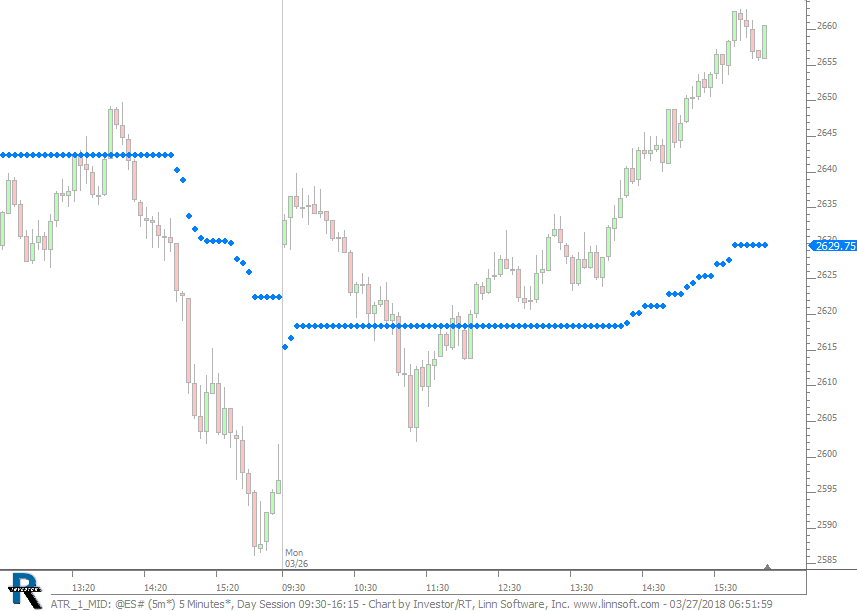 |
ATR 1 MID (@ES#) cpayne [totalcount]
8 years 4 months ago
ATR Midpoint - 1 Day Lookback. This chart was uploaded by Investor/RT 13.2.7 showing symbol: @ES#. |
View |
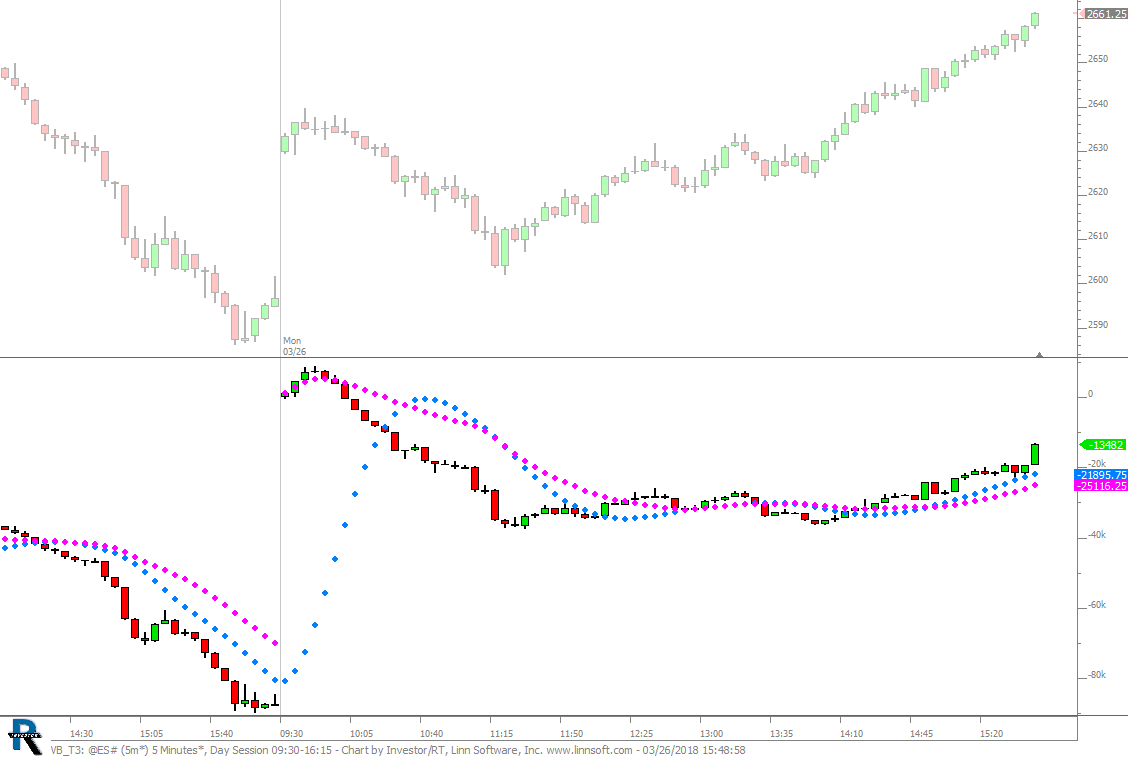 |
VB T3 (@ES#) cpayne [totalcount]
8 years 4 months ago
This chart was uploaded by Investor/RT 13.2.7 showing symbol: @ES#. |
View |
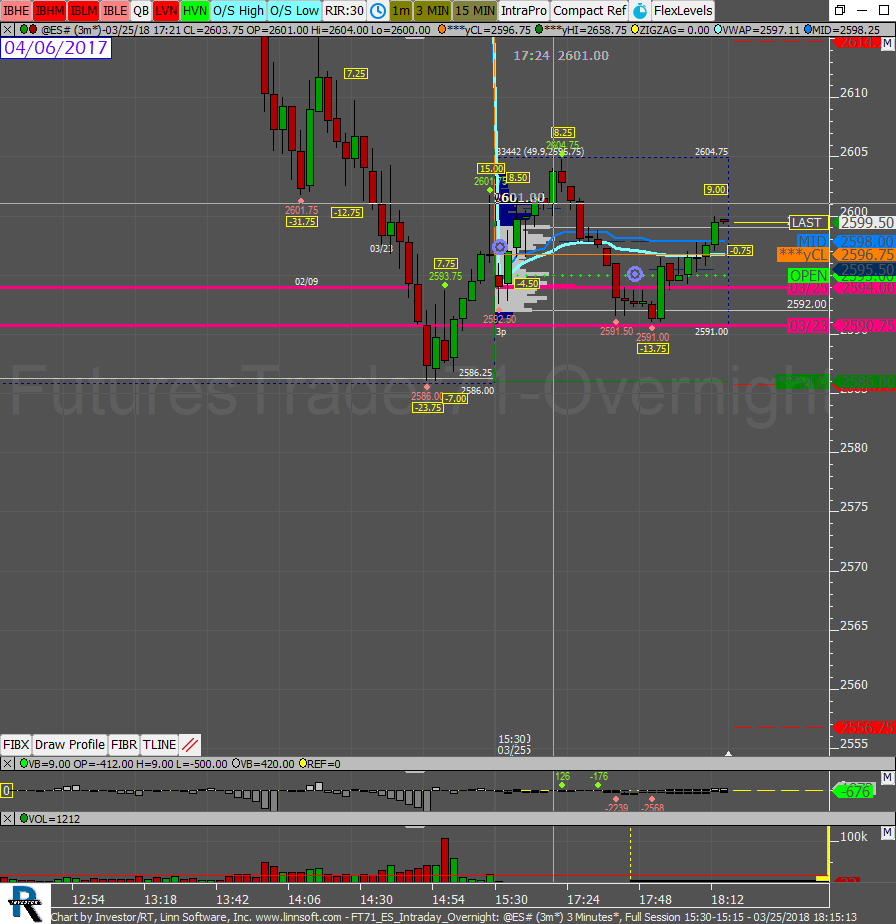 |
FT71 ES Intraday Overnight (@ES#) 2 oyvegh [totalcount]
8 years 4 months ago
why am I getting markers when using Trade Notes. The prices do not correspond to my notes. Is Trade Notes only useful for buys and sells, which I made none. |
View |
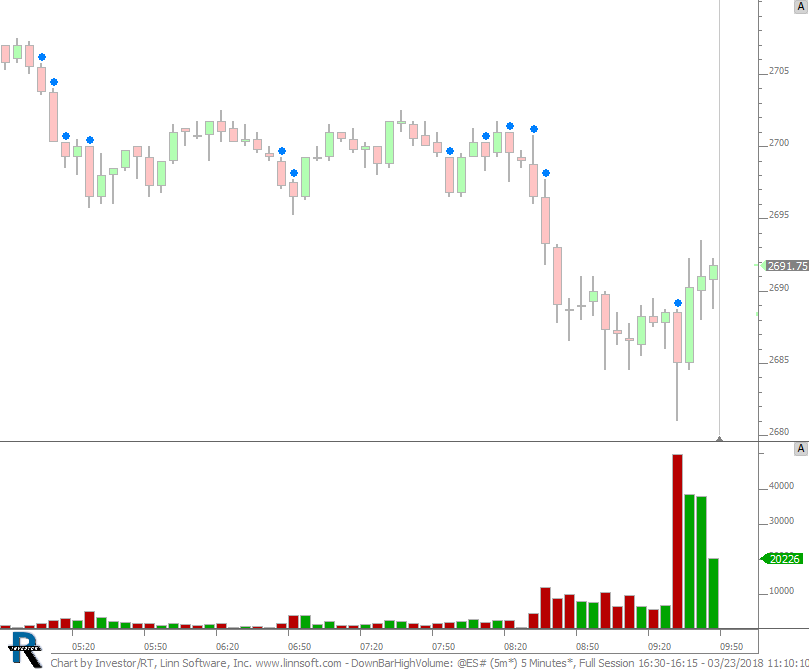 |
DownBarHighVolume (@ES#) cpayne [totalcount]
8 years 4 months ago
Identifies Down Bars whose volume is greater than the volume of the previous 5 down bars. This chart was uploaded by Investor/RT 13.2.7 showing symbol: @ES#. |
View |
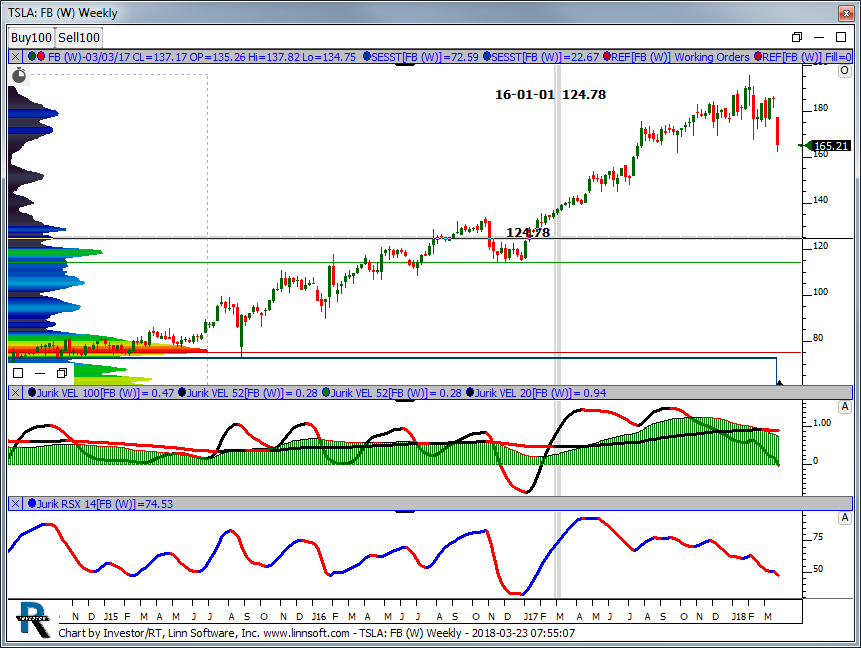 |
TSLA (FB) justin-detray [totalcount]
8 years 4 months ago
FB Weekly. This chart was uploaded by Investor/RT 13.2.6 showing symbol: FB. |
View |
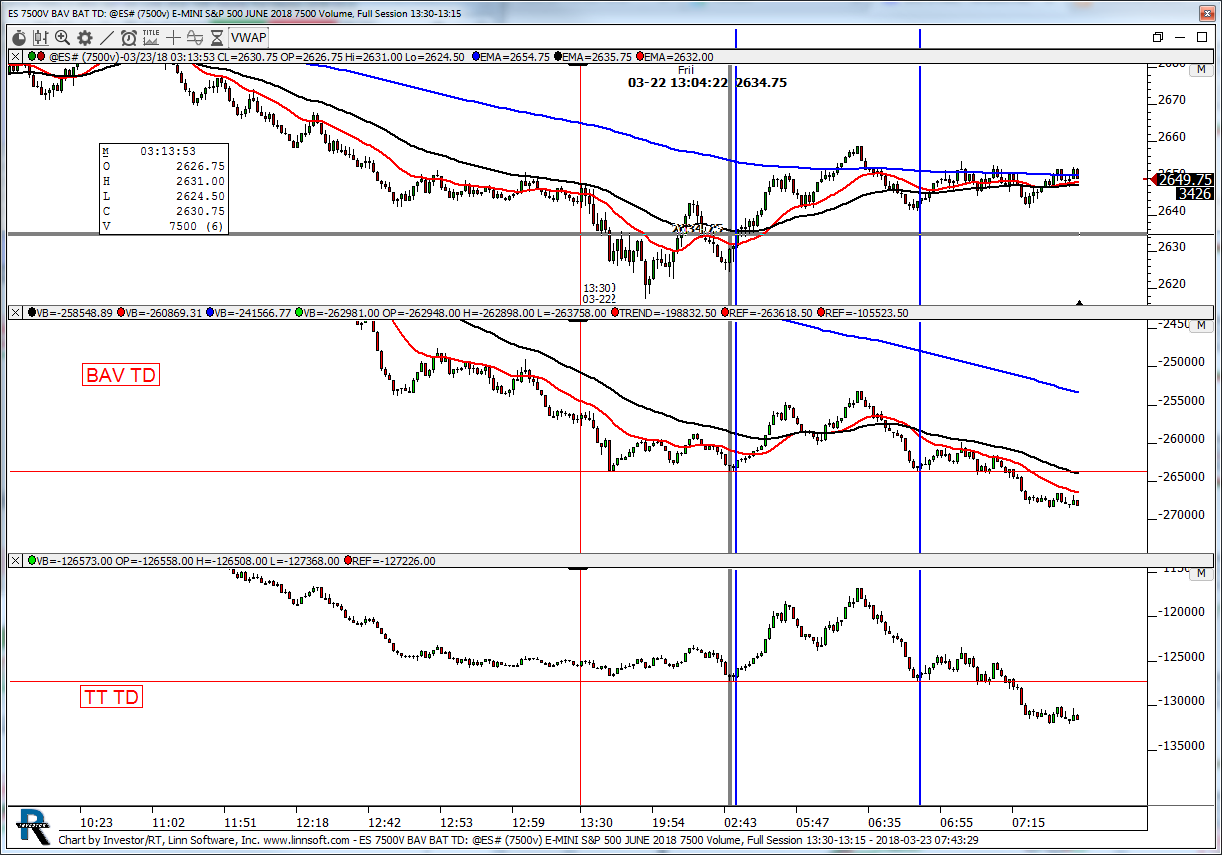 |
ES 7500V BAV BAT TD (@ES#) kencassorla [totalcount]
8 years 4 months ago
BAV TT 7500V. This chart was uploaded by Investor/RT 13.2.7 showing symbol: @ES#. |
View |
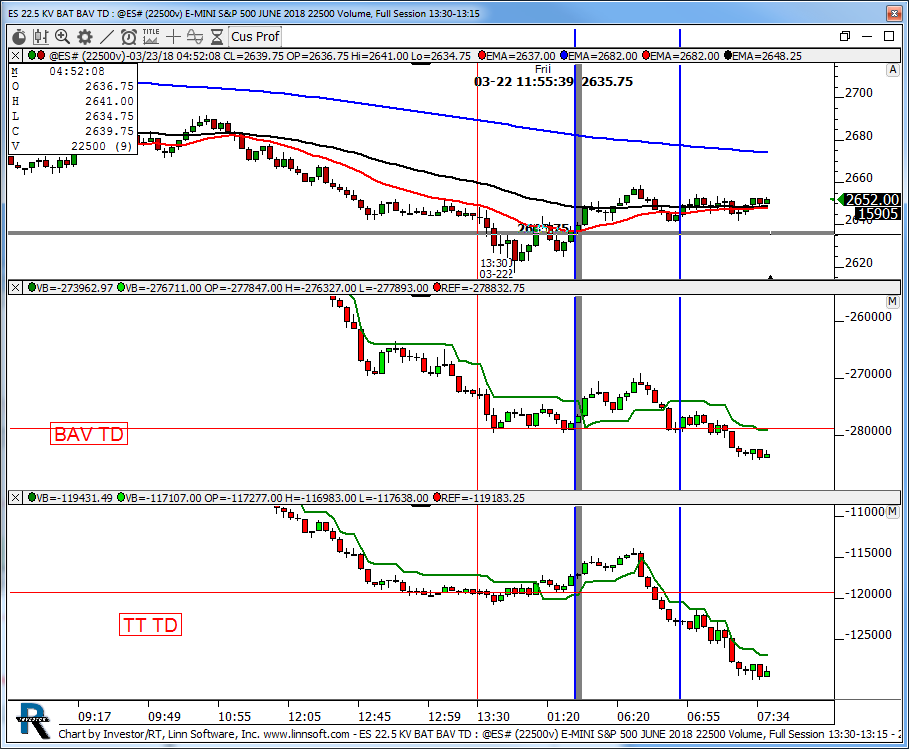 |
ES 225 KV BAT BAV TD (@ES#) kencassorla [totalcount]
8 years 4 months ago
BAV TT 22.5 KV. This chart was uploaded by Investor/RT 13.2.7 showing symbol: @ES#. |
View |
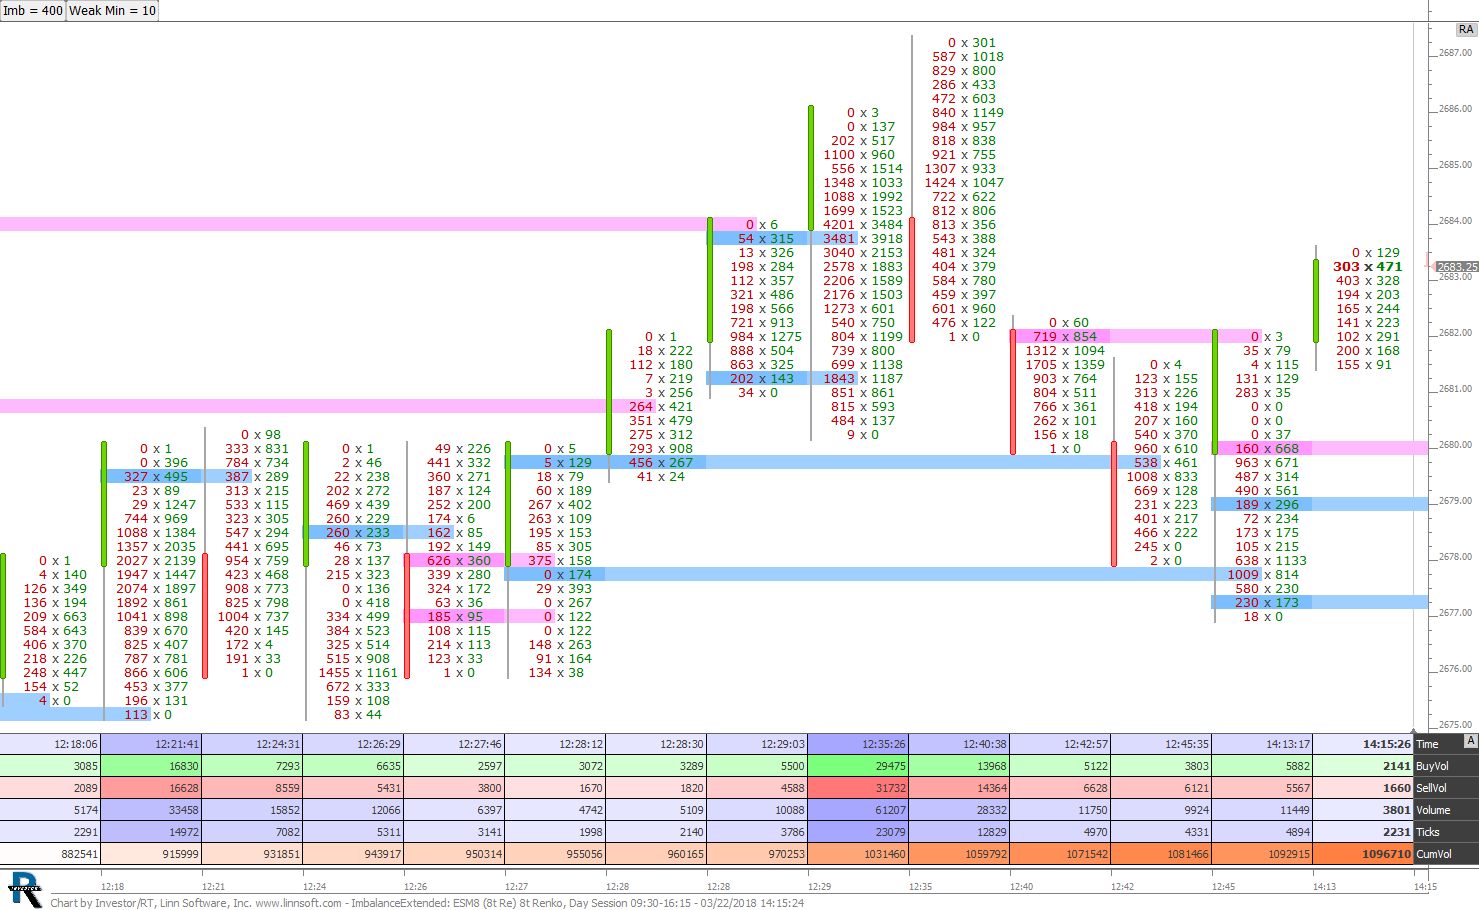 |
ImbalanceExtended (ESM8) cpayne [totalcount]
8 years 4 months ago
Buy (blue) and Sell (pink) imbalance are identified and extended while naked using MPH. The buttons at top control the imbalance percent and the minimum volume required on the weak side. |
View |
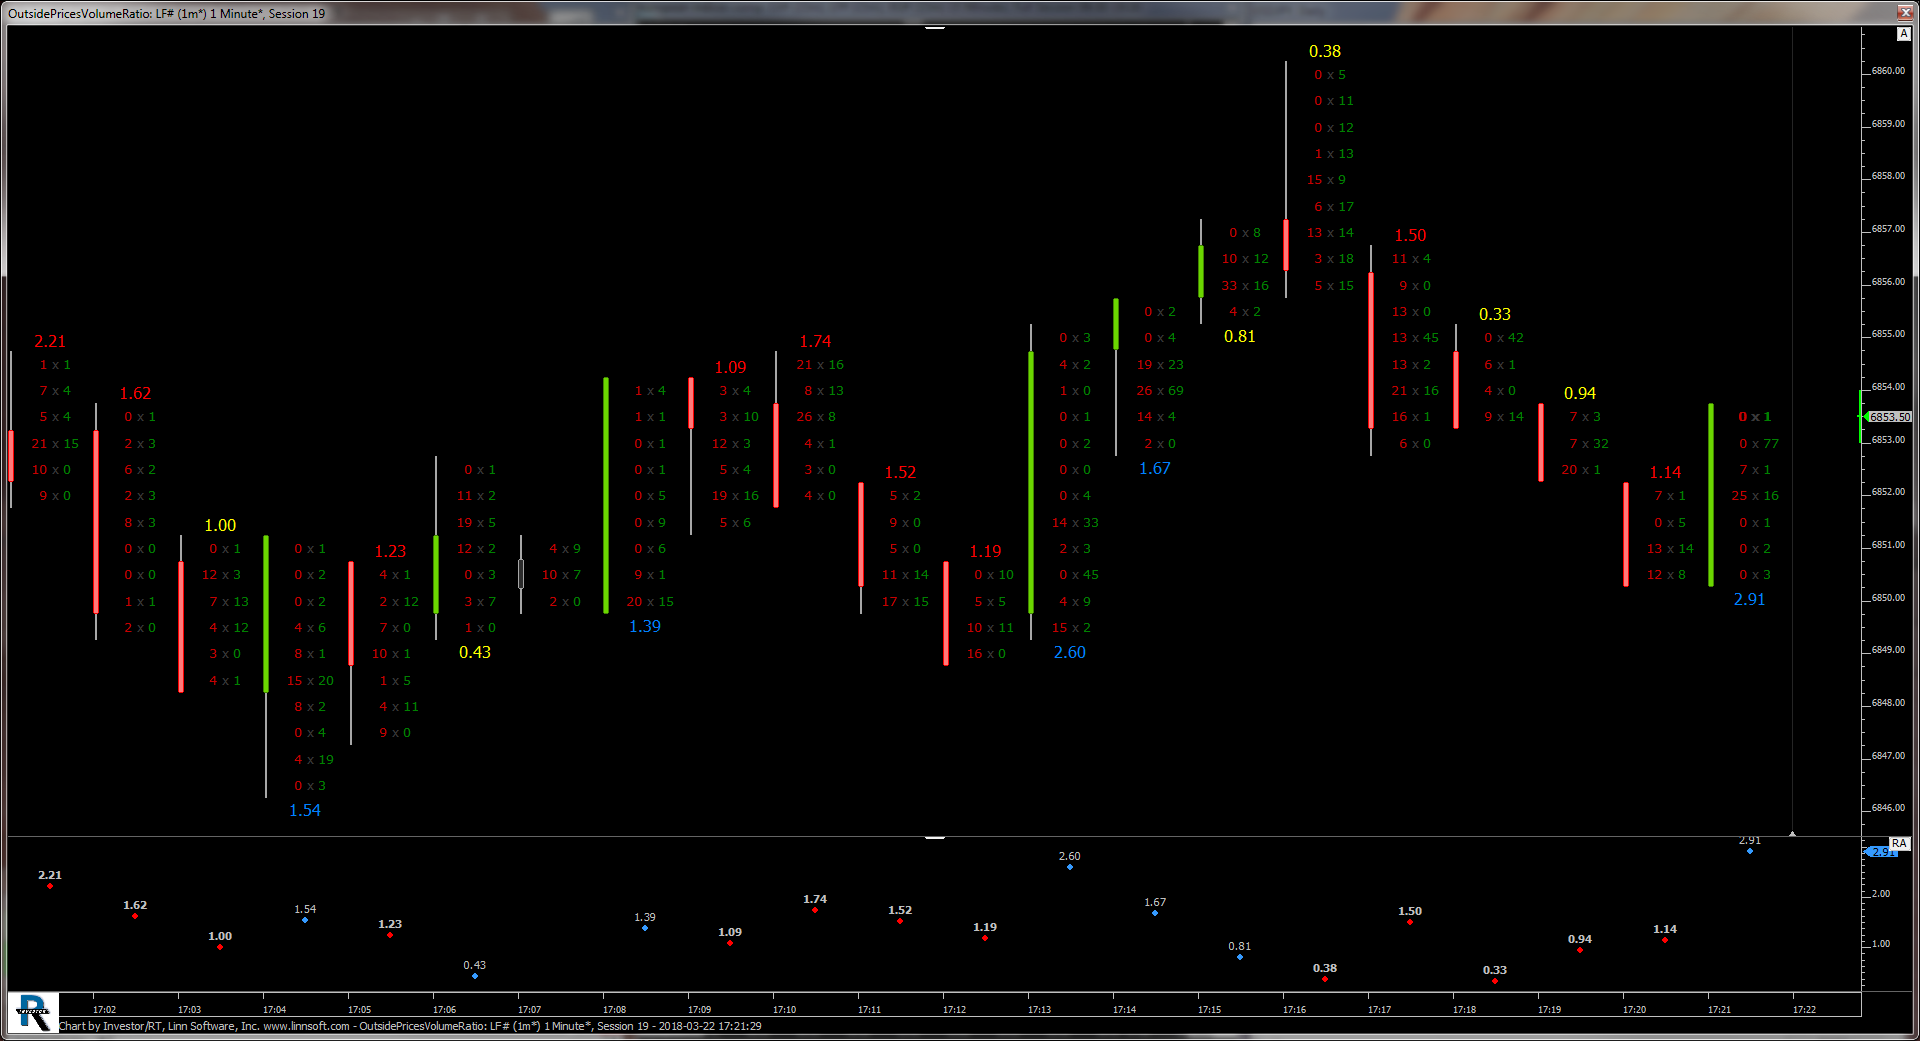 |
OutsidePricesVolumeRatio (LF#) clive fox [totalcount]
8 years 4 months ago
buy/sell volume ratio including divergence ratio. This chart was uploaded by Investor/RT 13.2.7 showing symbol: LF#. |
View |