 |
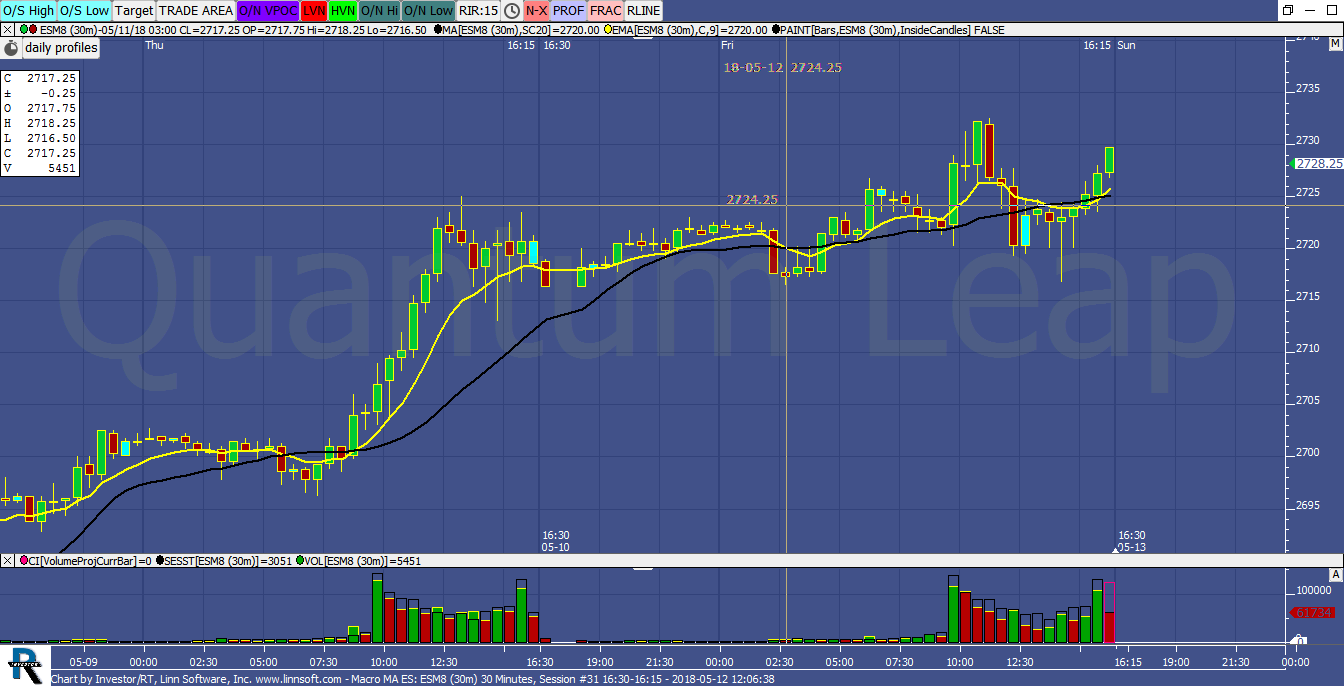
Macro MA ES (ESM8) Quantum Leap [totalcount]
8 years 2 months ago
This chart was uploaded by Investor/RT 13.3.3 showing symbol: ESM8. |
View |
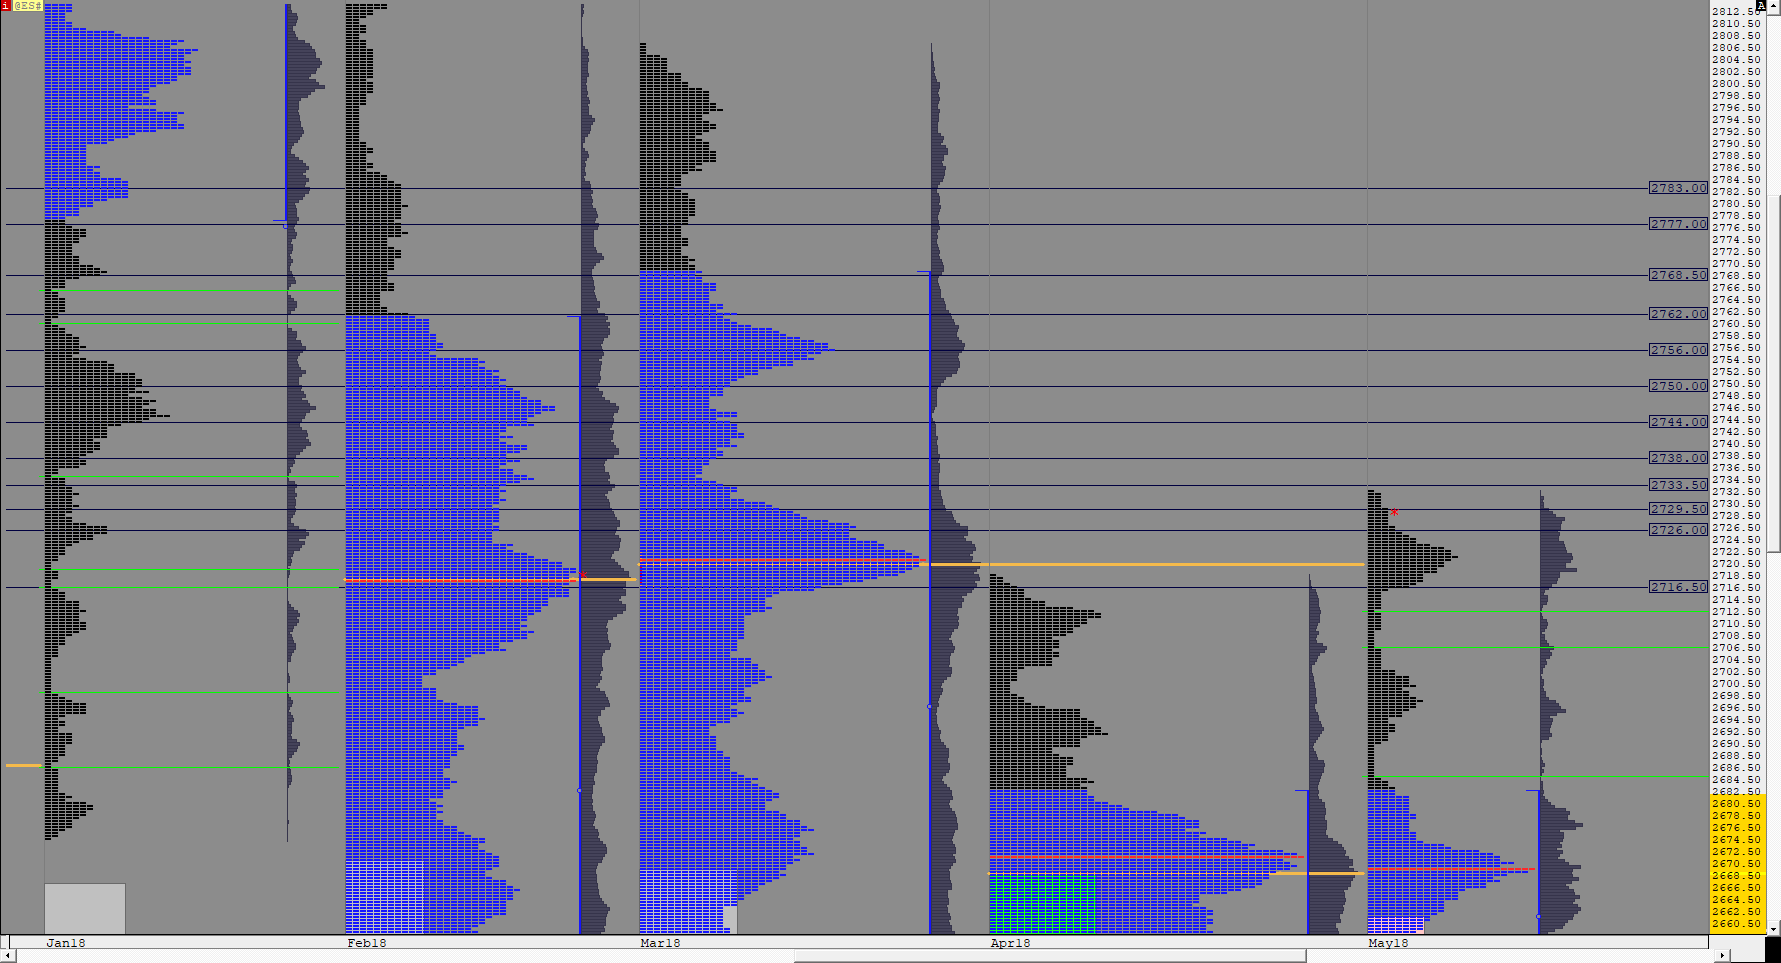 |
MONTHLY MP001 (@ES#) ES42 [totalcount]
8 years 2 months ago
This chart was uploaded by Investor/RT 13.3.3 showing symbol: @ES#. |
View |
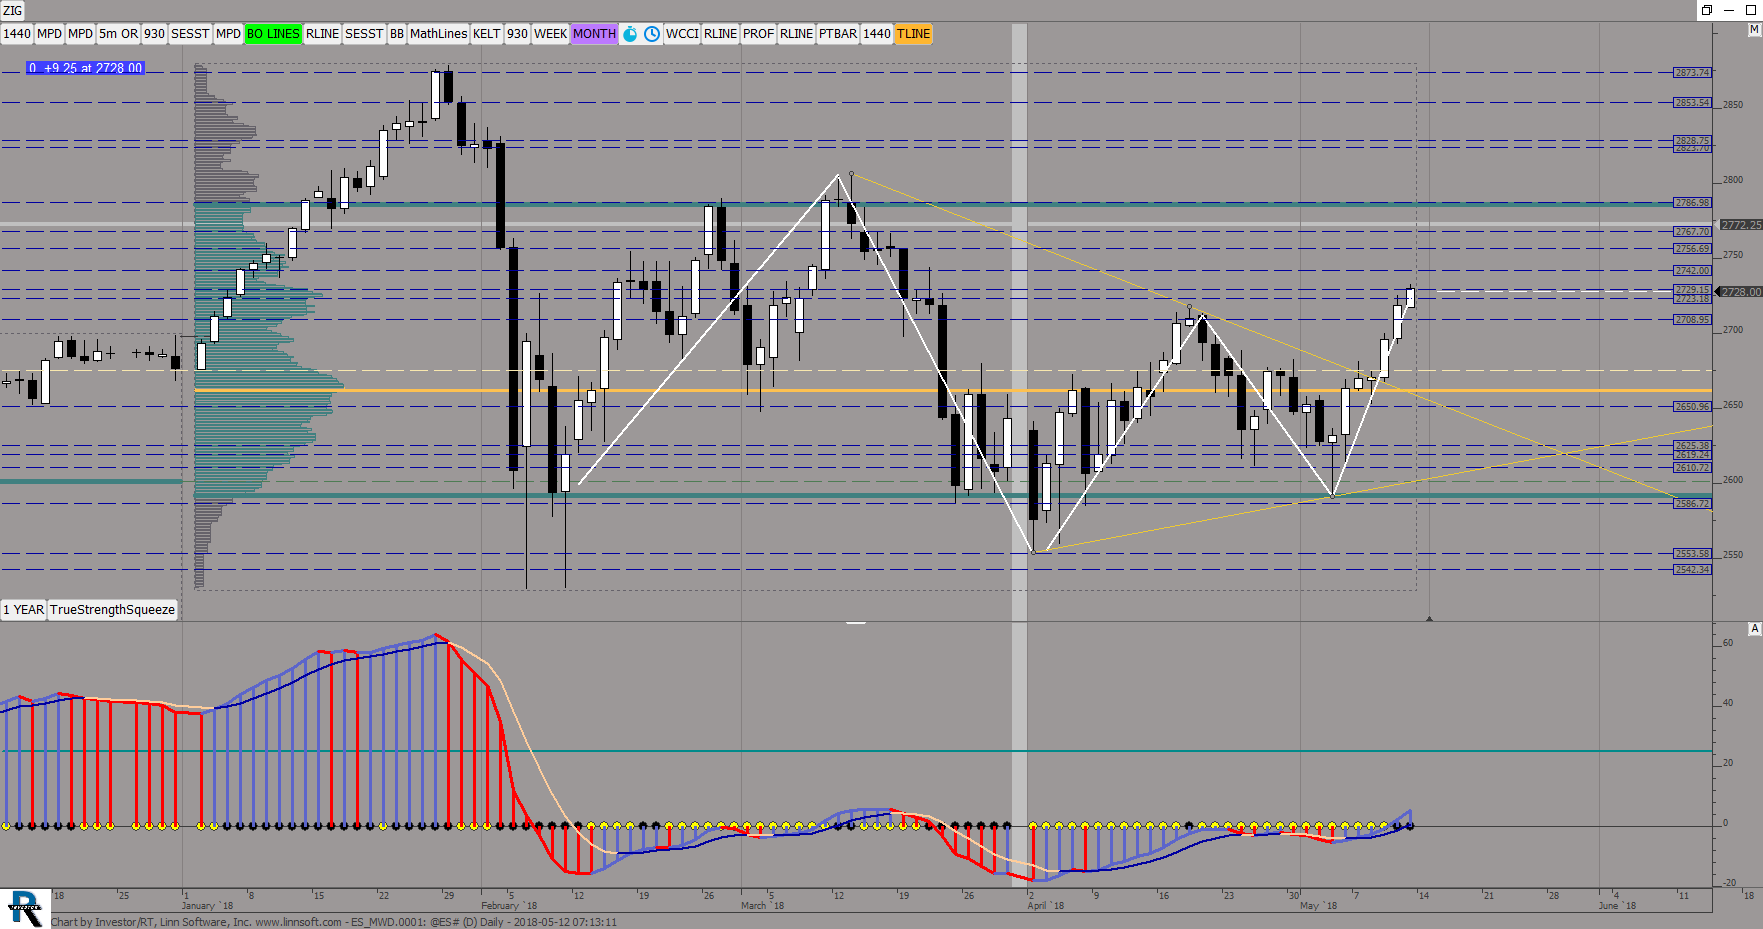 |
ES MWD0001 (@ES#) ES42 [totalcount]
8 years 2 months ago
This chart was uploaded by Investor/RT 13.3.3 showing symbol: @ES#. |
View |
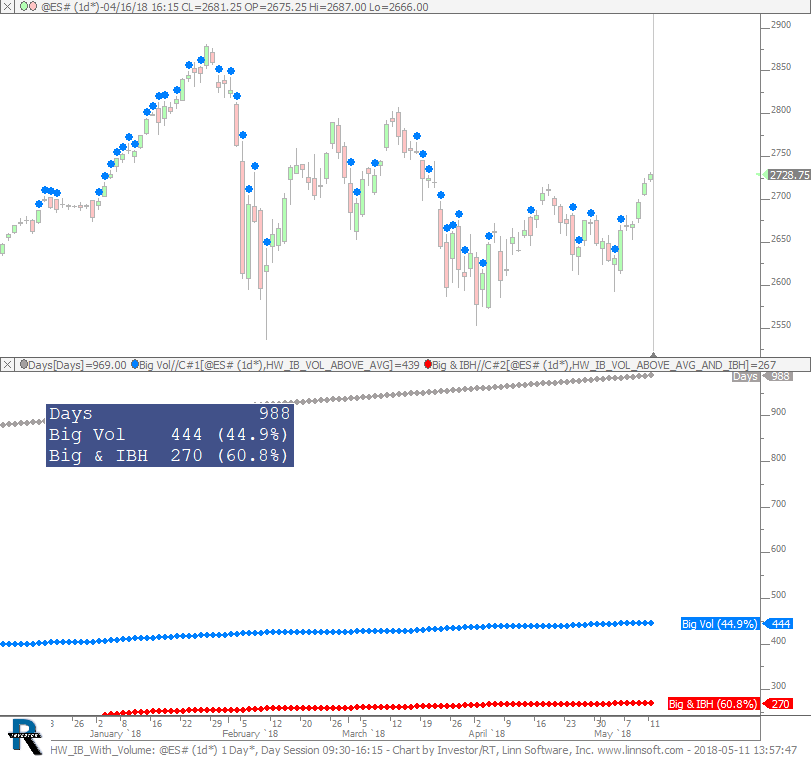 |
HW IB With Volume (@ES#) cpayne [totalcount]
8 years 2 months ago
On above average volume IB days, how often does price break above IBH. This chart was uploaded by Investor/RT 13.3.3 showing symbol: @ES#. |
View |
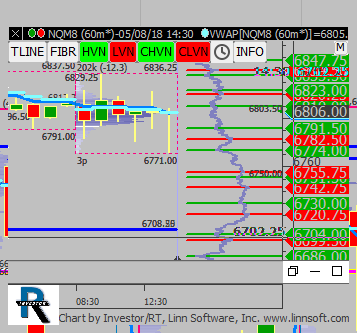 |
Nq micro composite (NQM8) scottz46 [totalcount]
8 years 2 months ago
This chart was uploaded by Investor/RT 13.3.1 showing symbol: NQM8. |
View |
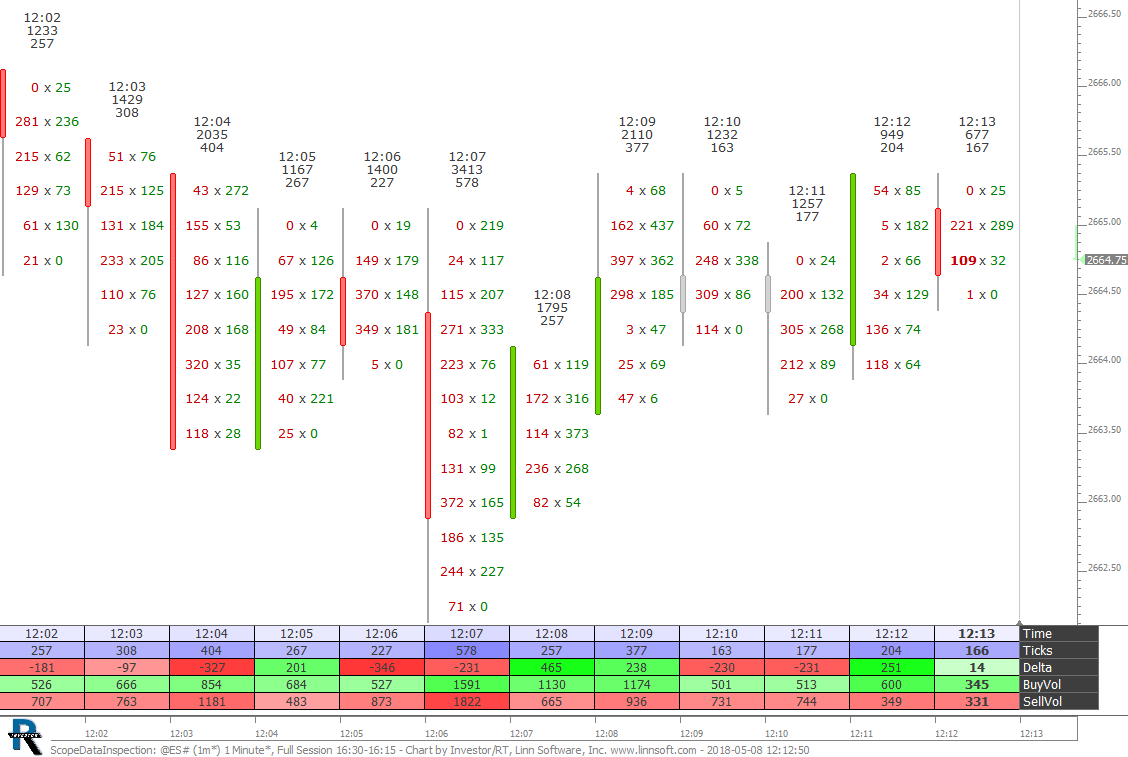 |
ScopeDataInspection (@ES#) cpayne [totalcount]
8 years 2 months ago
This chart was uploaded by Investor/RT 13.3.1 showing symbol: @ES#. |
View |
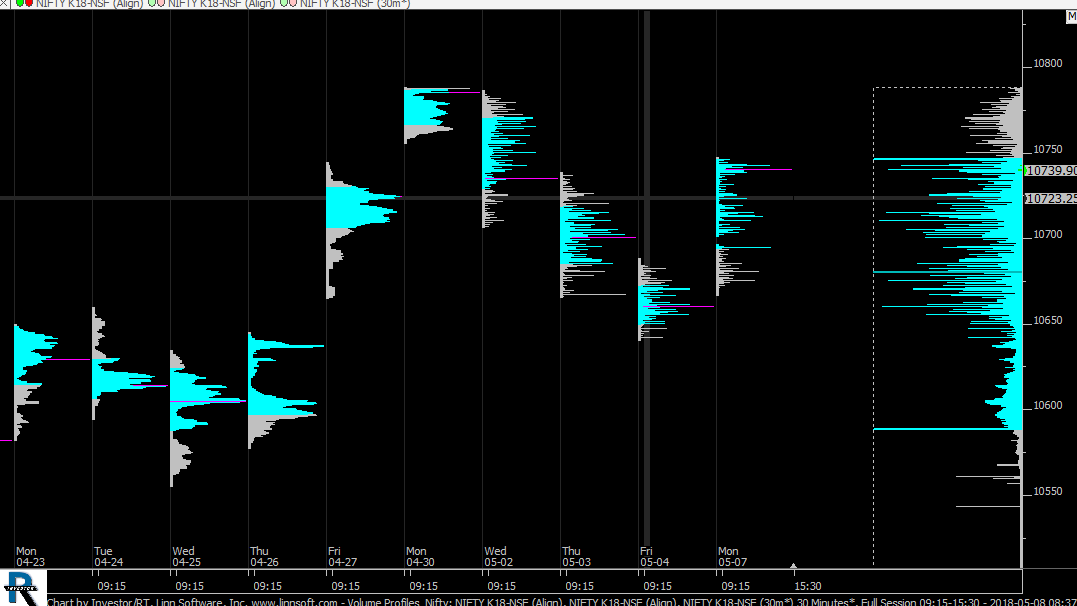 |
Volume Profiles Nifty (NIFTY K18-NSF) Ilyas Shaikh [totalcount]
8 years 2 months ago
This chart was uploaded by Investor/RT 13.3.1 showing symbol: NIFTY K18-NSF. |
View |
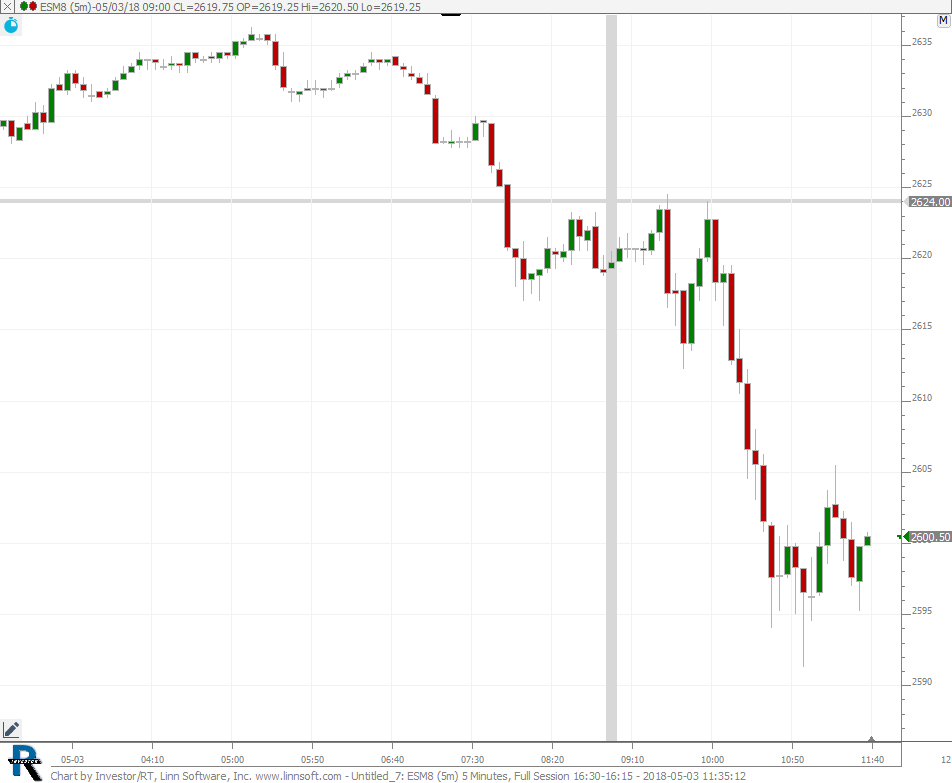 |
Untitled 7 (ESM8) tuscanleather [totalcount]
8 years 3 months ago
This chart was uploaded by Investor/RT 13.2.8 showing symbol: ESM8. |
View |
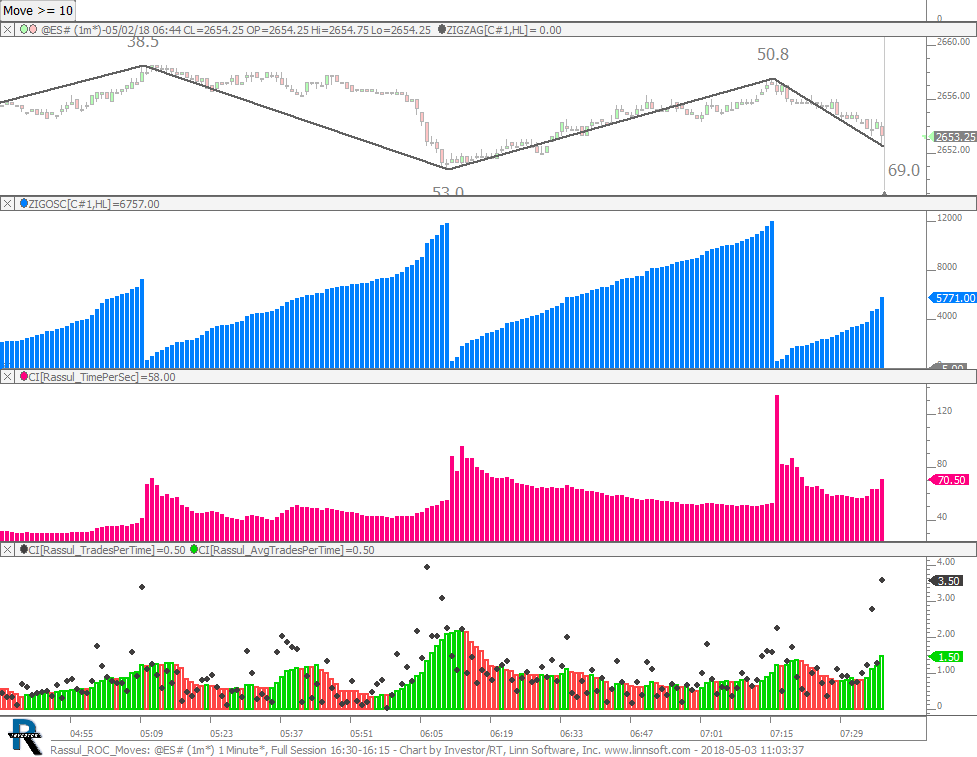 |
Rassul ROC Moves (@ES#) cpayne [totalcount]
8 years 3 months ago
This chart was uploaded by Investor/RT 13.3.1 showing symbol: @ES#. |
View |
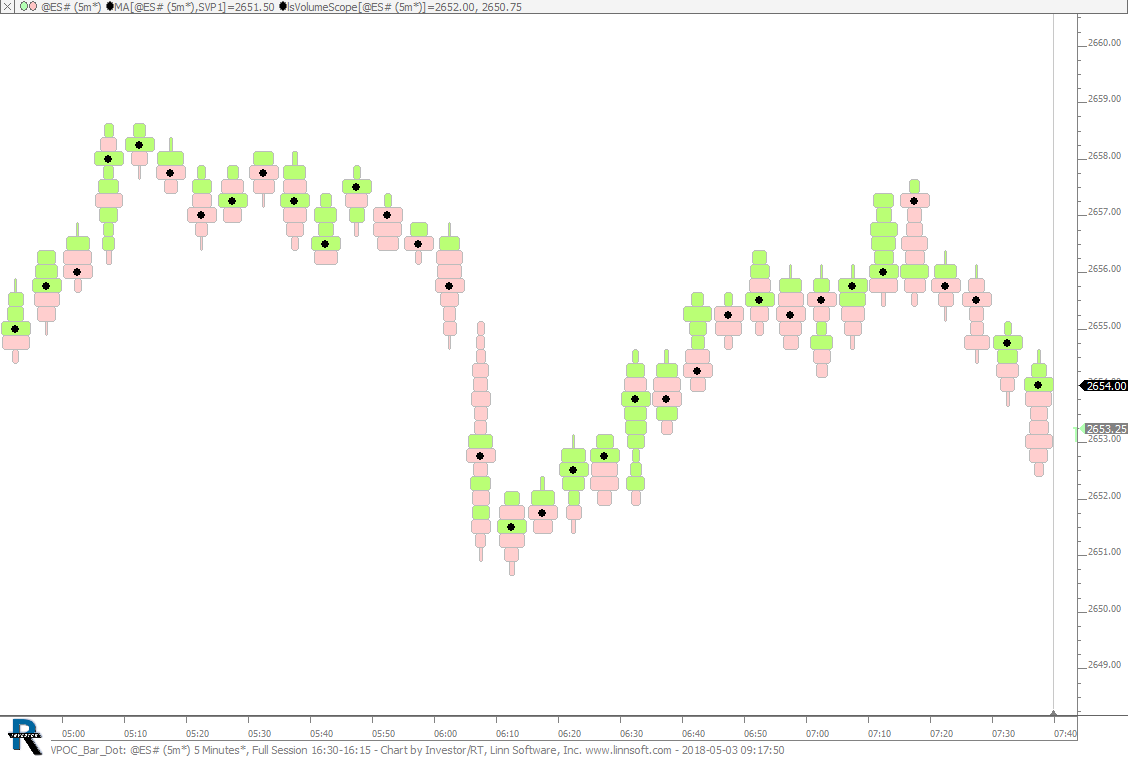 |
VPOC Bar Dot (@ES#) cpayne [totalcount]
8 years 3 months ago
VPOC of Bar is Dot. This chart was uploaded by Investor/RT 13.3.1 showing symbol: @ES#. |
View |
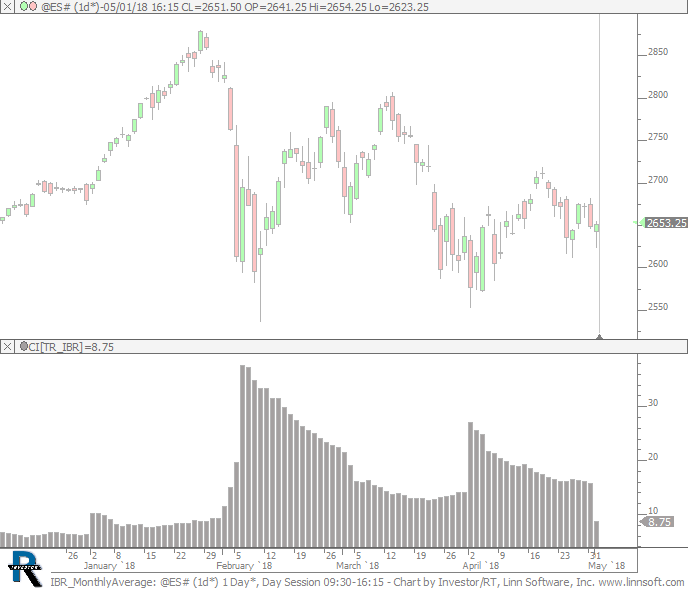 |
IBR MonthlyAverage (@ES#) cpayne [totalcount]
8 years 3 months ago
IB Range - Monthly Average. This chart was uploaded by Investor/RT 13.3.1 showing symbol: @ES#. |
View |
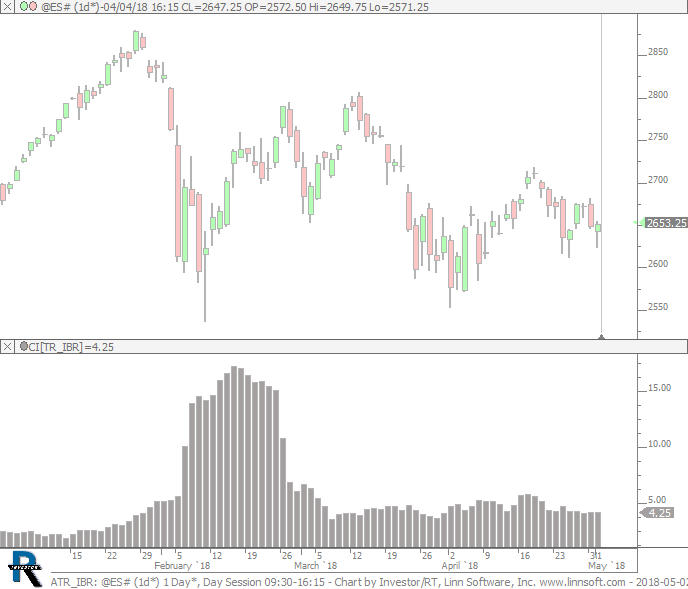 |
ATR IBR (@ES#) cpayne [totalcount]
8 years 3 months ago
ATR of IB Range. This chart was uploaded by Investor/RT 13.3.1 showing symbol: @ES#. |
View |
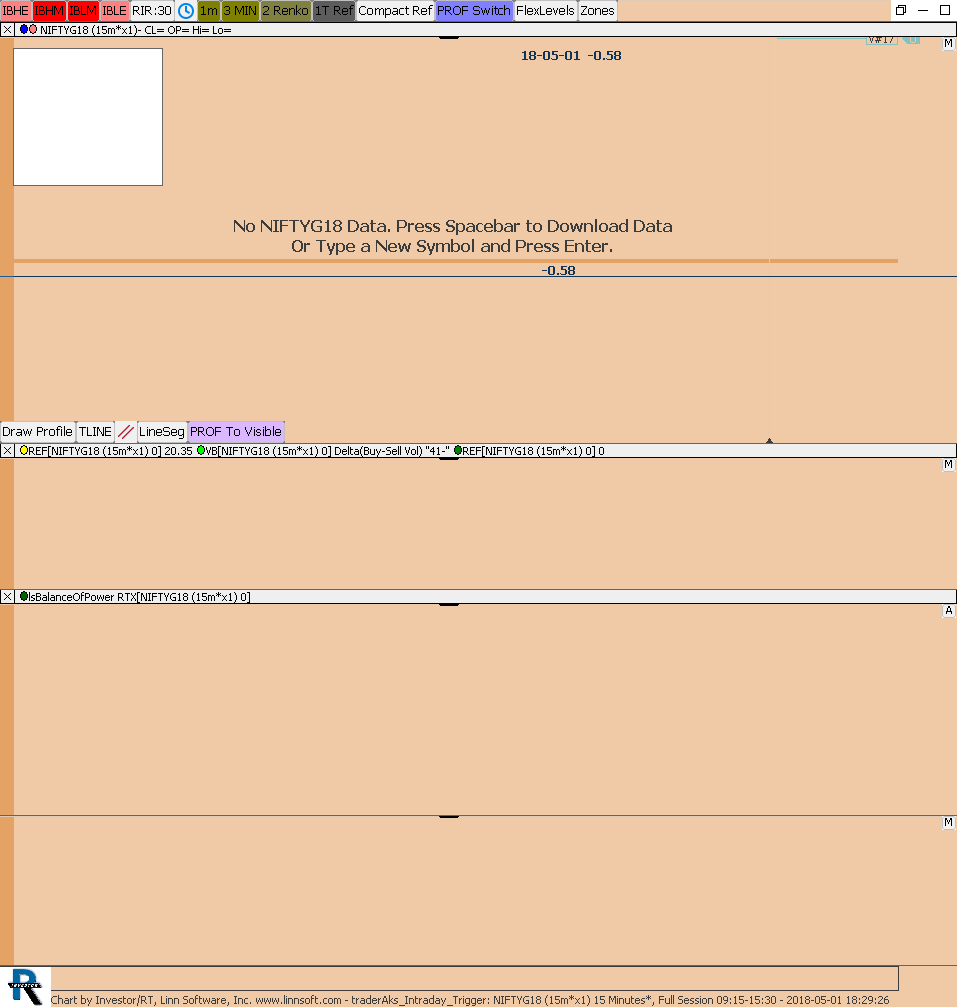 |
traderAks Intraday Trigger (NIFTYG18) amit [totalcount]
8 years 3 months ago
This chart was uploaded by Investor/RT 13.2.8 showing symbol: NIFTYG18. |
View |
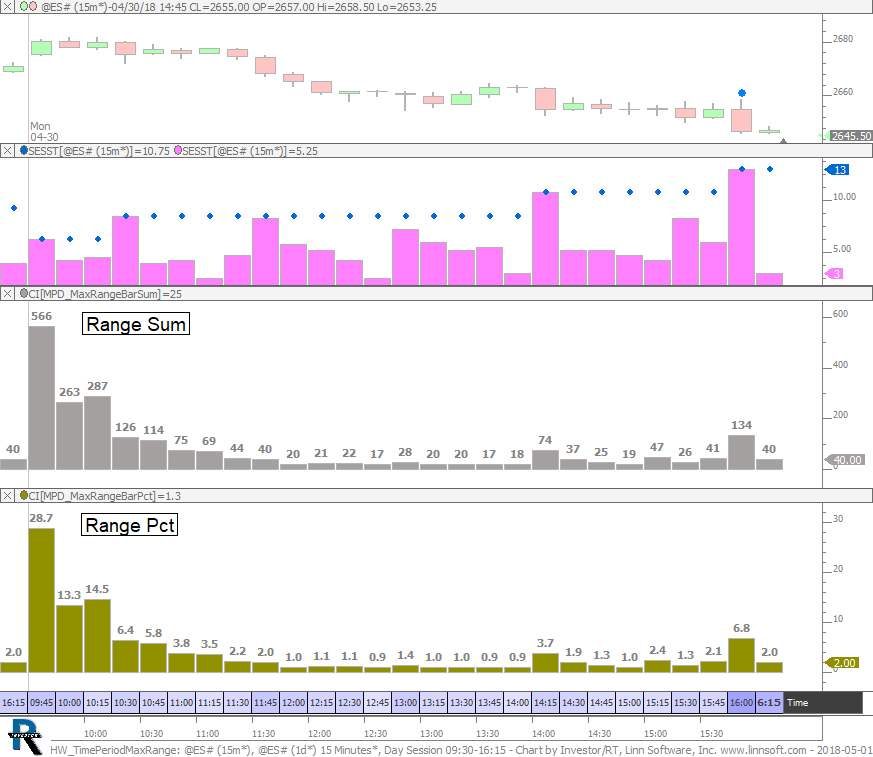 |
HW TimePeriodMaxRange (@ES#) cpayne [totalcount]
8 years 3 months ago
Sum and Percent of time the highest range bar is made at each 15 minute period during the session. This chart was uploaded by Investor/RT 13.3.1 showing symbol: @ES#. |
View |
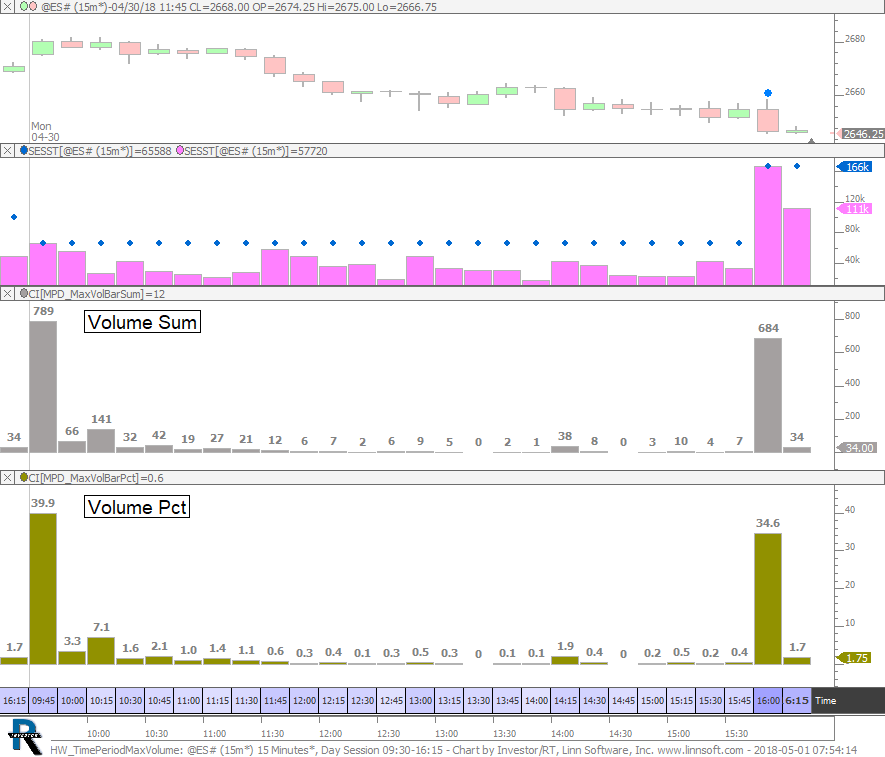 |
HW TimePeriodMaxVolume (@ES#) cpayne [totalcount]
8 years 3 months ago
Sum and Percent of time the highest volume bar is made at each 15 minute period during the session. This chart was uploaded by Investor/RT 13.3.1 showing symbol: @ES#. |
View |
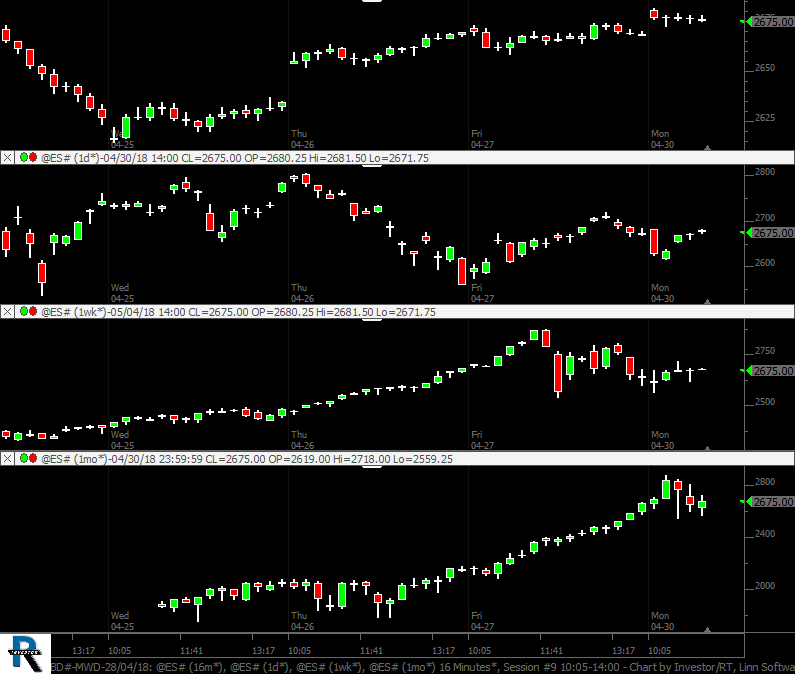 |
BD MWD 28 04 18 (@ES#) cpayne [totalcount]
8 years 3 months ago
This chart was uploaded by Investor/RT 13.3.1 showing symbol: @ES#. |
View |
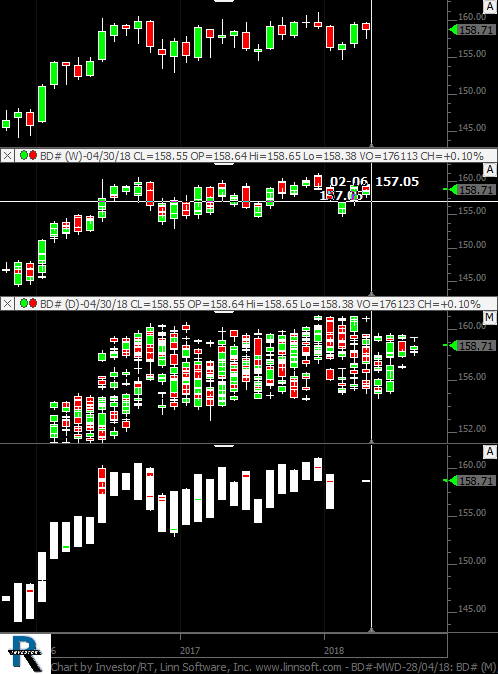 |
BD MWD 28 04 (BD#) WAYNE CHANDLER [totalcount]
8 years 3 months ago
Monthly/Weekly/Daily/16 minute charts on a single mutipane. This chart was uploaded by Investor/RT 13.2.8 showing symbol: BD#. |
View |
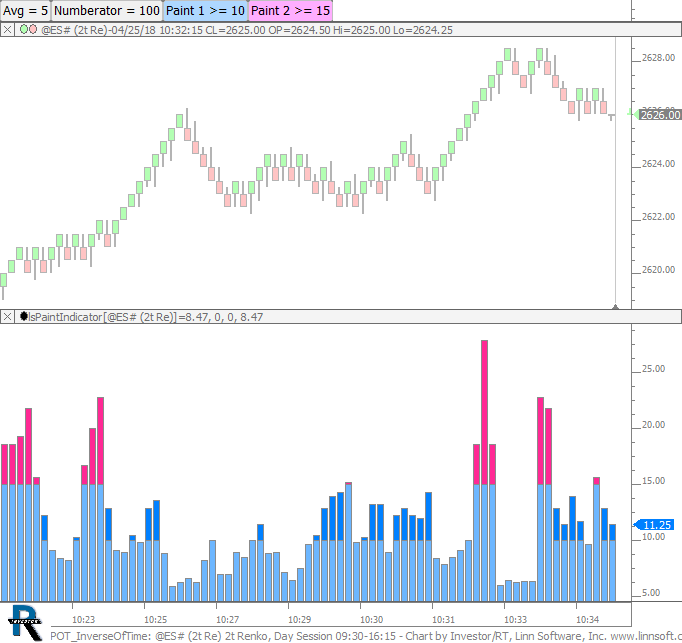 |
POT InverseOfTime (@ES#) cpayne [totalcount]
8 years 3 months ago
Pace of Tape - Lower Pane computes an inverse of the time it takes to complete each bar. A smoothing of time is used for that denominator with the smoothing period specified with button. |
View |
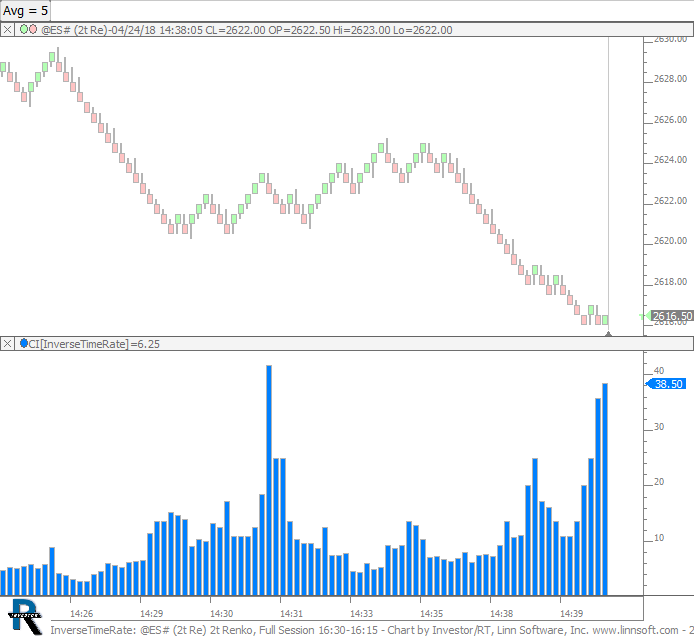 |
InverseTimeRate (@ES#) cpayne [totalcount]
8 years 3 months ago
Indicator in lower pane computes 100 / time (in seconds). Larger value for faster bars and faster moves. The denominator is the 3 bar average of time (in seconds). |
View |
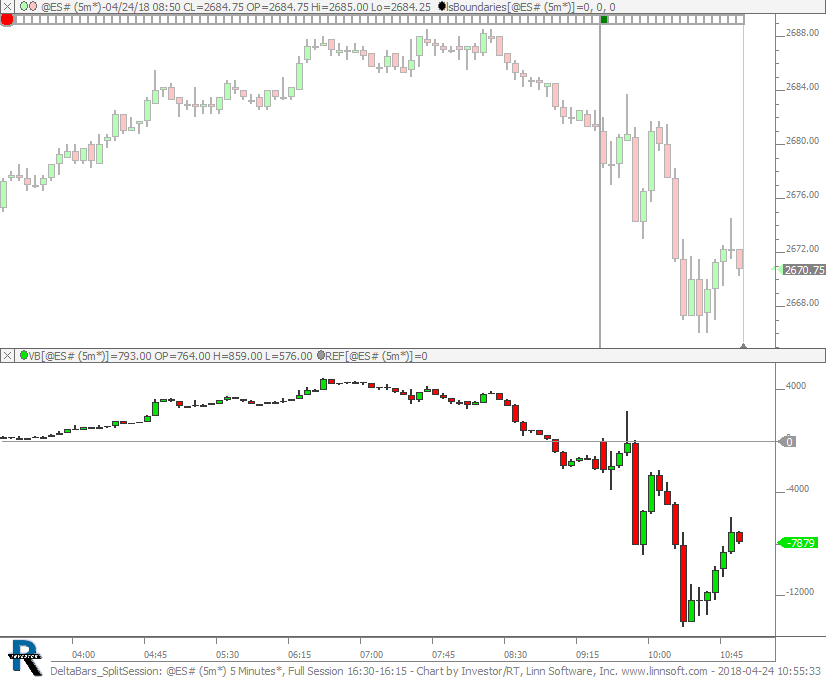 |
DeltaBars SplitSession (@ES#) cpayne [totalcount]
8 years 3 months ago
Cumulative Delta Bars resetting on split session using the Boundaries indicator. This chart was uploaded by Investor/RT 13.2.8 showing symbol: @ES#. |
View |
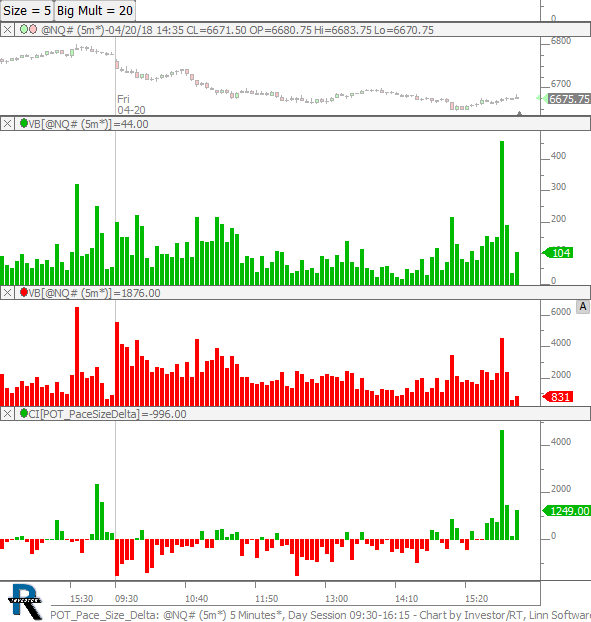 |
POT Pace Size Delta (@NQ#) cpayne [totalcount]
8 years 3 months ago
Pace of Trade - Pace of big vs pace of small trades. This chart was uploaded by Investor/RT 13.2.8 showing symbol: @NQ#. |
View |
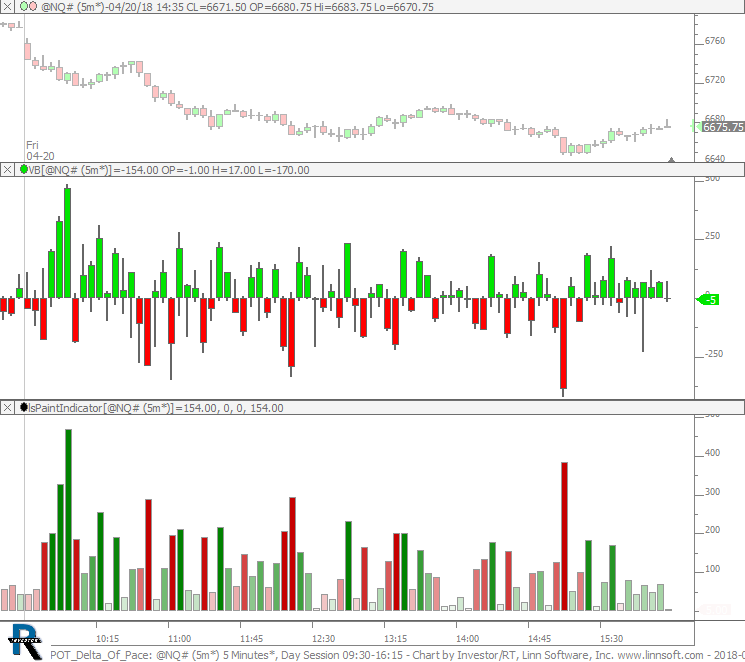 |
POT Delta Of Pace (@NQ#) cpayne [totalcount]
8 years 3 months ago
Pace of Trade - Delta of Pace - Middle pane plots the difference between the number of trades that occurred at ask minus the number of trades that occurred at the bid. |
View |
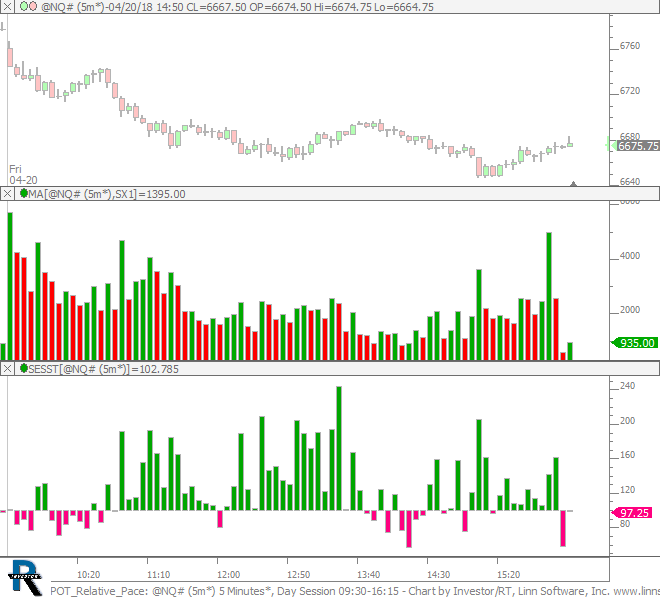 |
POT Relative Pace (@NQ#) cpayne [totalcount]
8 years 3 months ago
Pace of Tape - Relative Pace - Middle pane plots the number of trades (pace) and bottom pane shows the pace relative to avergae of past 5 days (same timeframe). |
View |
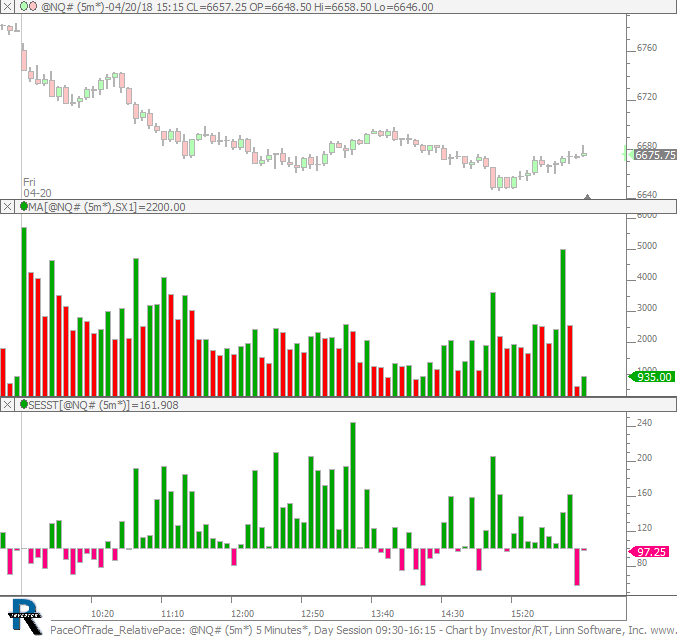 |
PaceOfTrade RelativePace (@NQ#) cpayne [totalcount]
8 years 3 months ago
Pace of Tape - Relative Pace - Middle pane plots the number of trades (pace) and bottom pane shows the pace relative to avergae of past 5 days (same timeframe). |
View |
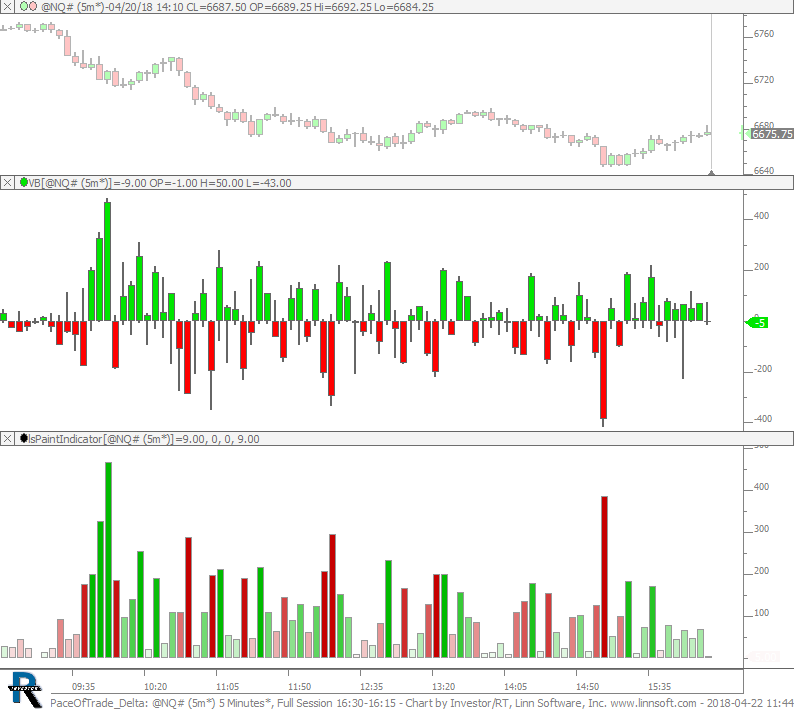 |
PaceOfTrade Delta (@NQ#) cpayne [totalcount]
8 years 3 months ago
Pace of Trade - Delta. This chart was uploaded by Investor/RT 13.2.8 showing symbol: @NQ#. |
View |