 |
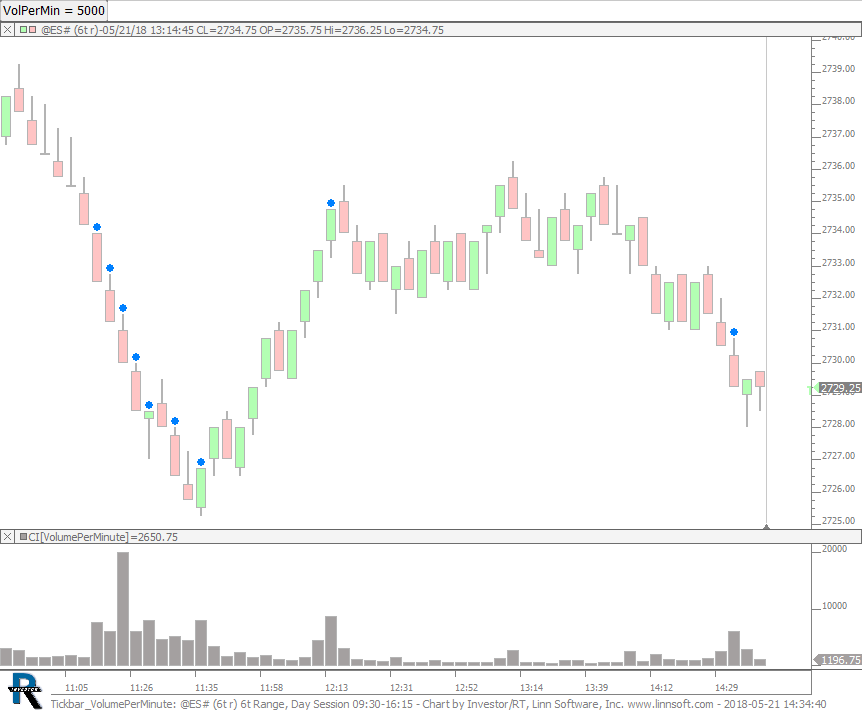
Tickbar VolumePerMinute (@ES#) cpayne [totalcount]
8 years 2 months ago
Volume Per Minute Alerts. This chart was uploaded by Investor/RT 13.3.4 showing symbol: @ES#. |
View |
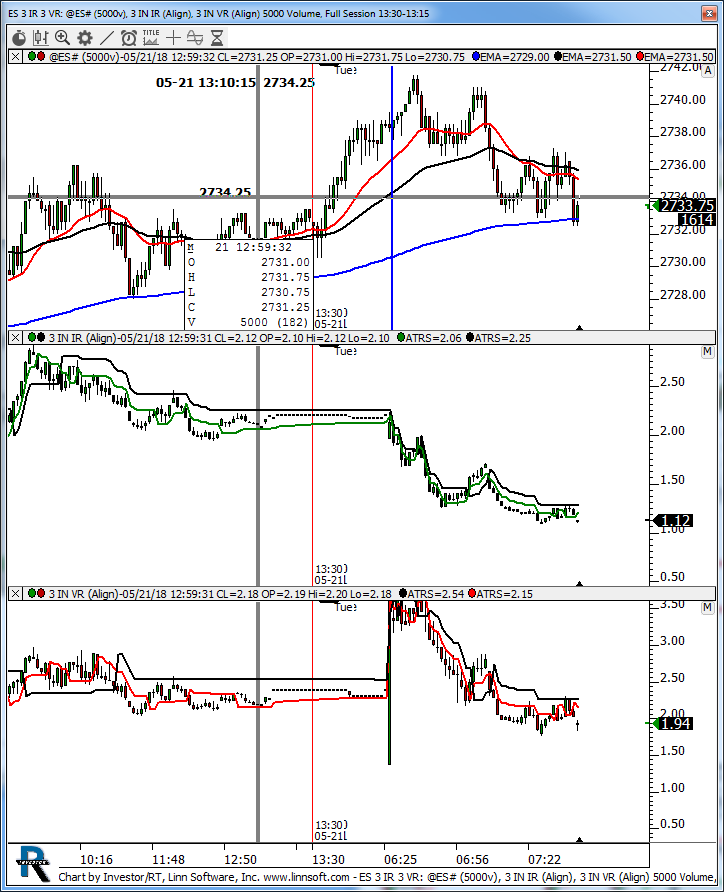 |
ES 3 IR 3 VR (@ES#) kencassorla [totalcount]
8 years 2 months ago
3 index ad's. This chart was uploaded by Investor/RT 13.3.3 showing symbol: @ES#. |
View |
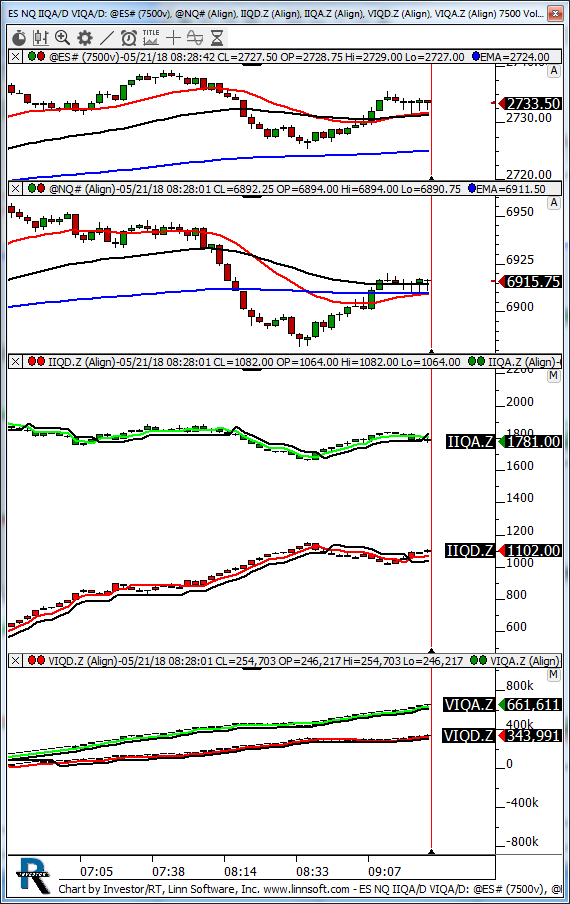 |
ES NQ IIQA D VIQA D (@ES#) kencassorla [totalcount]
8 years 2 months ago
7500v NQ. This chart was uploaded by Investor/RT 13.3.3 showing symbol: @ES#. |
View |
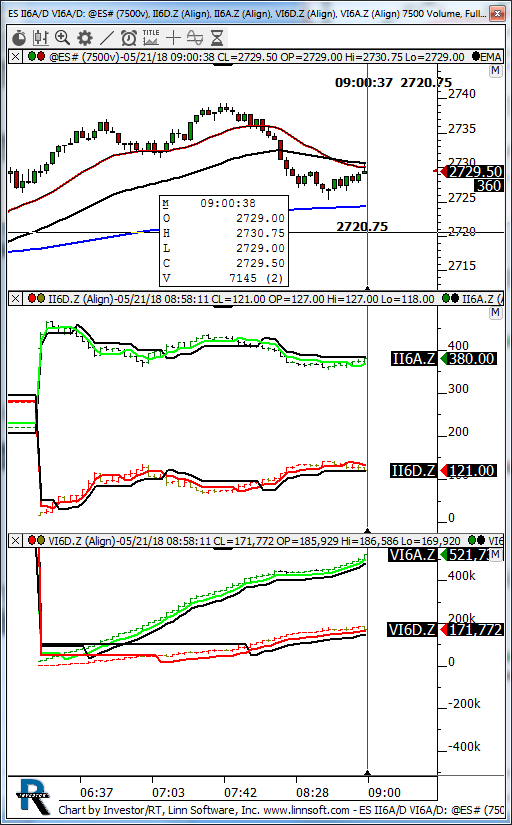 |
ES II6A D VI6A D (@ES#) kencassorla [totalcount]
8 years 2 months ago
ad's. This chart was uploaded by Investor/RT 13.3.3 showing symbol: @ES#. |
View |
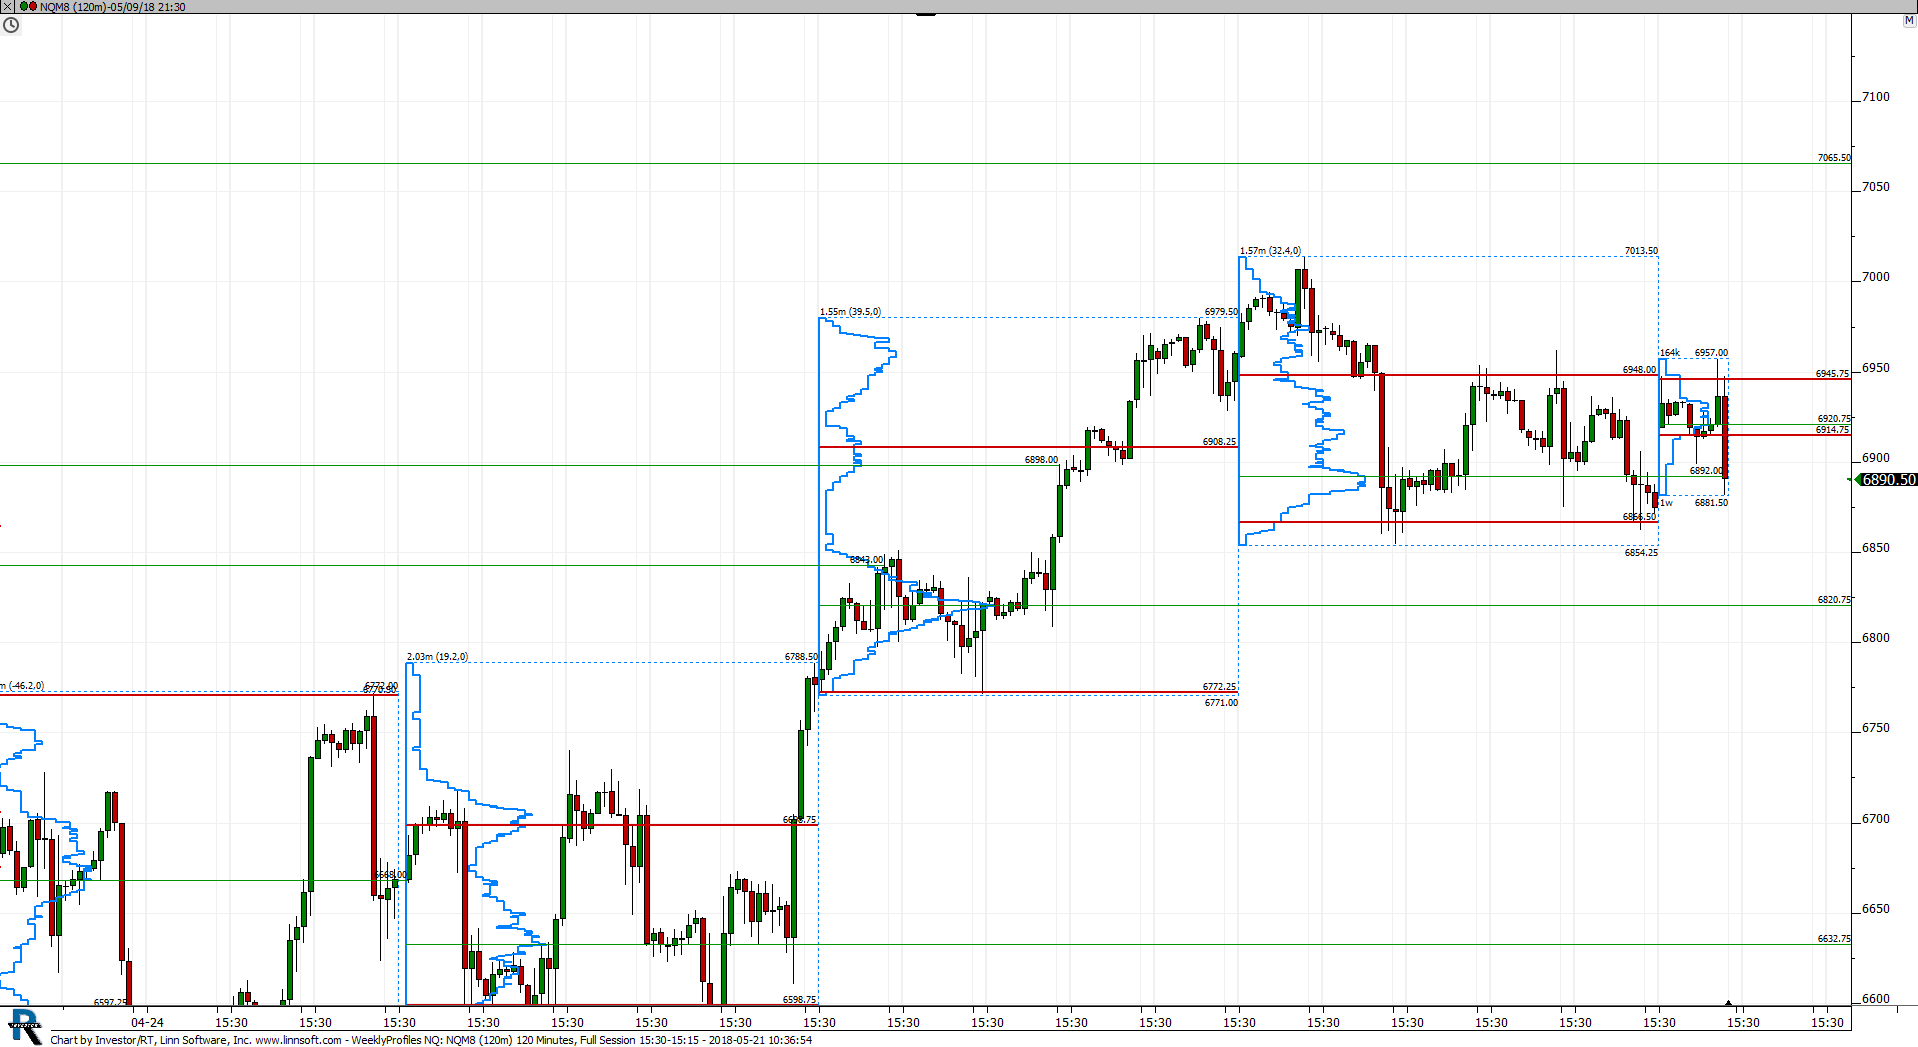 |
WeeklyProfiles NQ (NQM8) scottz46 [totalcount]
8 years 2 months ago
This chart was uploaded by Investor/RT 13.3.3 showing symbol: NQM8. |
View |
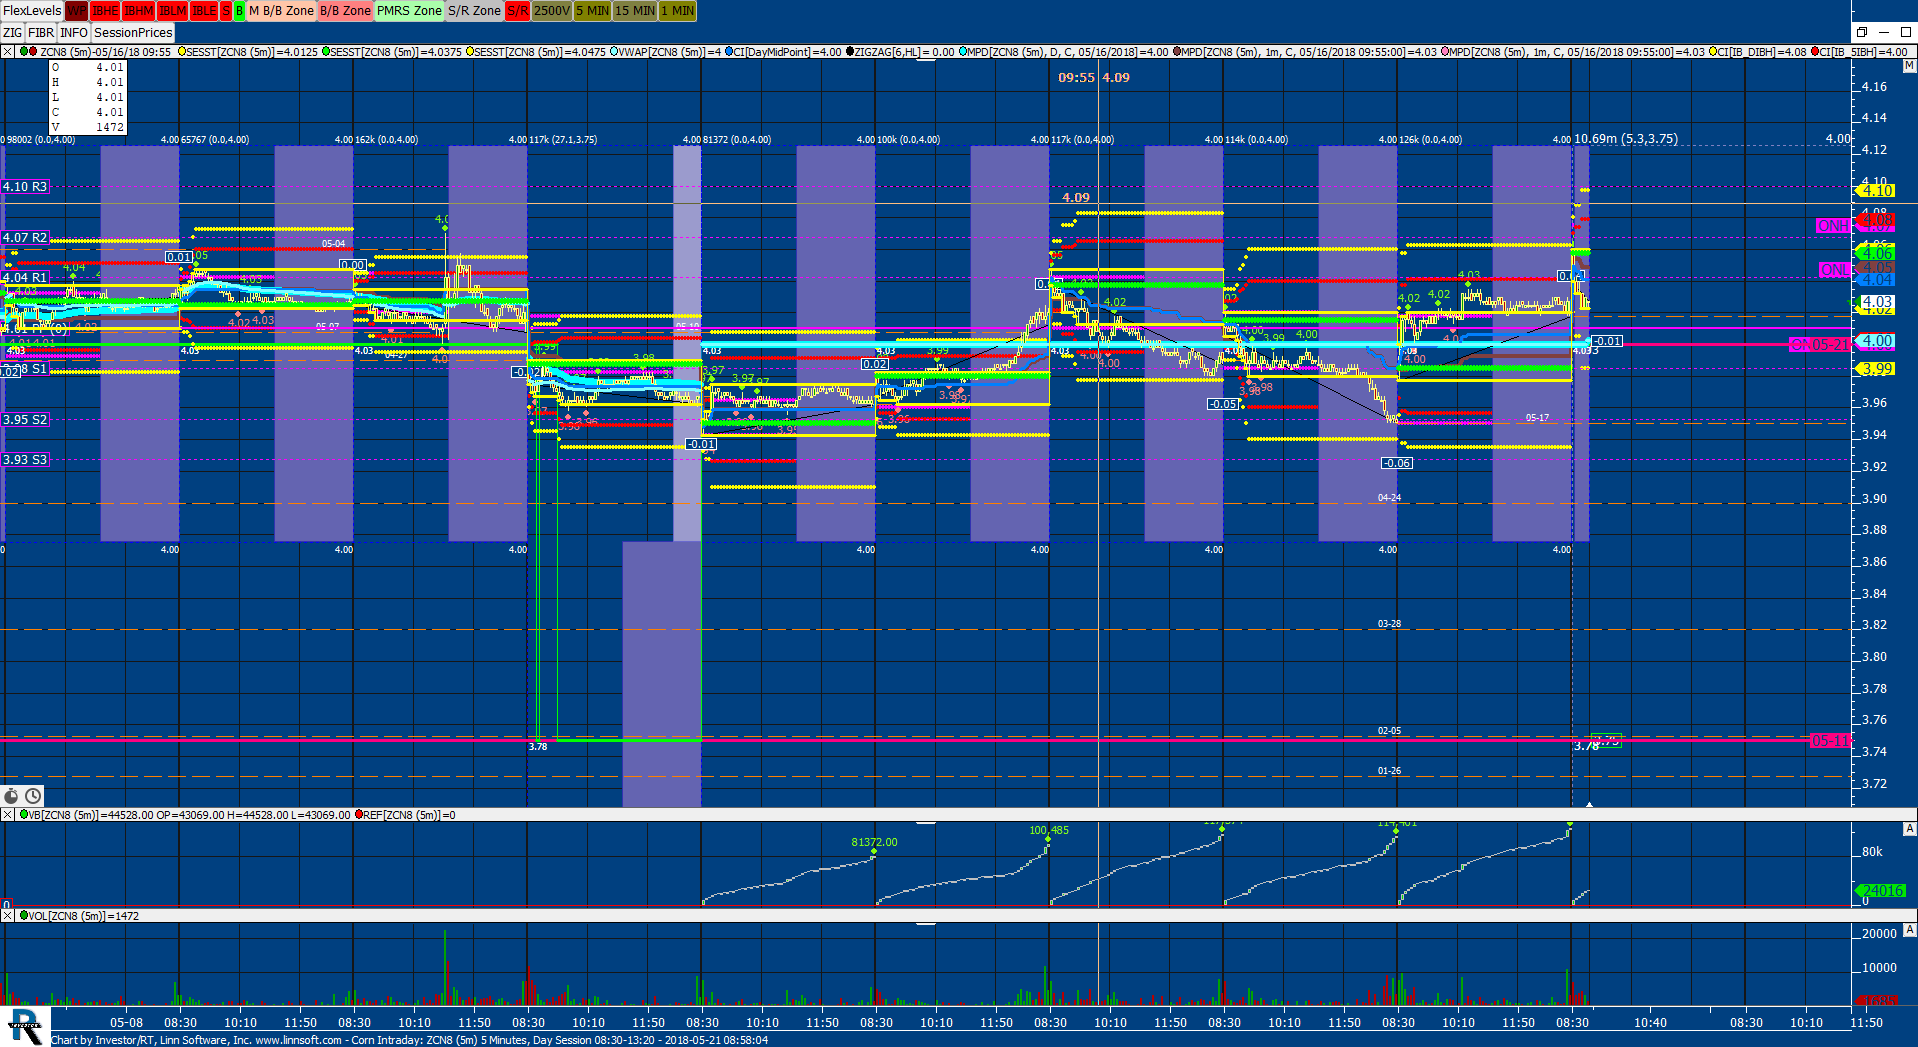 |
Corn Intraday (ZCN8) scottz46 [totalcount]
8 years 2 months ago
This chart was uploaded by Investor/RT 13.3.3 showing symbol: ZCN8. |
View |
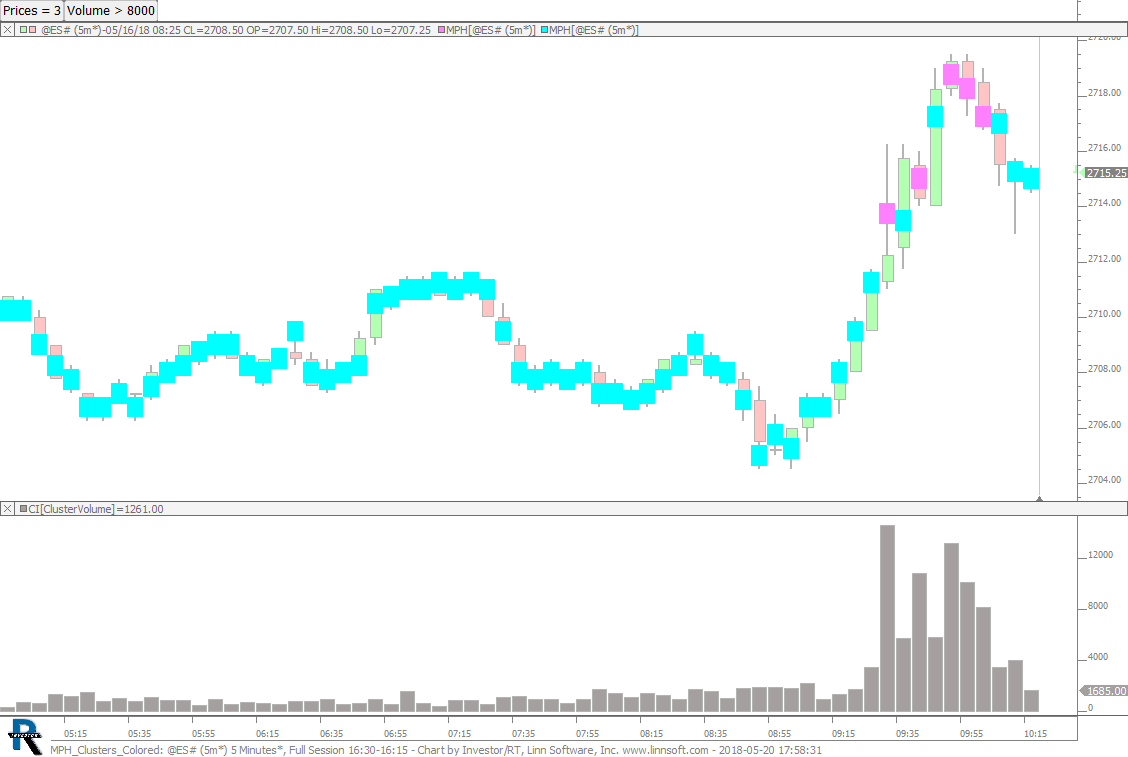 |
MPH Clusters Colored (@ES#) cpayne [totalcount]
8 years 2 months ago
Painting Volume Clusters. This chart was uploaded by Investor/RT 13.3.3 showing symbol: @ES#. |
View |
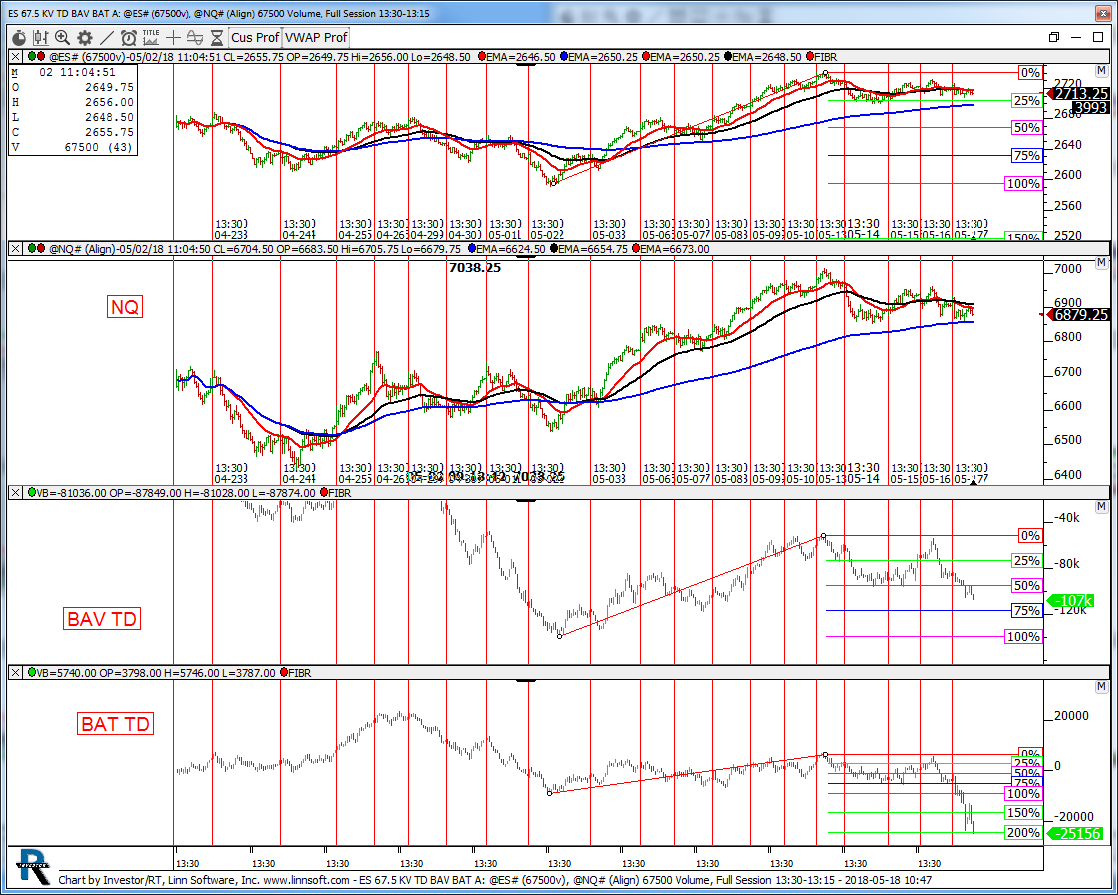 |
ES 675 KV TD BAV BAT A (@ES#) kencassorla [totalcount]
8 years 2 months ago
67.5 kv. This chart was uploaded by Investor/RT 13.3.3 showing symbol: @ES#. |
View |
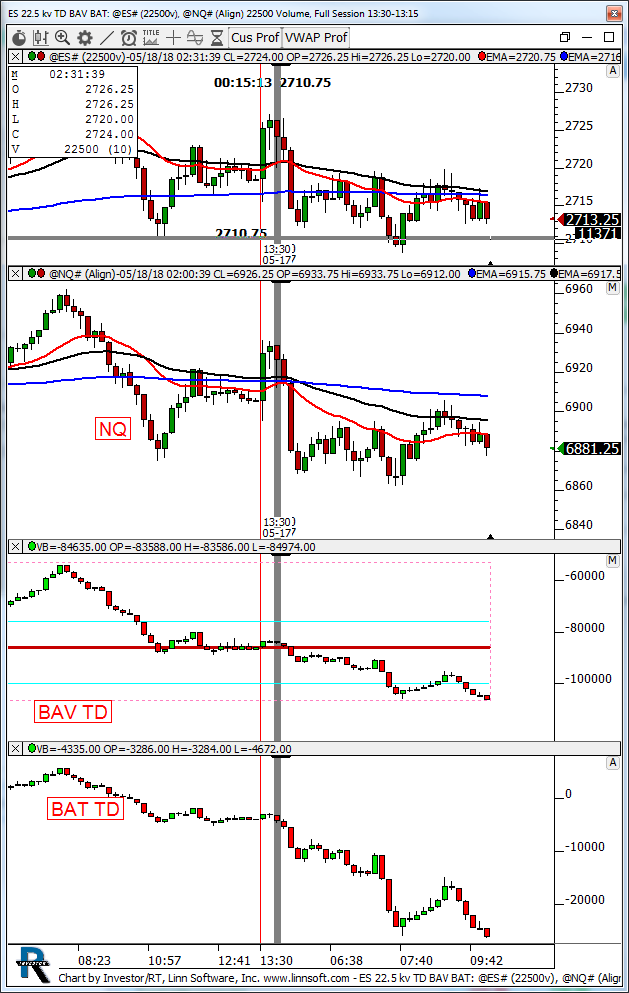 |
ES 225 kv TD BAV BAT (@ES#) kencassorla [totalcount]
8 years 2 months ago
22.5 kv. This chart was uploaded by Investor/RT 13.3.3 showing symbol: @ES#. |
View |
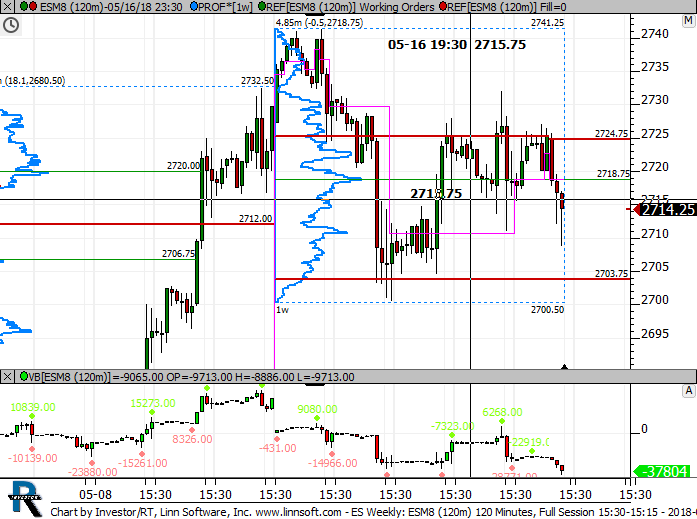 |
ES Weekly (ESM8) scottz46 [totalcount]
8 years 2 months ago
This chart was uploaded by Investor/RT 13.3.1 showing symbol: ESM8. |
View |
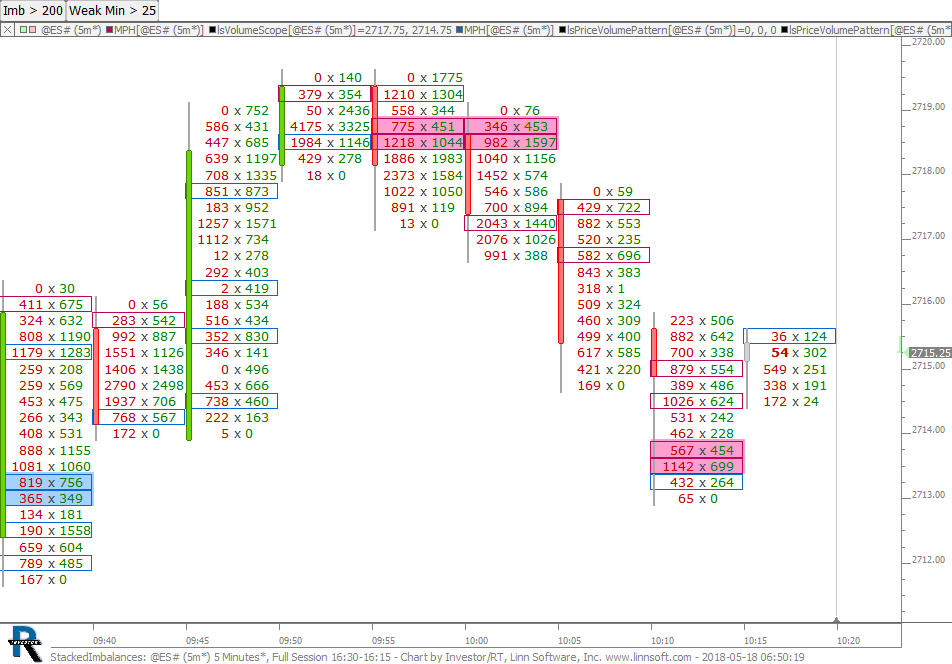 |
StackedImbalances (@ES#) cpayne [totalcount]
8 years 2 months ago
Stacked Imbalances. This chart was uploaded by Investor/RT 13.3.3 showing symbol: @ES#. |
View |
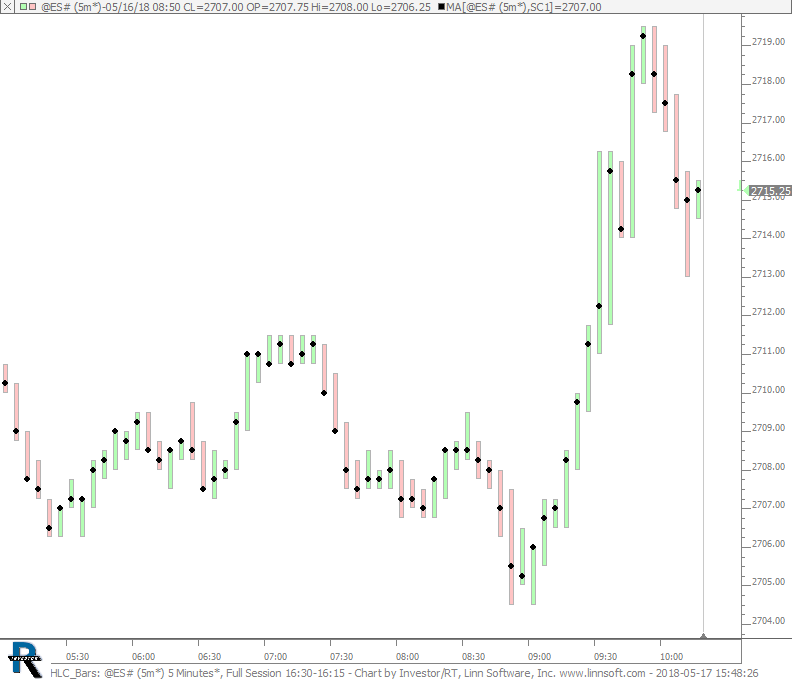 |
HLC Bars (@ES#) cpayne [totalcount]
8 years 2 months ago
HLC Bars. This chart was uploaded by Investor/RT 13.3.3 showing symbol: @ES#. |
View |
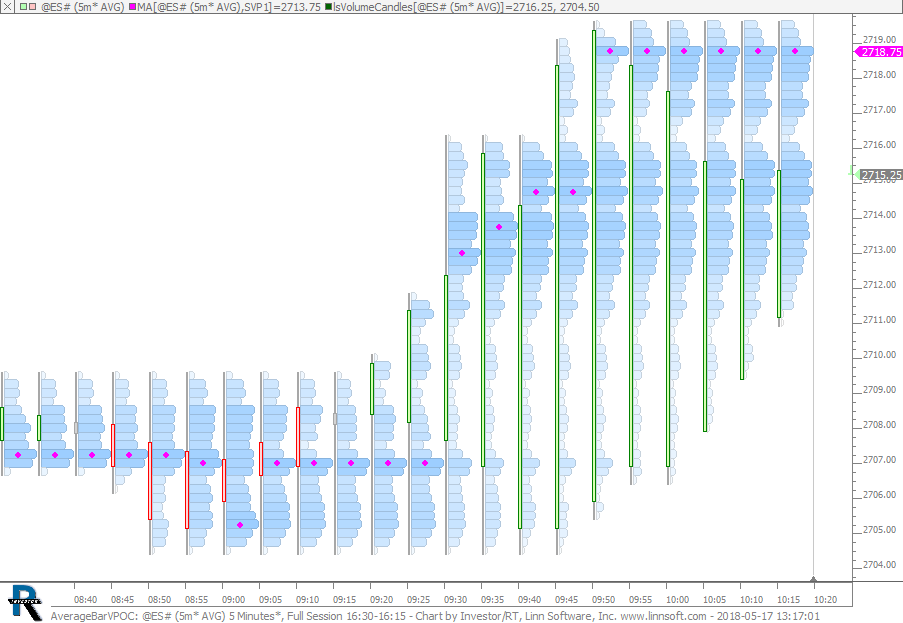 |
AverageBarVPOC (@ES#) cpayne [totalcount]
8 years 2 months ago
Average Bars - VPOC. This chart was uploaded by Investor/RT 13.3.3 showing symbol: @ES#. |
View |
 |
Market profileGlobexWeekly0 (@ES#) ES42 [totalcount]
8 years 2 months ago
This chart was uploaded by Investor/RT 13.3.3 showing symbol: @ES#. |
View |
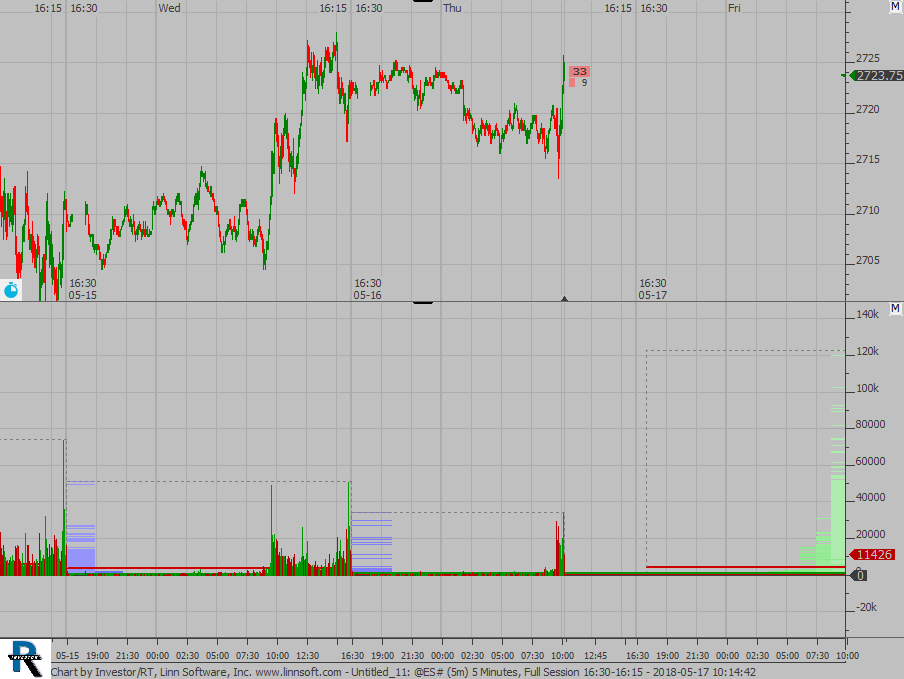 |
Untitled 11 (@ES#) scooke [totalcount]
8 years 2 months ago
This chart was uploaded by Investor/RT 13.3.3 showing symbol: @ES#. |
View |
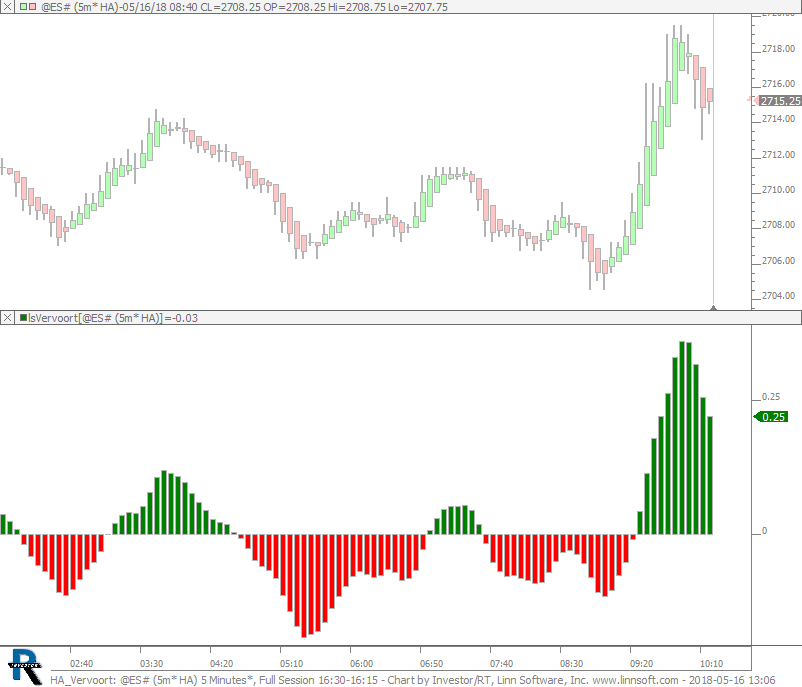 |
HA Vervoort (@ES#) cpayne [totalcount]
8 years 2 months ago
HA Vervoort. This chart was uploaded by Investor/RT 13.3.3 showing symbol: @ES#. |
View |
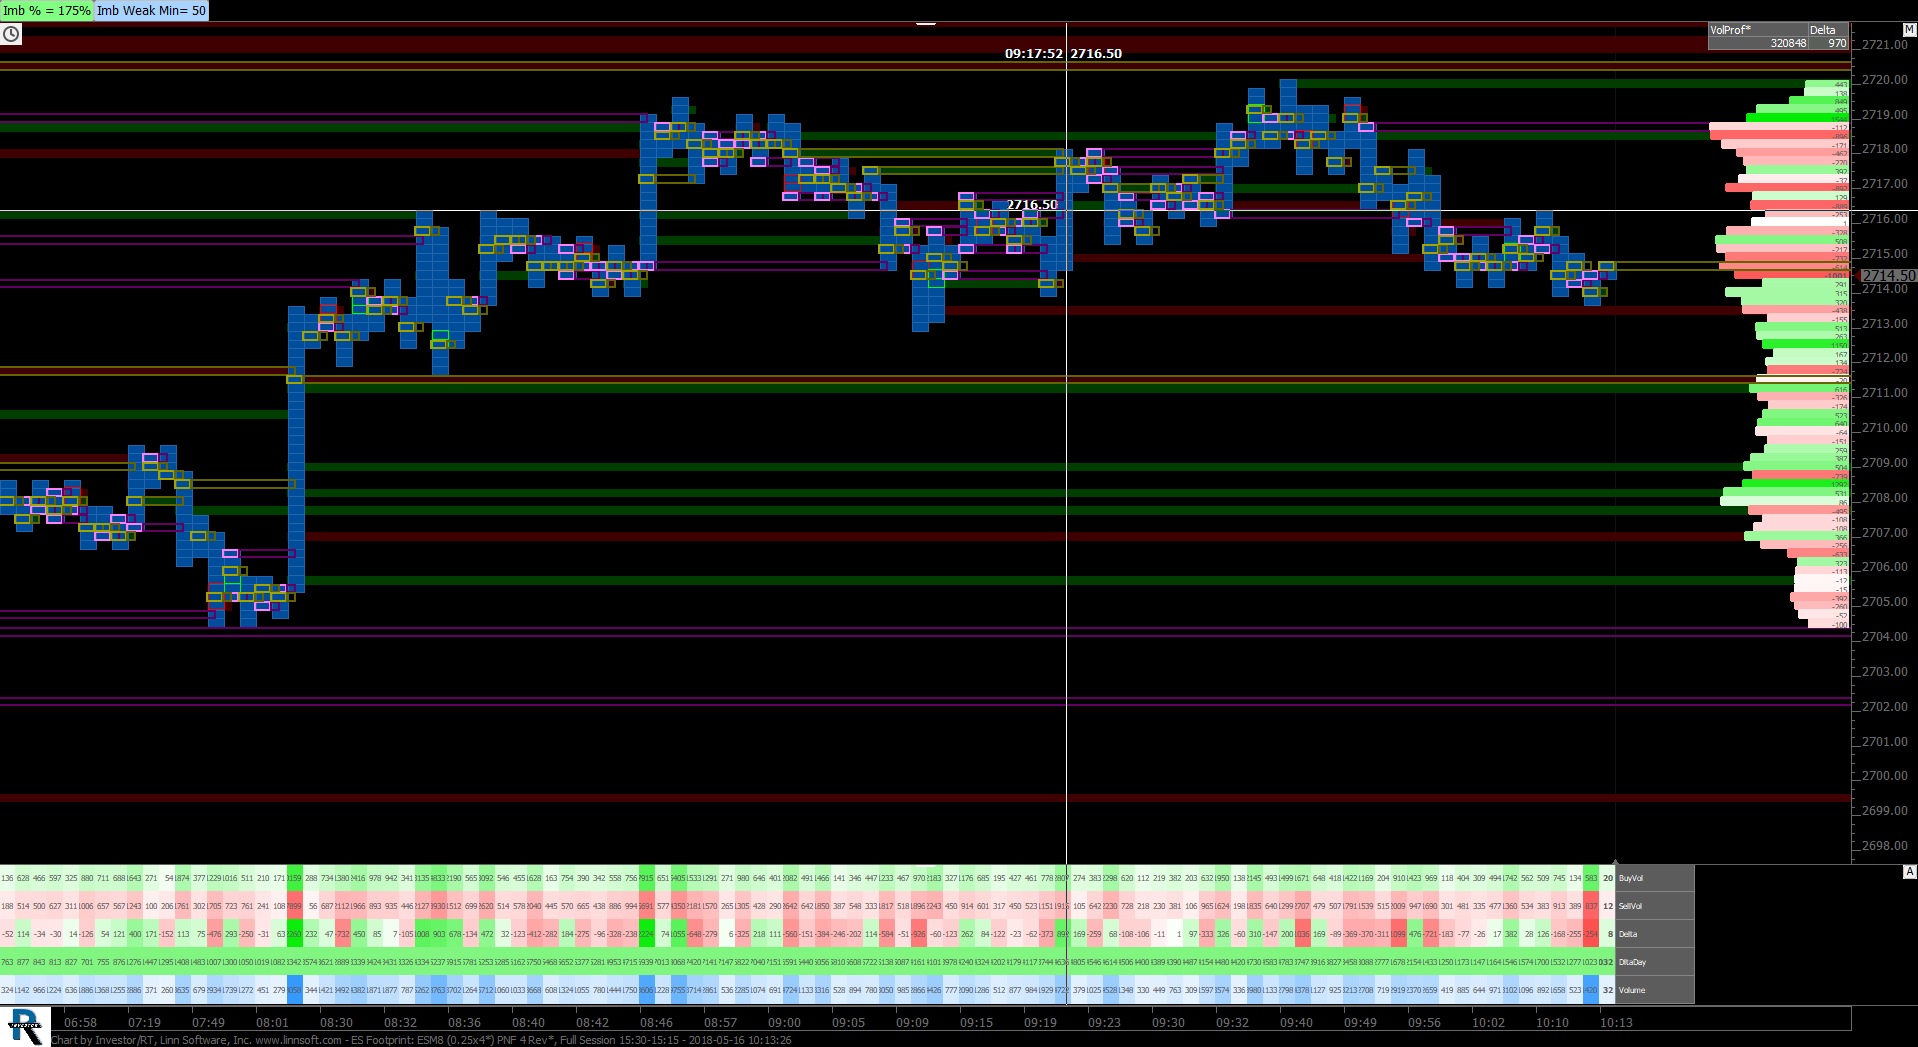 |
ES Footprint (ESM8) scottz46 [totalcount]
8 years 2 months ago
This chart was uploaded by Investor/RT 13.3.3 showing symbol: ESM8. |
View |
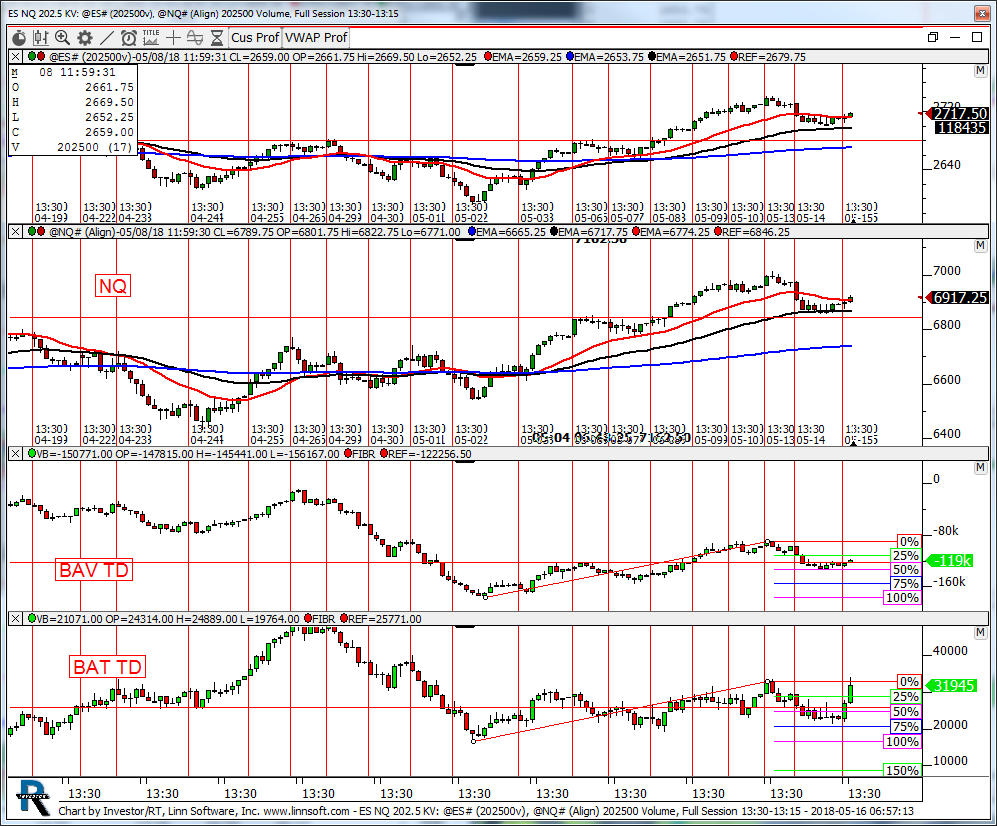 |
ES NQ 2025 KV (@ES#) kencassorla [totalcount]
8 years 2 months ago
202,500 V. This chart was uploaded by Investor/RT 13.3.3 showing symbol: @ES#. |
View |
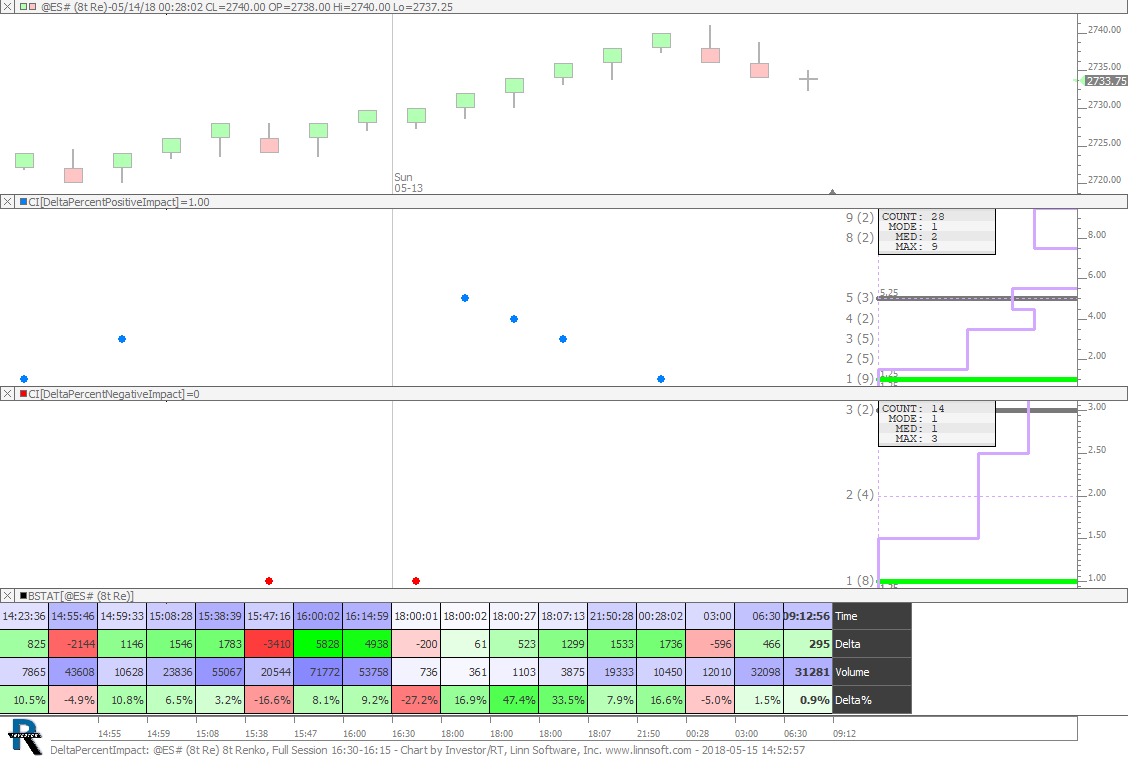 |
DeltaPercentImpact (@ES#) cpayne [totalcount]
8 years 2 months ago
After a Delta Percent Bar of +10% or greater, how many up bars did that generate (include the existing). Same for -10% or lower. |
View |
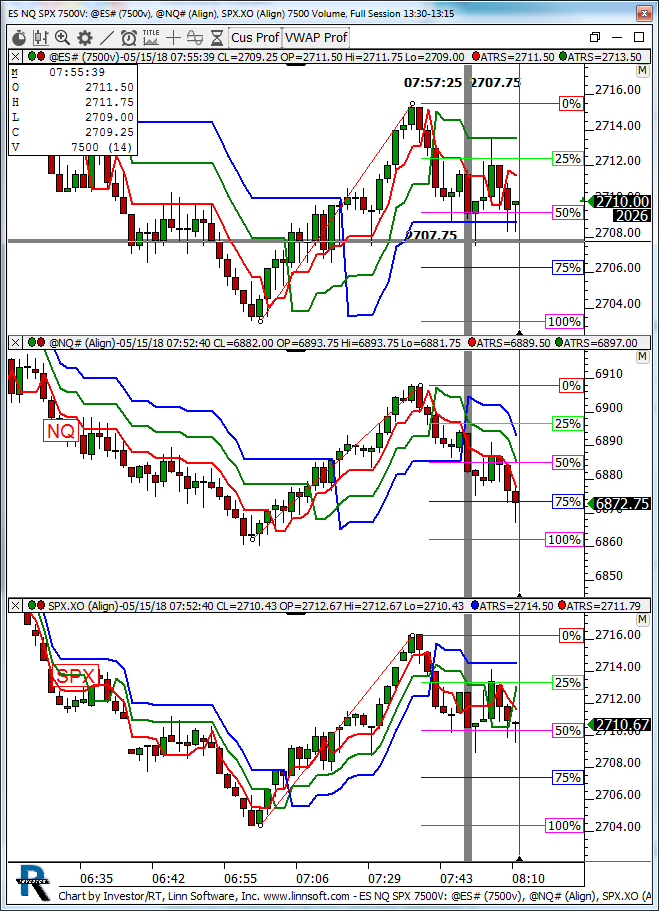 |
ES NQ SPX 7500V (@ES#) kencassorla [totalcount]
8 years 2 months ago
7500v. This chart was uploaded by Investor/RT 13.3.3 showing symbol: @ES#. |
View |
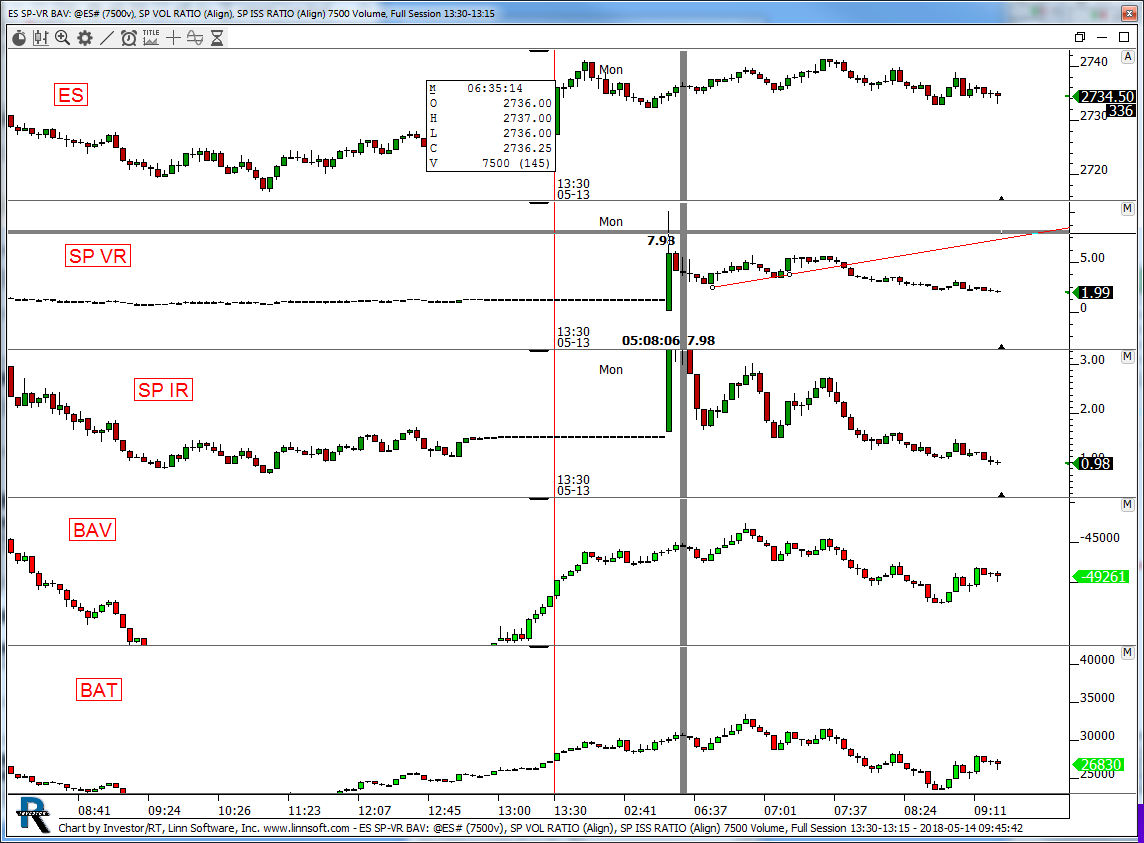 |
ES SP VR BAV (@ES#) kencassorla [totalcount]
8 years 2 months ago
7500. This chart was uploaded by Investor/RT 13.3.3 showing symbol: @ES#. |
View |
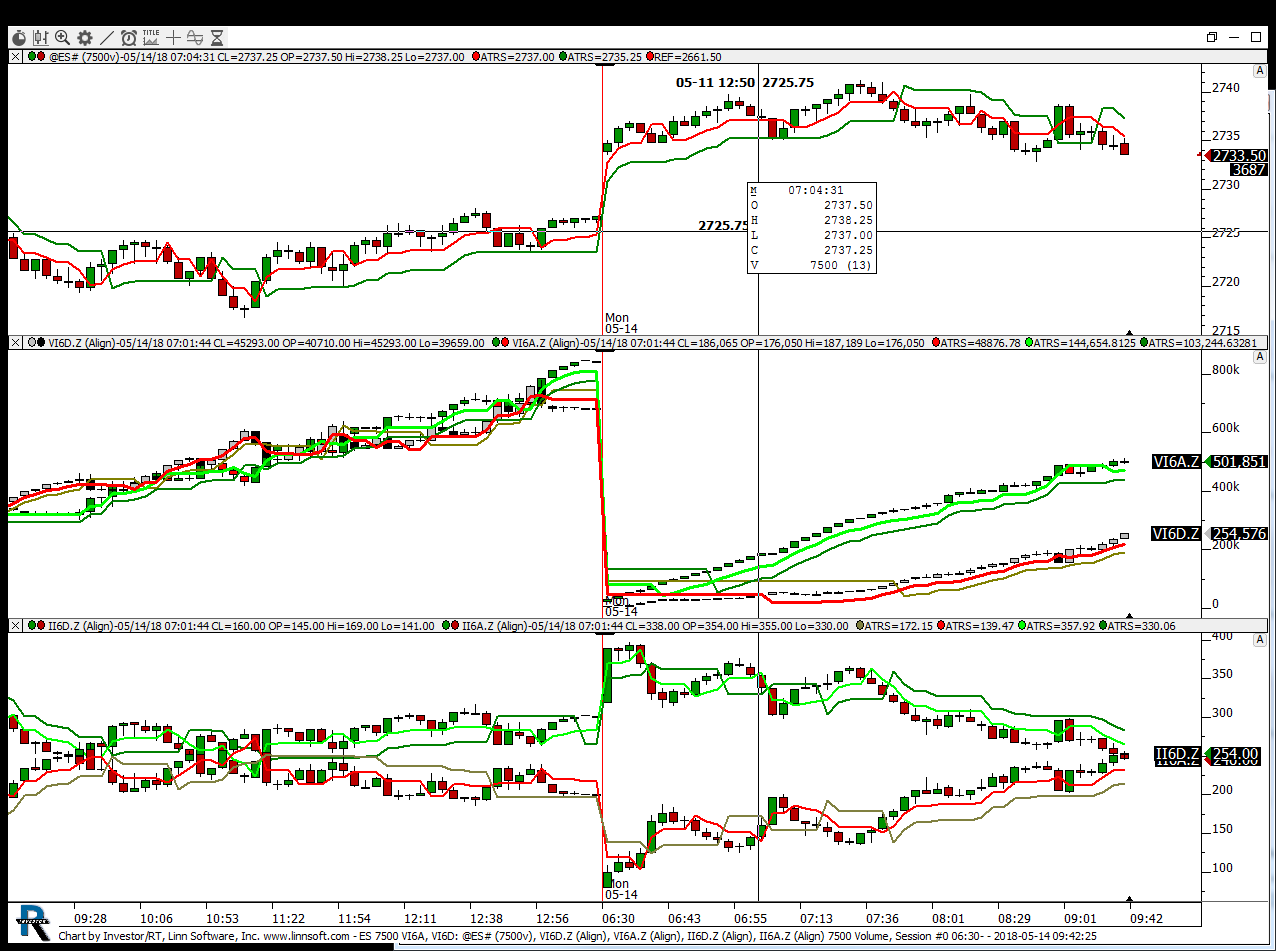 |
ES 7500 VI6A VI6D (@ES#) kencassorla [totalcount]
8 years 2 months ago
7500. This chart was uploaded by Investor/RT 13.3.3 showing symbol: @ES#. |
View |
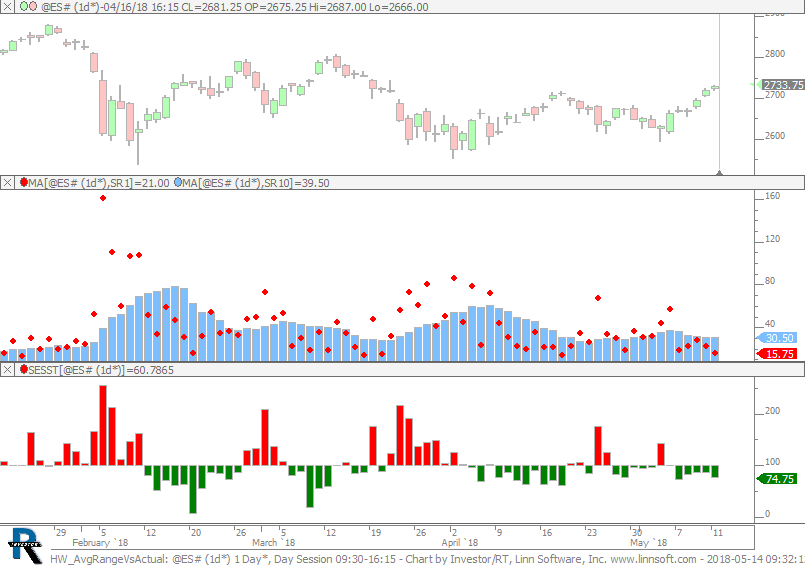 |
HW AvgRangeVsActual (@ES#) cpayne [totalcount]
8 years 2 months ago
Actual Range (Red) vs 10 day Average Range (blue histogram). This chart was uploaded by Investor/RT 13.3.3 showing symbol: @ES#. |
View |
 |
Untitled 2 (DSXM8) sniper [totalcount]
8 years 2 months ago
This chart was uploaded by Investor/RT 13.3.3 showing symbol: DSXM8. |
View |
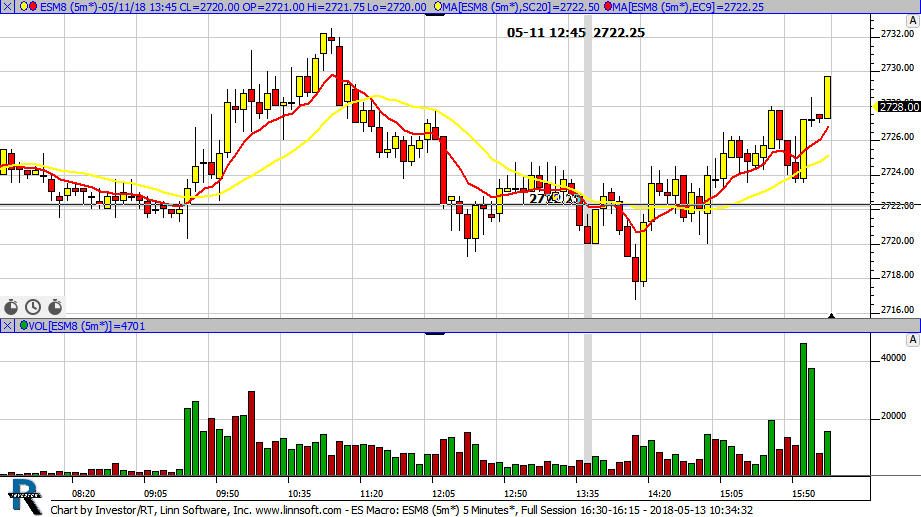 |
ES Macro (ESM8) Quantum Leap [totalcount]
8 years 2 months ago
This chart was uploaded by Investor/RT 13.3.3 showing symbol: ESM8. |
View |