 |
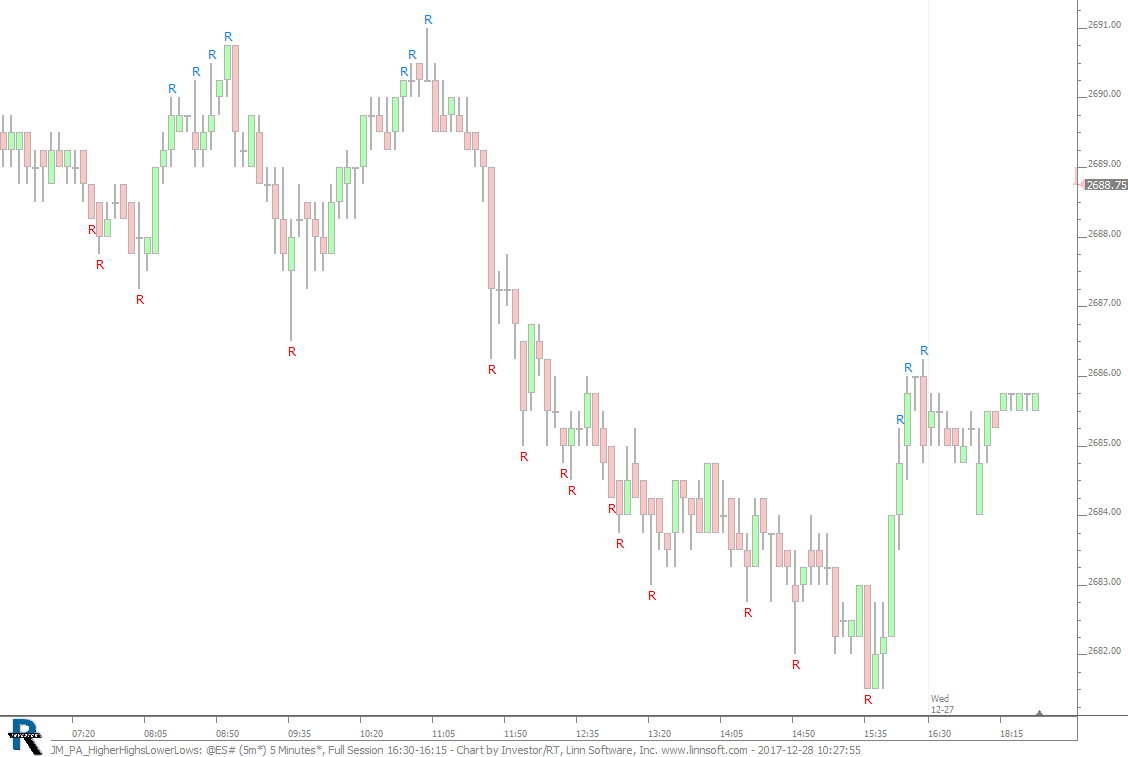
JM PA HigherHighsLowerLows (@ES#) cpayne [totalcount]
8 years 7 months ago
Higher Highs and Lower Lows (20 Bar). This chart was uploaded by Investor/RT 13.1.4 showing symbol: @ES#. |
View |
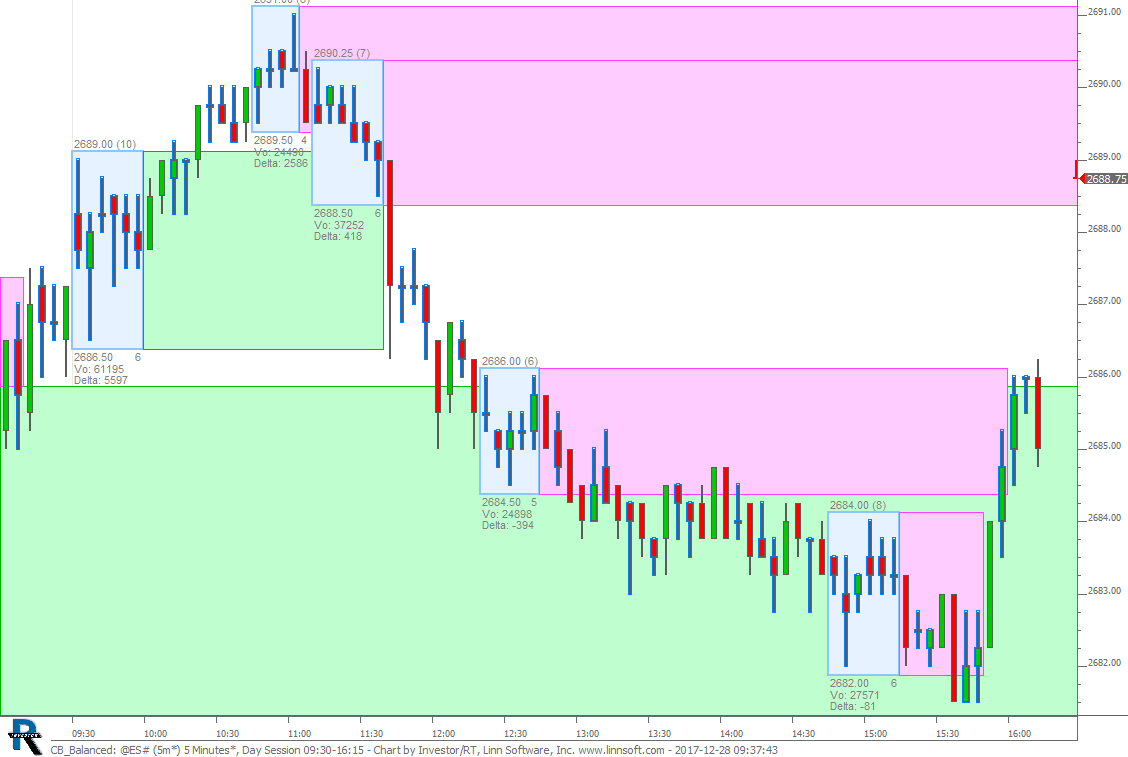 |
CB Balanced (@ES#) cpayne [totalcount]
8 years 7 months ago
Balanced Candles. This chart was uploaded by Investor/RT 13.1.4 showing symbol: @ES#. |
View |
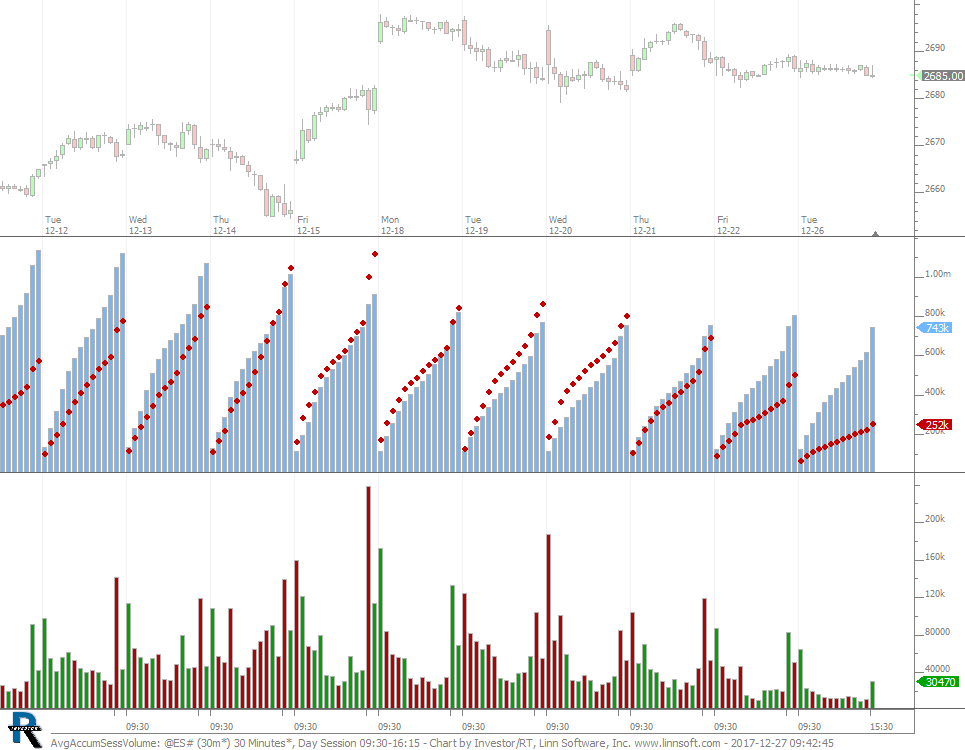 |
AvgAccumSessVolume (@ES#) cpayne [totalcount]
8 years 7 months ago
Average accumulated session volume. This chart was uploaded by Investor/RT 13.1.4 showing symbol: @ES#. |
View |
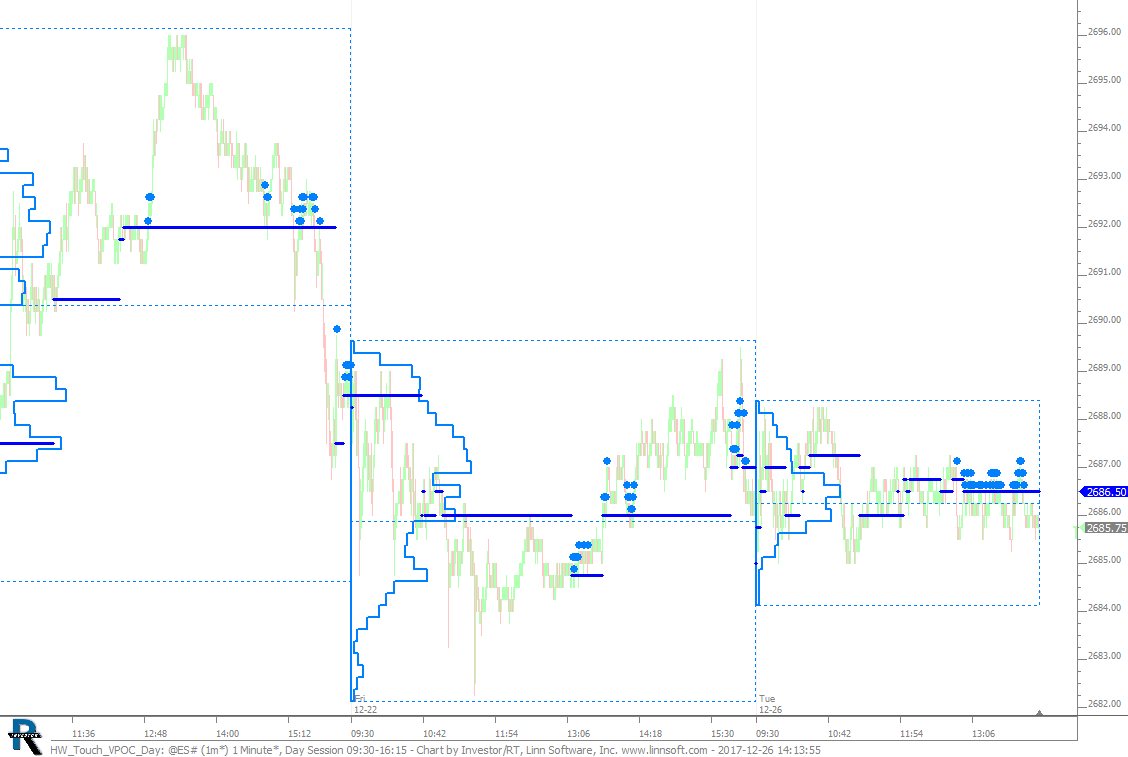 |
HW Touch VPOC Day (@ES#) cpayne [totalcount]
8 years 7 months ago
Touch VPOC after 200 Minutes. This chart was uploaded by Investor/RT 13.1.4 showing symbol: @ES#. |
View |
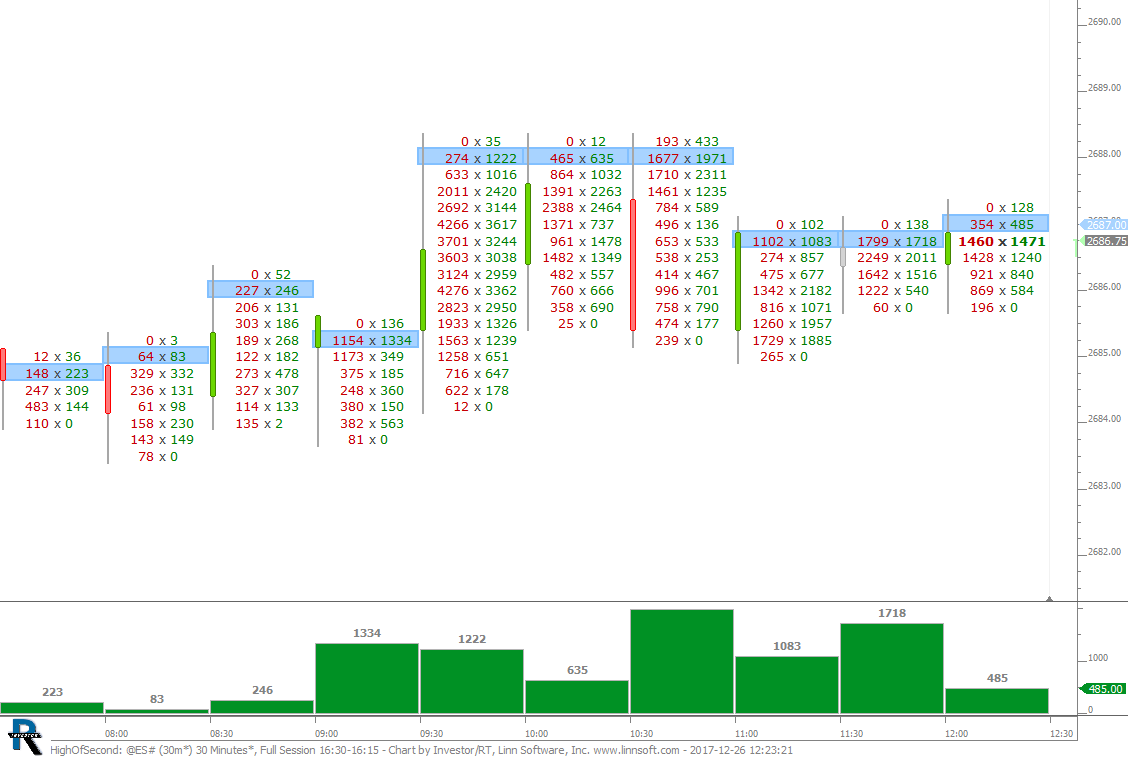 |
HighOfSecond (@ES#) cpayne [totalcount]
8 years 7 months ago
High Of Second Price. This chart was uploaded by Investor/RT 13.1.4 showing symbol: @ES#. |
View |
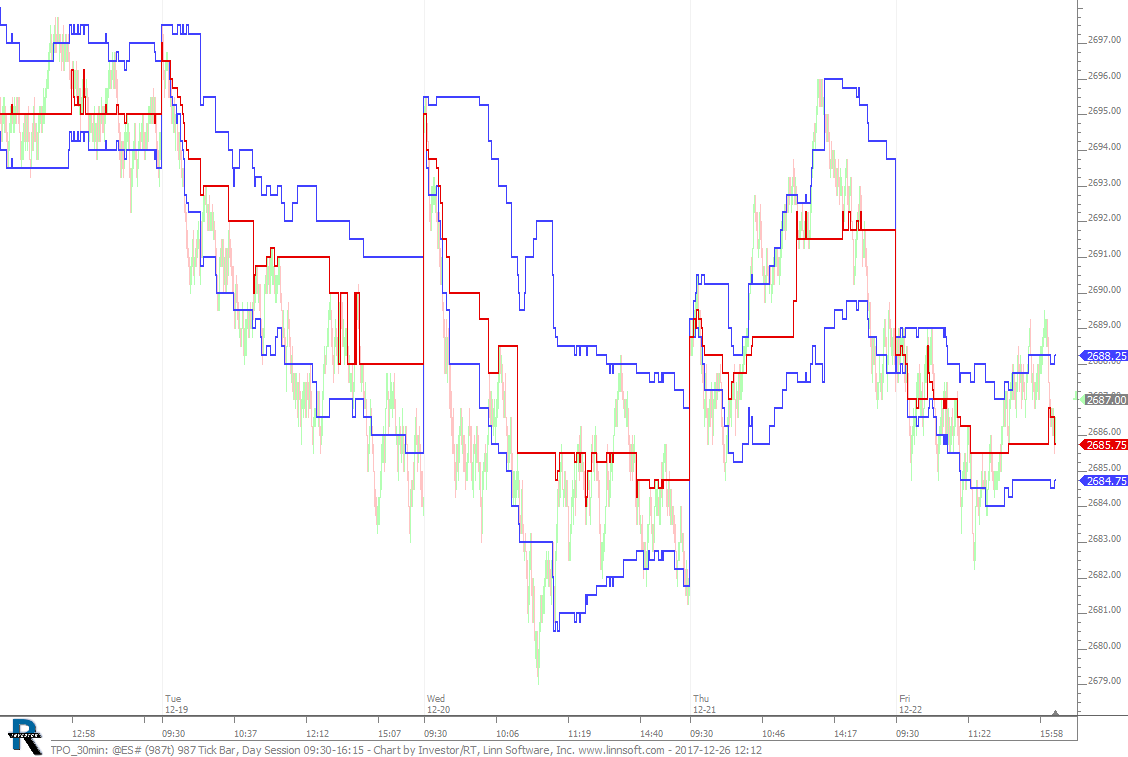 |
TPO 30min (@ES#) cpayne [totalcount]
8 years 7 months ago
TPO 30 minute on 987 tickbars. This chart was uploaded by Investor/RT 13.1.4 showing symbol: @ES#. |
View |
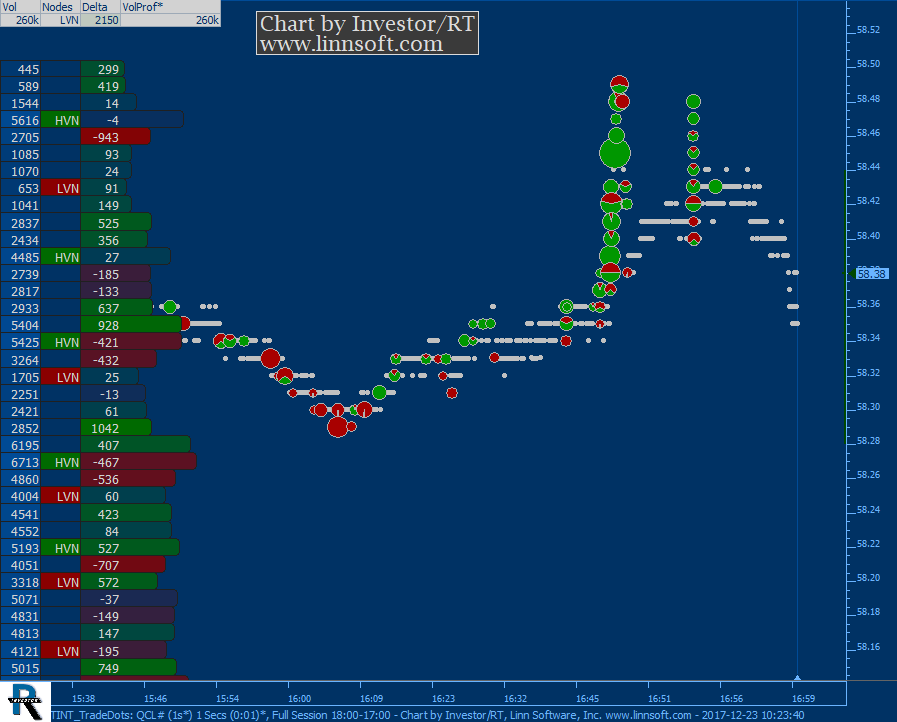 |
TINT TradeDots (QCL#) cpayne [totalcount]
8 years 7 months ago
Trail of Intentions with Trade Dots. This chart was uploaded by Investor/RT 13.1.4 showing symbol: QCL#. |
View |
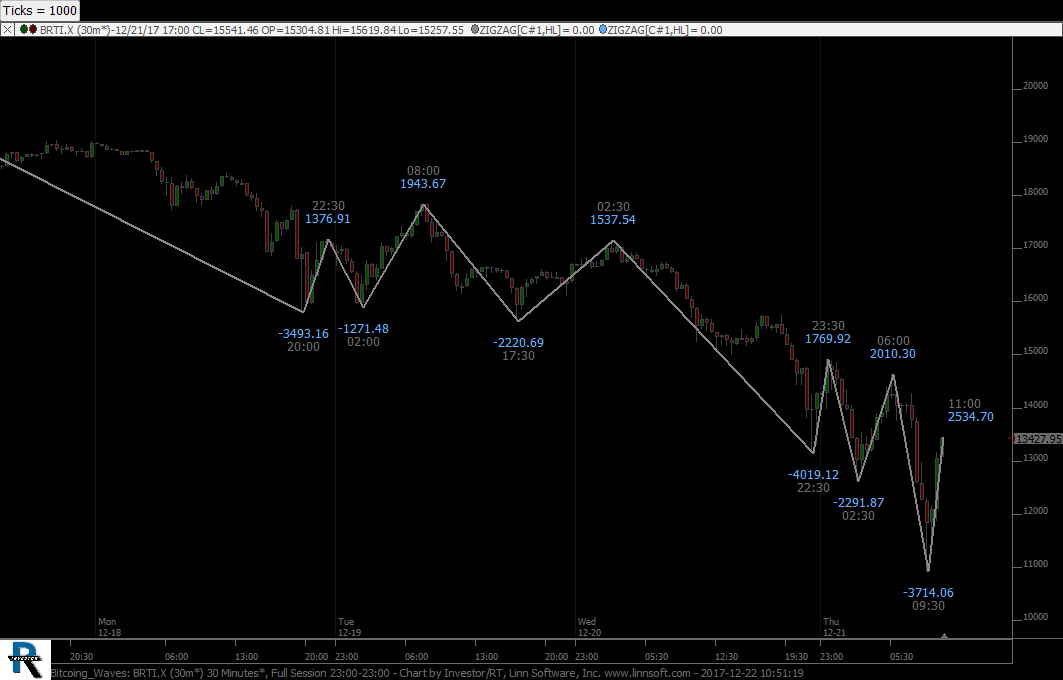 |
Bitcoing Waves (BRTI.X) cpayne [totalcount]
8 years 7 months ago
Bitcoin Waves. This chart was uploaded by Investor/RT 13.1.4 showing symbol: BRTI.X. |
View |
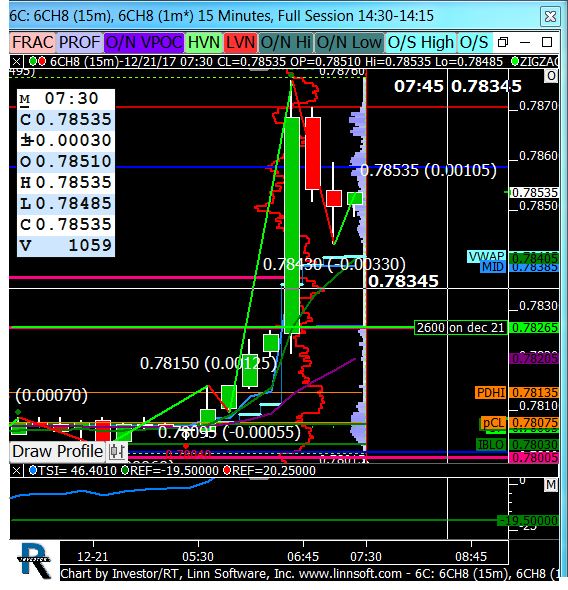 |
6C (6CH8) gurindergrewal99 [totalcount]
8 years 7 months ago
This chart was uploaded by Investor/RT 13.1.4 showing symbol: 6CH8. |
View |
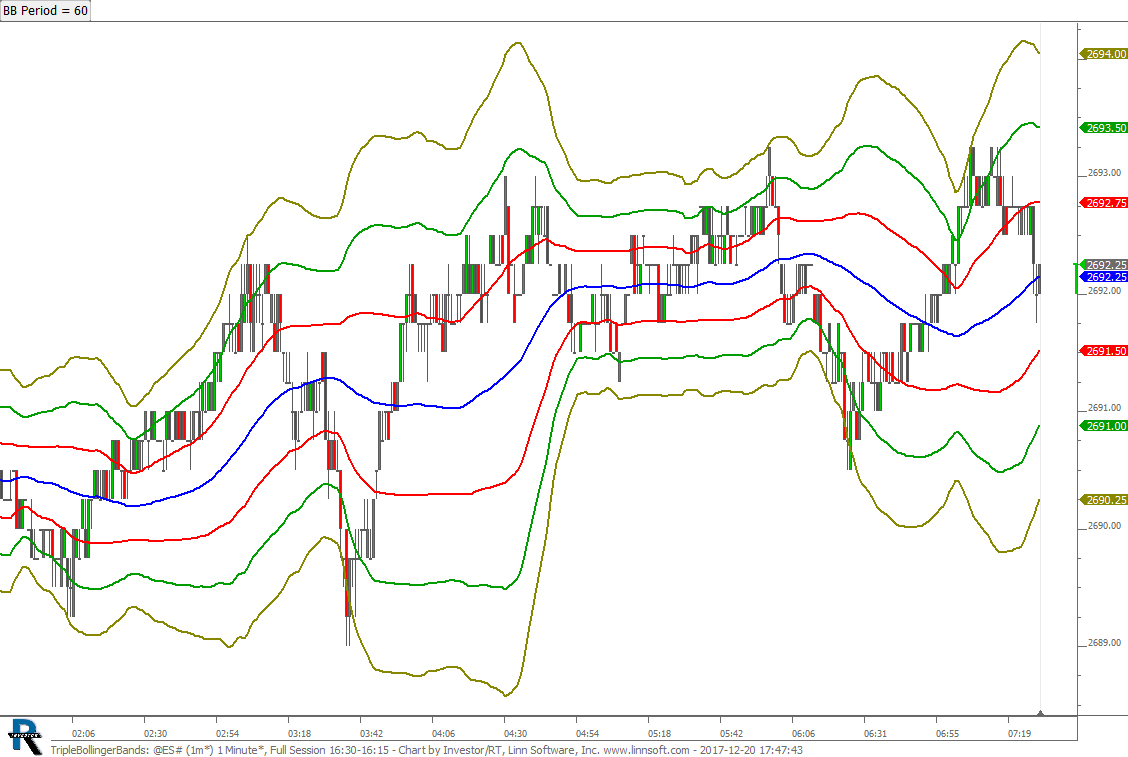 |
TripleBollingerBands (@ES#) cpayne [totalcount]
8 years 7 months ago
Triple Bollinger Bands. This chart was uploaded by Investor/RT 13.1.4 showing symbol: @ES#. |
View |
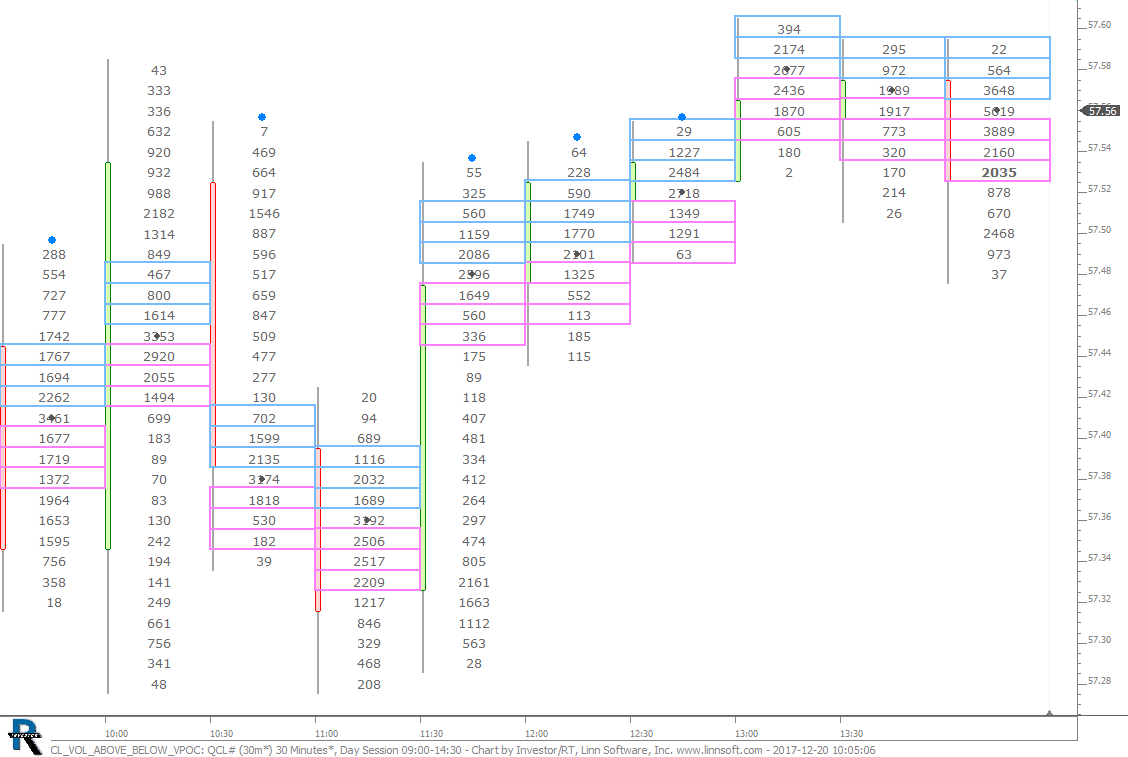 |
CL VOL ABOVE BELOW VPOC (QCL#) cpayne [totalcount]
8 years 7 months ago
This chart was uploaded by Investor/RT 13.1.4 showing symbol: QCL#. |
View |
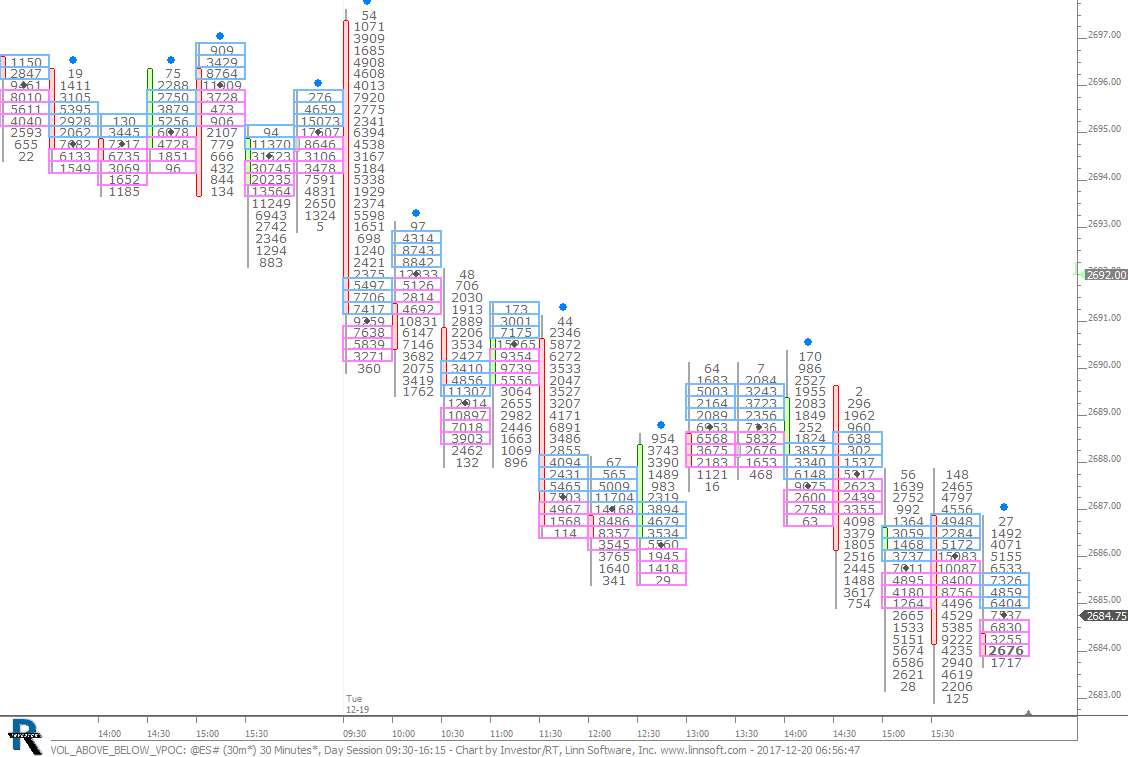 |
VOL ABOVE BELOW VPOC (@ES#) cpayne [totalcount]
8 years 7 months ago
Volume 3 Prices Above and Below VPOC. This chart was uploaded by Investor/RT 13.1.4 showing symbol: @ES#. |
View |
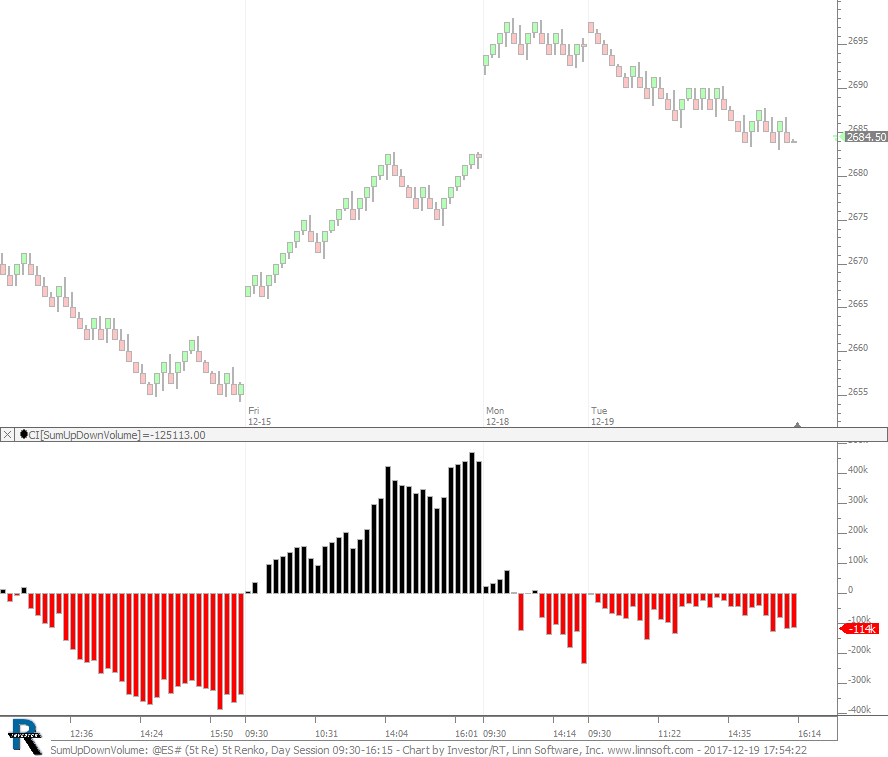 |
SumUpDownVolume (@ES#) cpayne [totalcount]
8 years 7 months ago
Sum Up Down Volume for Session. This chart was uploaded by Investor/RT 13.1.4 showing symbol: @ES#. |
View |
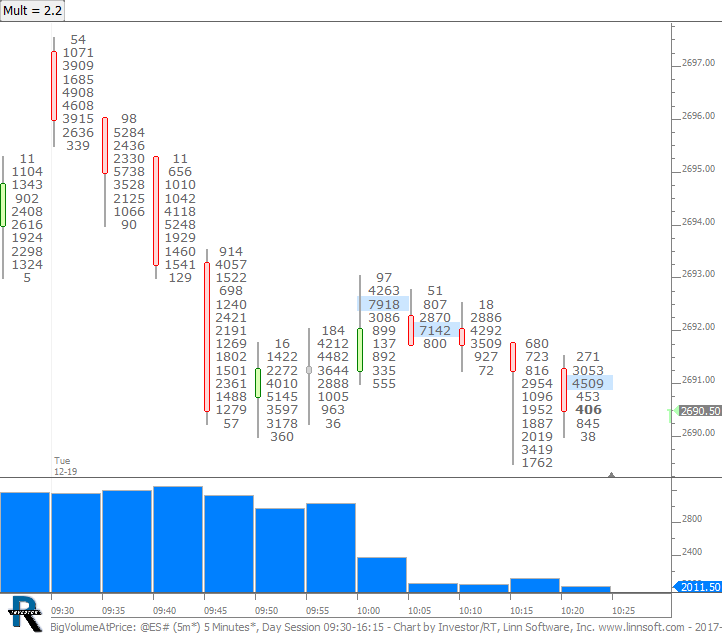 |
BigVolumeAtPrice (@ES#) cpayne [totalcount]
8 years 7 months ago
Chart identifies large volume at price relative to average volume at price of previous 9 bars. Use button to control multiplier. |
View |
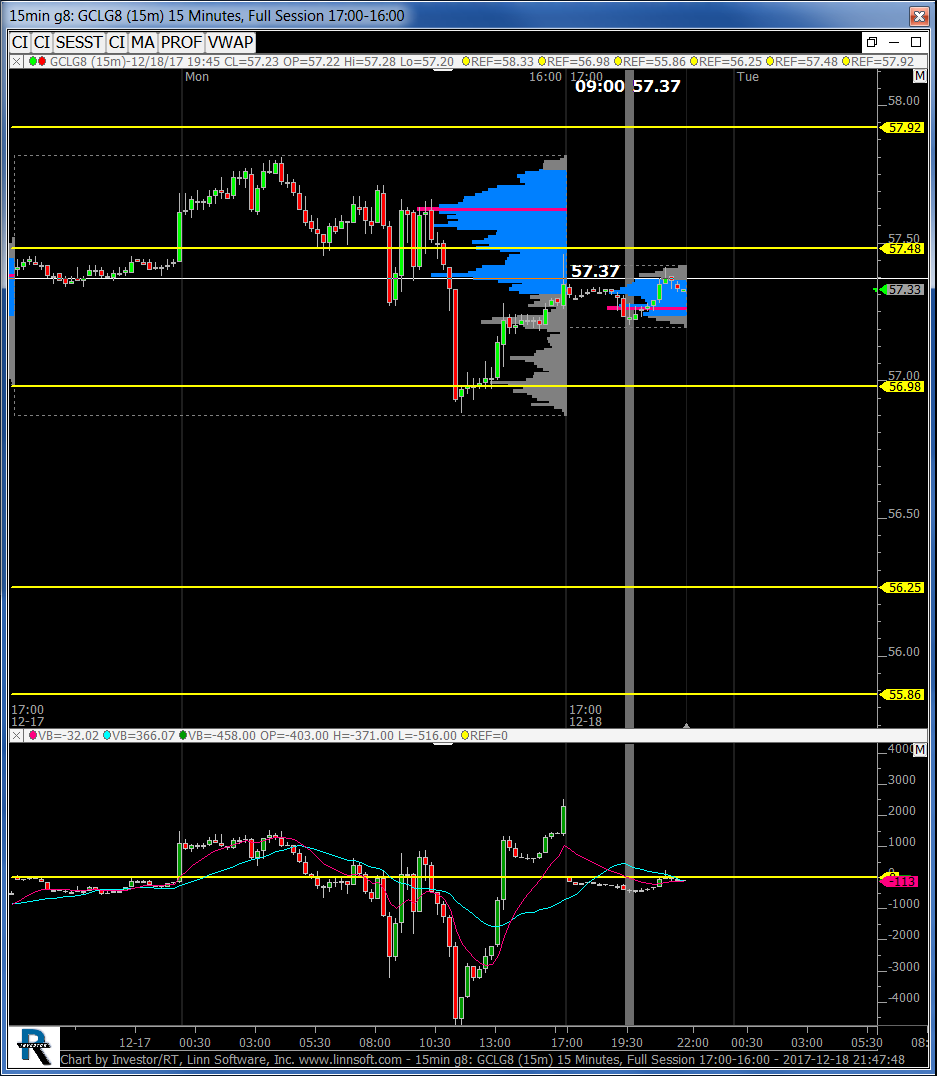 |
15min g8 (GCLG8) kpd332 [totalcount]
8 years 7 months ago
15 min g8. This chart was uploaded by Investor/RT 13.1.2 showing symbol: GCLG8. |
View |
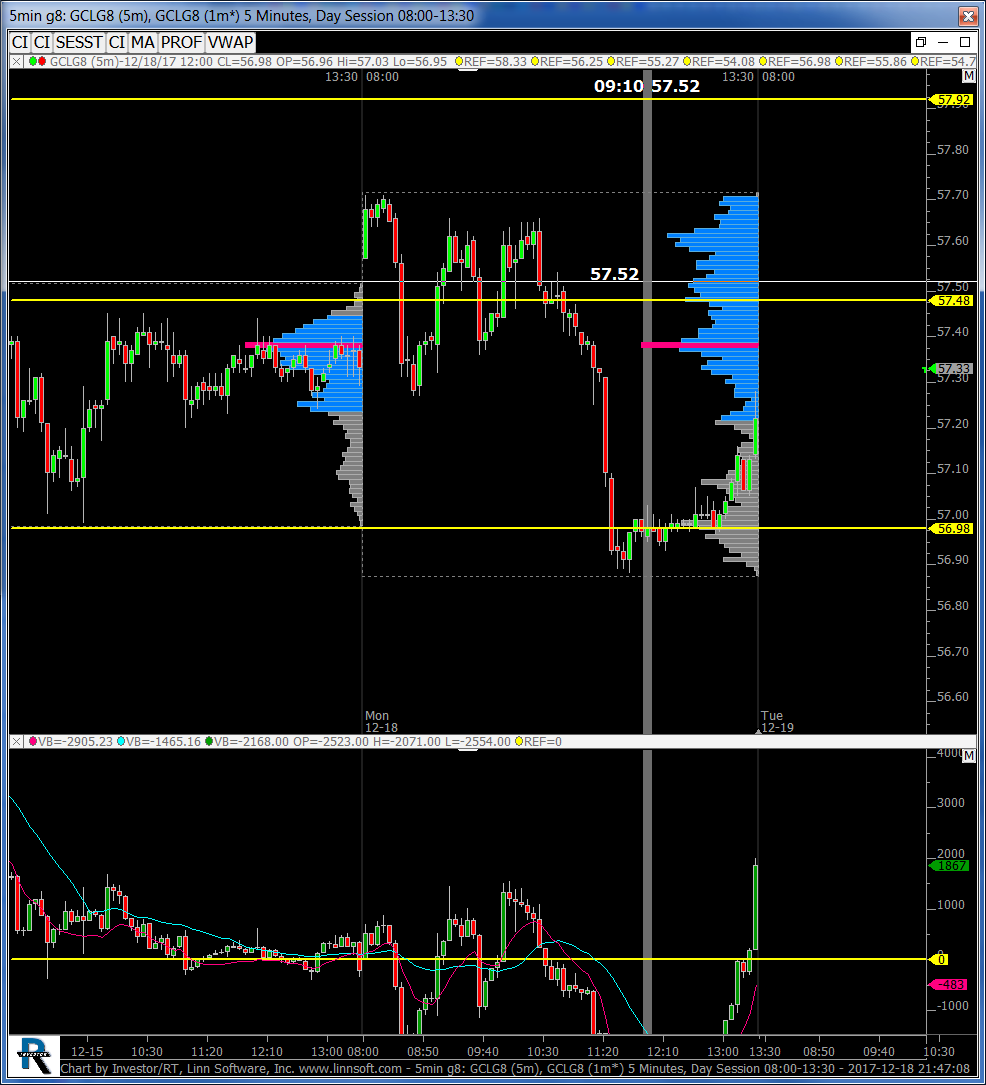 |
5min g8 (GCLG8) kpd332 [totalcount]
8 years 7 months ago
5m g8. This chart was uploaded by Investor/RT 13.1.2 showing symbol: GCLG8. |
View |
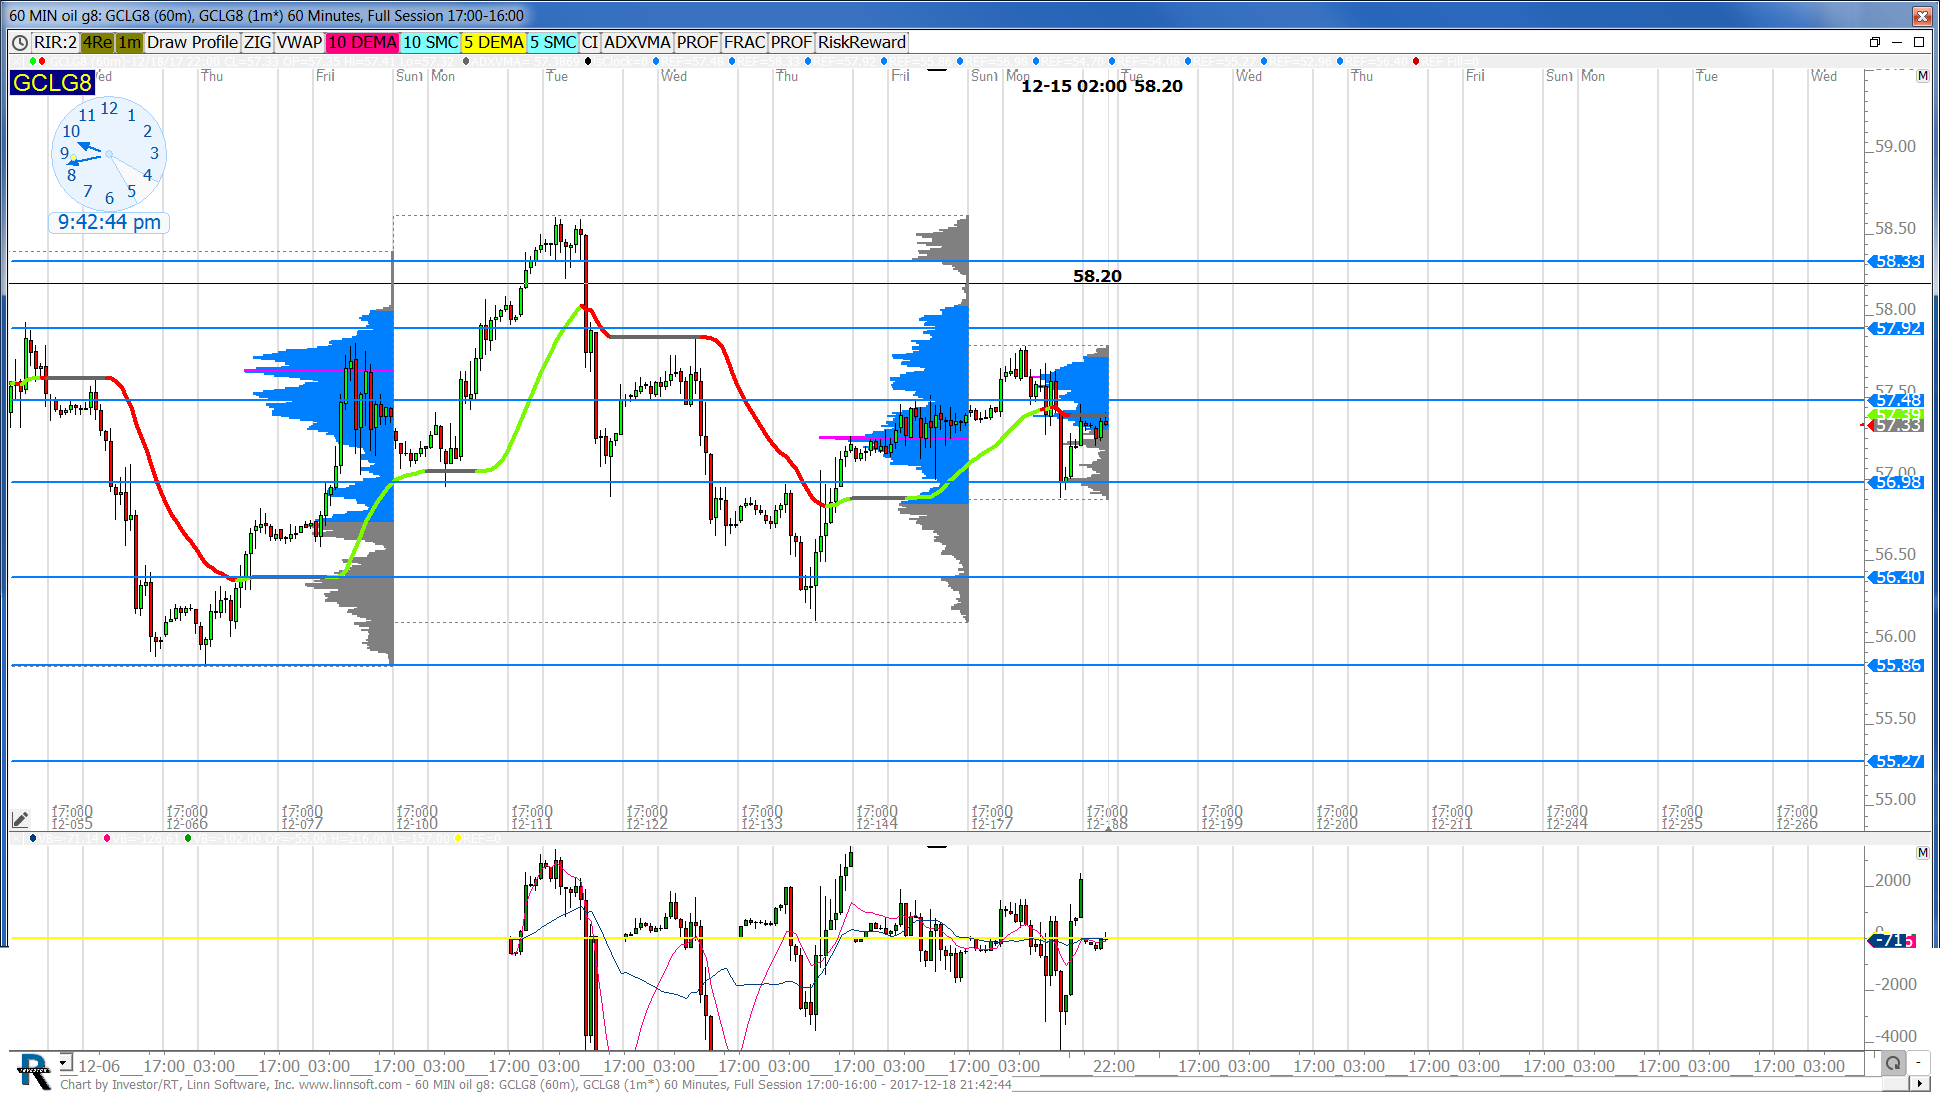 |
60 MIN oil g8 (GCLG8) kpd332 [totalcount]
8 years 7 months ago
60. This chart was uploaded by Investor/RT 13.1.2 showing symbol: GCLG8. |
View |
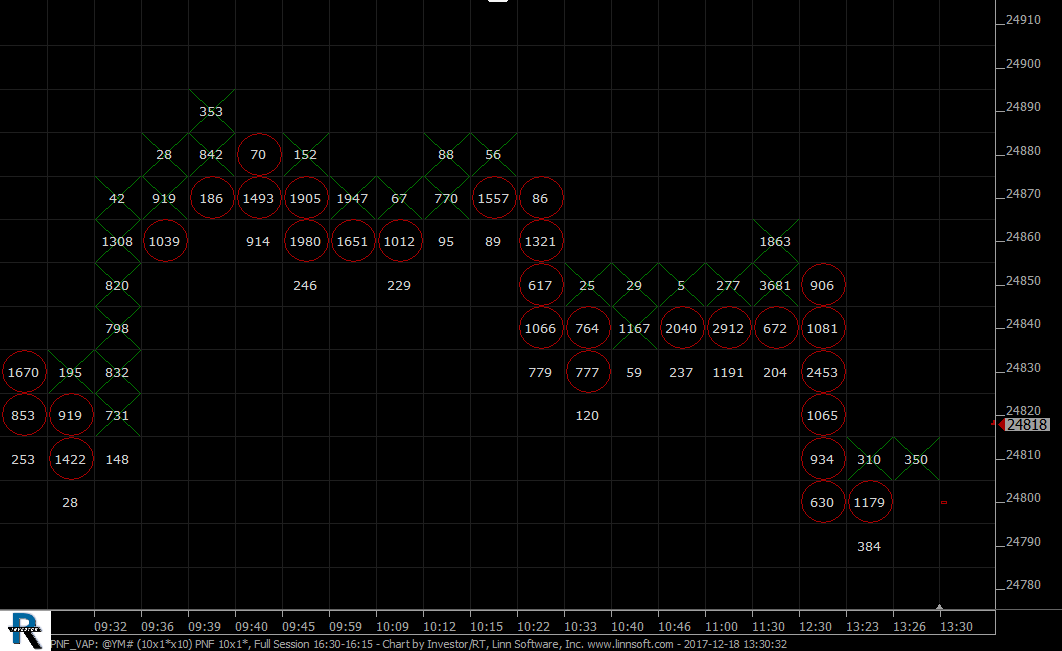 |
PNF VAP (@YM#) cpayne [totalcount]
8 years 7 months ago
Point and Figure with Volume at Price. This chart was uploaded by Investor/RT 13.1.4 showing symbol: @YM#. |
View |
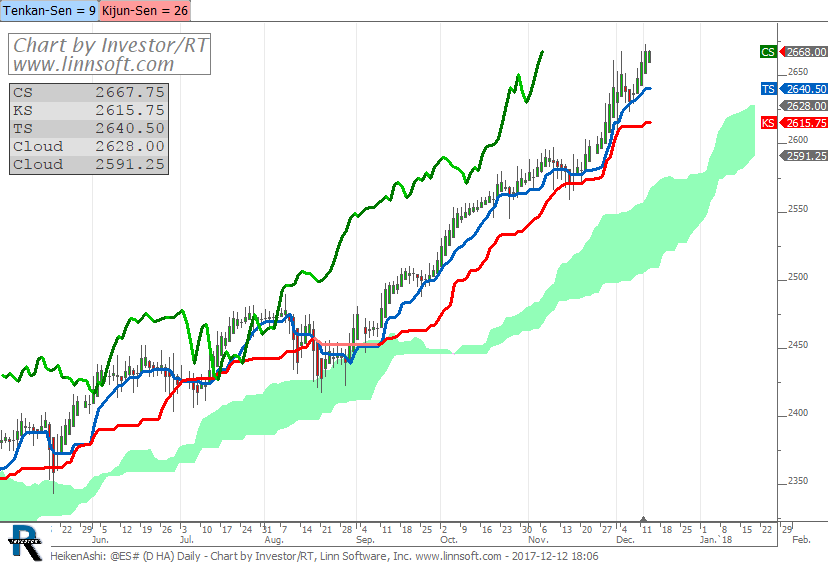 |
HeikenAshi (@ES#) cpayne [totalcount]
8 years 7 months ago
Heiken-Ashi with Ichimoku Kinko Hyo. This chart was uploaded by Investor/RT 13.1.1 showing symbol: @ES#. |
View |
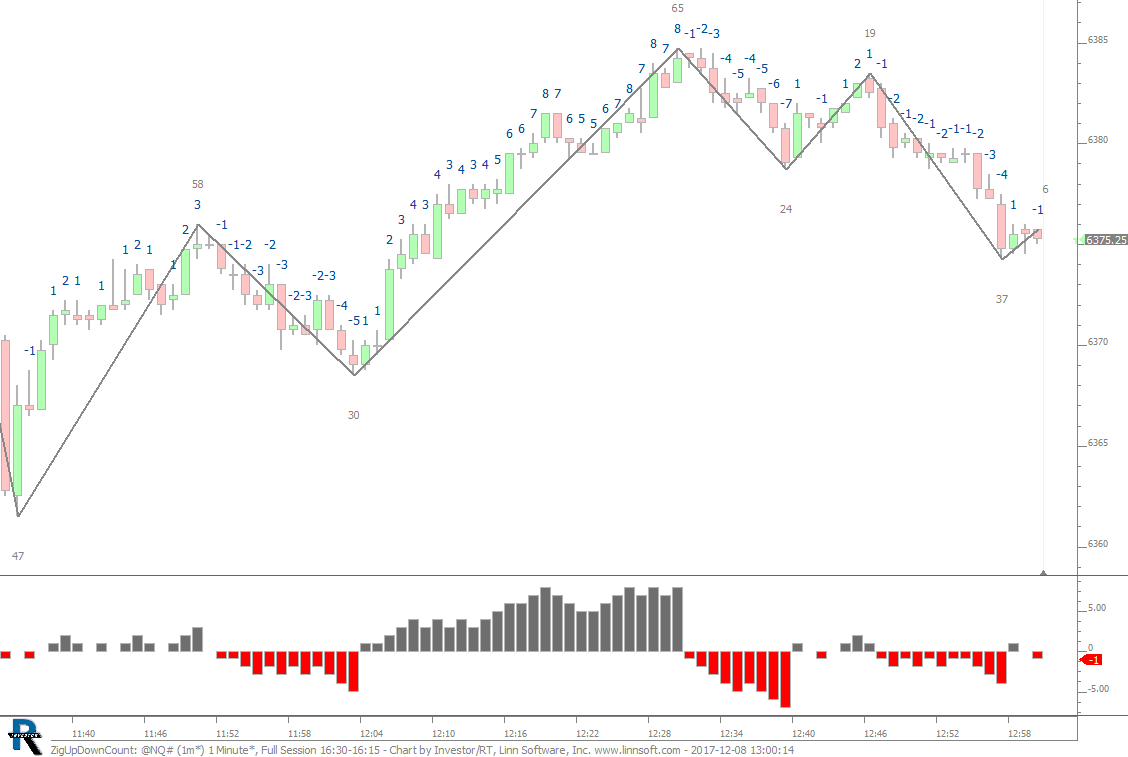 |
ZigUpDownCount (@NQ#) cpayne [totalcount]
8 years 7 months ago
Counting Cumulative Up and Down Bars In Each Move. This chart was uploaded by Investor/RT 13.1.1 showing symbol: @NQ#. |
View |
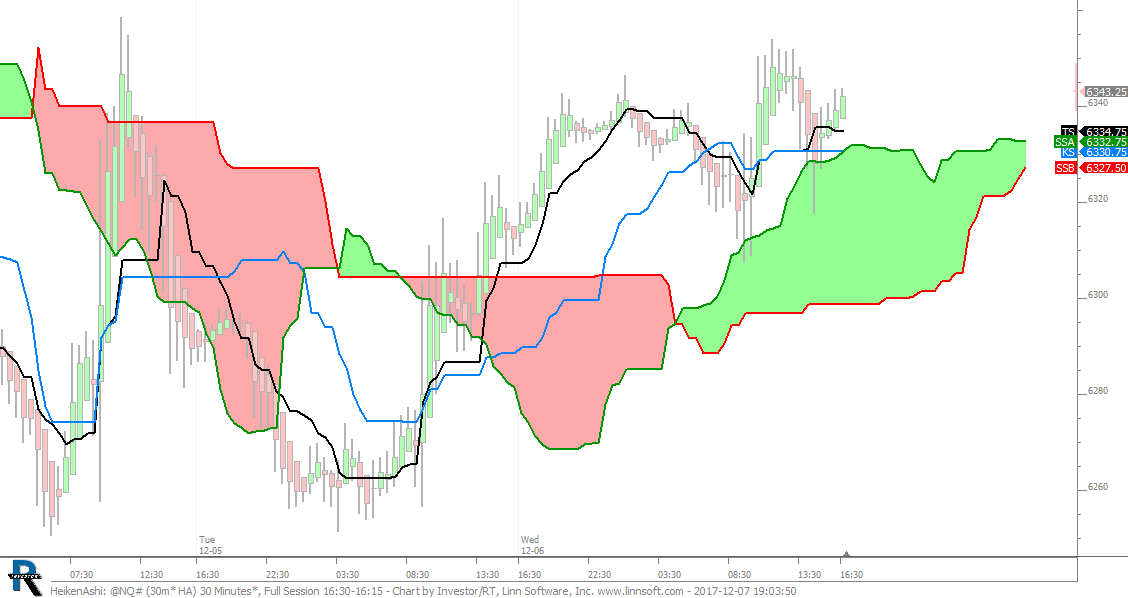 |
HeikenAshi (@NQ#) cpayne [totalcount]
8 years 7 months ago
Heiken-Ashi with Ichimoku Kinko Hyo. This chart was uploaded by Investor/RT 13.1.1 showing symbol: @NQ#. |
View |
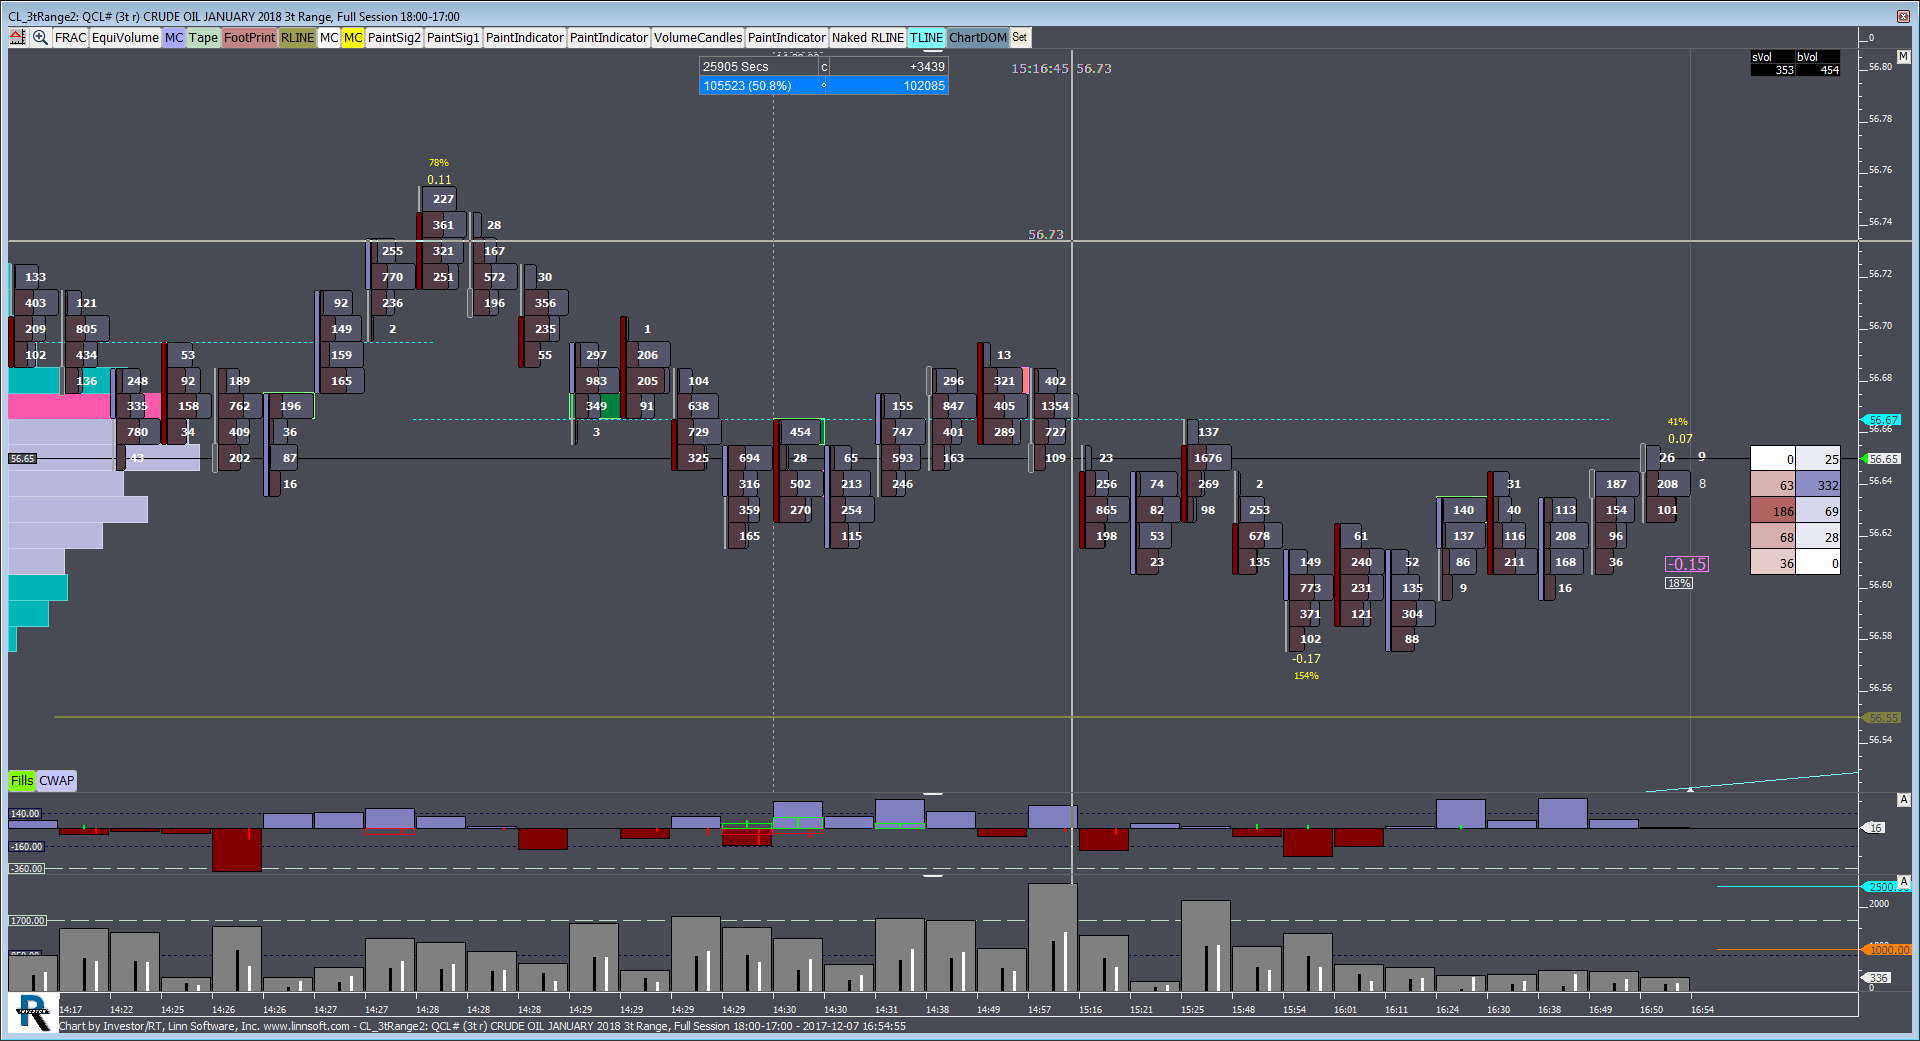 |
CL 3tRange (QCL#) jayski51369 [totalcount]
8 years 7 months ago
This chart was uploaded by Investor/RT 13.1.2 showing symbol: QCL#. |
View |
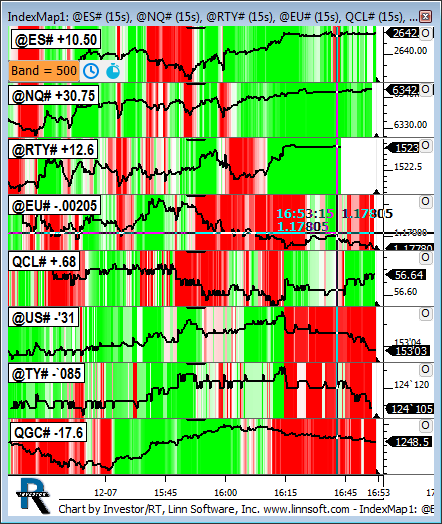 |
IndexMap (@ES#) jayski51369 [totalcount]
8 years 7 months ago
This chart was uploaded by Investor/RT 12.7.6 showing symbol: @ES#. |
View |
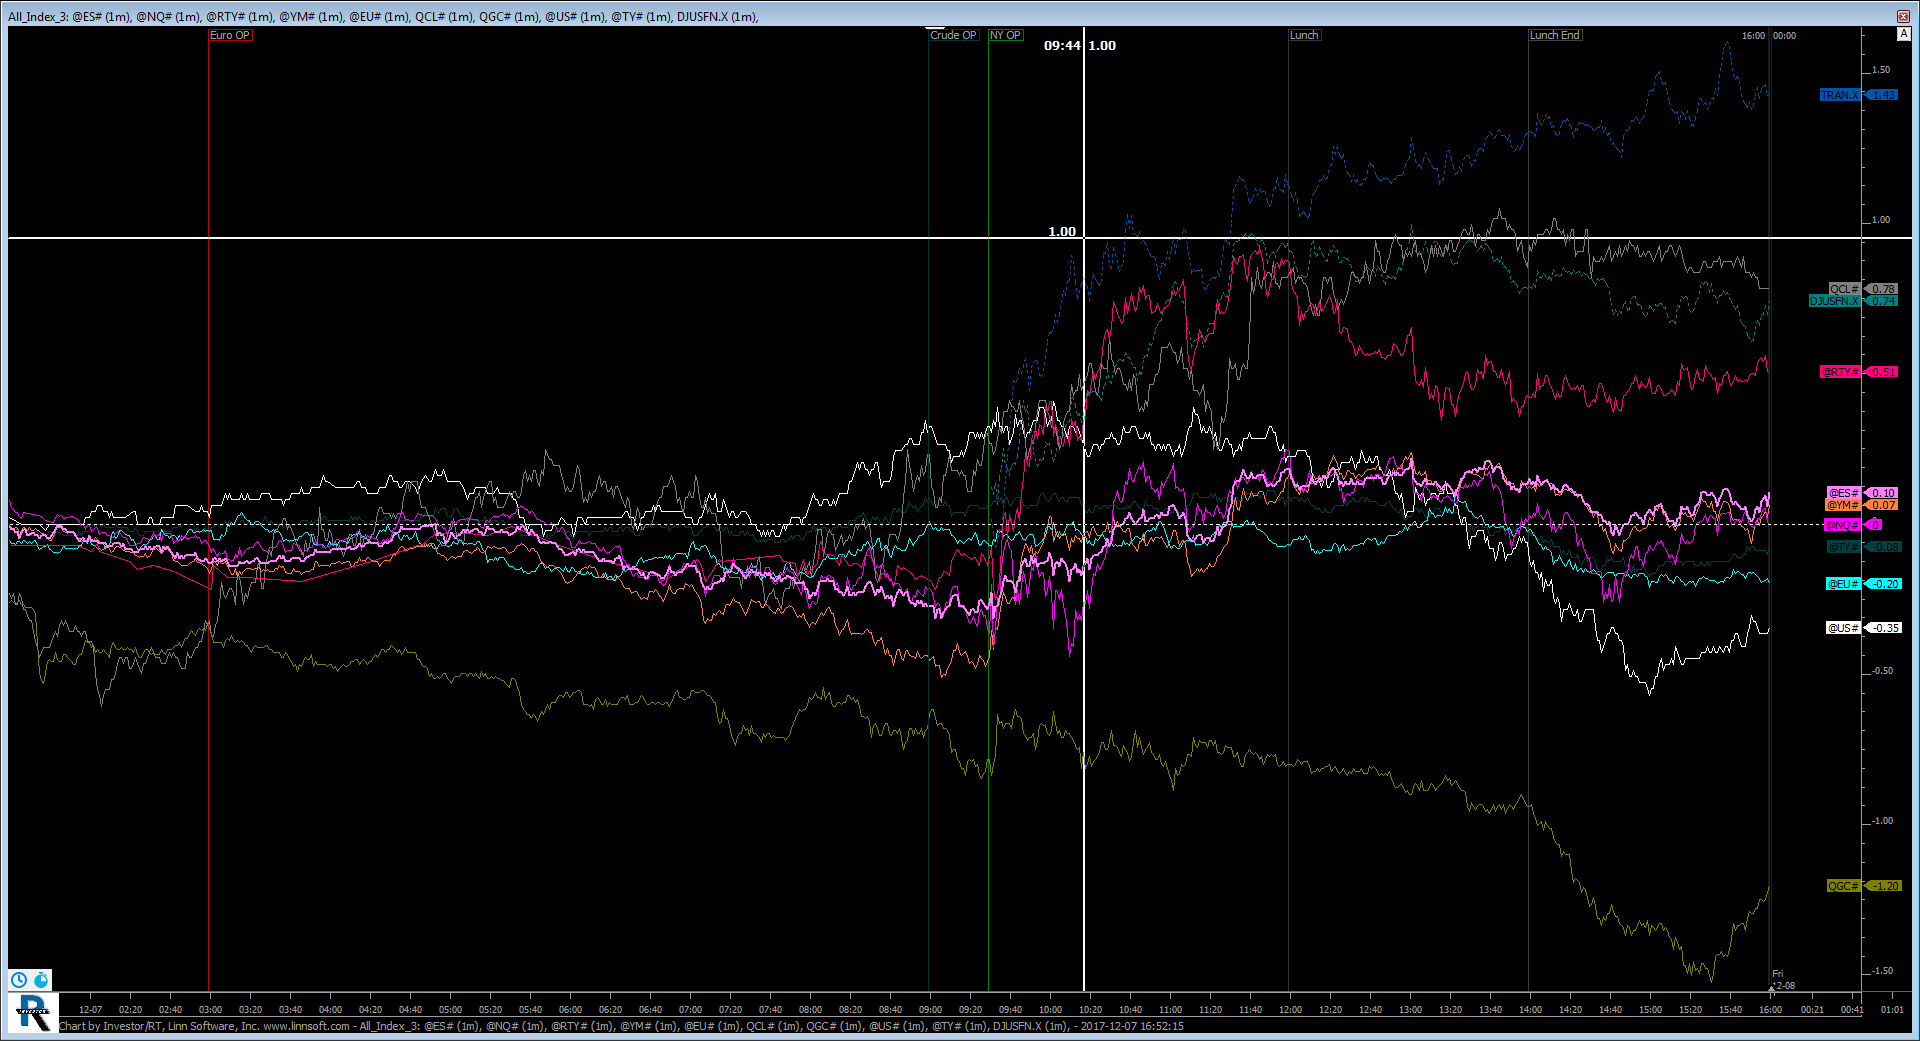 |
All Index (@ES#) jayski51369 [totalcount]
8 years 7 months ago
This chart was uploaded by Investor/RT 13.1.2 showing symbol: @ES#. |
View |
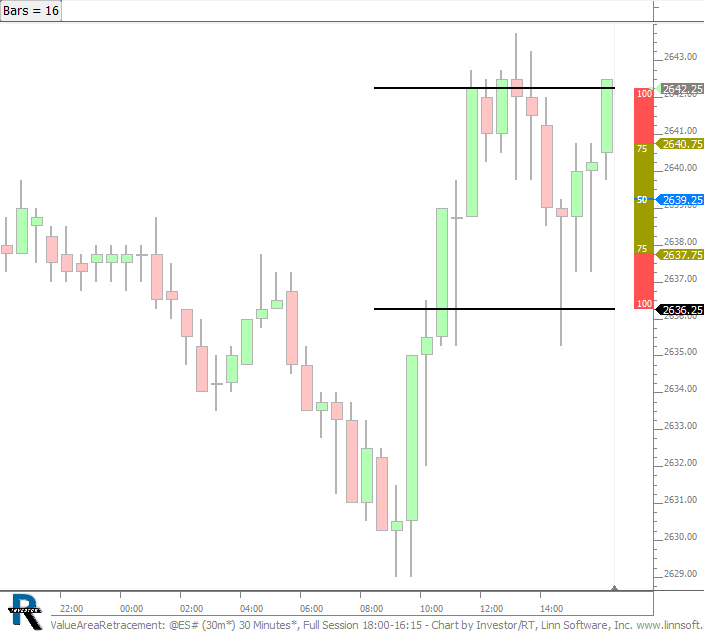 |
ValueAreaRetracement (@ES#) cpayne [totalcount]
8 years 7 months ago
Value Area Retracement. This chart was uploaded by Investor/RT 13.1.1 showing symbol: @ES#. |
View |