 |
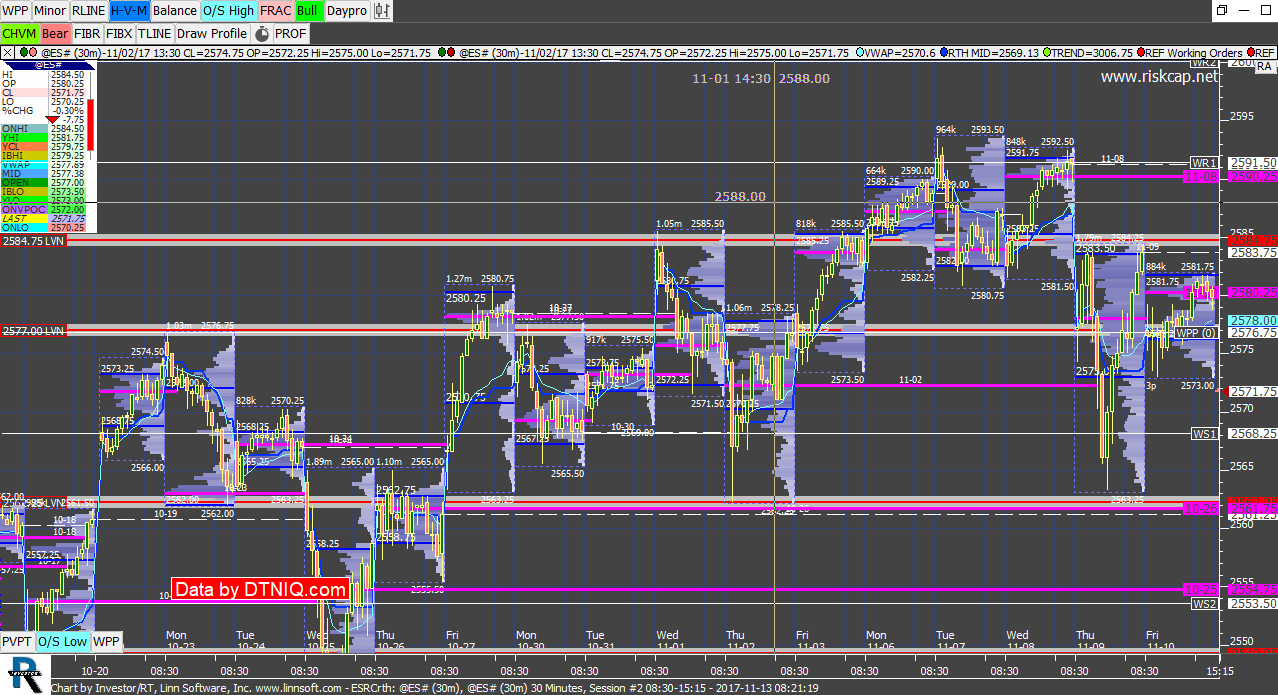
ESRCrth (@ES#) riskcap [totalcount]
8 years 8 months ago
ES_F emini levels of support/resistance. This chart was uploaded by Investor/RT 12.7.6 showing symbol: @ES#. |
View |
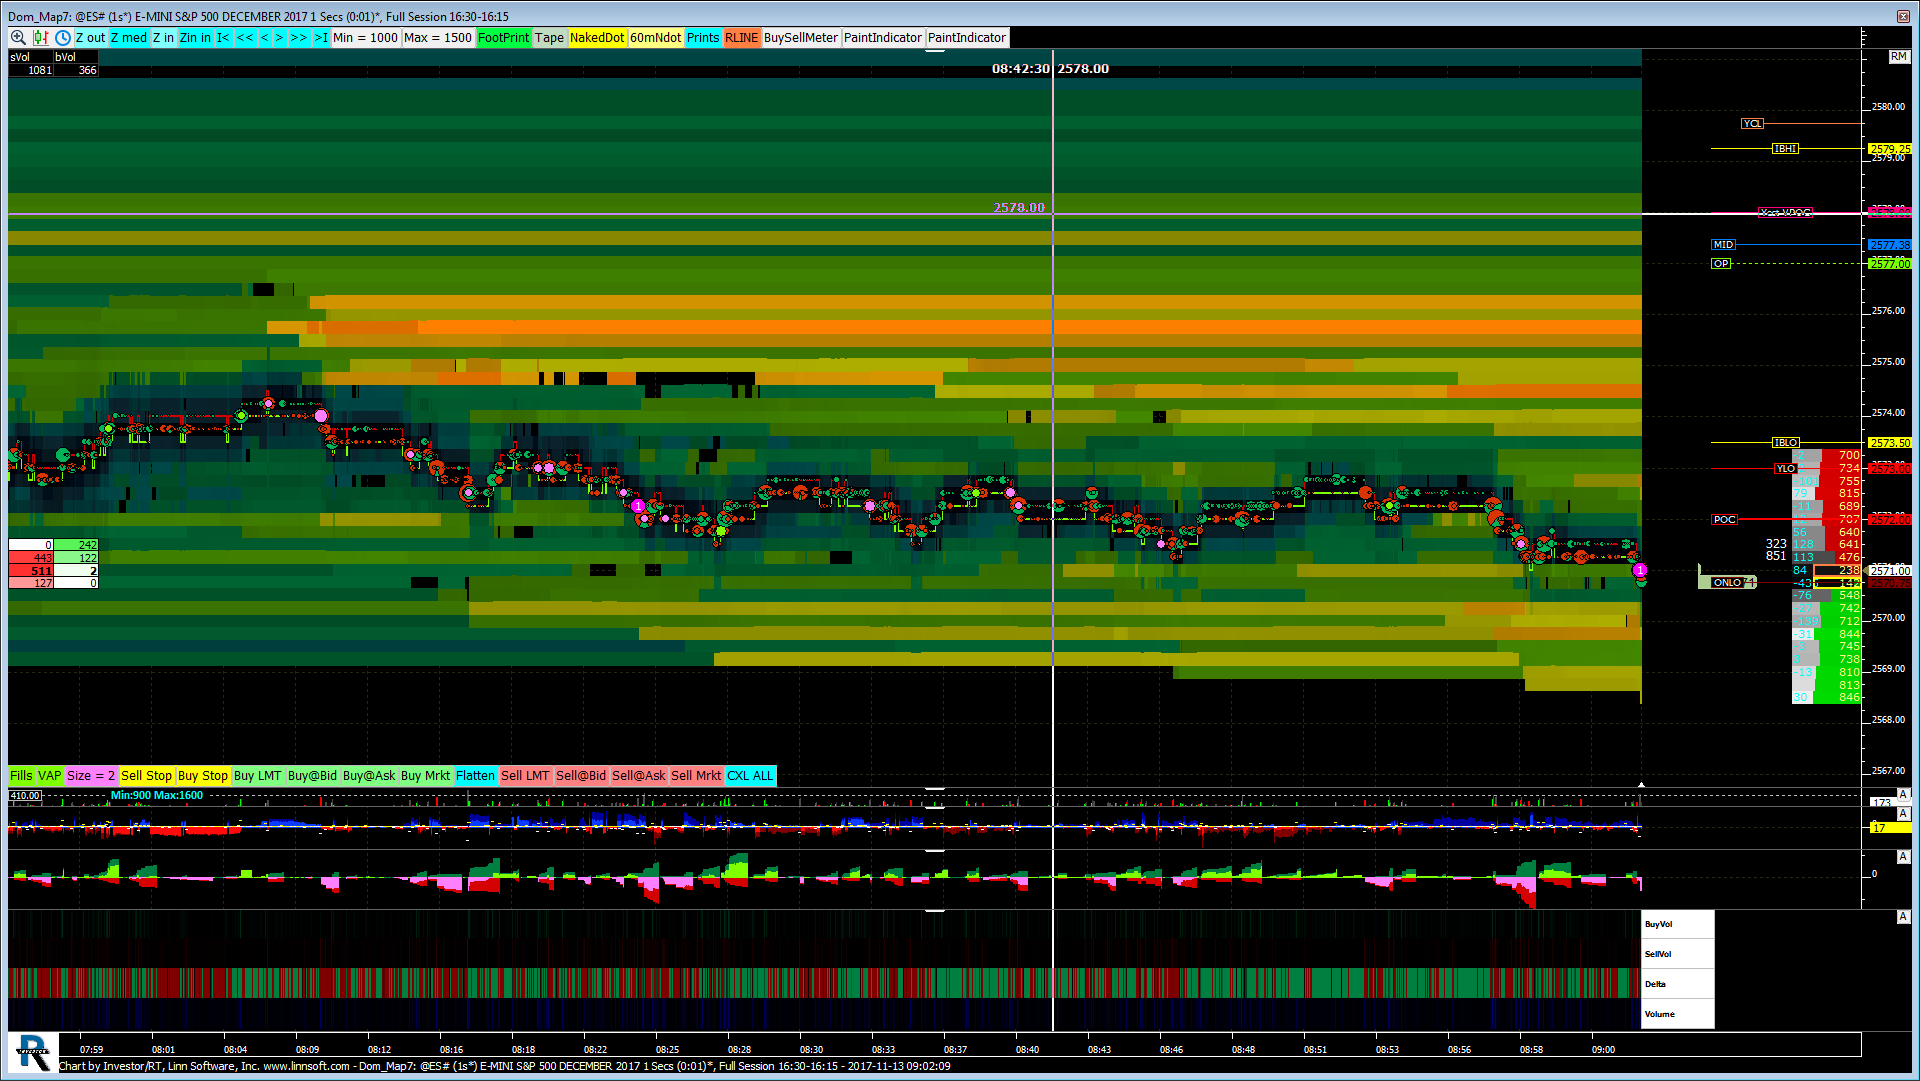 |
Dom Map (@ES#) jayski51369 [totalcount]
8 years 8 months ago
This chart was uploaded by Investor/RT 12.7.6 showing symbol: @ES#. |
View |
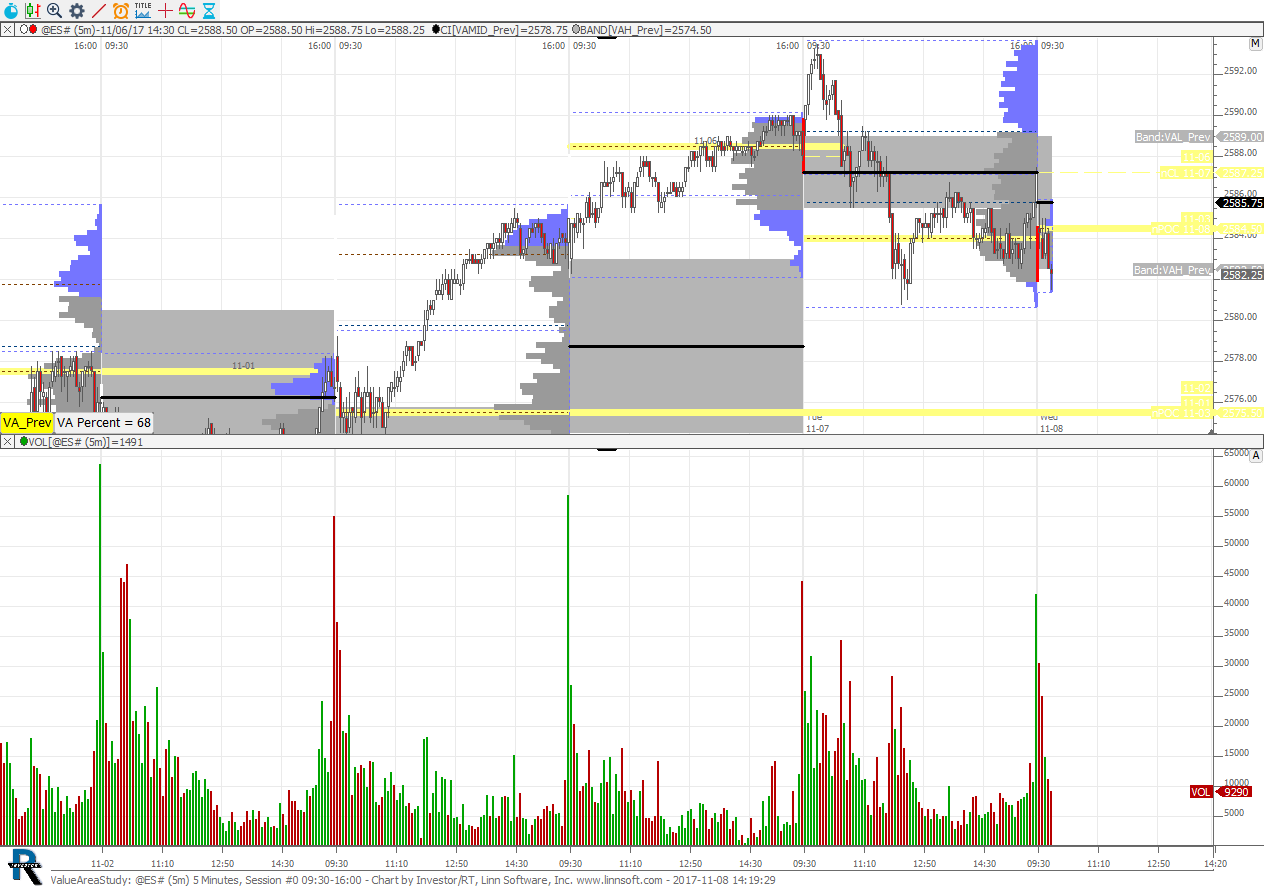 |
ValueAreaStudy (@ES#) cpayne [totalcount]
8 years 8 months ago
This chart was uploaded by Investor/RT 13.1.1 showing symbol: @ES#. |
View |
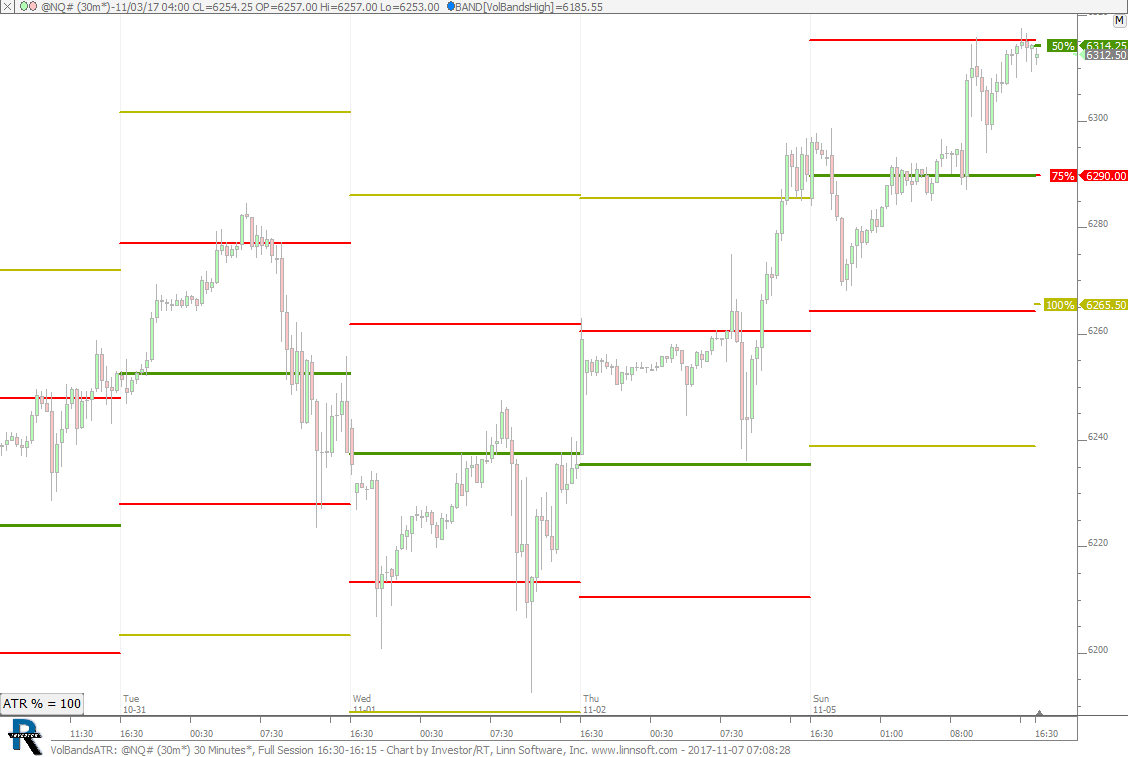 |
VolBandsATR (@NQ#) cpayne [totalcount]
8 years 8 months ago
Volatility Bands ATR. This chart was uploaded by Investor/RT 13.1.1 showing symbol: @NQ#. |
View |
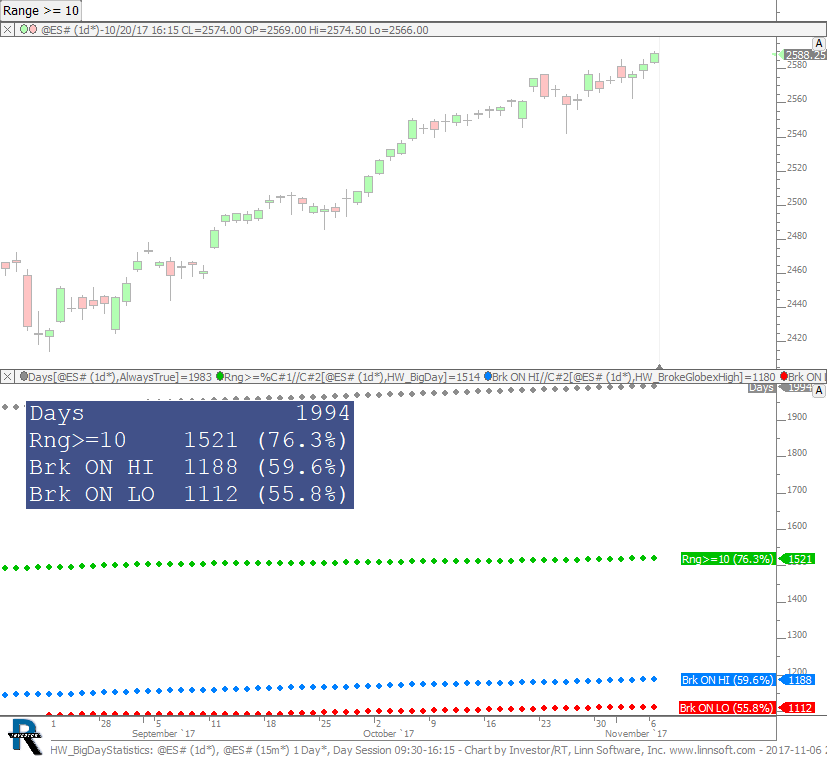 |
HW BigDayStatistics (@ES#) cpayne [totalcount]
8 years 8 months ago
Homework. Number of Big Days (Use Button For Min Range), and Number of Days we break overnight high and low (with percentages). |
View |
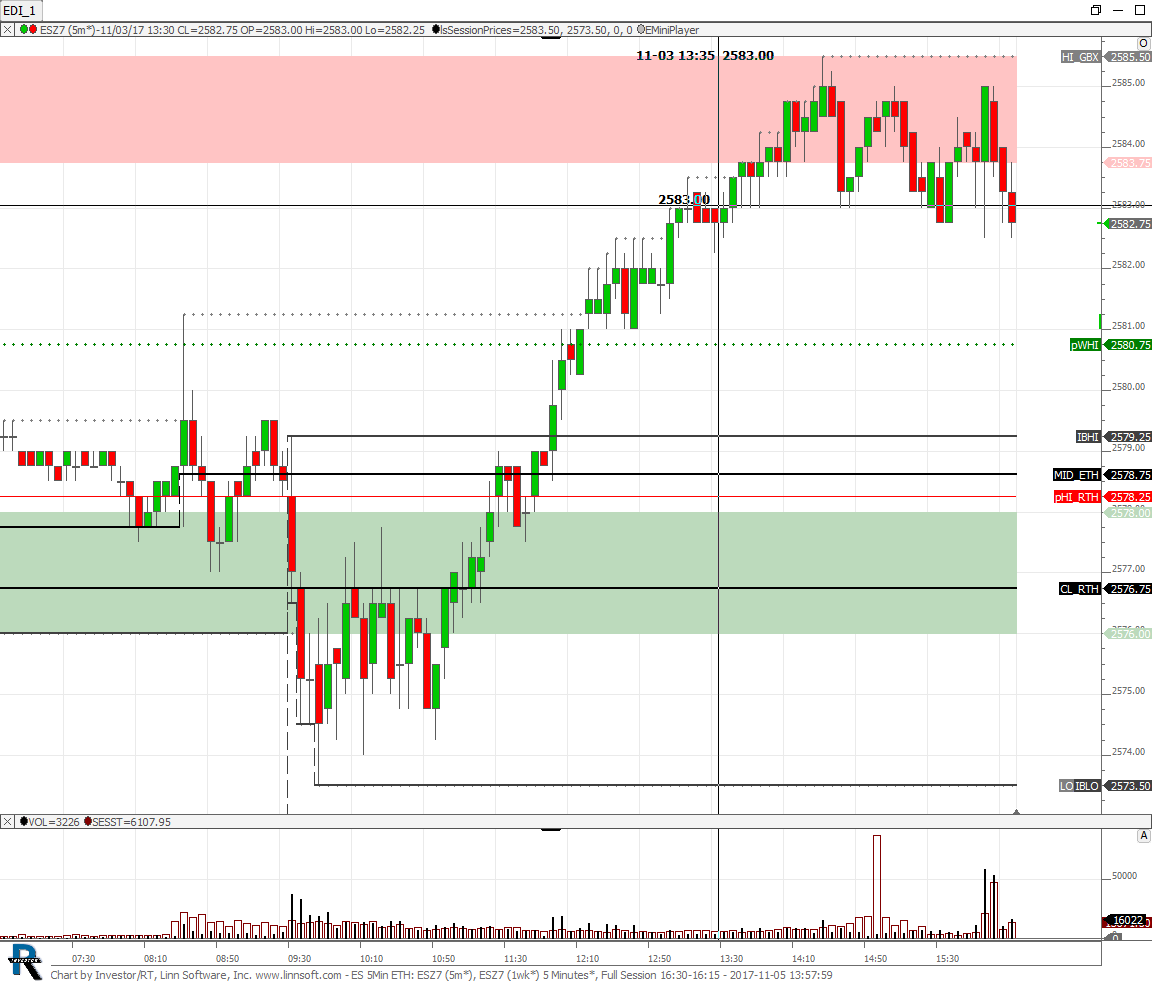 |
ES 5Min ETH (ESZ7) TAGr Capital [totalcount]
8 years 8 months ago
Wondering why the mid an close that should be dashed are solid. This chart was uploaded by Investor/RT 13.1.1 showing symbol: ESZ7. |
View |
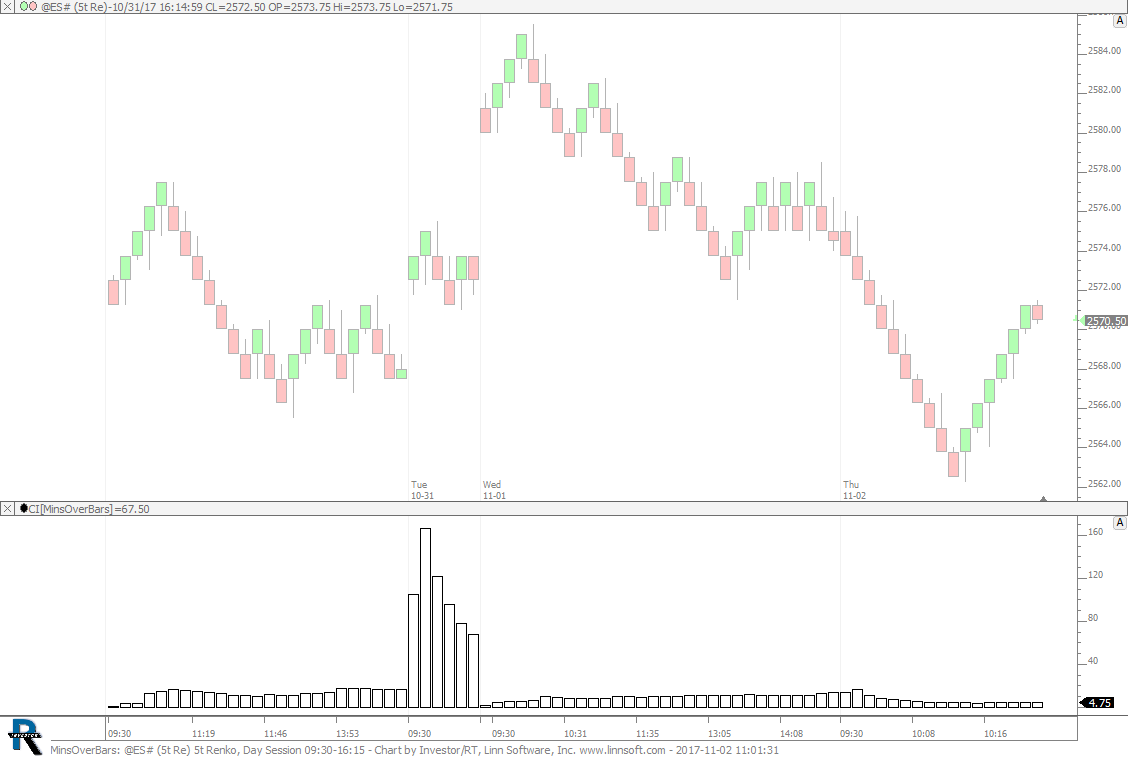 |
MinsOverBars (@ES#) cpayne [totalcount]
8 years 9 months ago
Minutes Into Session Divided by Bars Into Session. This chart was uploaded by Investor/RT 13.1.1 showing symbol: @ES#. |
View |
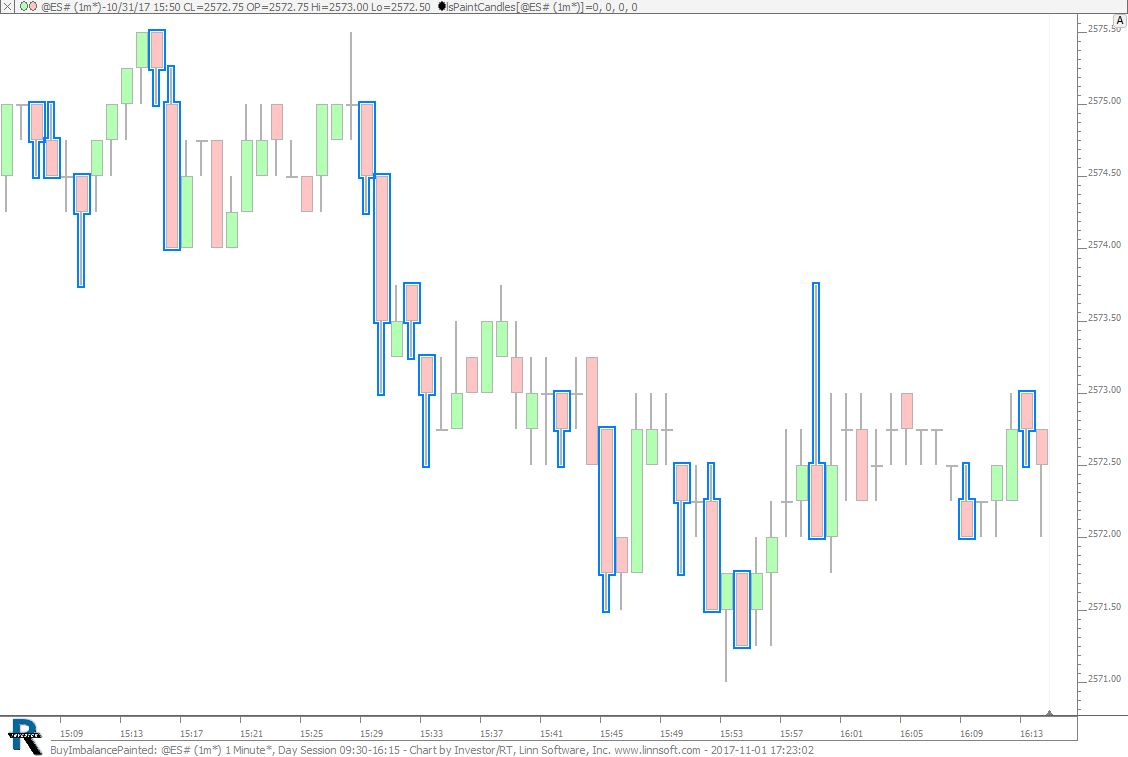 |
BuyImbalancePainted (@ES#) cpayne [totalcount]
8 years 9 months ago
Buy Imbalance Painted. This chart was uploaded by Investor/RT 13.1.1 showing symbol: @ES#. |
View |
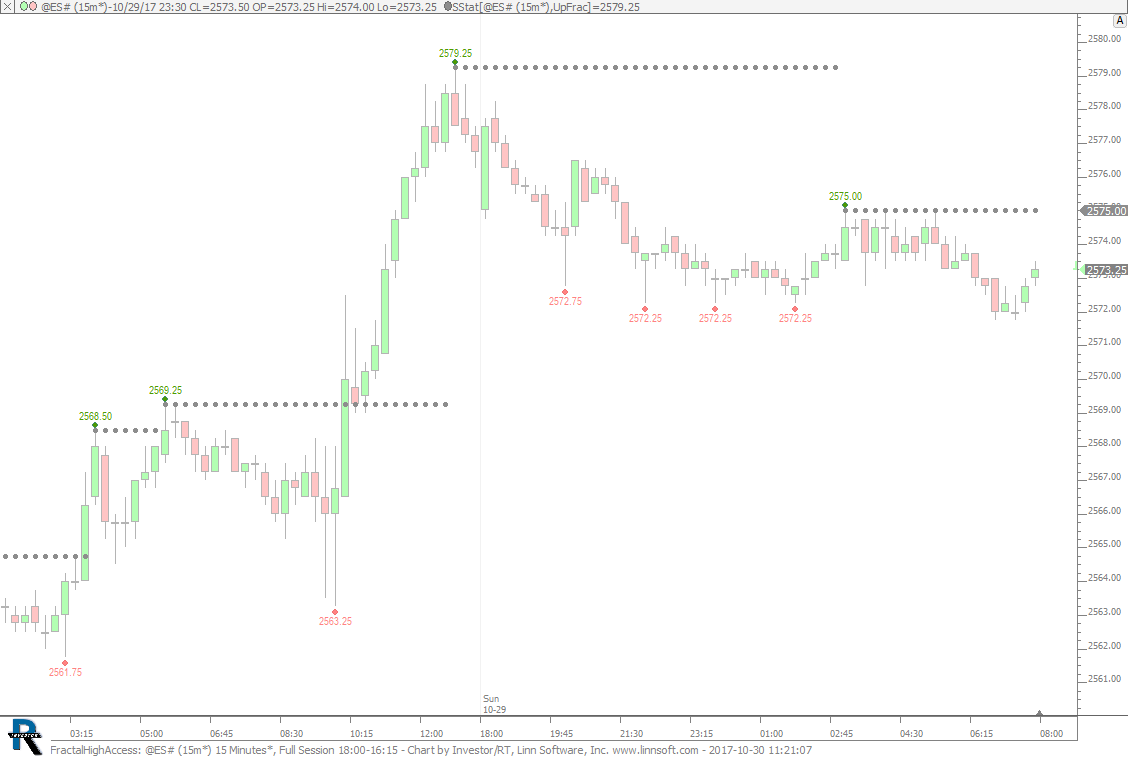 |
FractalHighAccess (@ES#) cpayne [totalcount]
8 years 9 months ago
Accessing the High of Up Fractal. This chart was uploaded by Investor/RT 13.1.1 showing symbol: @ES#. |
View |
 |
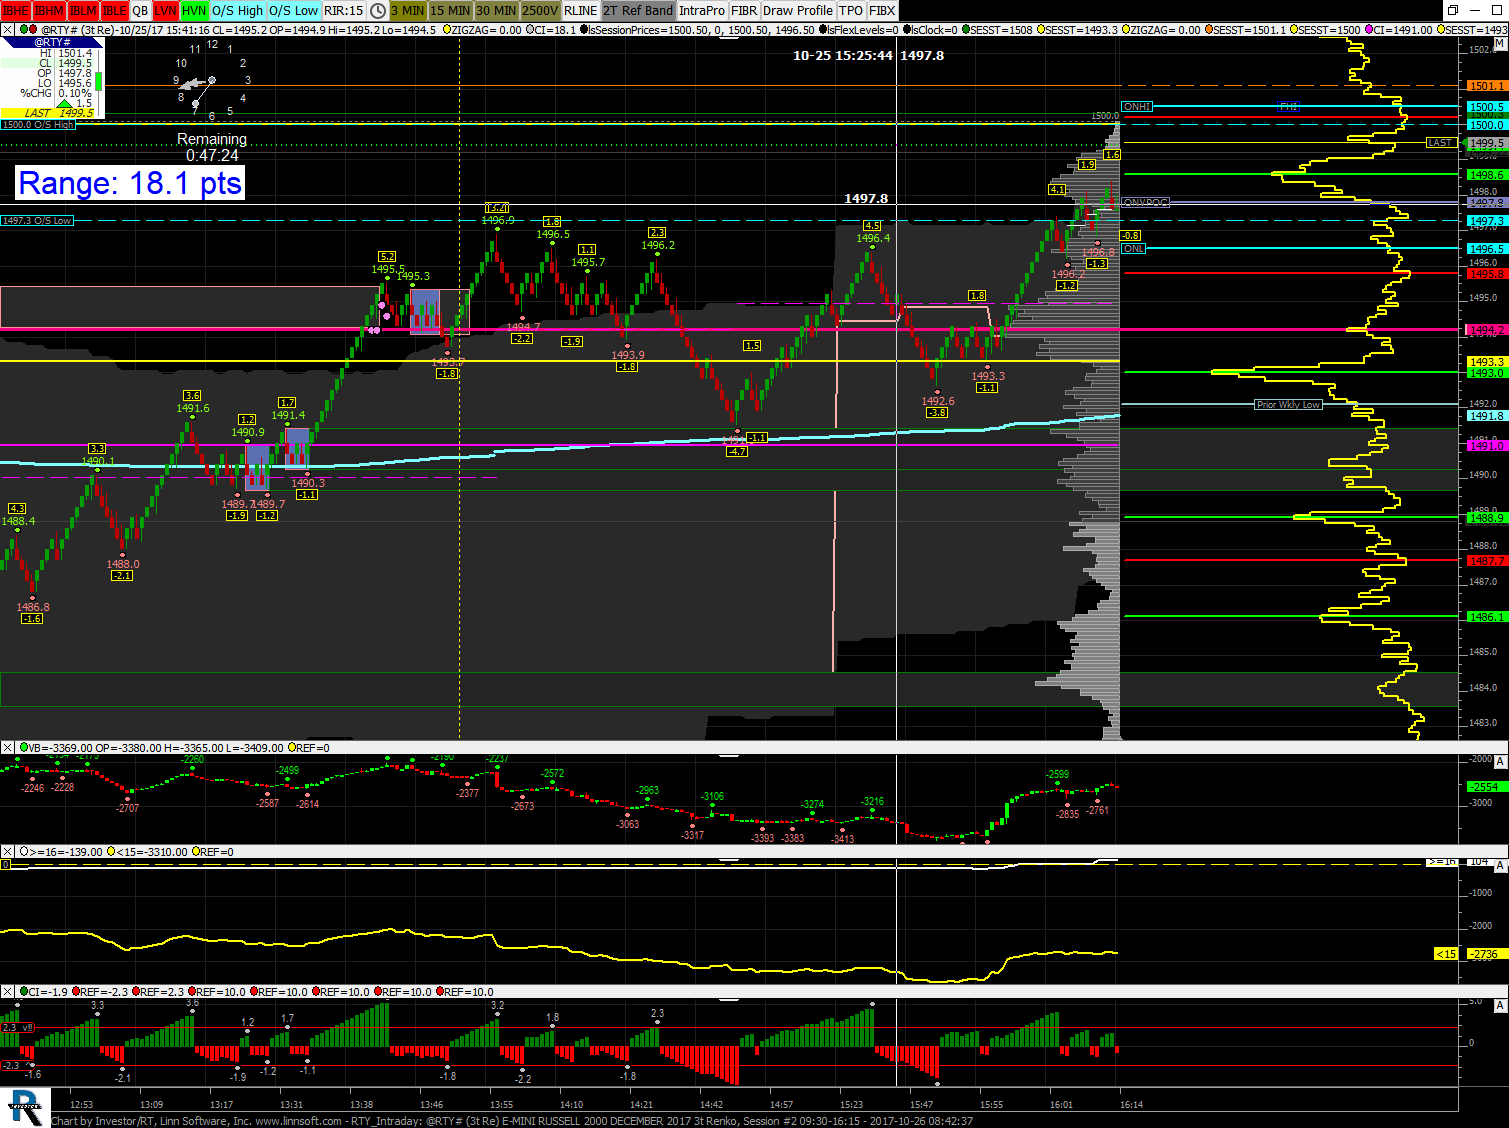
RTY Intraday (@RTY#) 2 scooke [totalcount]
8 years 9 months ago
This chart was uploaded by Investor/RT 13.1.1 showing symbol: @RTY#. |
View |
 |
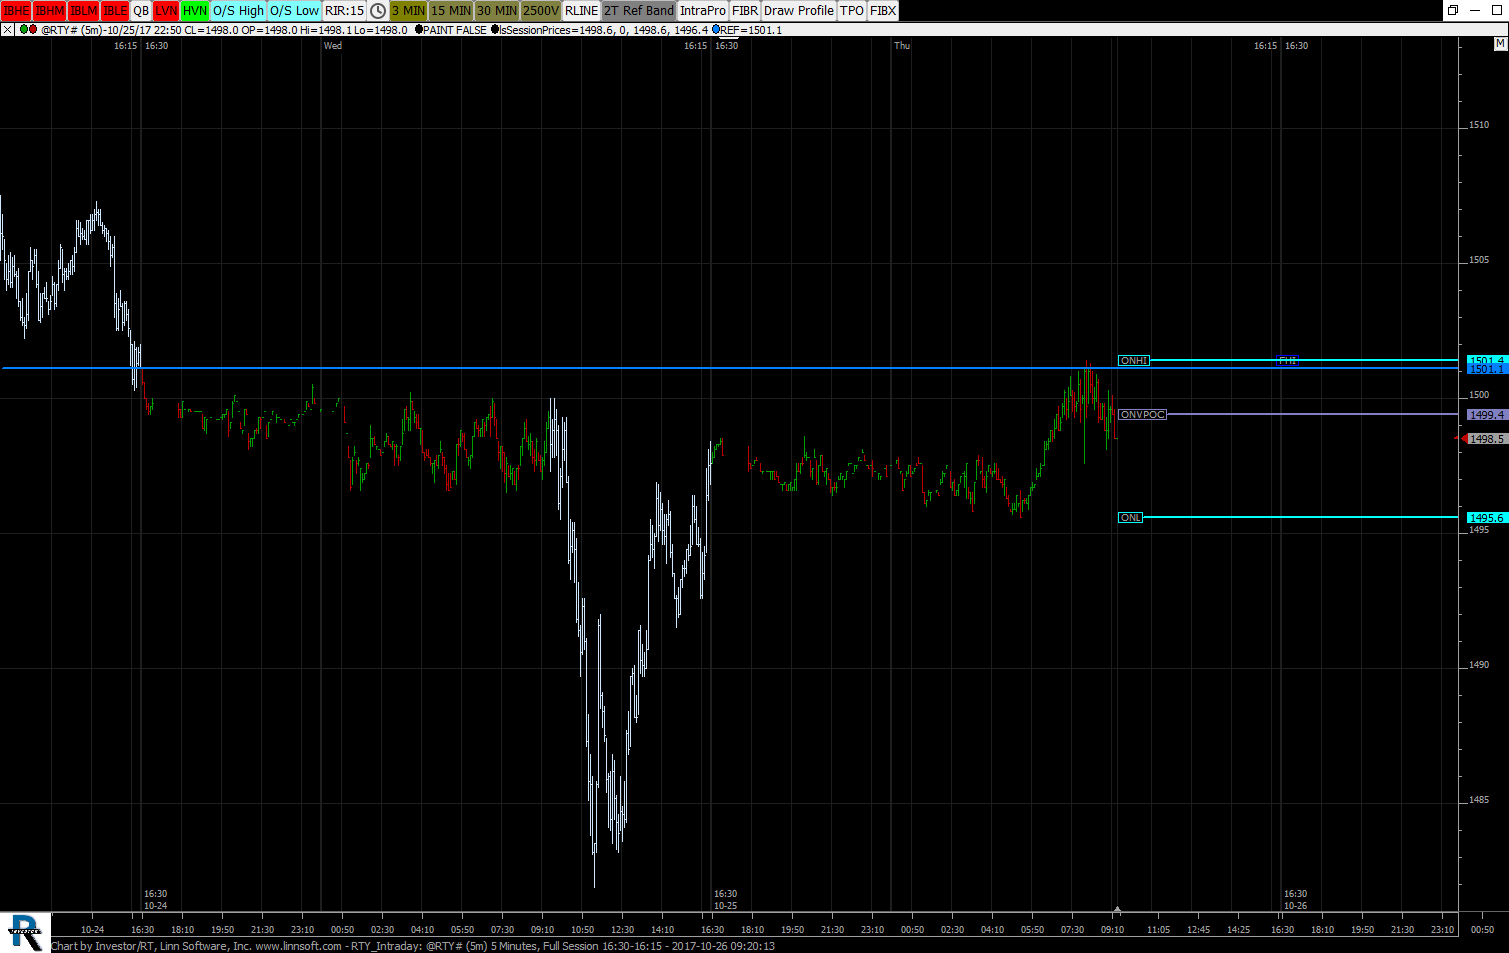
RTY Intraday (@RTY#) tradercrm [totalcount]
8 years 9 months ago
This chart was uploaded by Investor/RT 12.7.6 showing symbol: @RTY#. |
View |
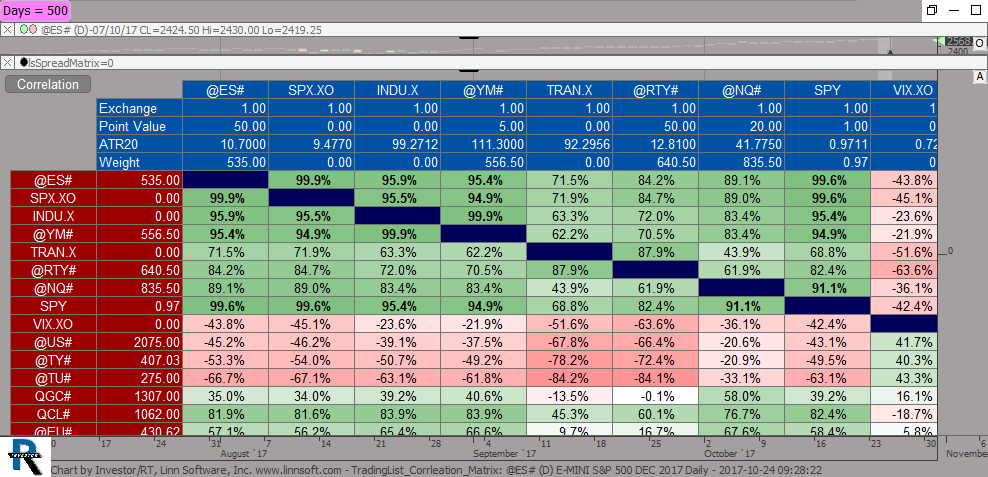 |
TradingList Corrleation Matrix (@ES#) ashamess [totalcount]
8 years 9 months ago
Chad: Shawn: This chart has a C variable to change the lookback days, but the data in the chart dos not chnage. Can you have alook sometime to see what I've done wrong?. |
View |
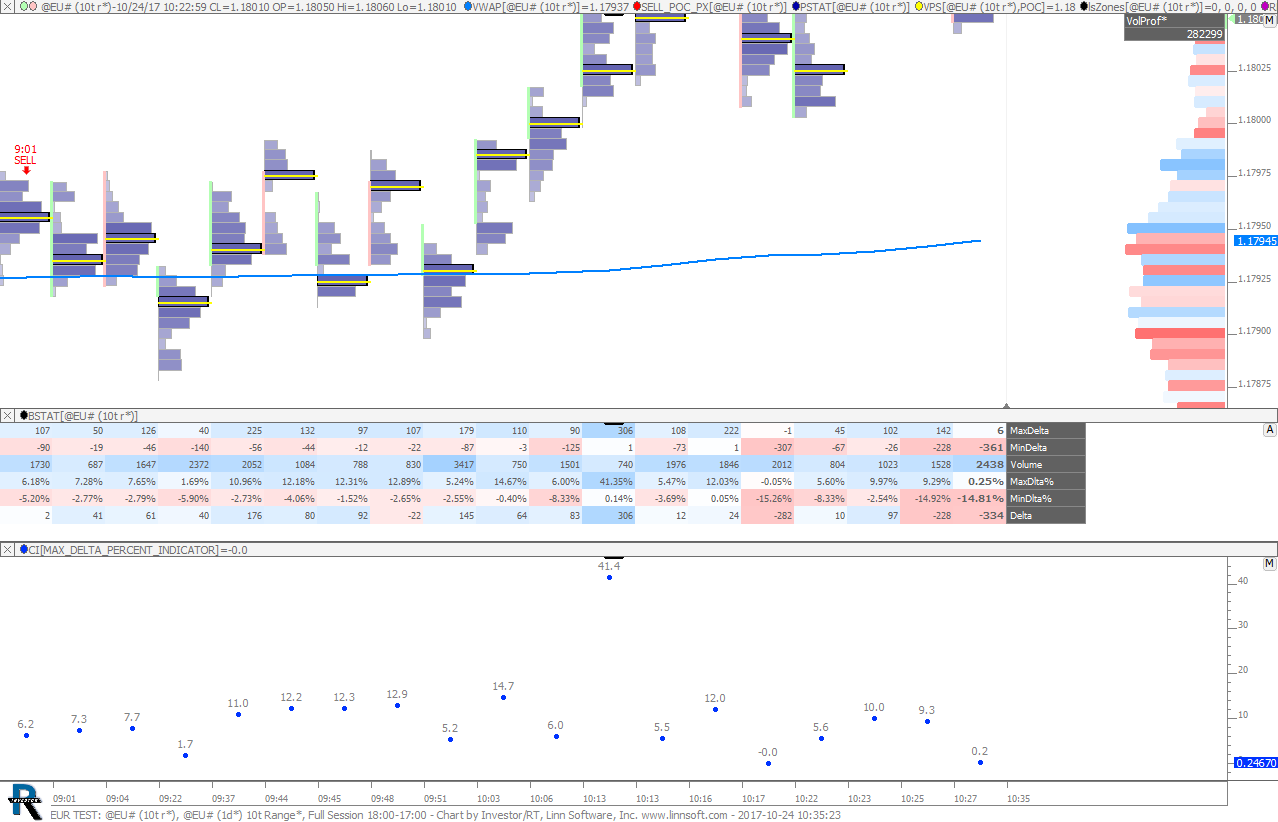 |
EUR TEST (@EU#) 2 cpayne [totalcount]
8 years 9 months ago
Max Delta Percent. This chart was uploaded by Investor/RT 13.1.1 showing symbol: @EU#. |
View |
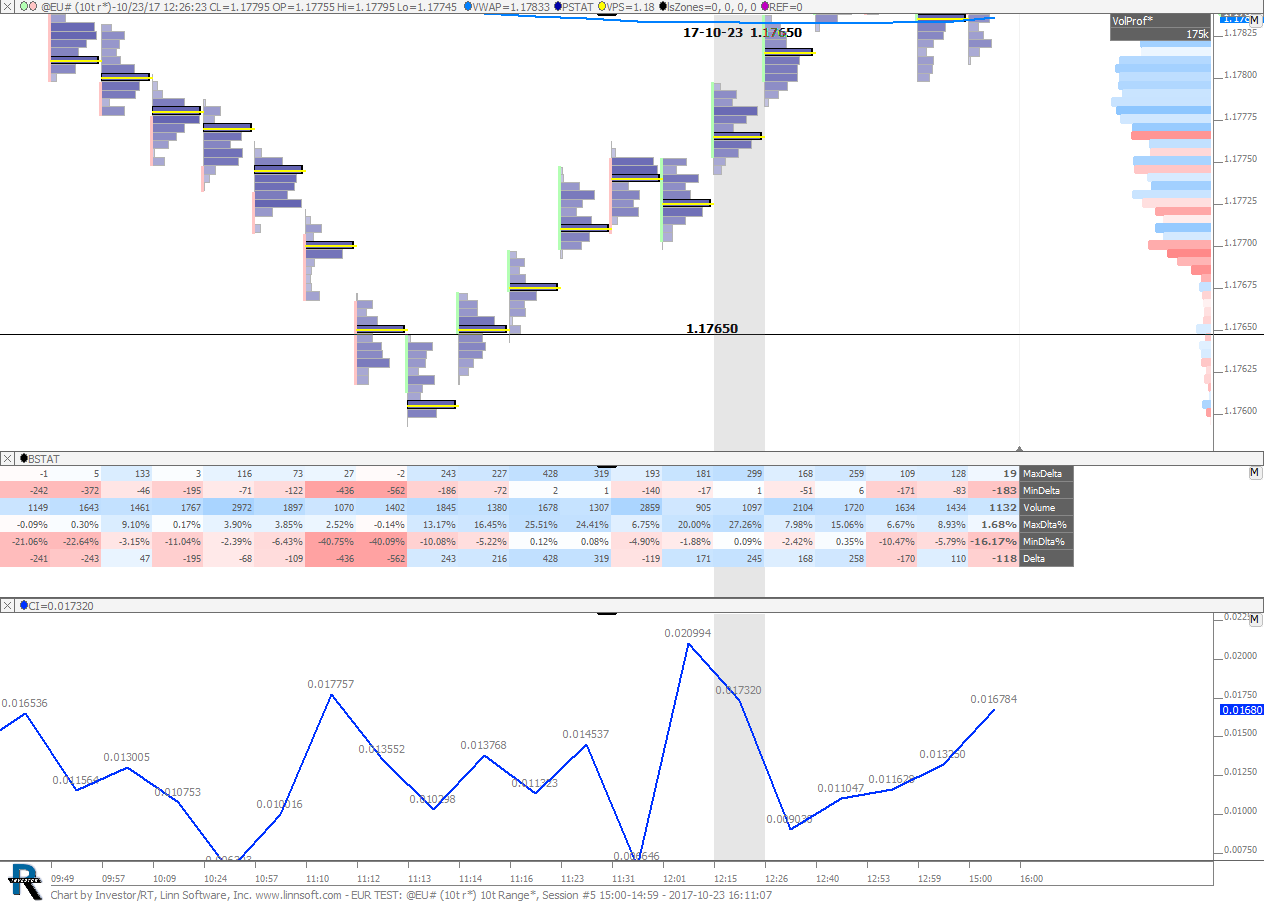 |
EUR TEST (@EU#) parifx [totalcount]
8 years 9 months ago
max delta test. This chart was uploaded by Investor/RT 12.7.6 showing symbol: @EU#. |
View |
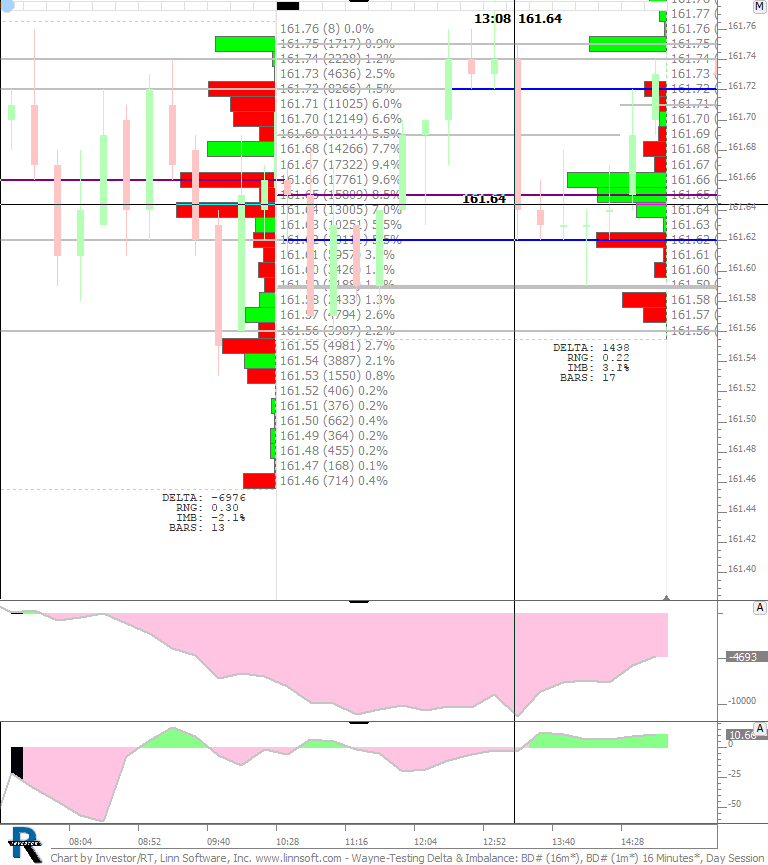 |
Wayne Testing Delta Imbalance (BD#) WAYNE CHANDLER [totalcount]
8 years 9 months ago
Using updated PROF token in RTL to plot Delta & Imbalance. This chart was uploaded by Investor/RT 13.1.1 showing symbol: BD#. |
View |
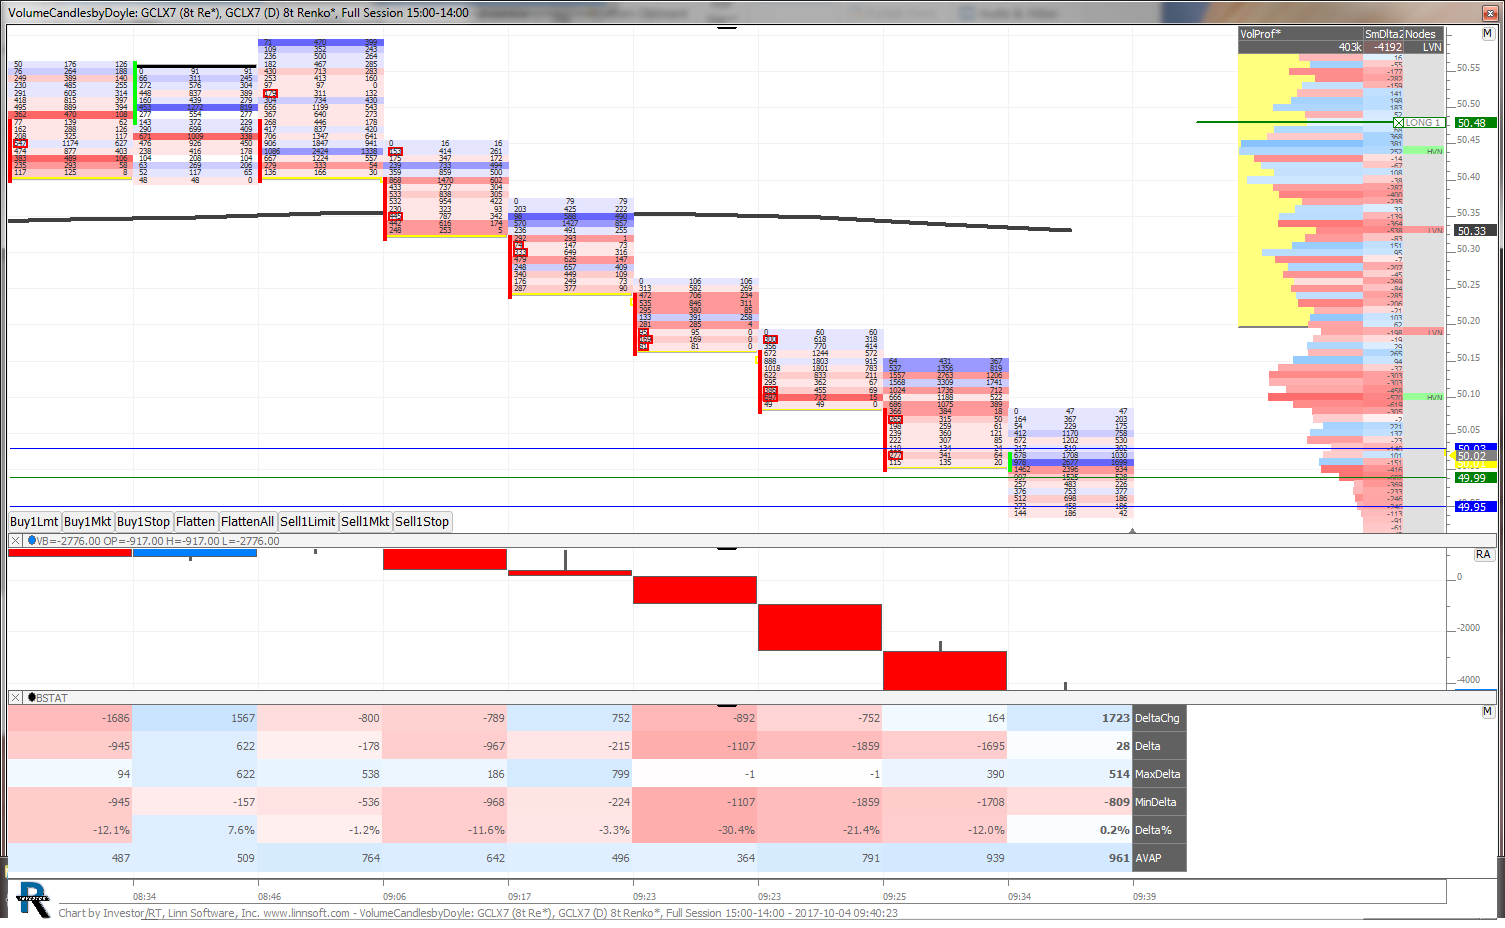 |
VolumeCandlesbyDoyle (GCLX7) burrben [totalcount]
8 years 10 months ago
This chart was uploaded by Investor/RT 12.7.6 showing symbol: GCLX7. |
View |
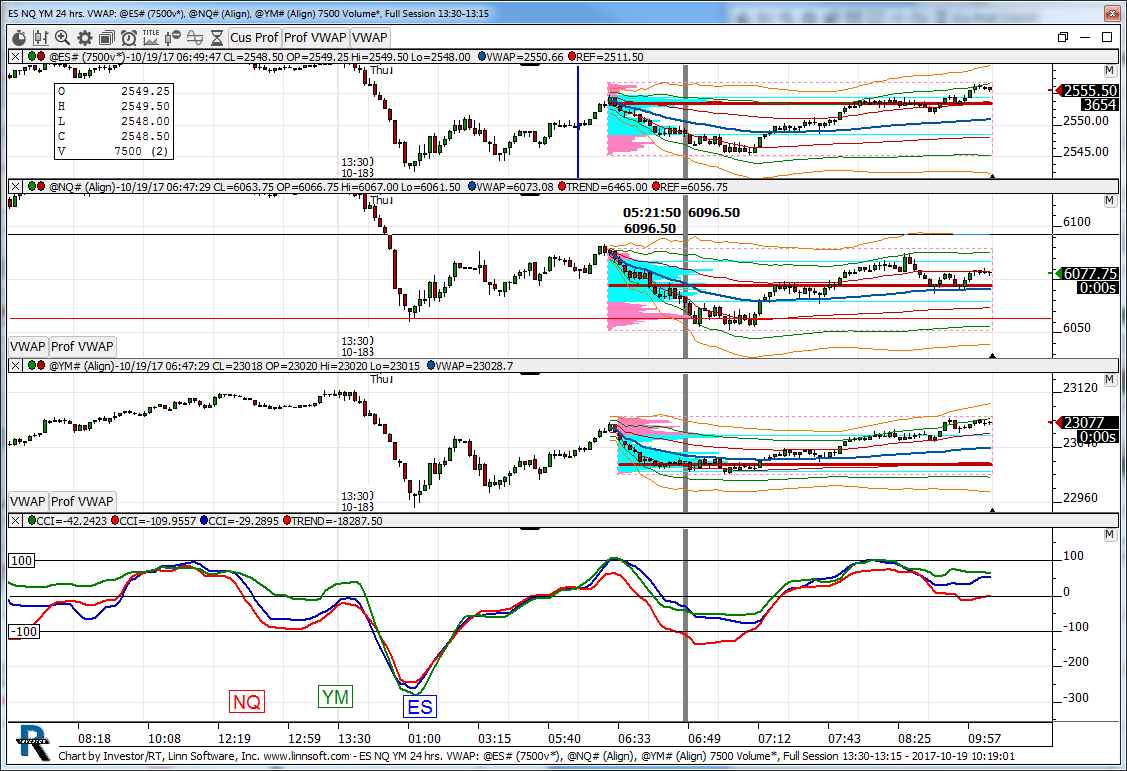 |
ES NQ YM 24 hrs VWAP (@ES#) kencassorla [totalcount]
8 years 9 months ago
3 Index. This chart was uploaded by Investor/RT 12.7.6 showing symbol: @ES#. |
View |
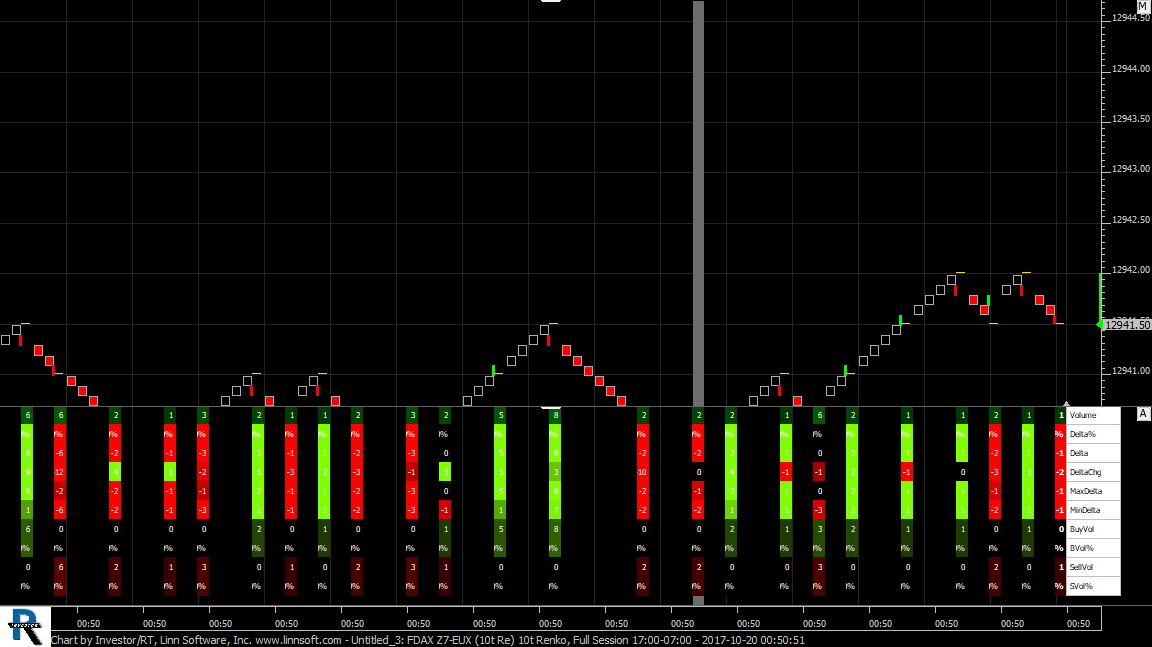 |
Untitled 3 (FDAX Z7-EUX) charley270 [totalcount]
8 years 9 months ago
This chart was uploaded by Investor/RT 12.7.6 showing symbol: FDAX Z7-EUX. |
View |
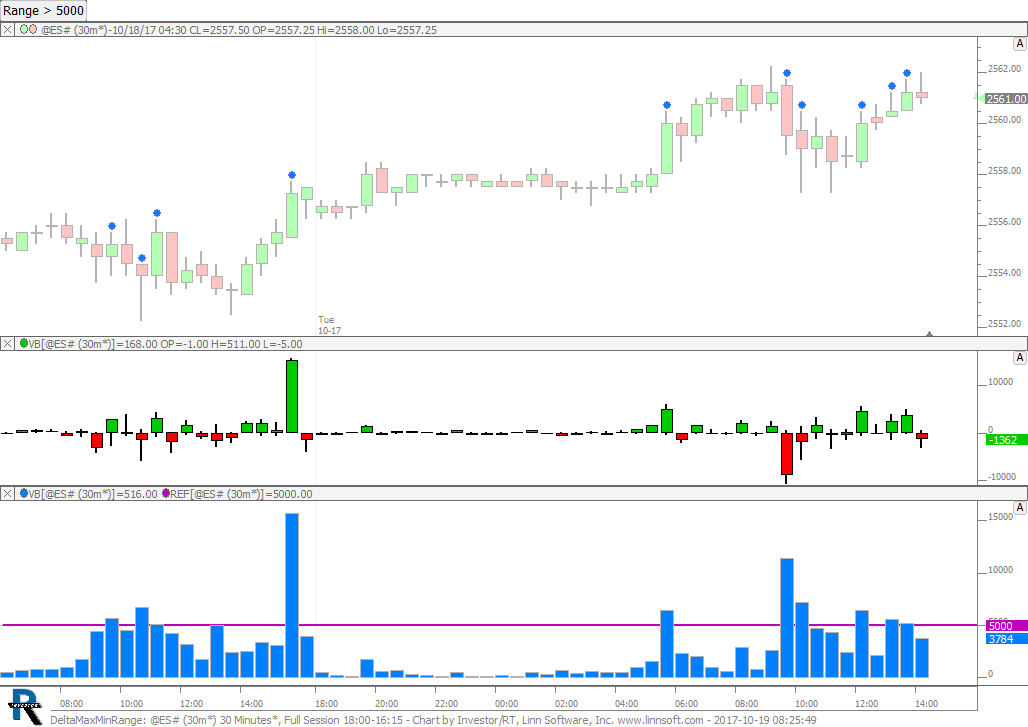 |
DeltaMaxMinRange (@ES#) cpayne [totalcount]
8 years 9 months ago
Delta Min Max and Range in Signals. This chart was uploaded by Investor/RT 13.1.1 showing symbol: @ES#. |
View |
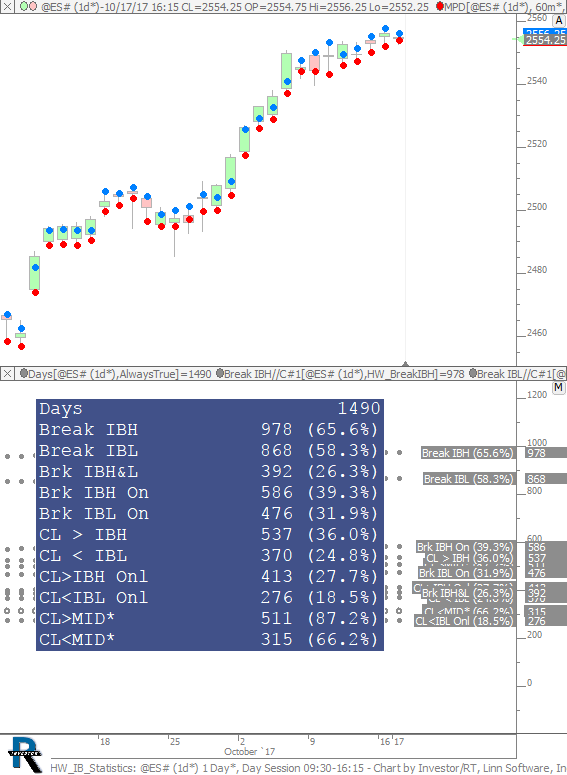 |
HW IB Statistics (@ES#) cpayne [totalcount]
8 years 9 months ago
IB and Mid Break and Close Statistics. This chart was uploaded by Investor/RT 13.1.1 showing symbol: @ES#. |
View |
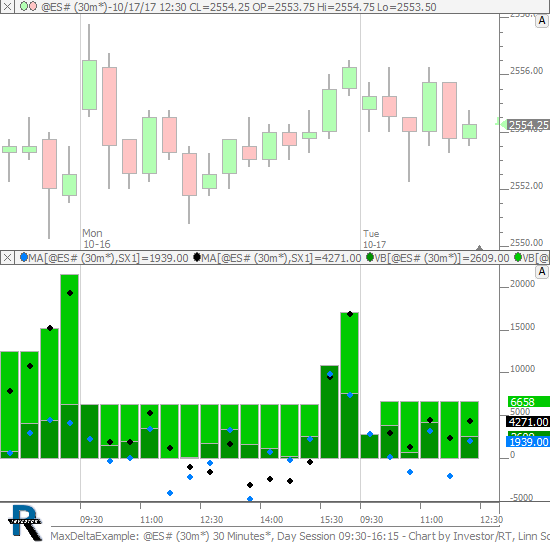 |
MaxDeltaExample (@ES#) cpayne [totalcount]
8 years 9 months ago
Max Delta Examples. This chart was uploaded by Investor/RT 13.1.1 showing symbol: @ES#. |
View |
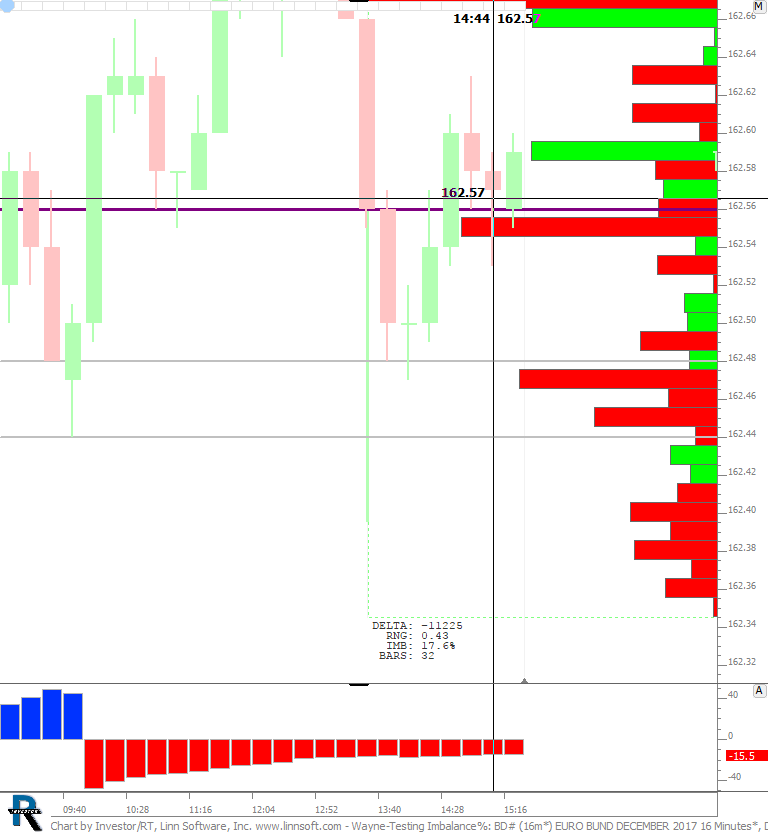 |
Wayne Testing Imbalance (BD#) WAYNE CHANDLER [totalcount]
8 years 9 months ago
hi Chad here is a sample chart with the TINT_DELTA indicator added as you requested. This chart was uploaded by Investor/RT 12.7.6 showing symbol: BD#. |
View |
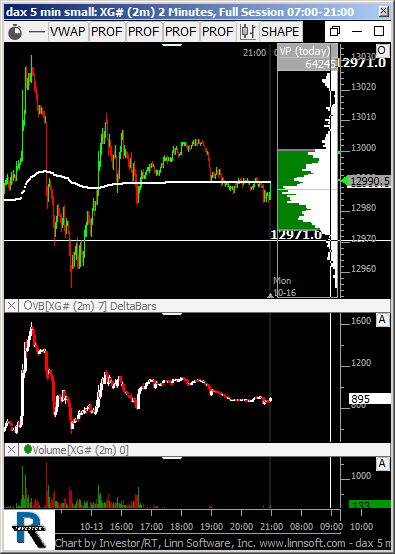 |
dax 5 min small (XG#) reese101 [totalcount]
8 years 9 months ago
This chart was uploaded by Investor/RT 12.7.6 showing symbol: XG#. |
View |
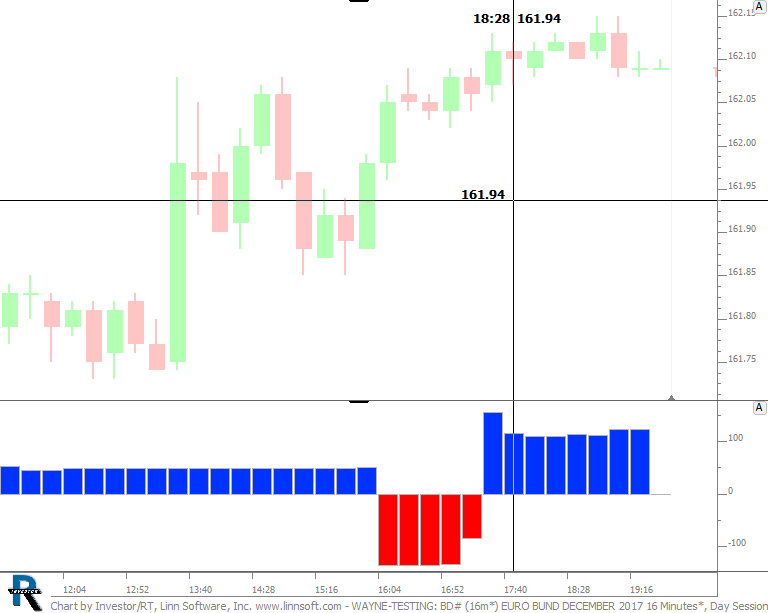 |
WAYNE TESTING (BD#) WAYNE CHANDLER [totalcount]
8 years 9 months ago
hi Chad here is a sample chart with the TINT_DELTA indicator added as you requested. This chart was uploaded by Investor/RT 12.7.6 showing symbol: BD#. |
View |
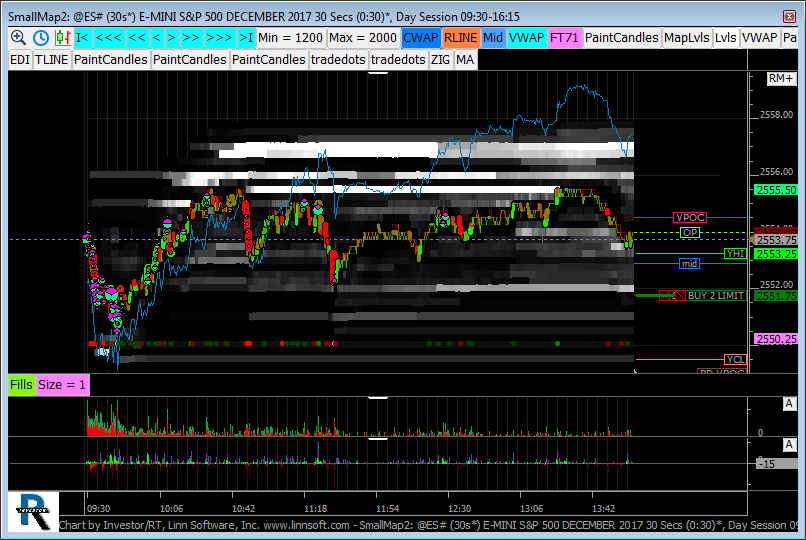 |
SmallMap (@ES#) jayski51369 [totalcount]
8 years 9 months ago
This chart was uploaded by Investor/RT 12.7.6 showing symbol: @ES#. |
View |