 |
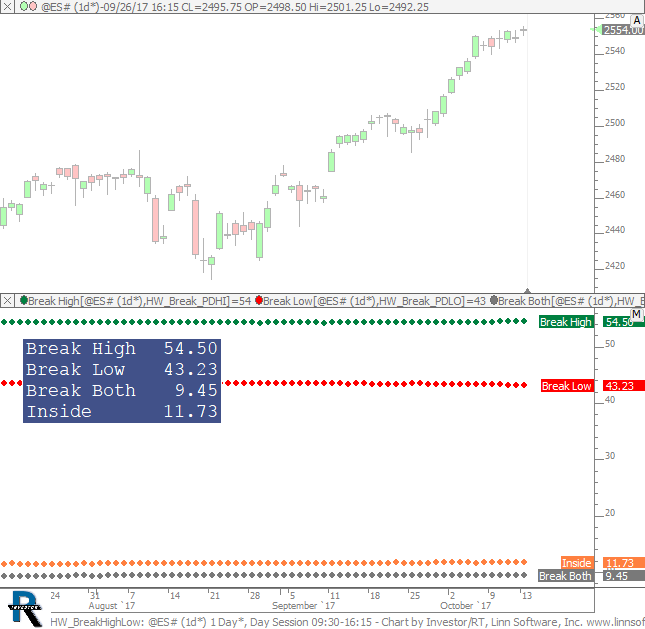
HW BreakHighLow (@ES#) cpayne [totalcount]
8 years 9 months ago
How Often Does Price Break Previous Day Session High and Low. This chart was uploaded by Investor/RT 13.1.1 showing symbol: @ES#. |
View |
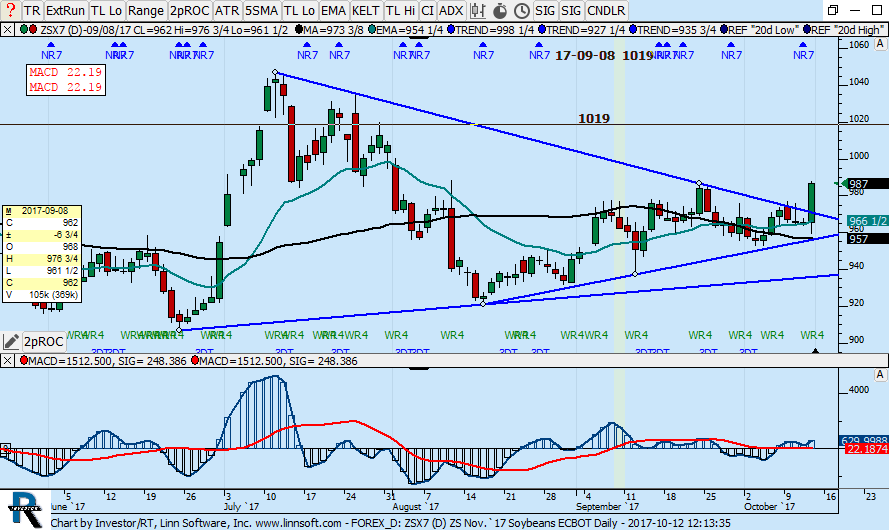 |
FOREX D (ZSX7) boris-libman [totalcount]
8 years 9 months ago
This chart was uploaded by Investor/RT 12.7.6 showing symbol: ZSX7. |
View |
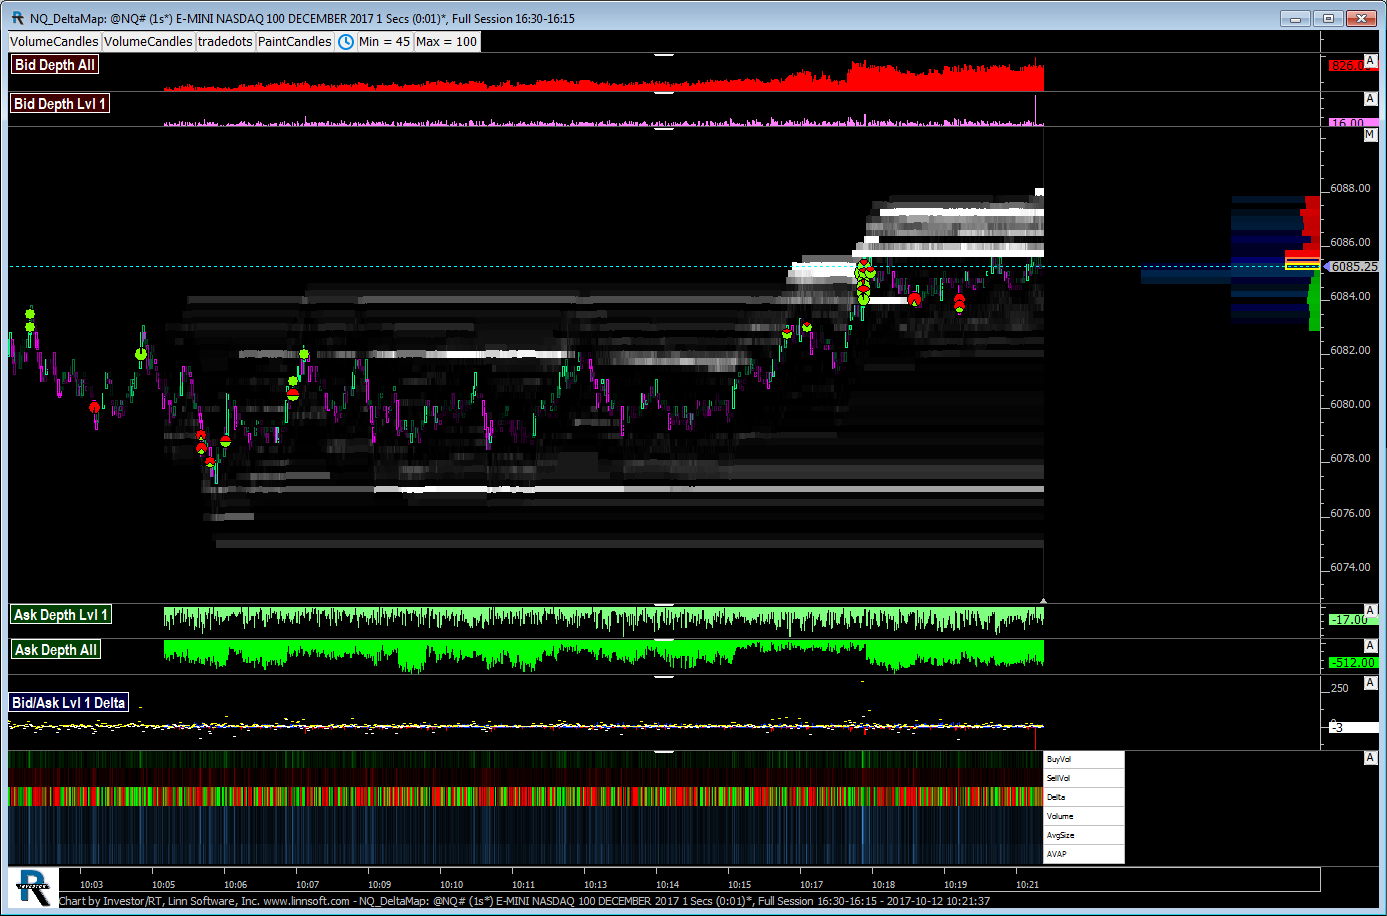 |
NQ DeltaMap (@NQ#) jayski51369 [totalcount]
8 years 9 months ago
This chart was uploaded by Investor/RT 12.7.6 showing symbol: @NQ#. |
View |
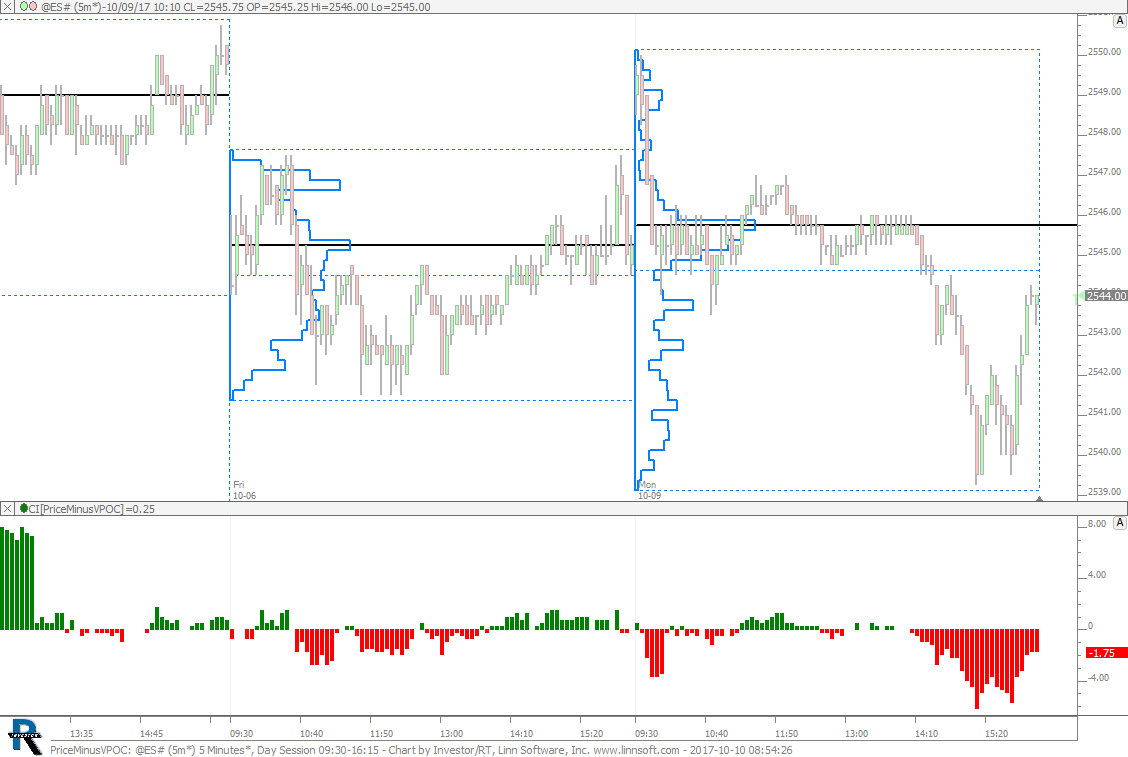 |
PriceMinusVPOC (@ES#) cpayne [totalcount]
8 years 9 months ago
Price Minus Developing VPOC. This chart was uploaded by Investor/RT 13.1.1 showing symbol: @ES#. |
View |
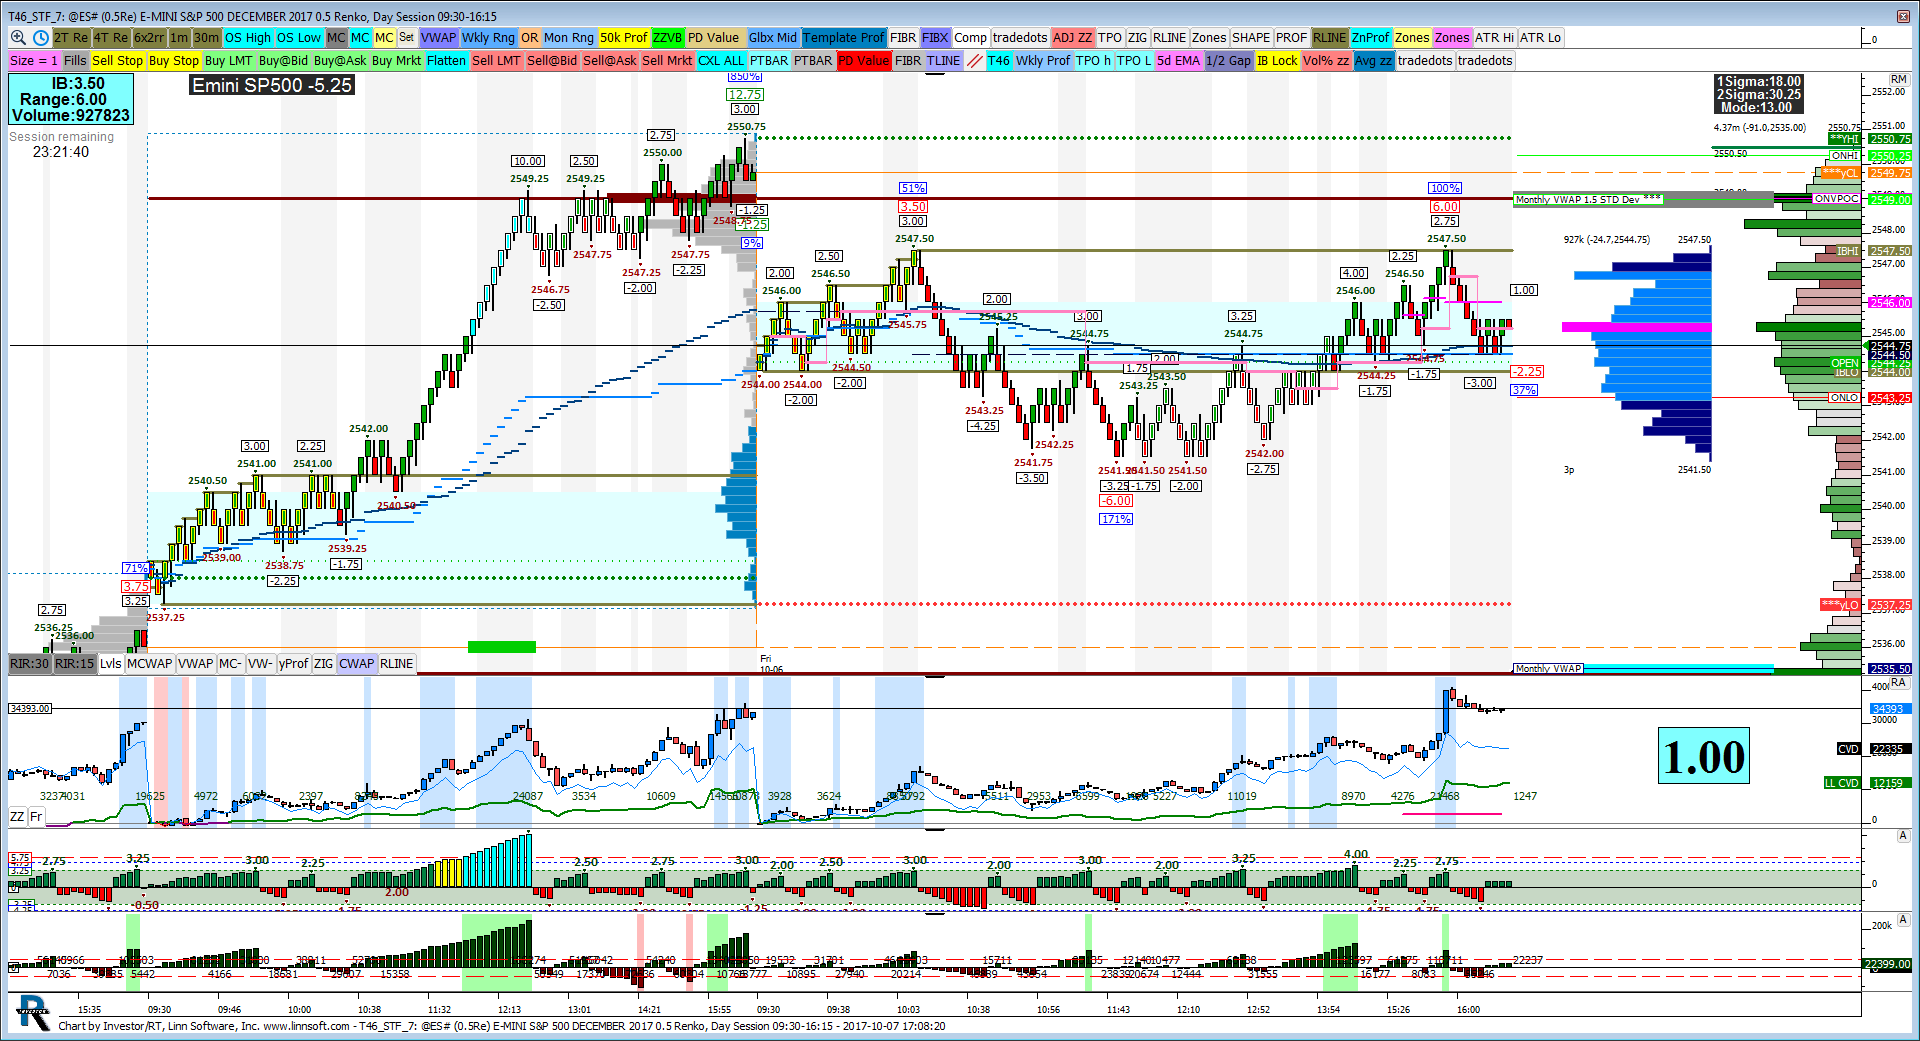 |
T46 STF (@ES#) jayski51369 [totalcount]
8 years 9 months ago
This chart was uploaded by Investor/RT 12.5.9 showing symbol: @ES#. |
View |
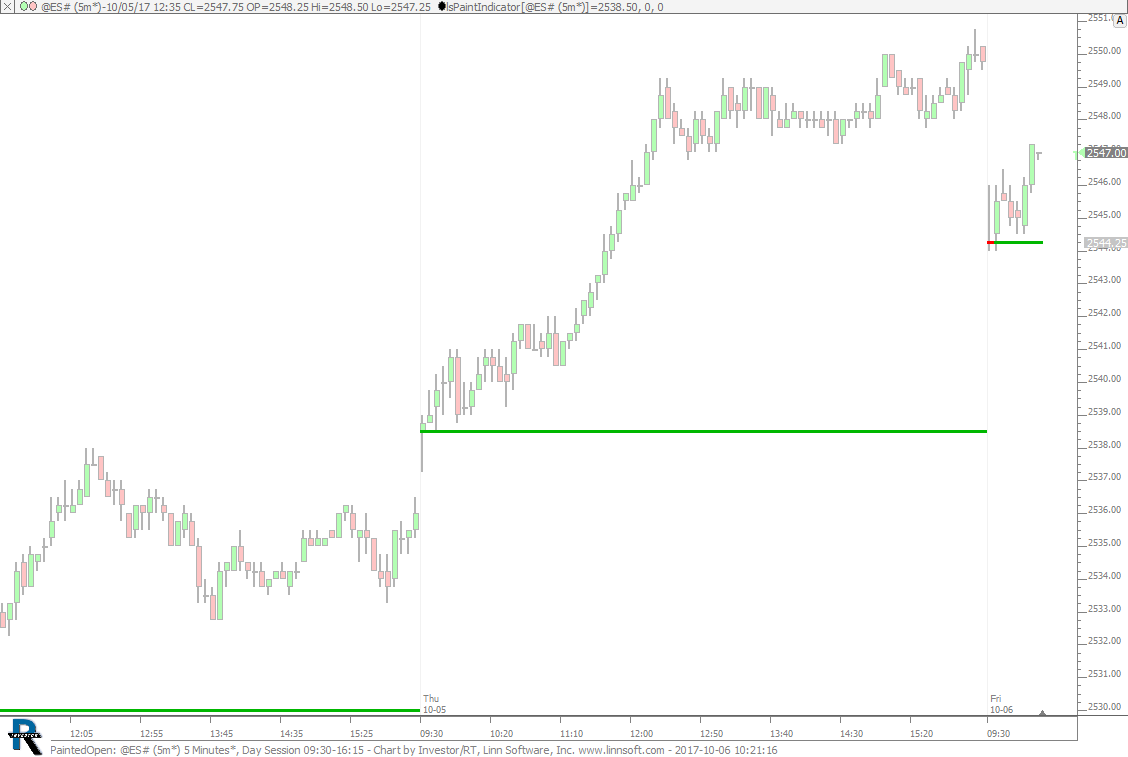 |
PaintedOpen (@ES#) cpayne [totalcount]
8 years 9 months ago
Painted Open Line using Paint Indicator. This chart was uploaded by Investor/RT 13.1.1 showing symbol: @ES#. |
View |
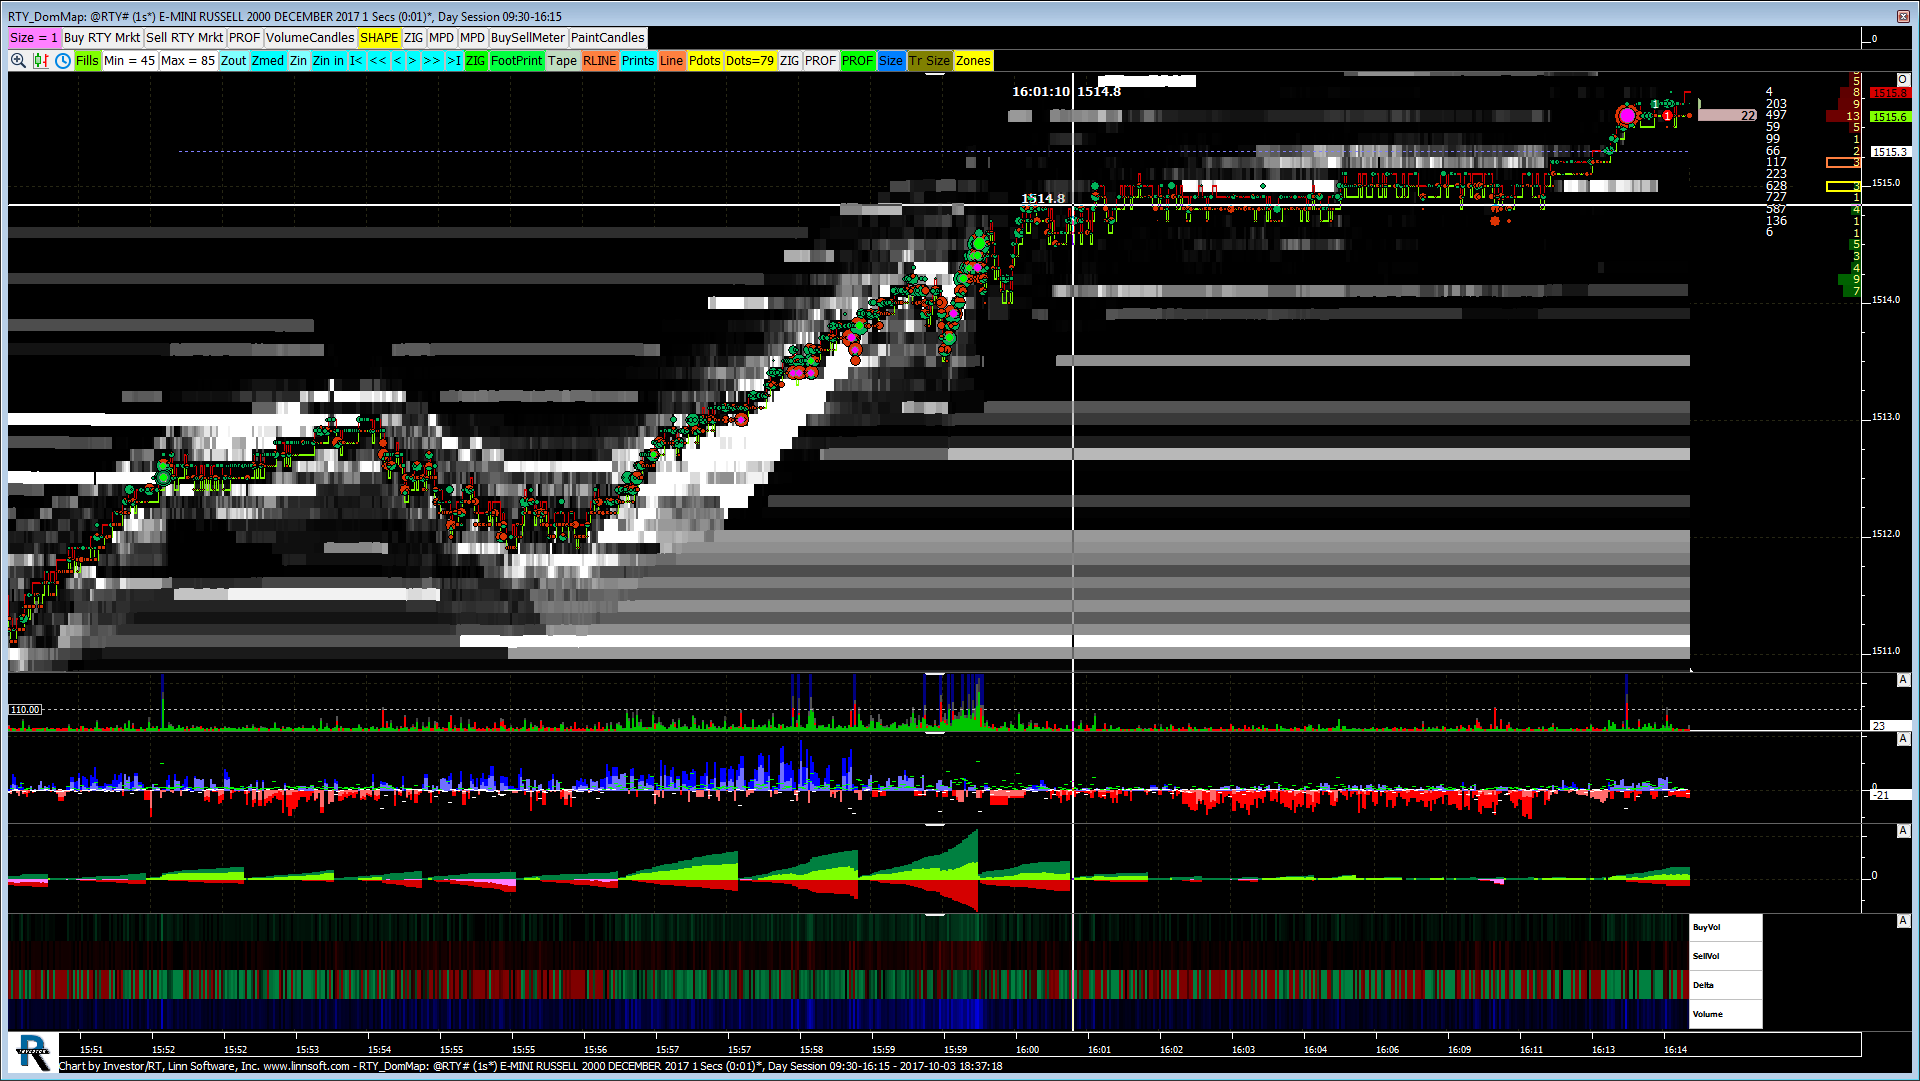 |
RTY DomMap (@RTY#) jayski51369 [totalcount]
8 years 10 months ago
This chart was uploaded by Investor/RT 12.7.6 showing symbol: @RTY#. |
View |
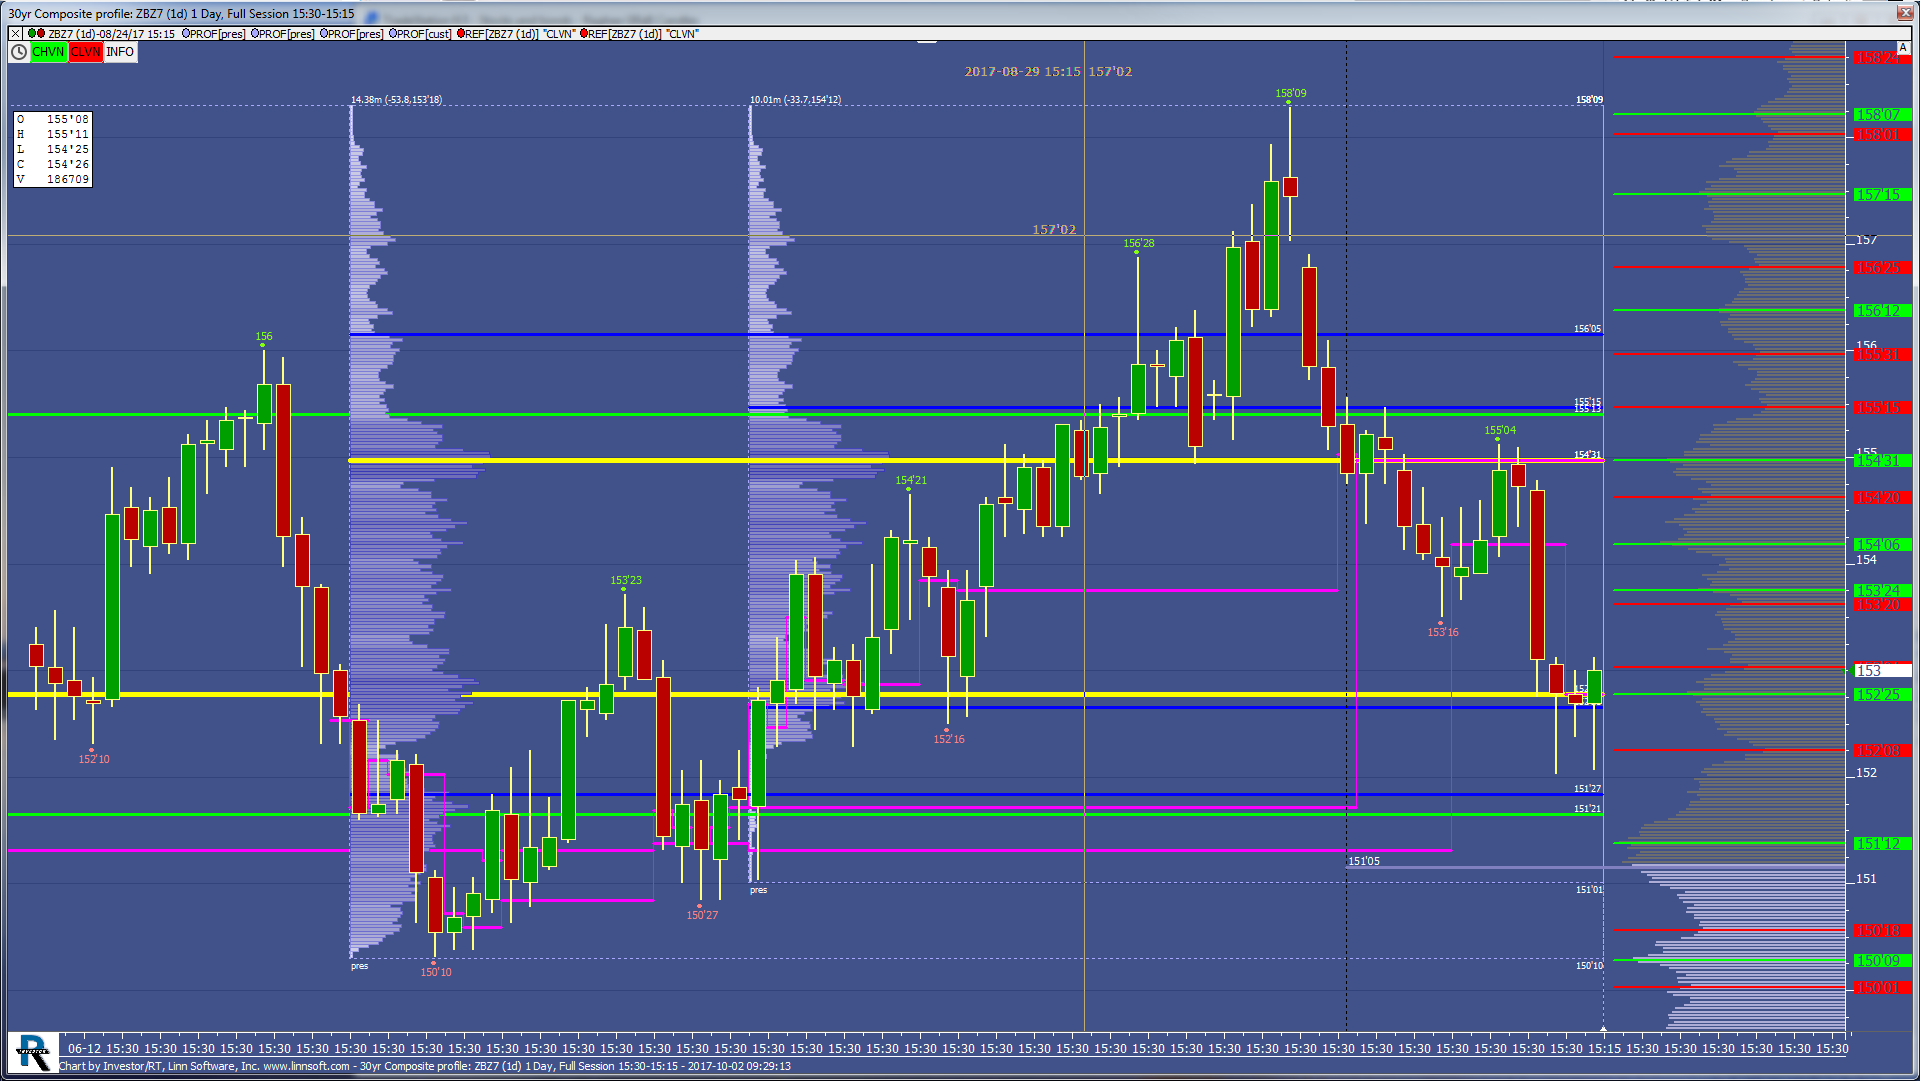 |
30yr Composite profile (ZBZ7) scottz46 [totalcount]
8 years 10 months ago
This chart was uploaded by Investor/RT 12.7.1 showing symbol: ZBZ7. |
View |
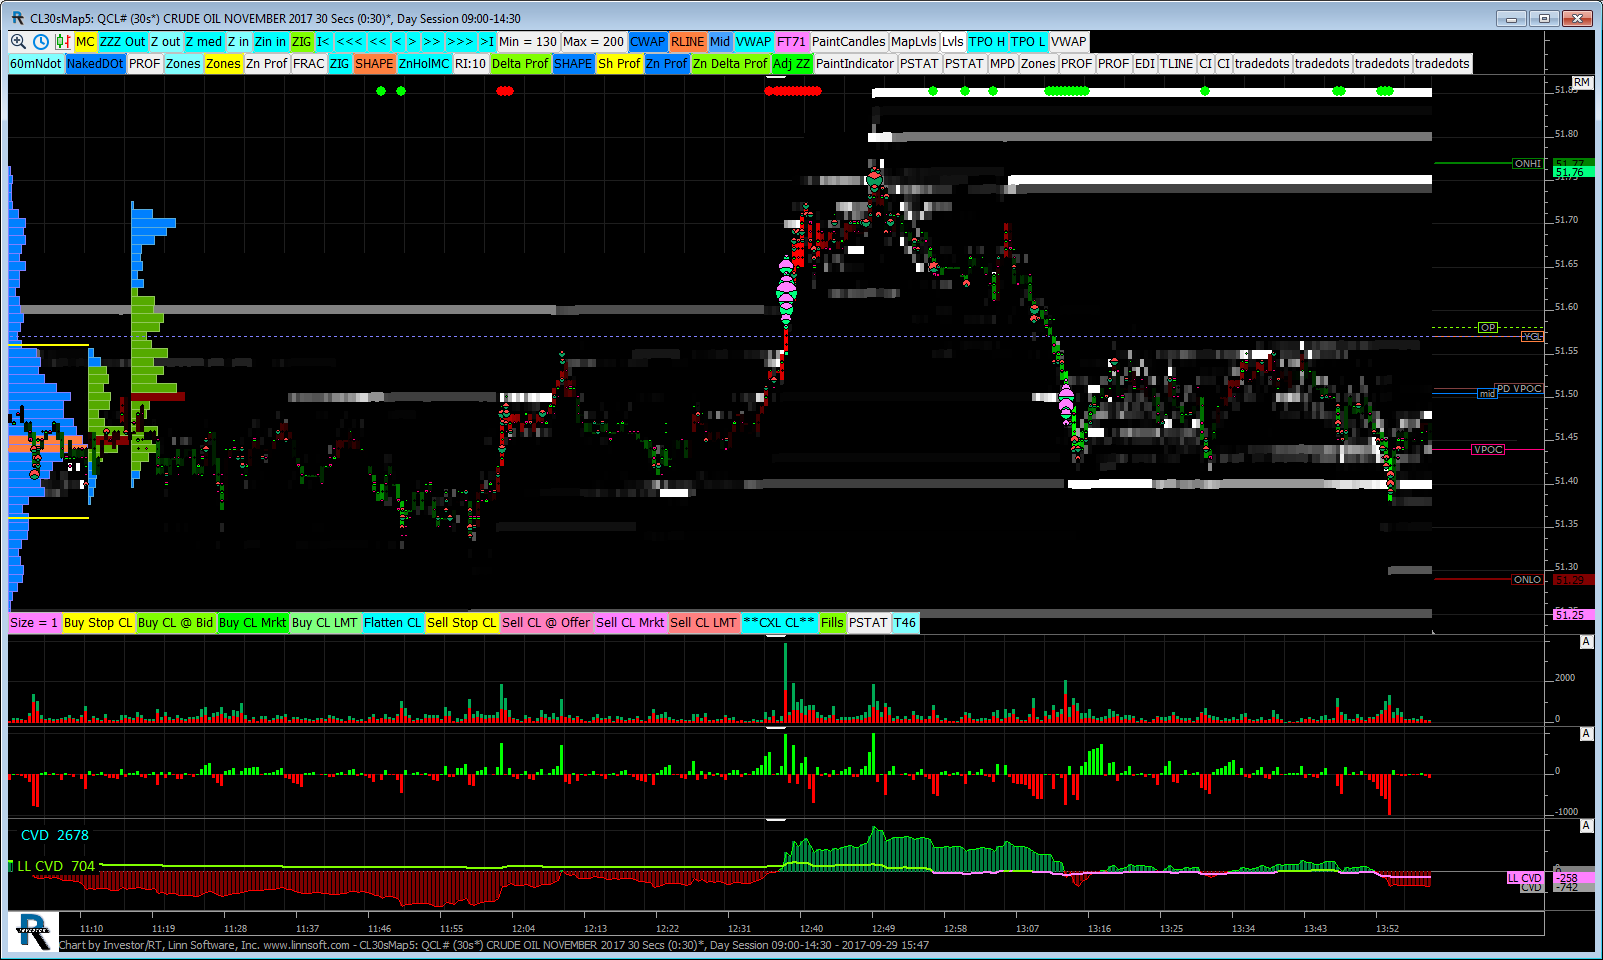 |
CL30sMap (QCL#) jayski51369 [totalcount]
8 years 10 months ago
This chart was uploaded by Investor/RT 12.7.6 showing symbol: QCL#. |
View |
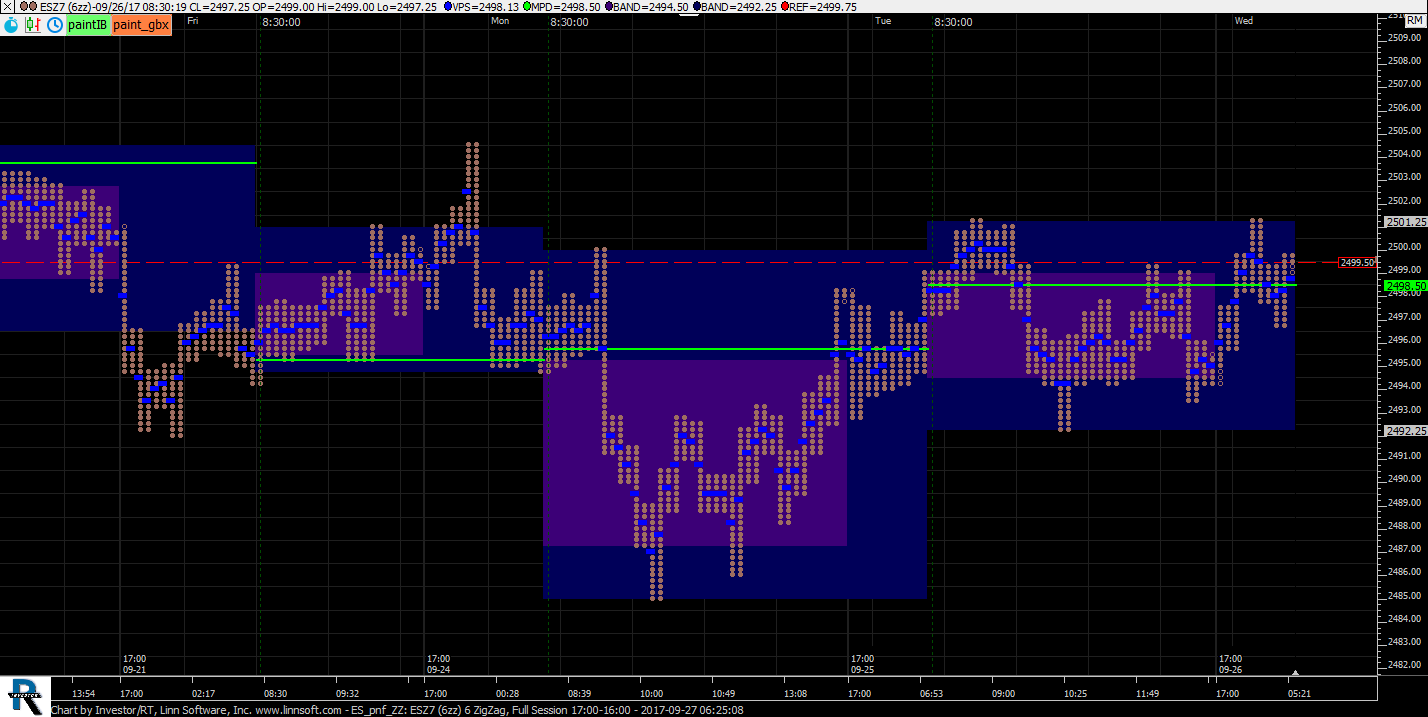 |
ES pnf ZZ (ESZ7) ctj0601 [totalcount]
8 years 10 months ago
pnf style on ZigZag periodicity. This chart was uploaded by Investor/RT 12.7.6 showing symbol: ESZ7. |
View |
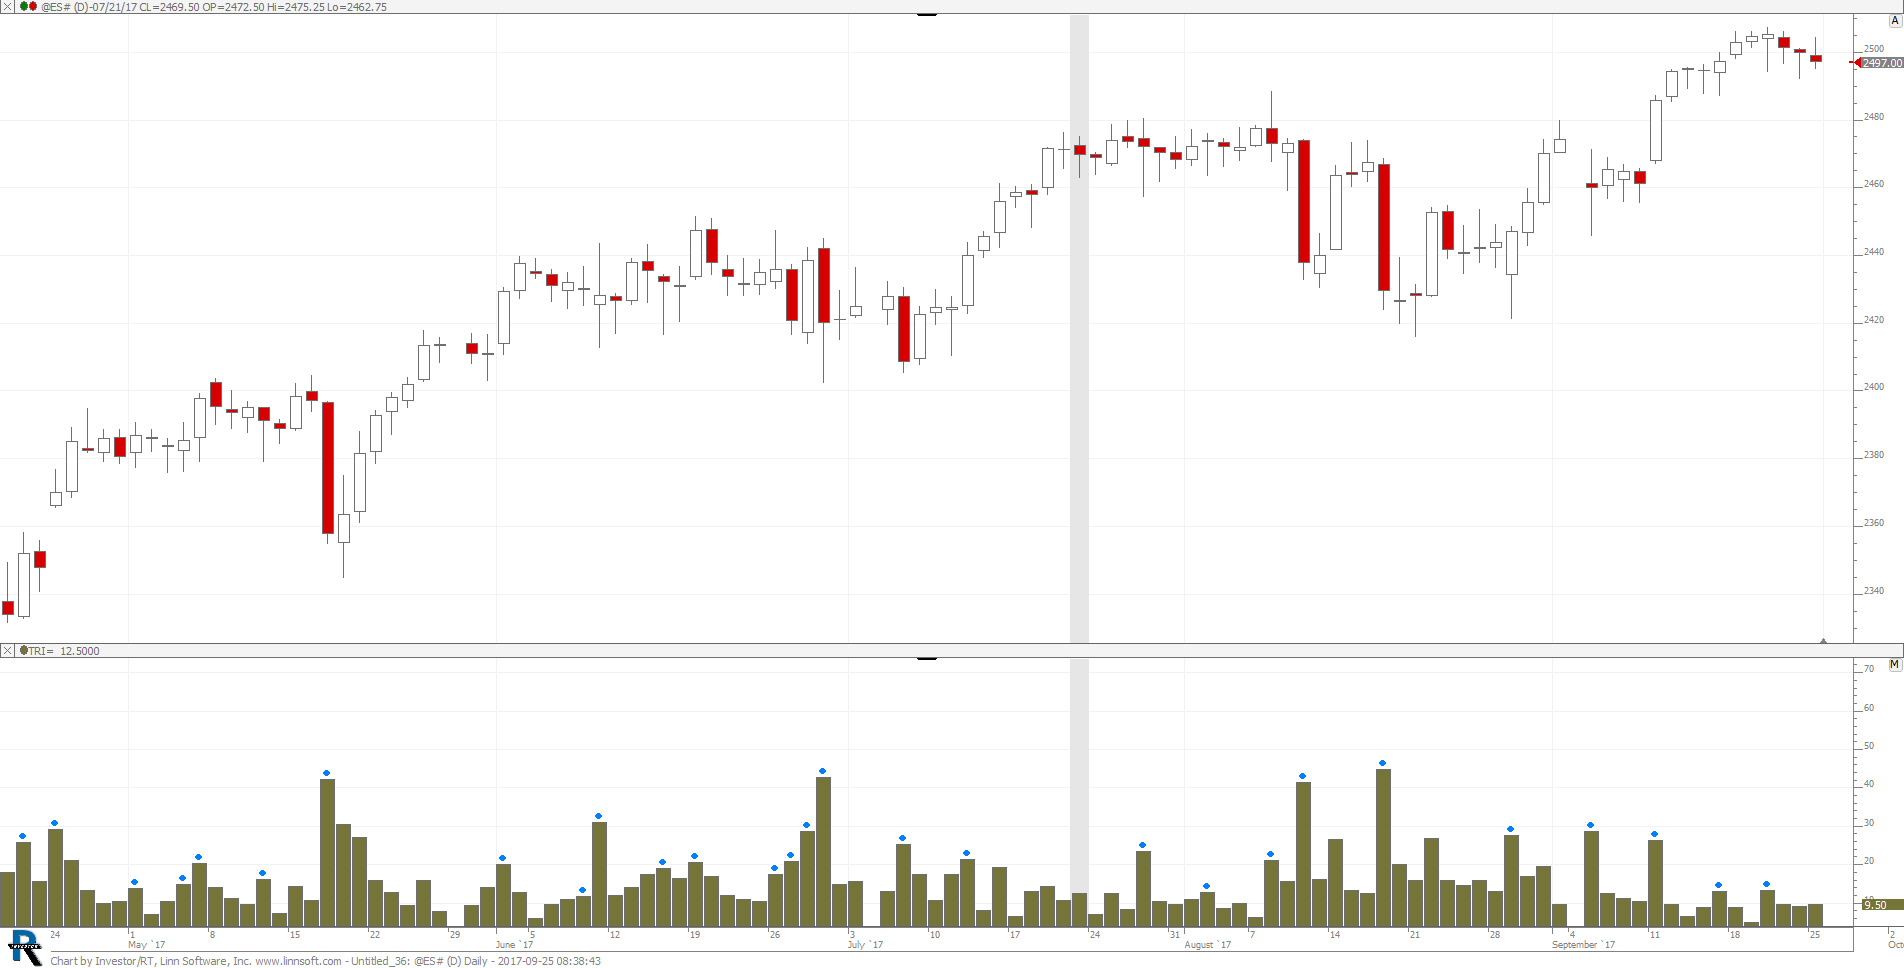 |
Untitled 36 (@ES#) scooke [totalcount]
8 years 10 months ago
This chart was uploaded by Investor/RT 12.7.6 showing symbol: @ES#. |
View |
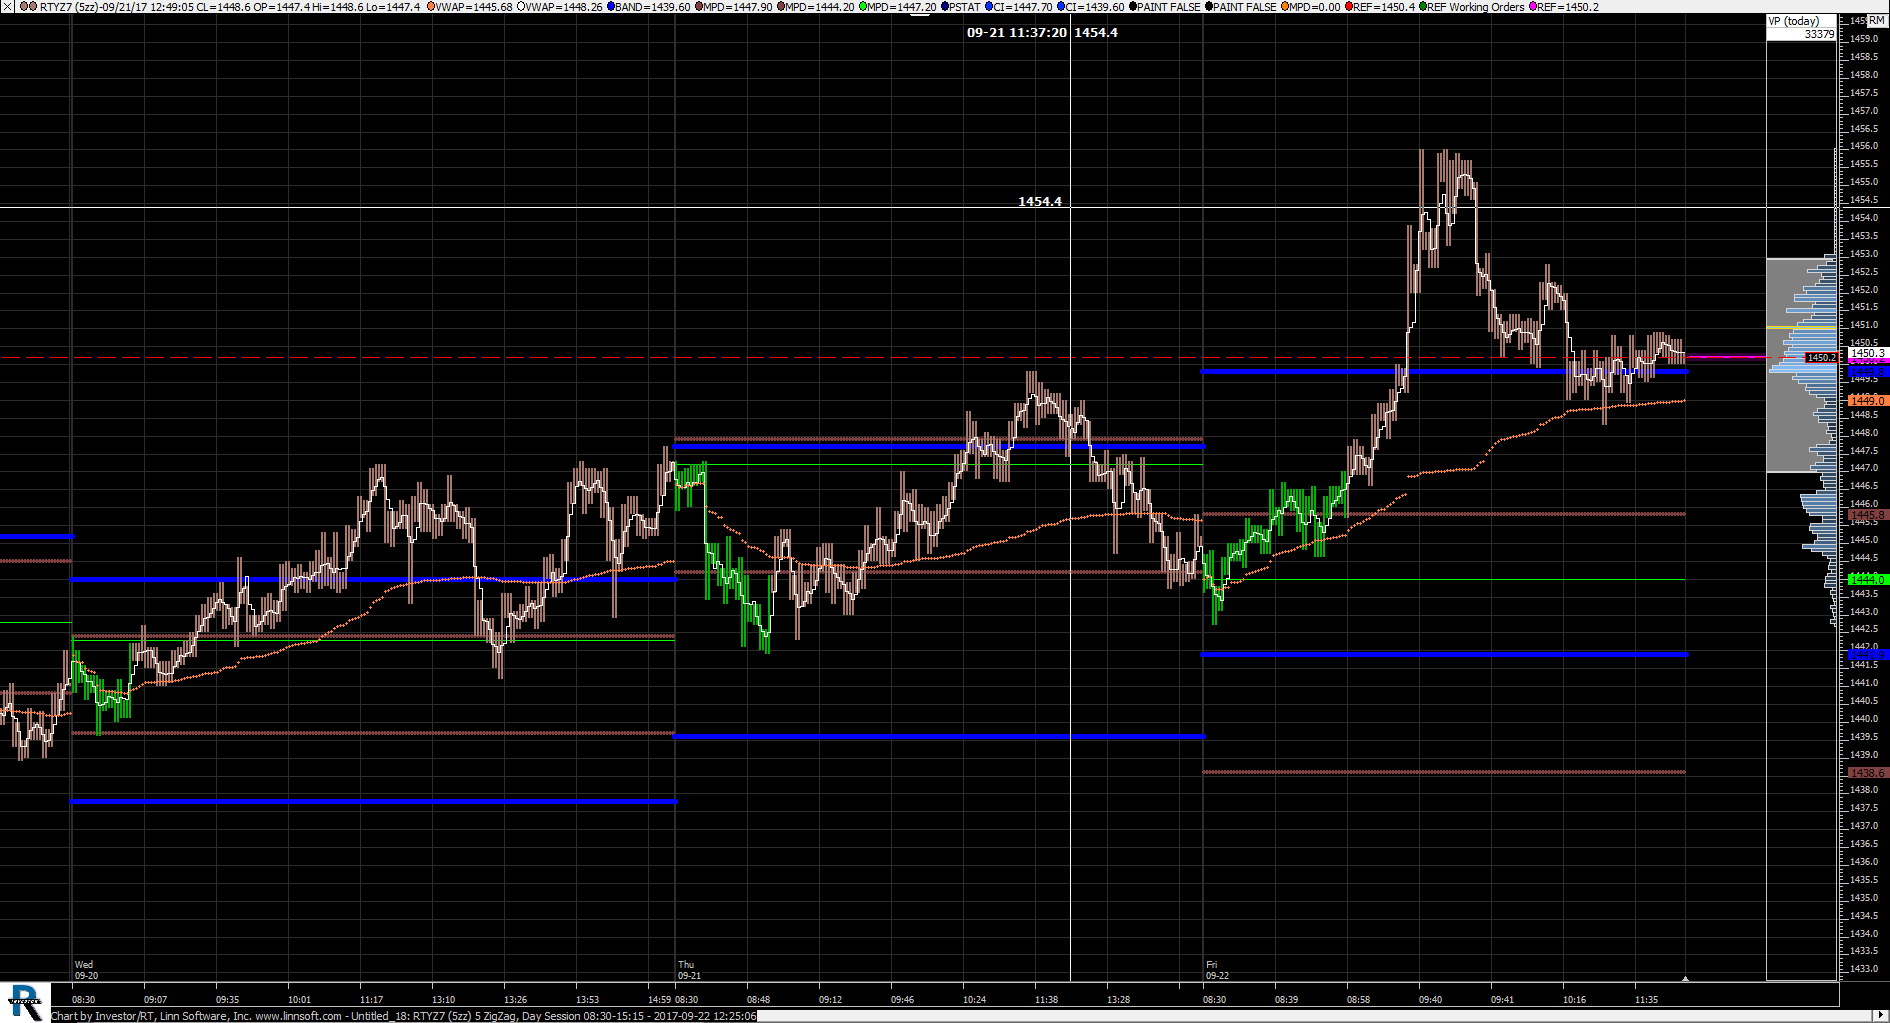 |
Untitled (RTYZ7) ctj0601 [totalcount]
8 years 10 months ago
RTY chart. This chart was uploaded by Investor/RT 12.7.6 showing symbol: RTYZ7. |
View |
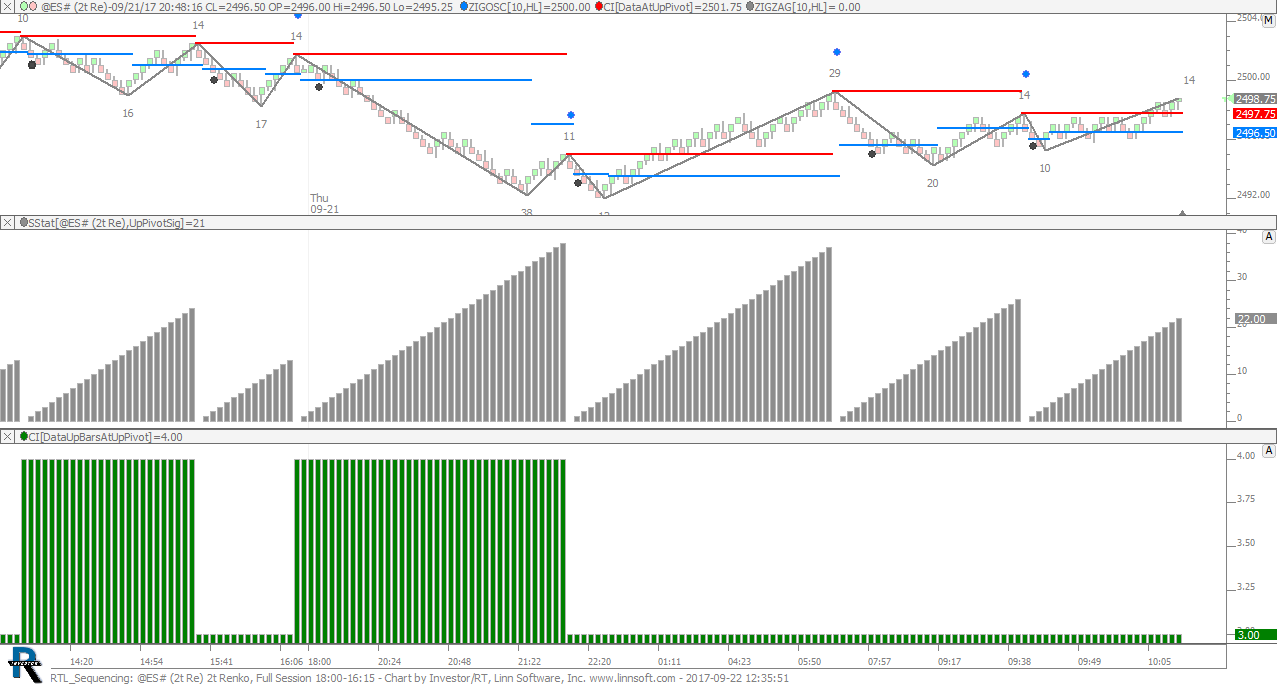 |
RTL Sequencing (@ES#) cpayne [totalcount]
8 years 10 months ago
Advanced RTL - Sequencing Events. This chart was uploaded by Investor/RT 13.1.1 showing symbol: @ES#. |
View |
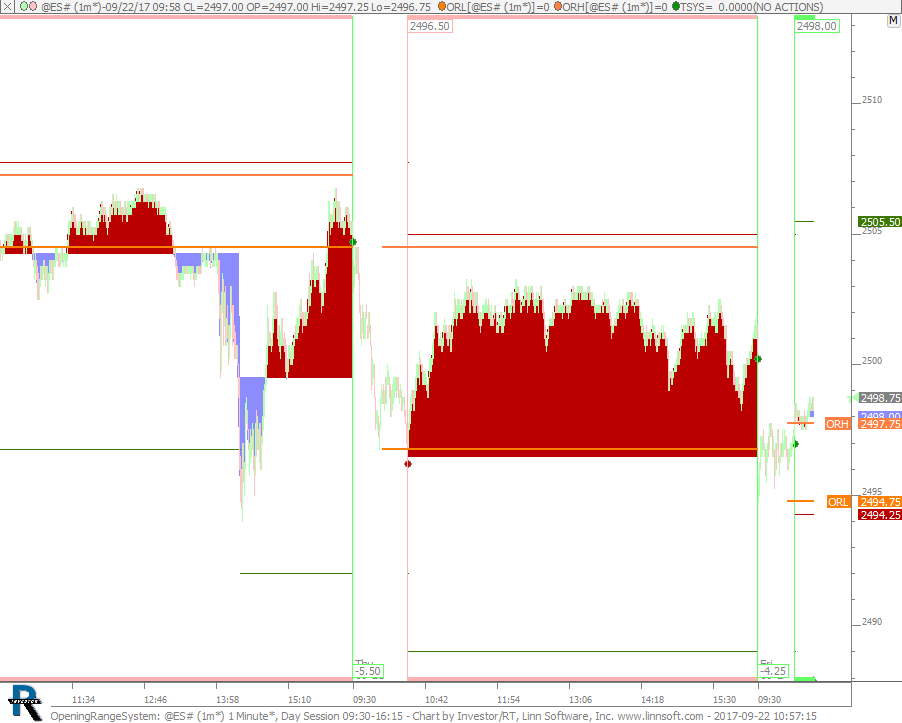 |
OpeningRangeSystem (@ES#) cpayne [totalcount]
8 years 10 months ago
Opening Range Trading System. This chart was uploaded by Investor/RT 13.1.1 showing symbol: @ES#. |
View |
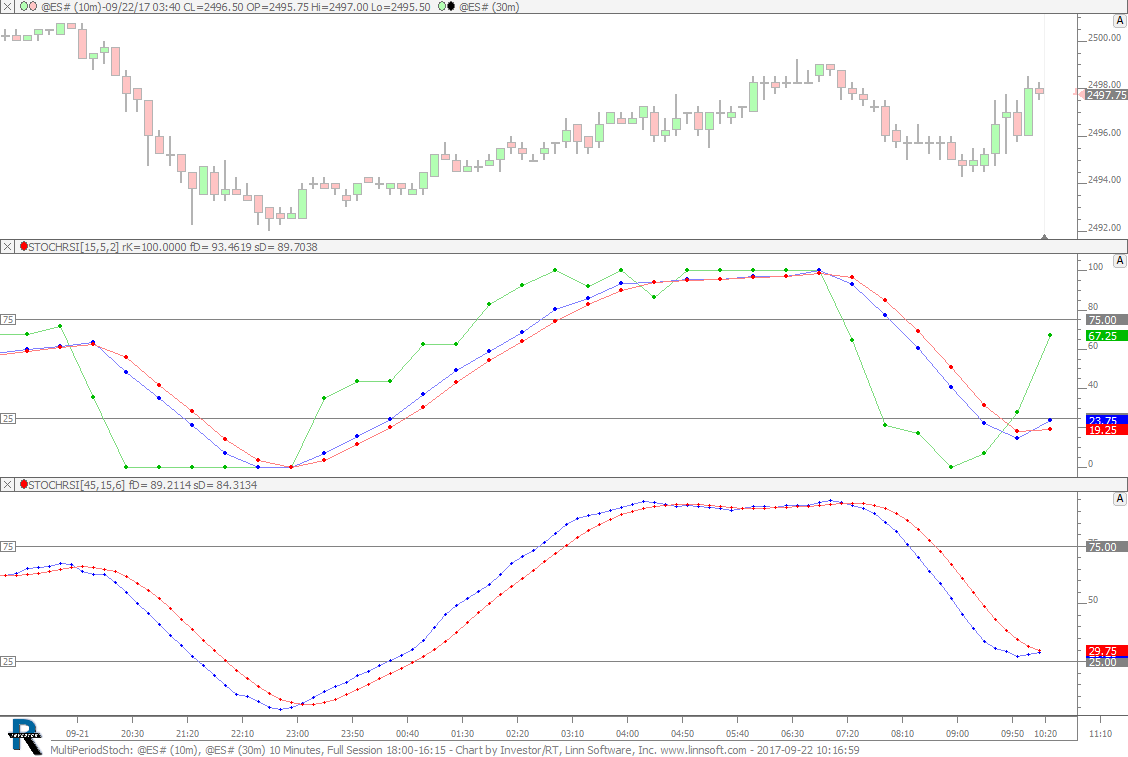 |
MultiPeriodStoch (@ES#) cpayne [totalcount]
8 years 10 months ago
Multi-Period Stochastics Options. This chart was uploaded by Investor/RT 13.1.1 showing symbol: @ES#. |
View |
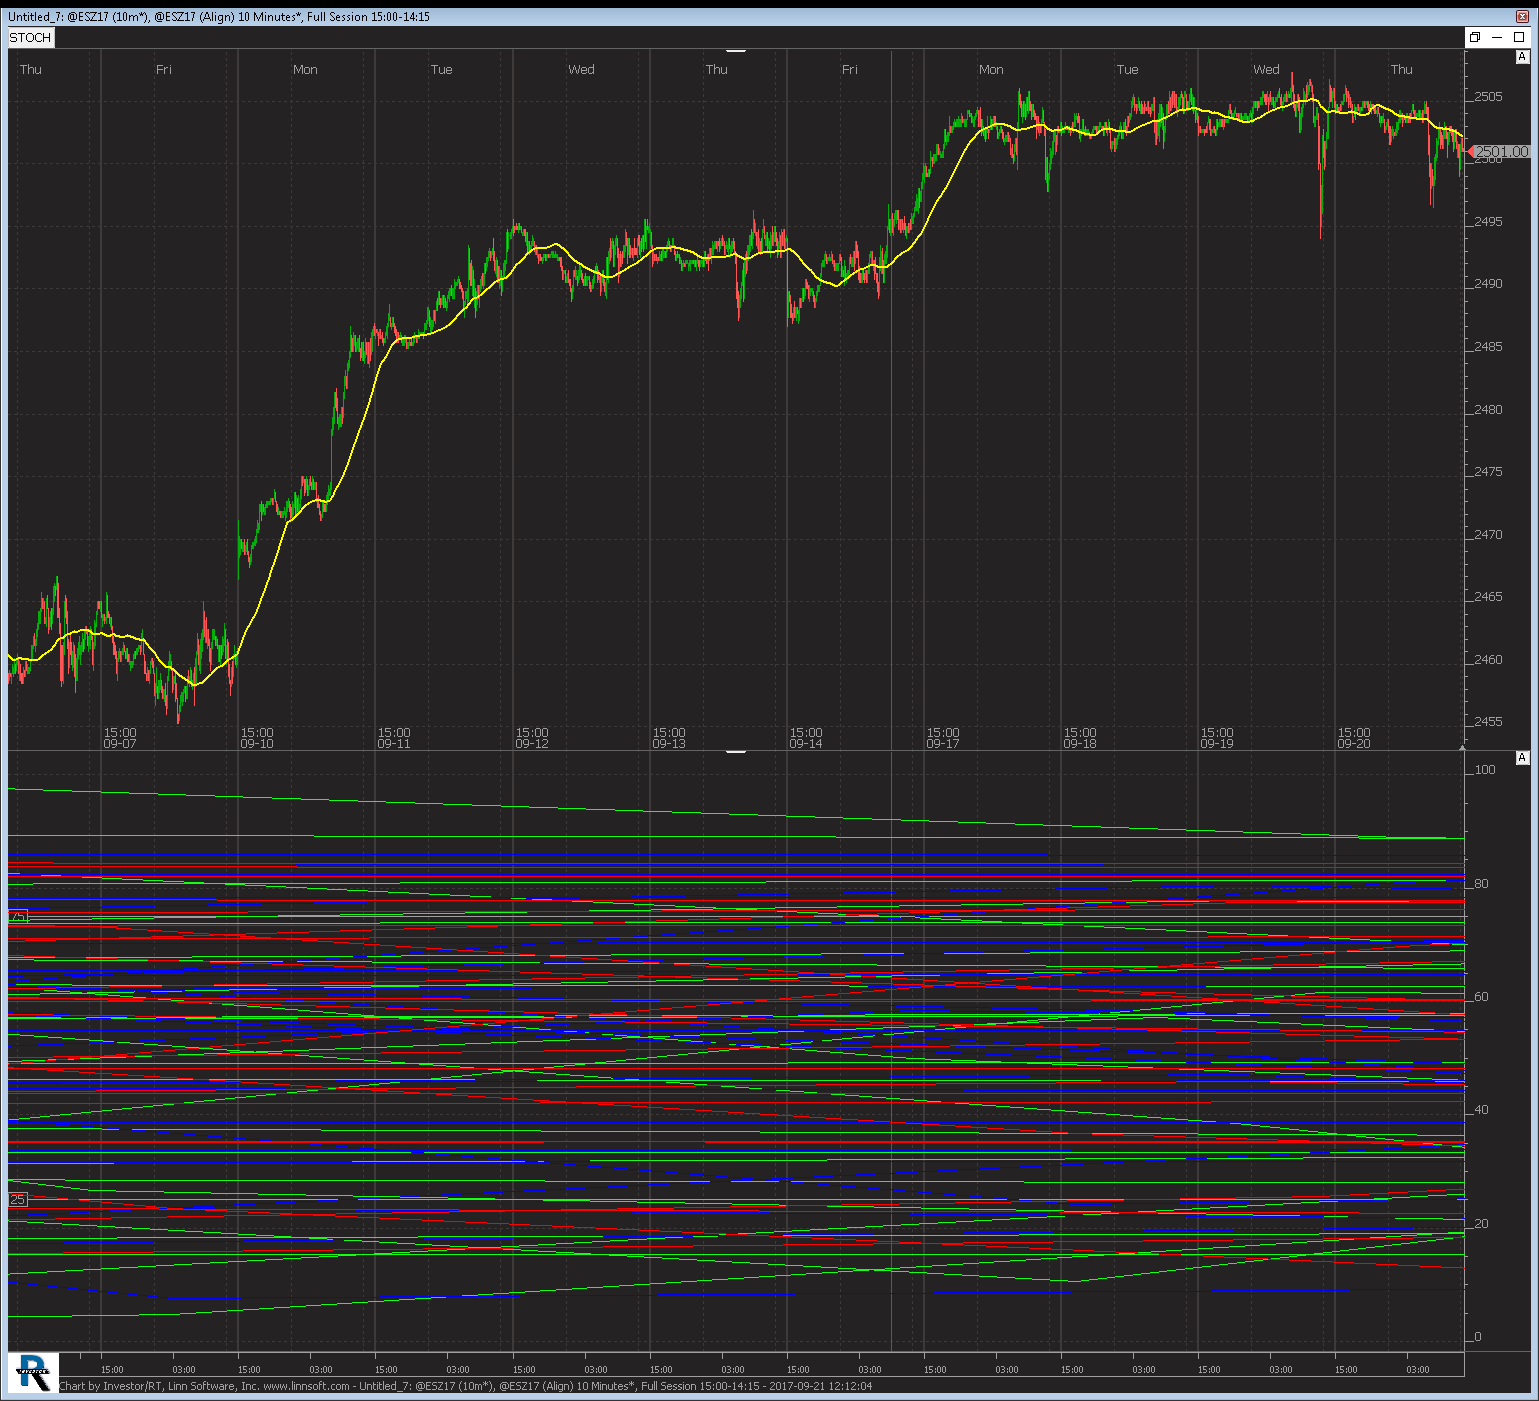 |
Untitled 7 (@ESZ17) aldica [totalcount]
8 years 10 months ago
This chart was uploaded by Investor/RT 12.7.6 showing symbol: @ESZ17. |
View |
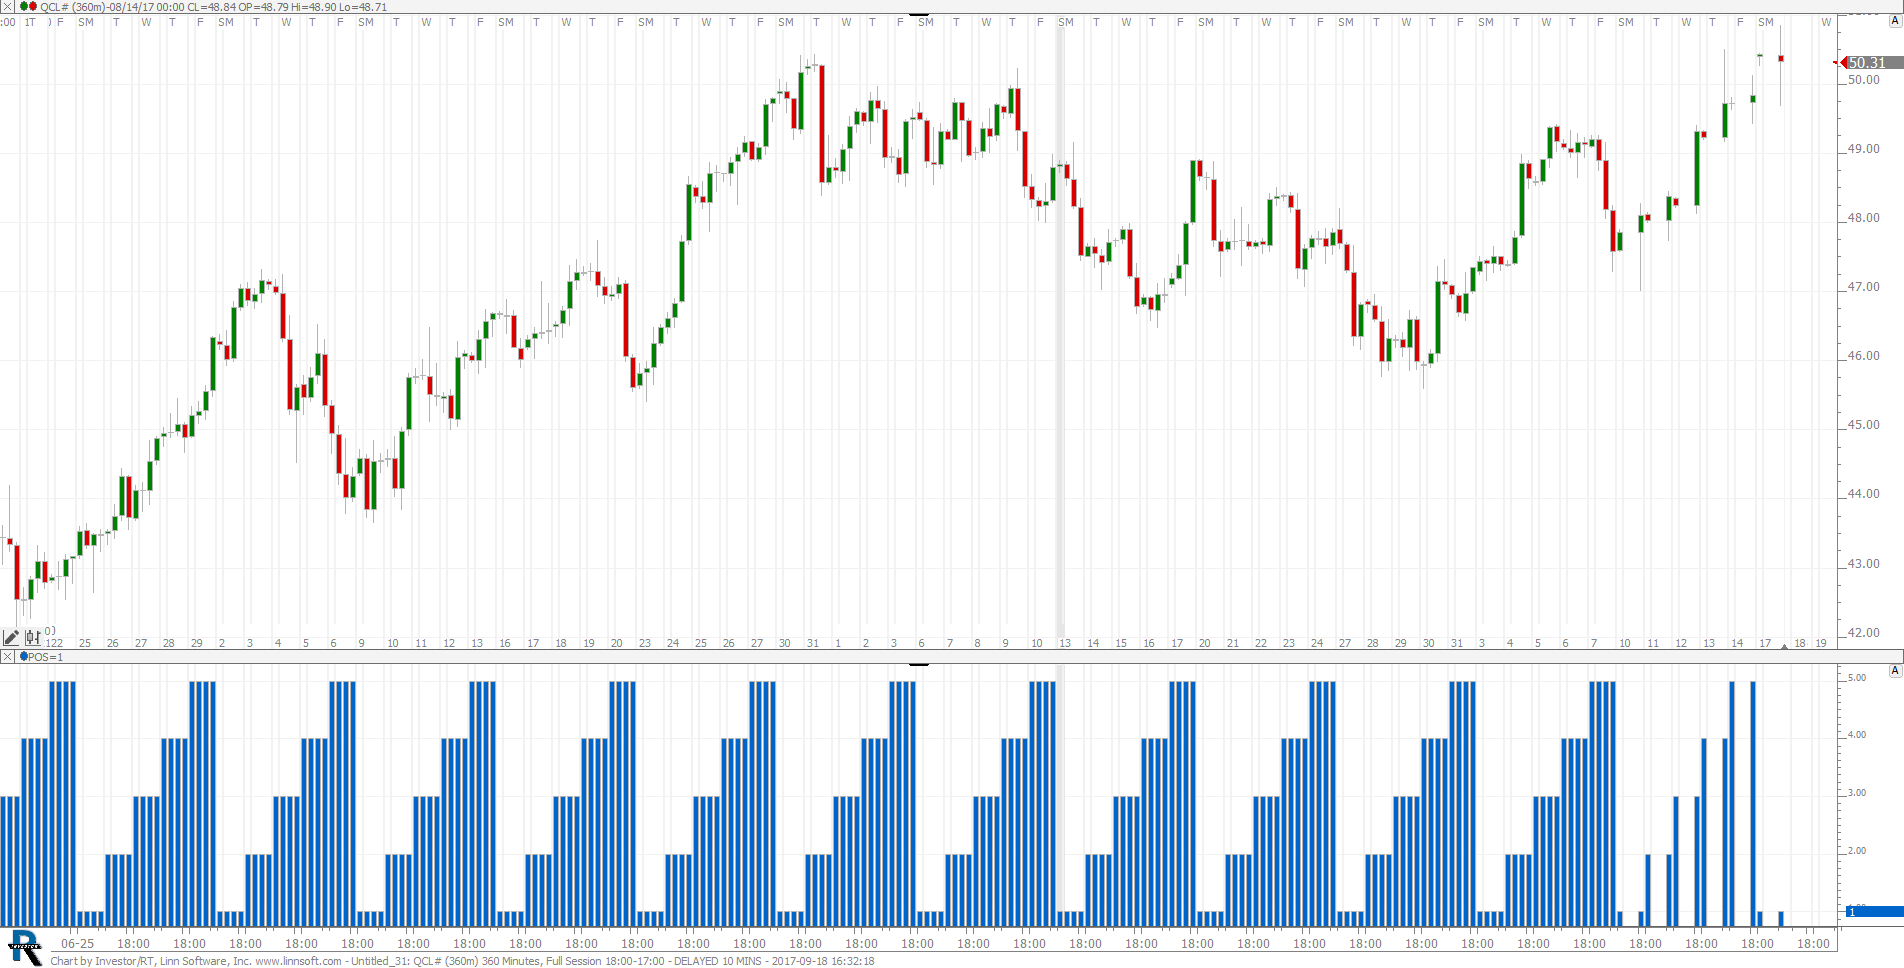 |
Untitled 31 (QCL#) scooke [totalcount]
8 years 10 months ago
This chart was uploaded by Investor/RT 12.7.6 showing symbol: QCL#. |
View |
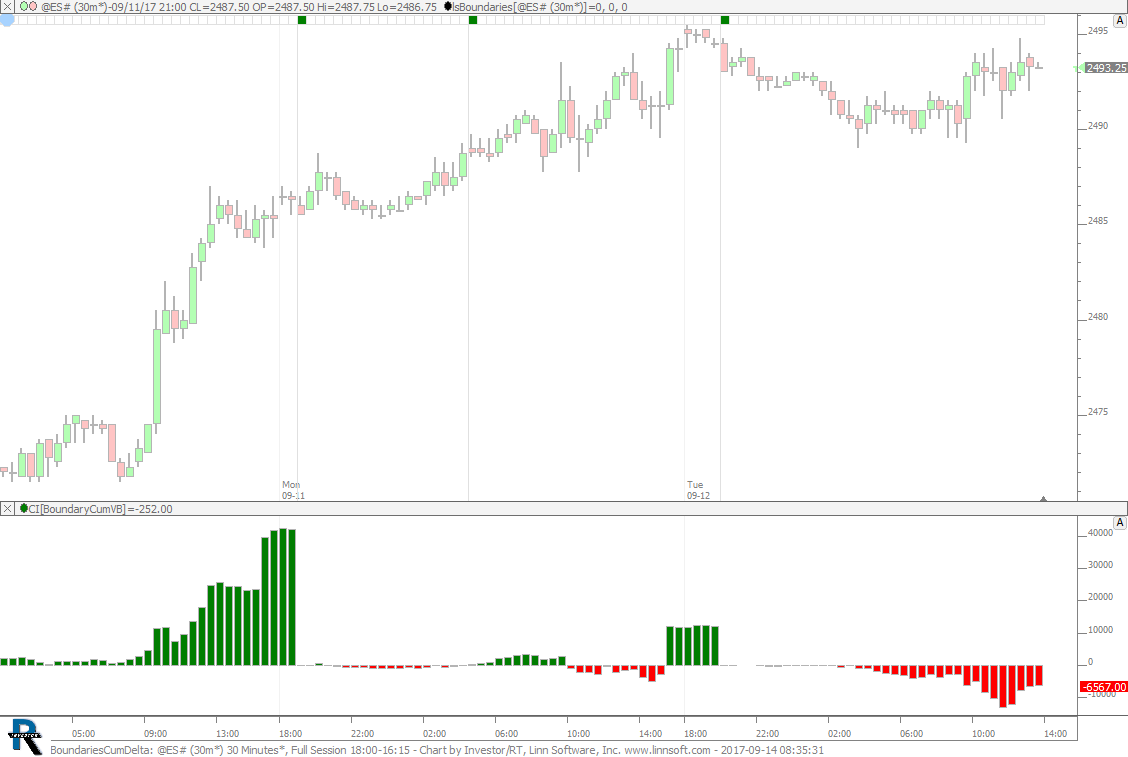 |
BoundariesCumDelta (@ES#) cpayne [totalcount]
8 years 10 months ago
Boundaries Cumulative Delta. This chart was uploaded by Investor/RT 13.1.1 showing symbol: @ES#. |
View |
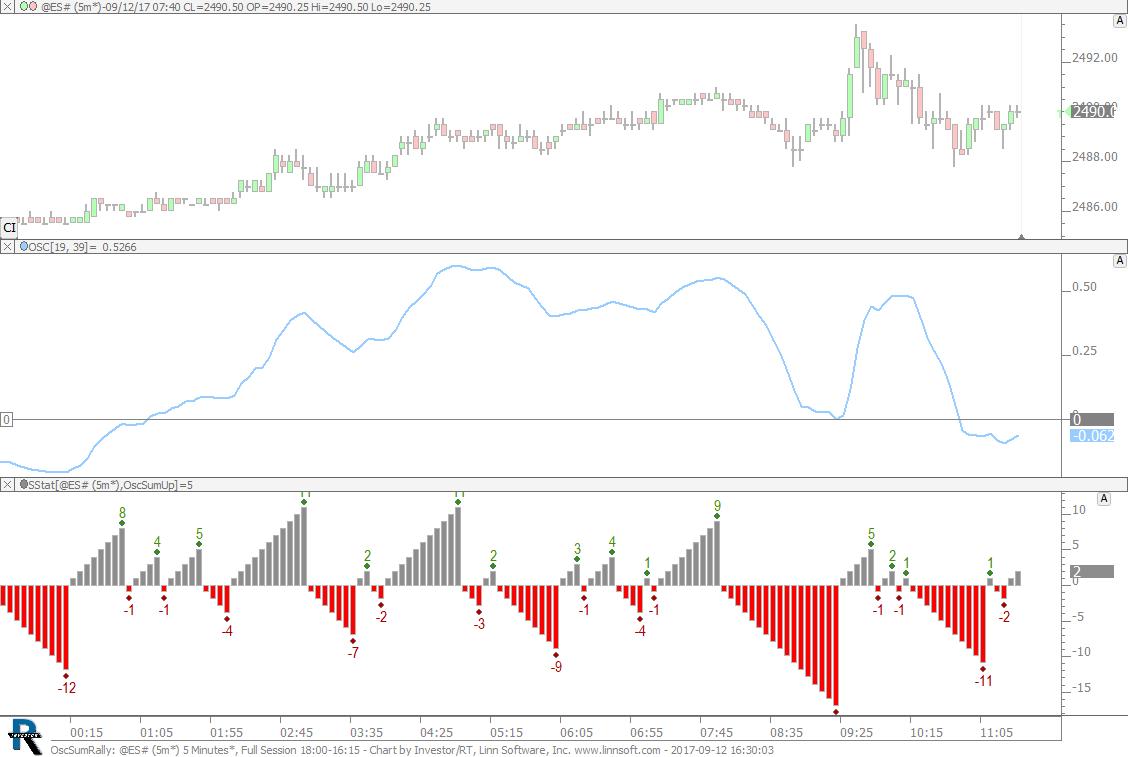 |
OscSumRally (@ES#) cpayne [totalcount]
8 years 10 months ago
Oscillator Summation Rally. This chart was uploaded by Investor/RT 13.1.1 showing symbol: @ES#. |
View |
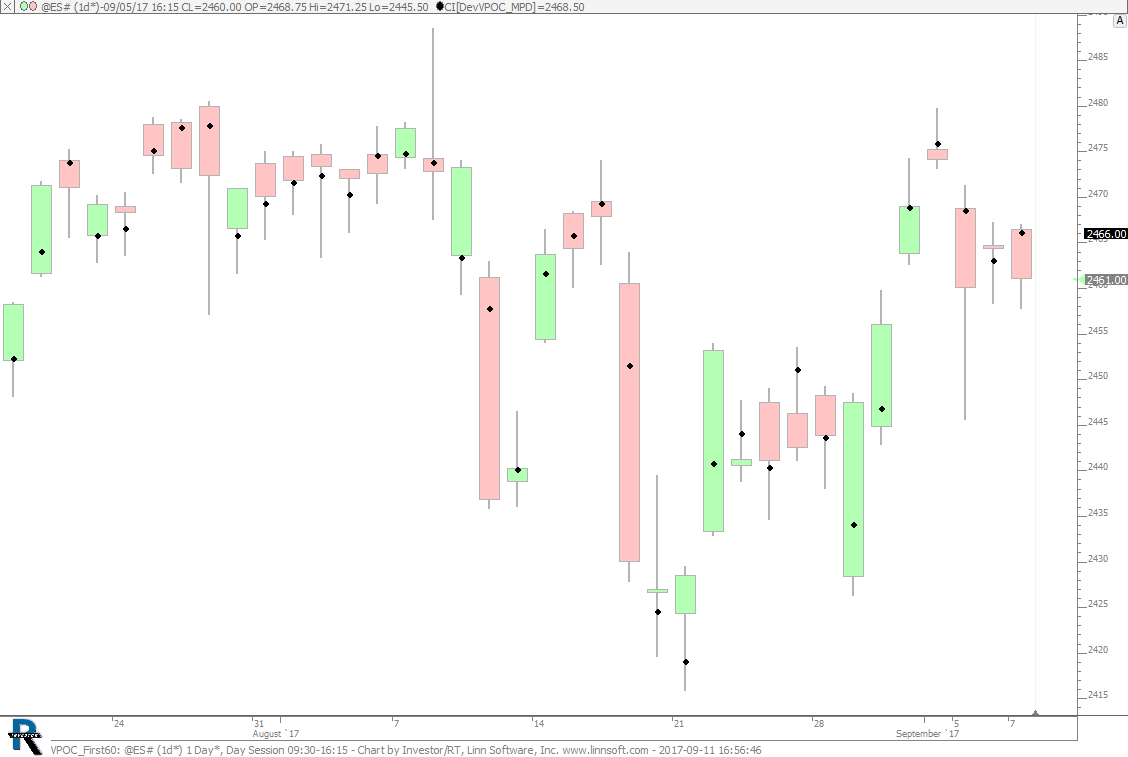 |
VPOC First60 (@ES#) cpayne [totalcount]
8 years 10 months ago
VPOC of 1st 60 Minutes of Session. This chart was uploaded by Investor/RT 13.1.1 showing symbol: @ES#. |
View |
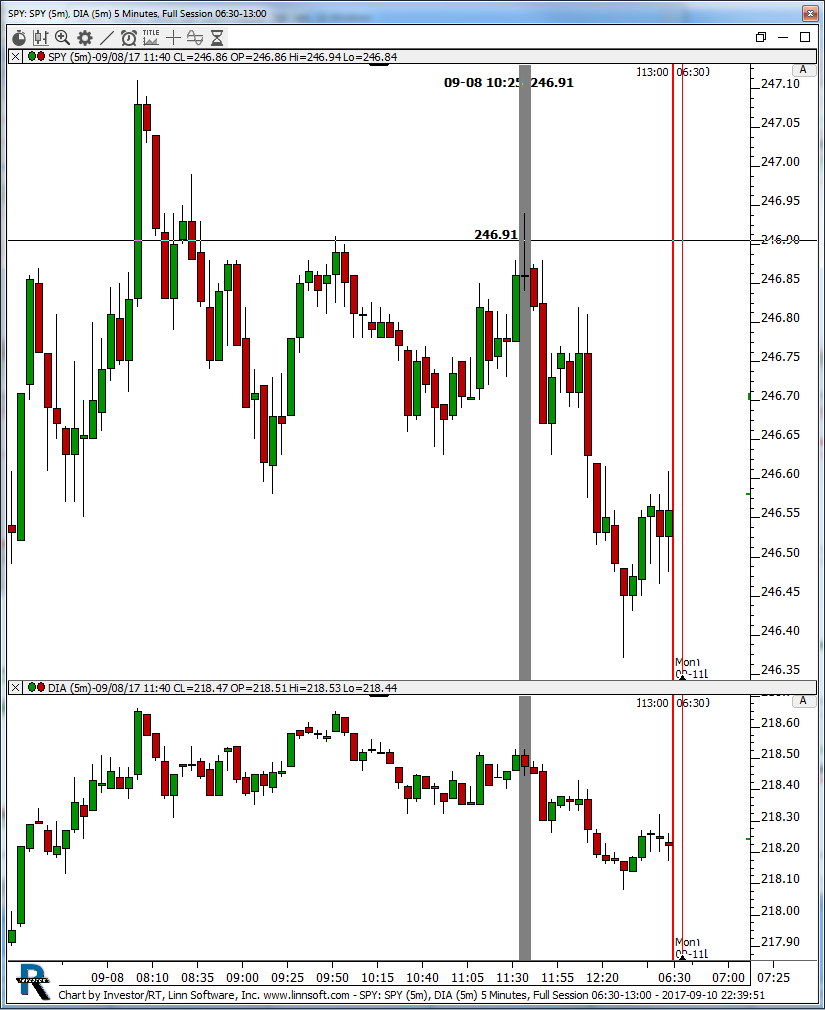 |
SPY (SPY) kencassorla [totalcount]
8 years 10 months ago
spy/dia. This chart was uploaded by Investor/RT 12.7.6 showing symbol: SPY. |
View |
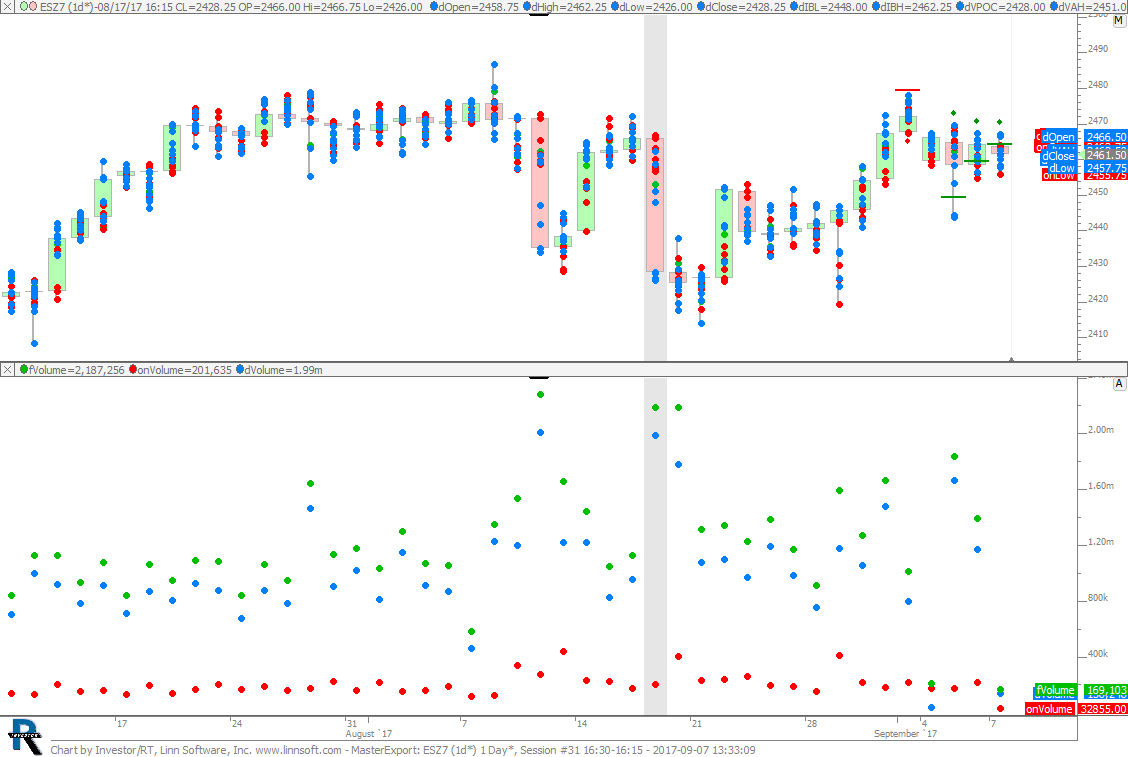 |
MasterExport (ESZ7) SPetkov [totalcount]
8 years 10 months ago
This chart was uploaded by Investor/RT 12.7.6 showing symbol: ESZ7. |
View |
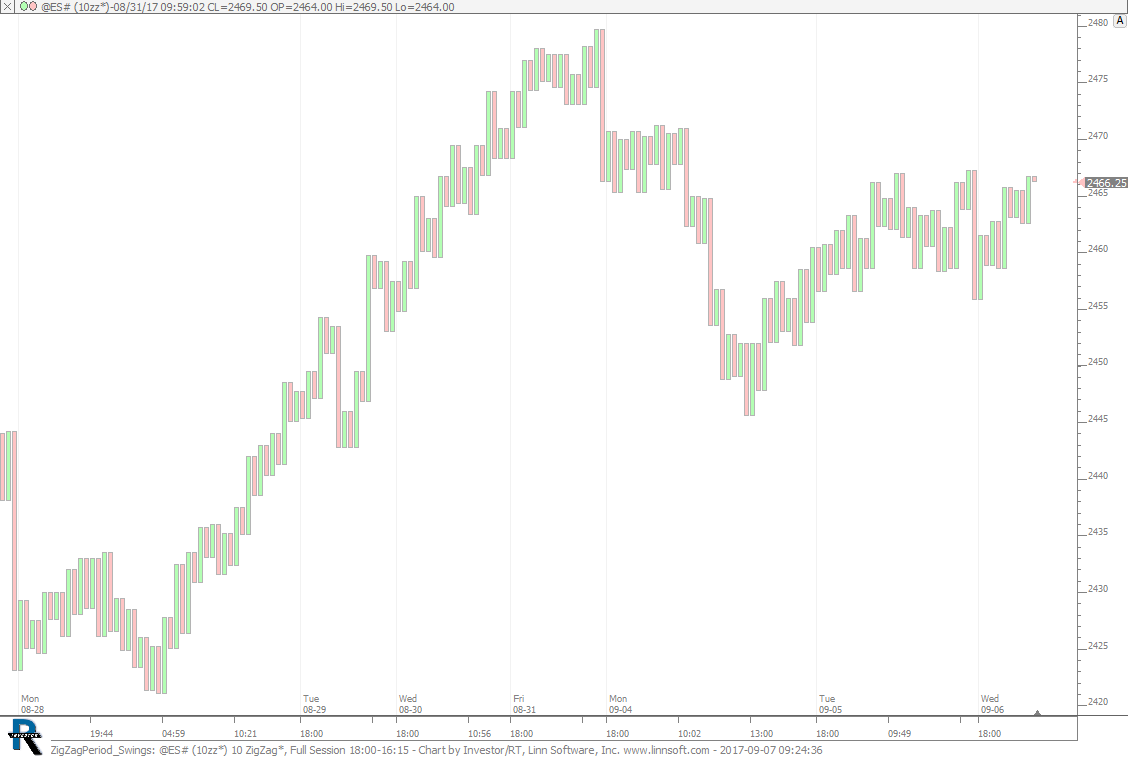 |
ZigZagPeriod Swings (@ES#) cpayne [totalcount]
8 years 10 months ago
Zig Zag Periodicity - Swing Highs/Lows. This chart was uploaded by Investor/RT 13.1.1 showing symbol: @ES#. |
View |
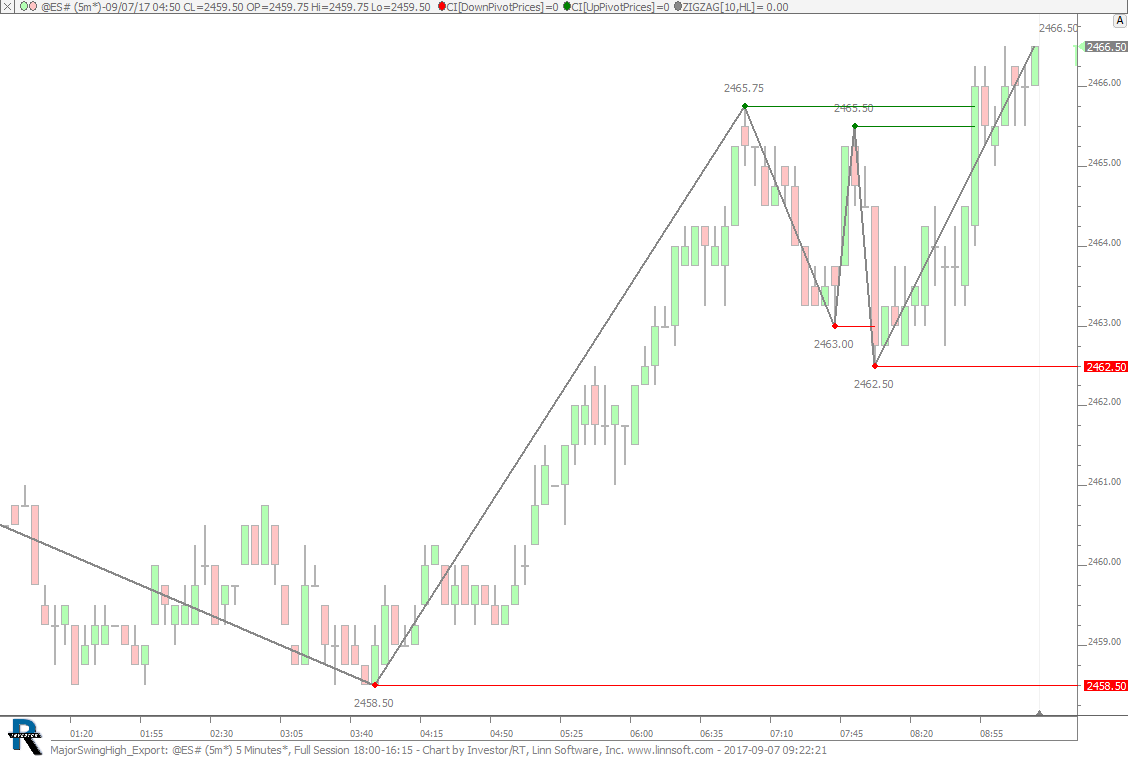 |
MajorSwingHigh Export (@ES#) cpayne [totalcount]
8 years 10 months ago
Up and Down Pivots for Export. This chart was uploaded by Investor/RT 13.1.1 showing symbol: @ES#. |
View |
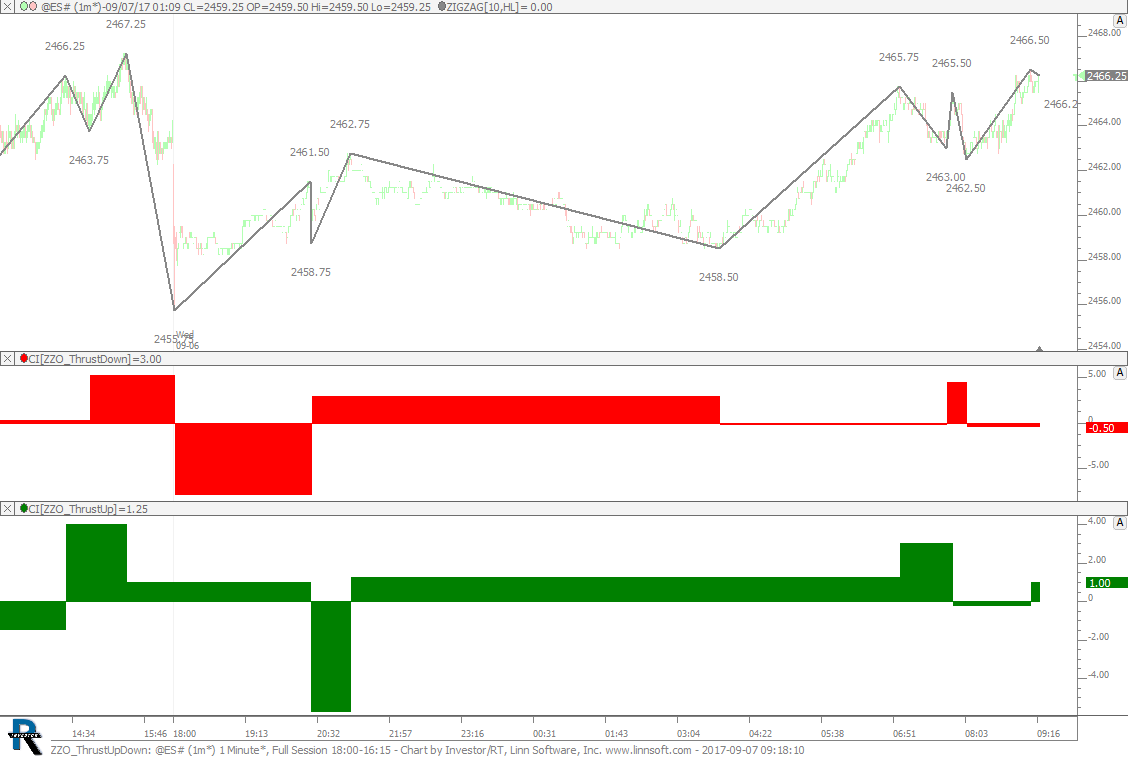 |
ZZO ThrustUpDown (@ES#) cpayne [totalcount]
8 years 10 months ago
ZZO - Thrust Up and Down. This chart was uploaded by Investor/RT 13.1.1 showing symbol: @ES#. |
View |