 |
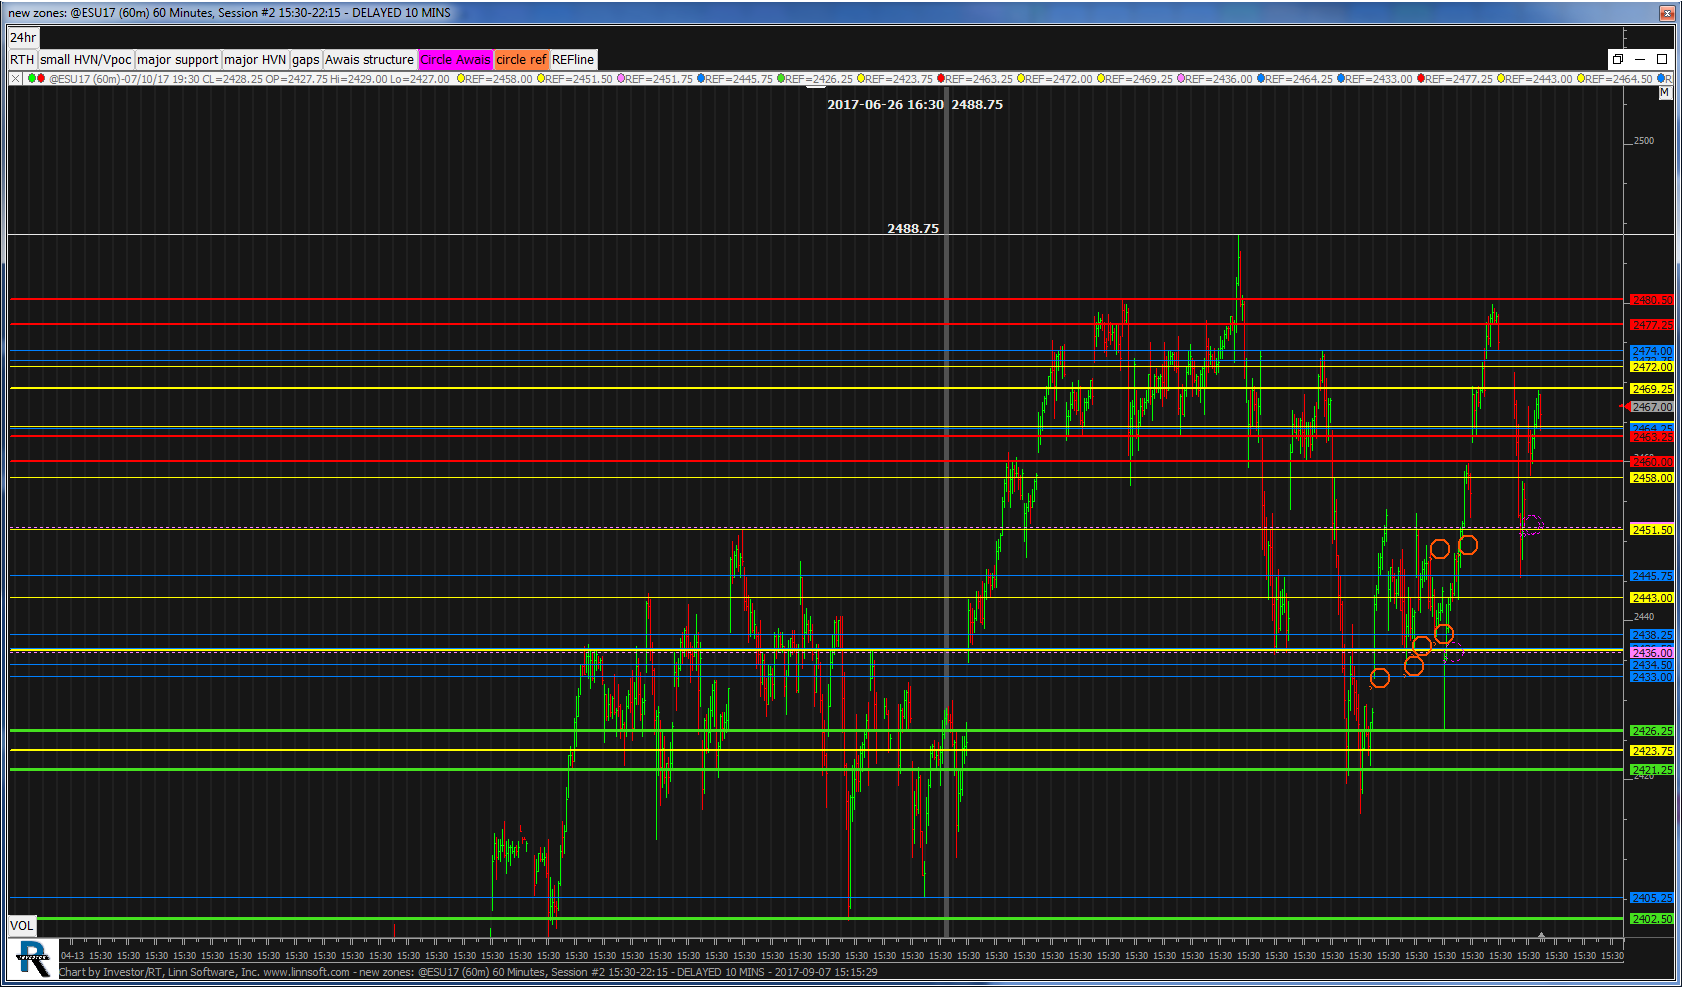
new zones (@ESU17) Joern Felgendreher [totalcount]
8 years 10 months ago
This chart was uploaded by Investor/RT 12.7.3 showing symbol: @ESU17. |
View |
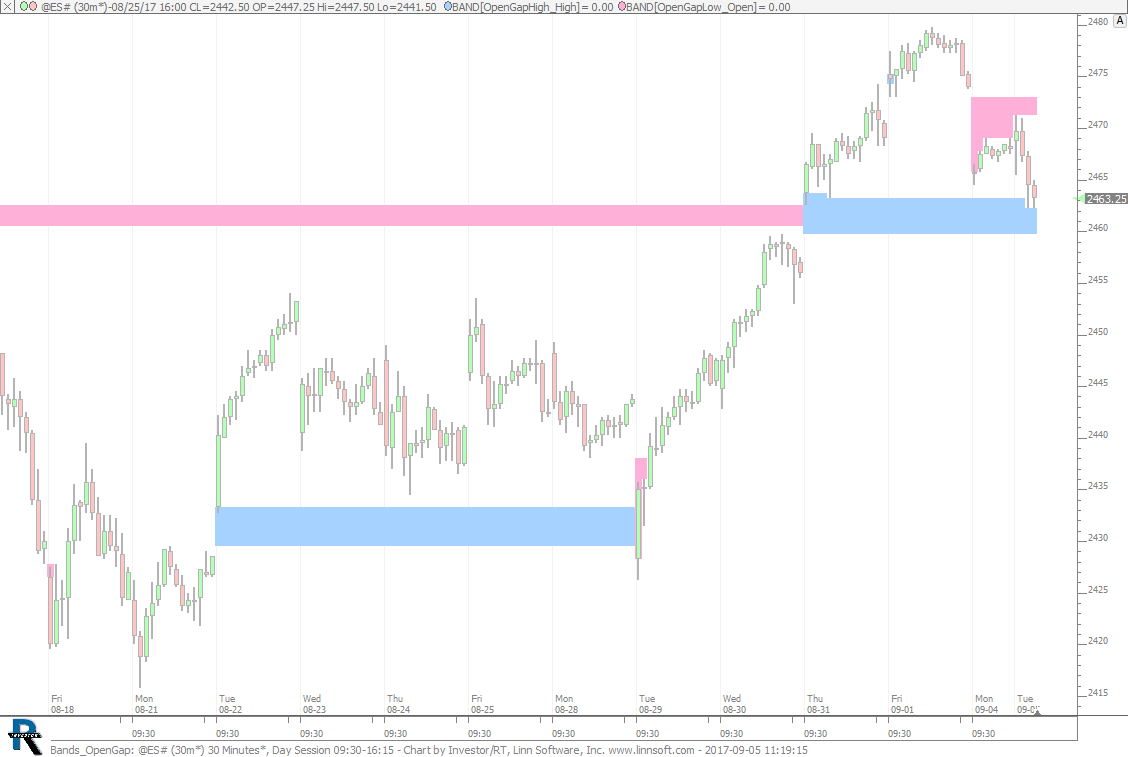 |
Bands OpenGap (@ES#) cpayne [totalcount]
8 years 11 months ago
Bands - Open Gap Yesterdays Range. This chart was uploaded by Investor/RT 13.1.1 showing symbol: @ES#. |
View |
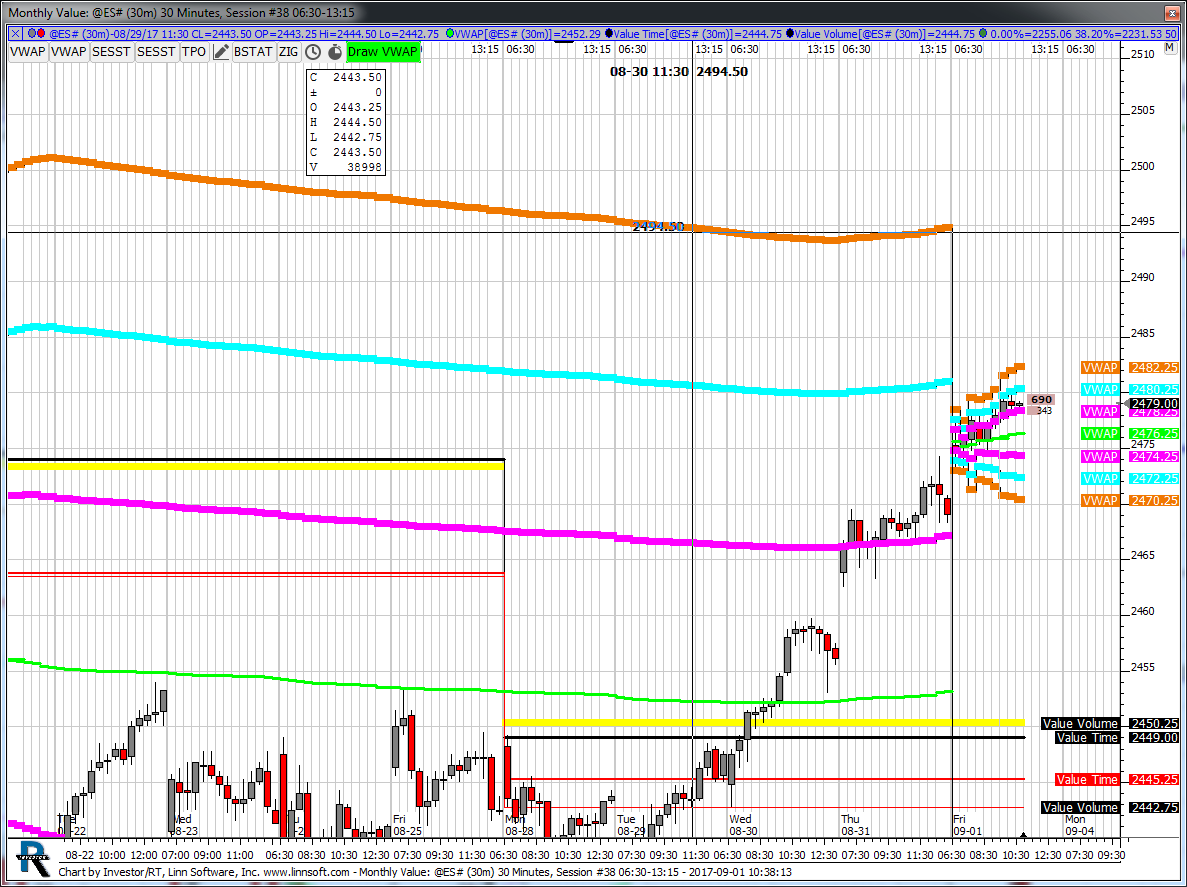 |
Monthly Value (@ES#) Marvin Baker [totalcount]
8 years 11 months ago
This chart was uploaded by Investor/RT 12.7.6 showing symbol: @ES#. |
View |
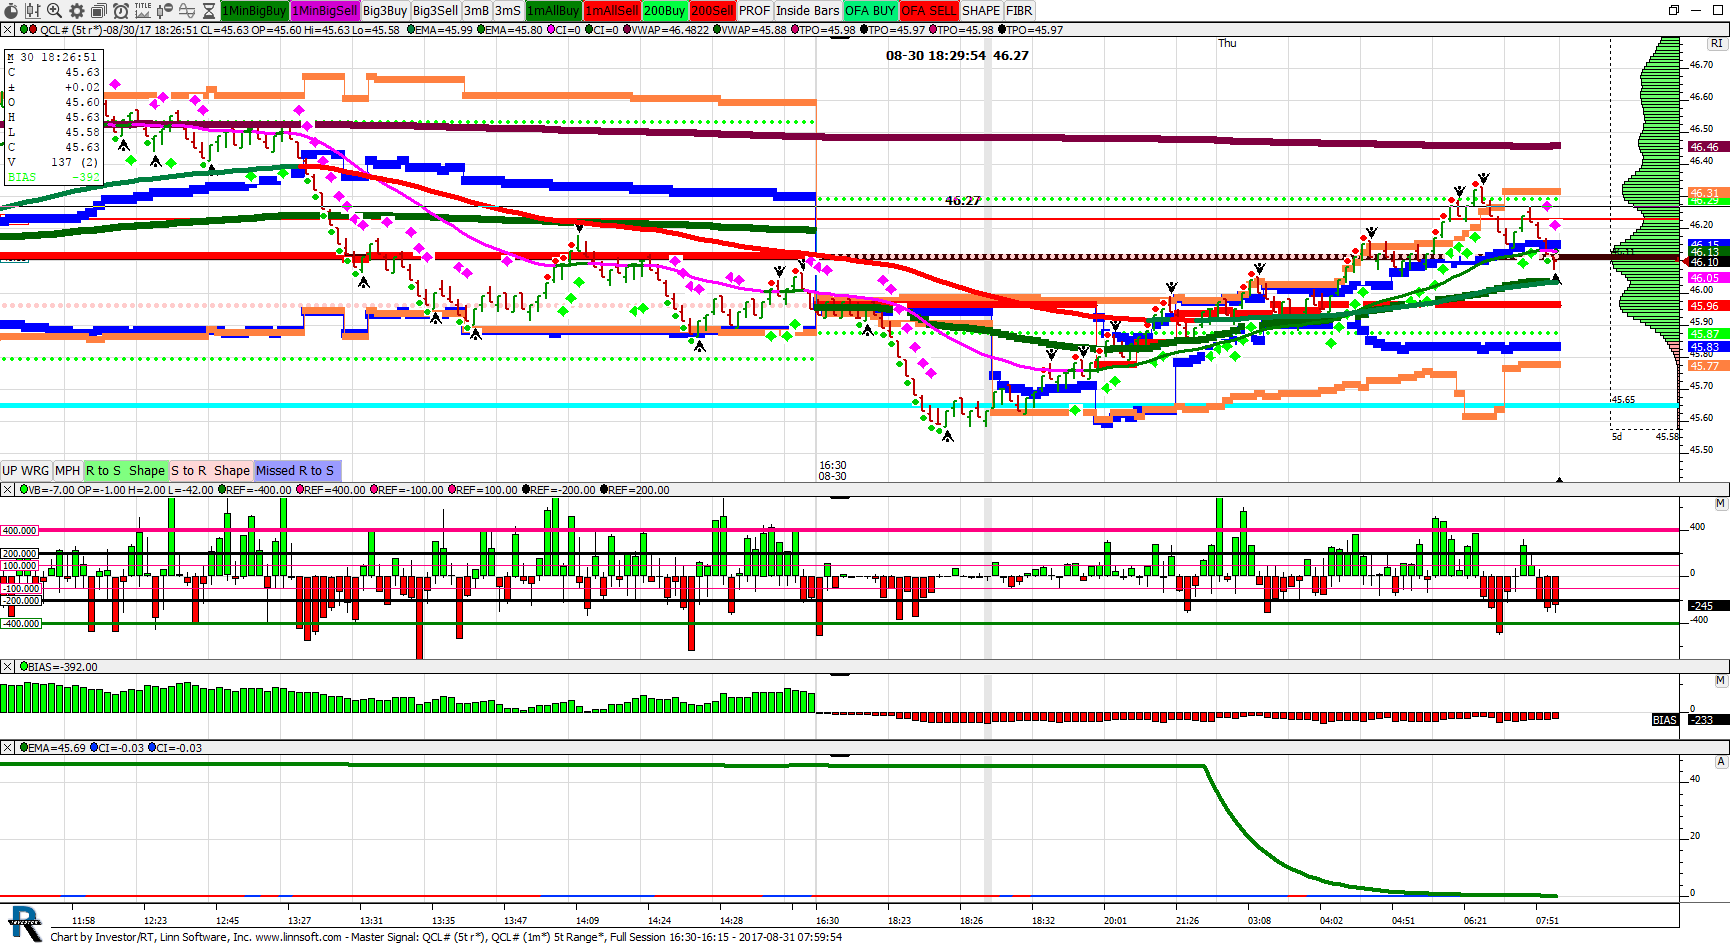 |
Master Signal (QCL#) dbutcherd [totalcount]
8 years 11 months ago
5 Day Profile values. This chart was uploaded by Investor/RT 12.6.1 showing symbol: QCL#. |
View |
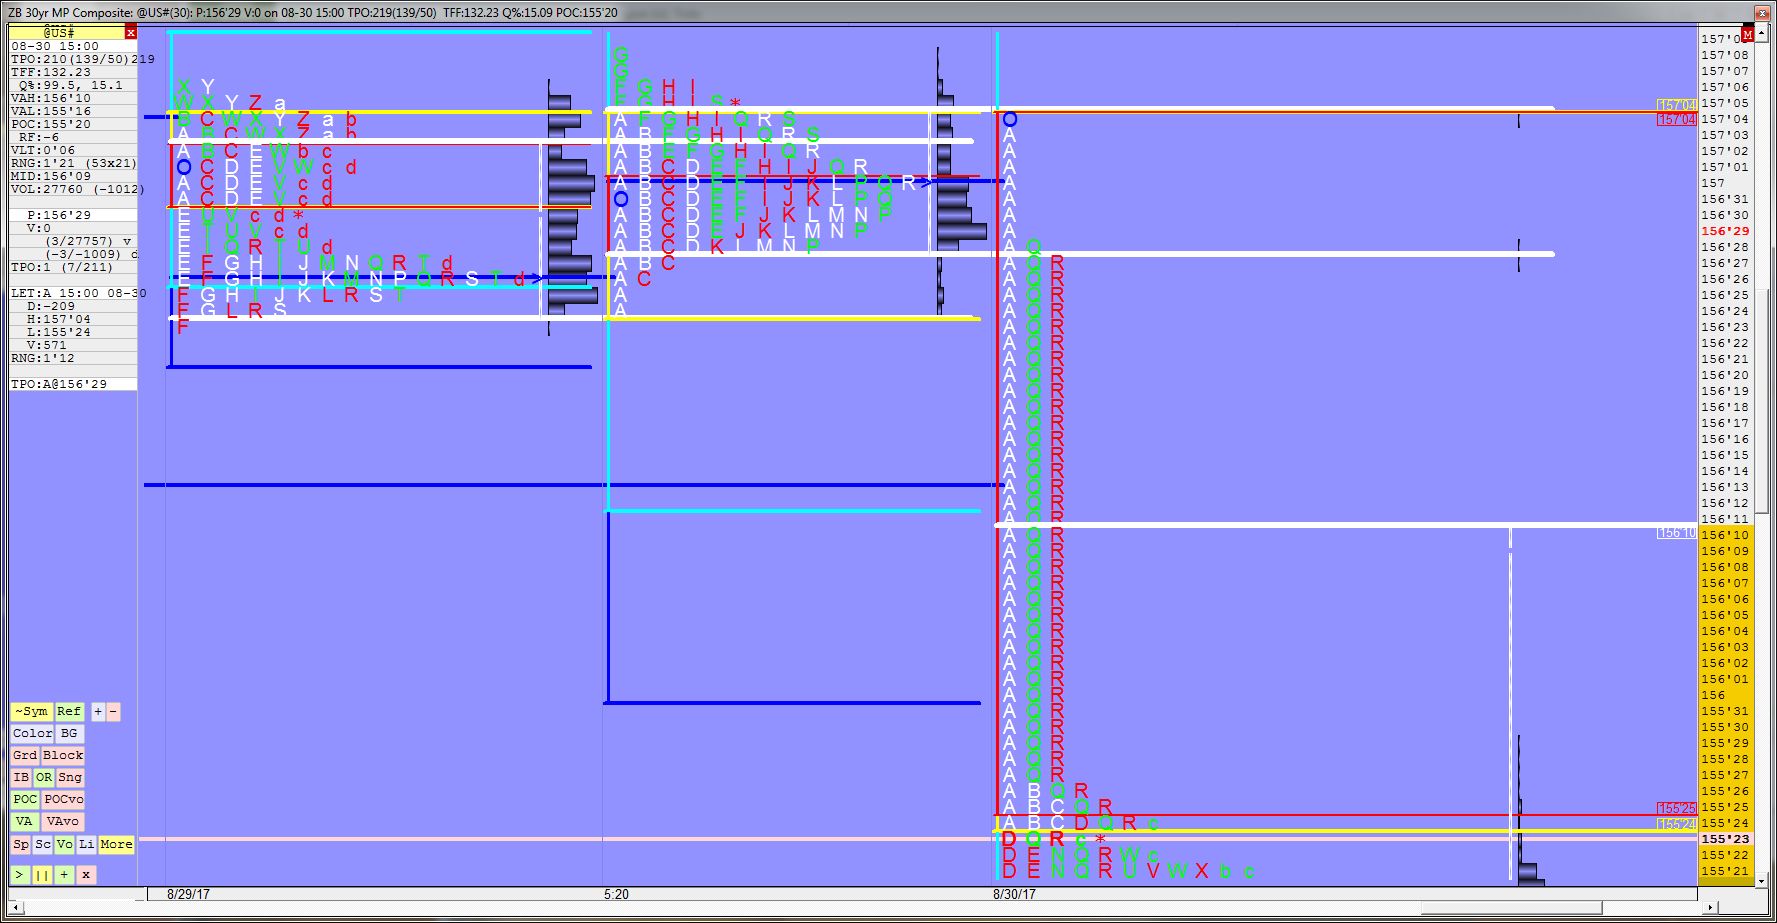 |
ZB 30yr MP Composite (@US#) garyvezina [totalcount]
8 years 11 months ago
This chart does not look right. Please verify the A and M period and price. This chart was uploaded by Investor/RT 12.7.3 showing symbol: @US#. |
View |
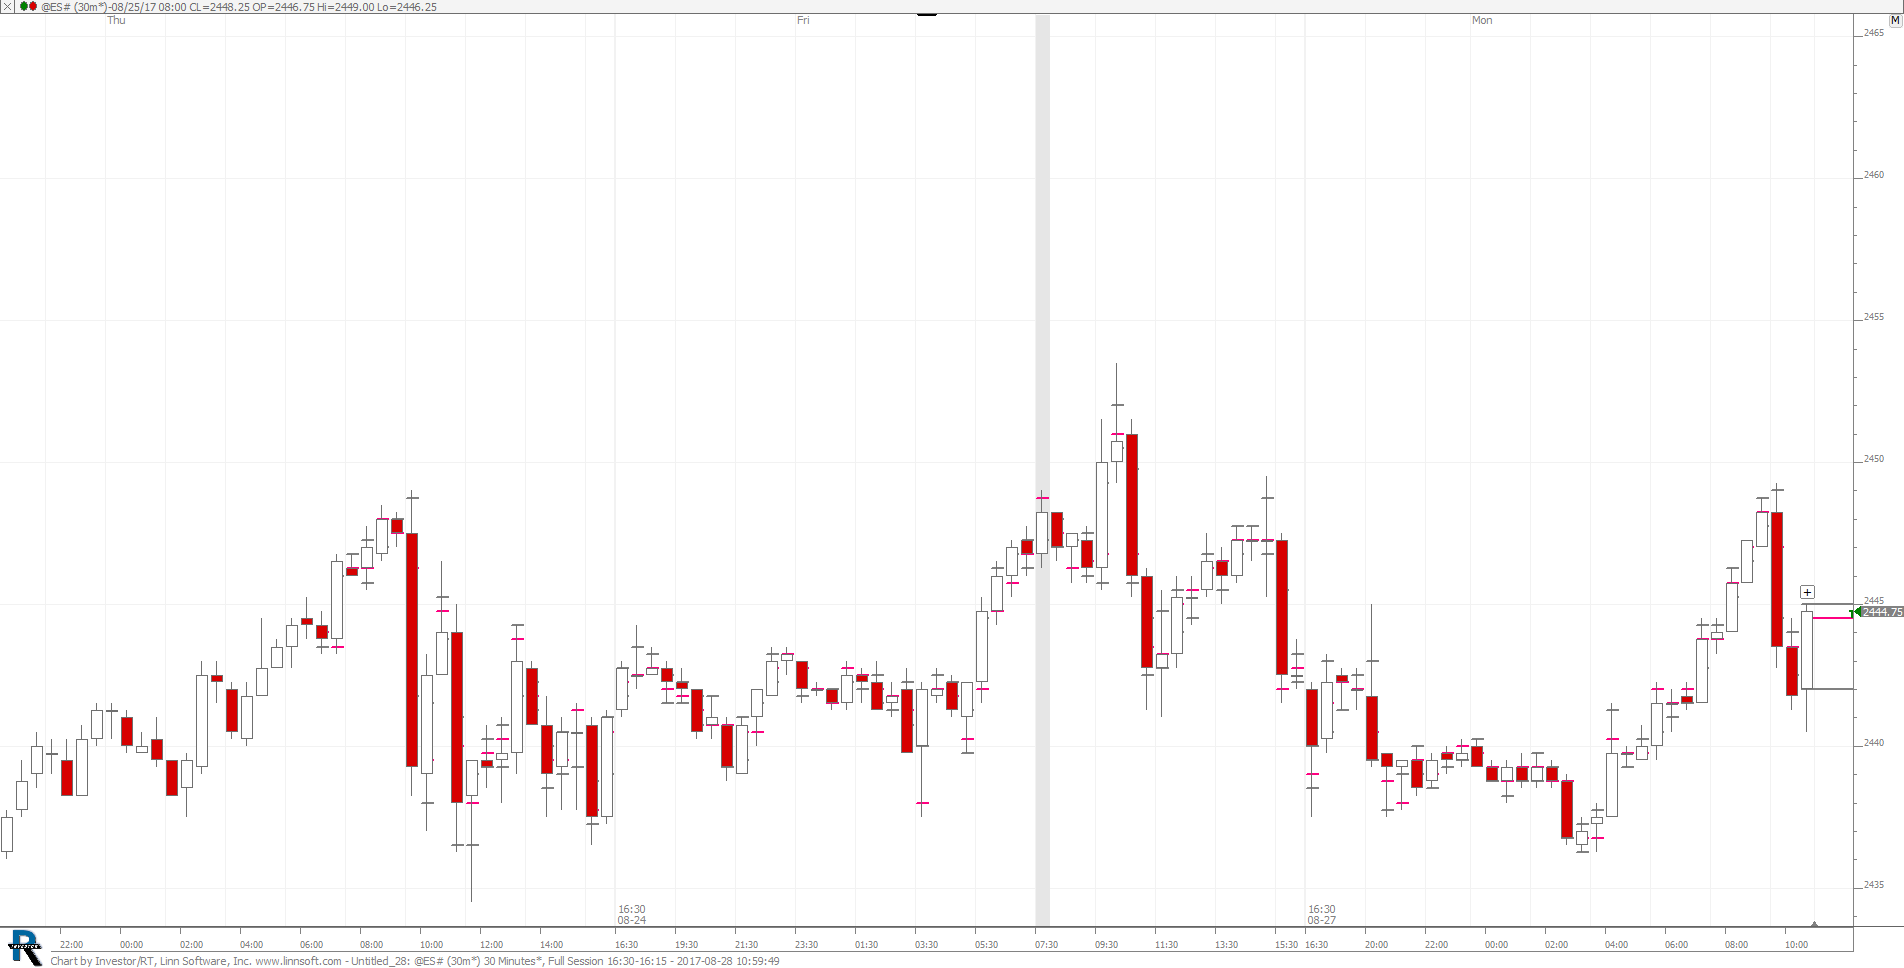 |
Untitled 28 (@ES#) scooke [totalcount]
8 years 11 months ago
This chart was uploaded by Investor/RT 13.1.1 showing symbol: @ES#. |
View |
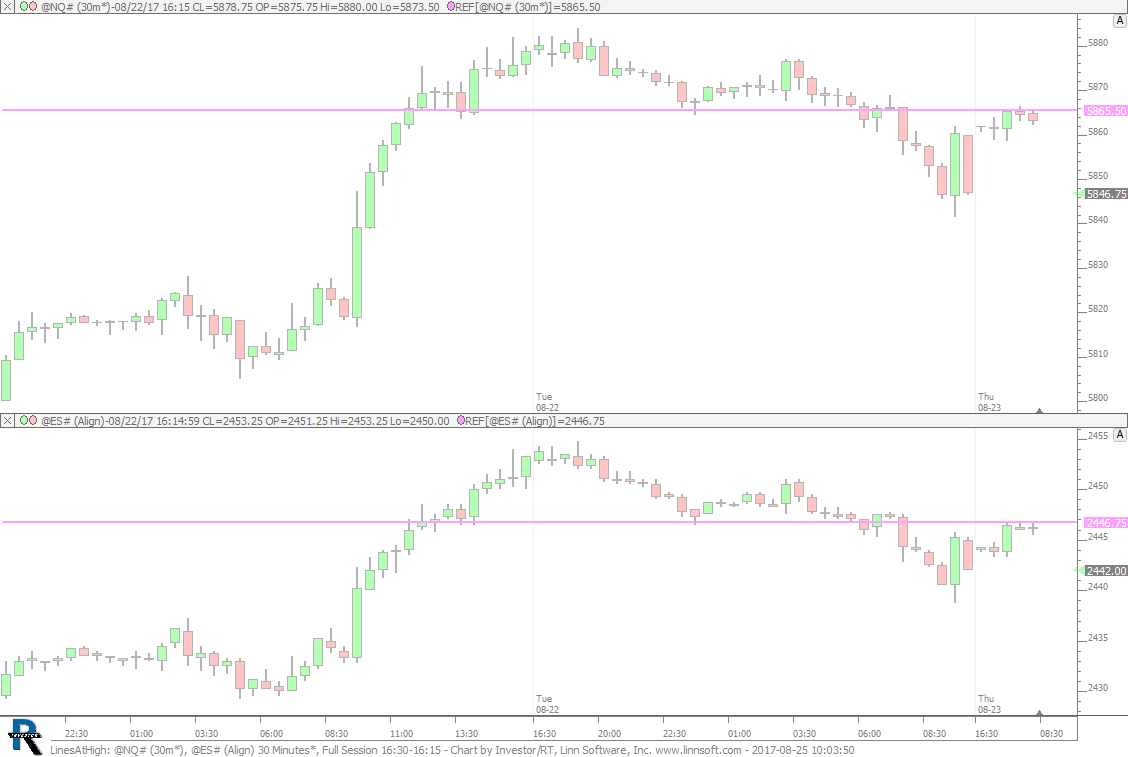 |
LinesAtHigh (@NQ#) cpayne [totalcount]
8 years 11 months ago
Lines At Highs. This chart was uploaded by Investor/RT 13.1.1 showing symbol: @NQ#. |
View |
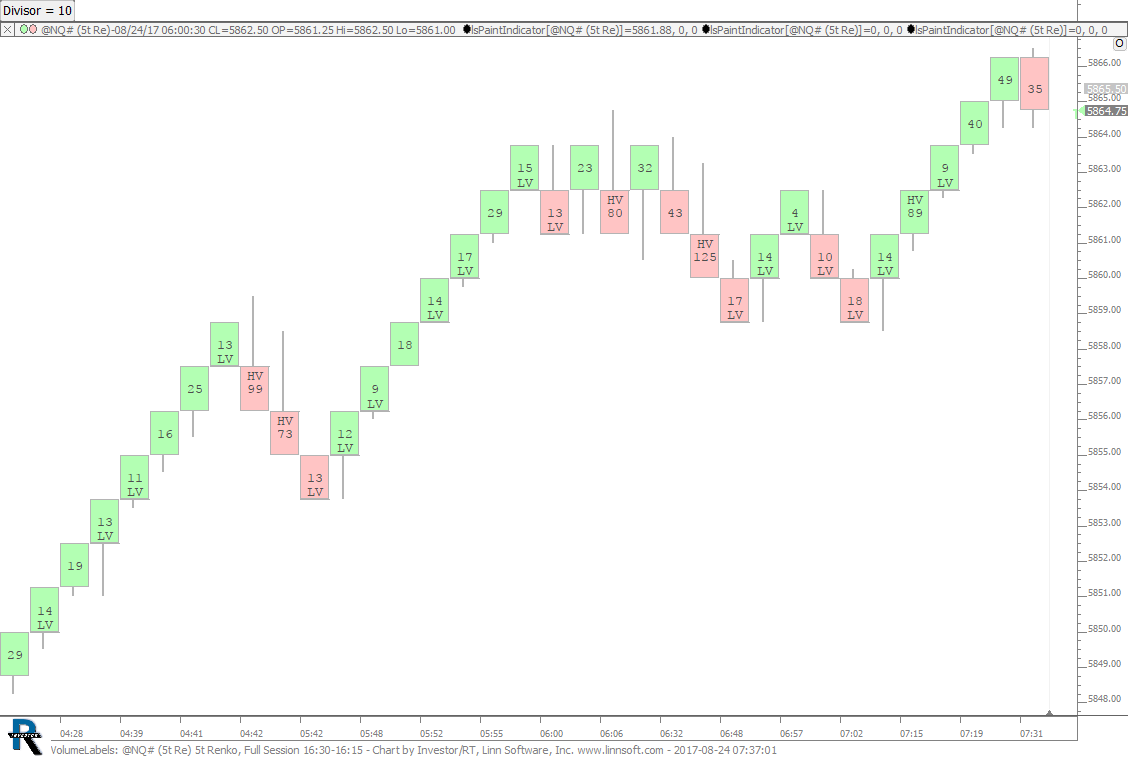 |
VolumeLabels (@NQ#) cpayne [totalcount]
8 years 11 months ago
Volume Labeling using Paint Indicator. This chart was uploaded by Investor/RT 12.7.7 showing symbol: @NQ#. |
View |
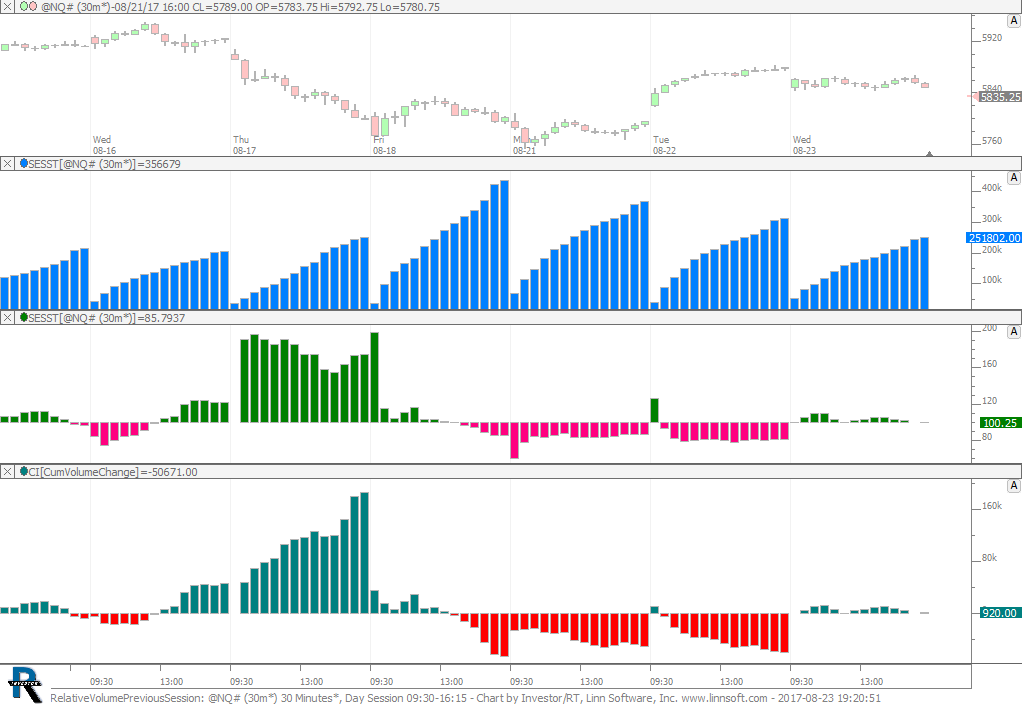 |
RelativeVolumePreviousSession (@NQ#) cpayne [totalcount]
8 years 11 months ago
Relative Volume Previous Session. This chart was uploaded by Investor/RT 12.7.7 showing symbol: @NQ#. |
View |
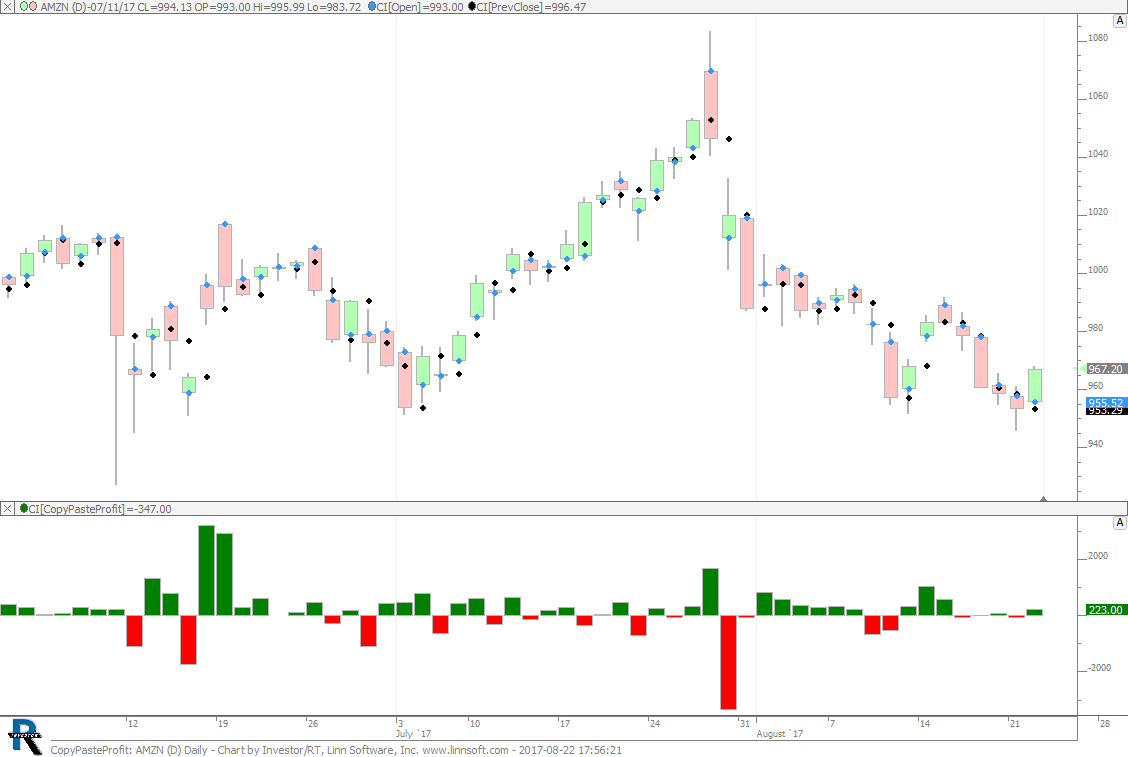 |
CopyPasteProfit (AMZN) cpayne [totalcount]
8 years 11 months ago
Copy / Paste Profit. This chart was uploaded by Investor/RT 12.7.7 showing symbol: AMZN. |
View |
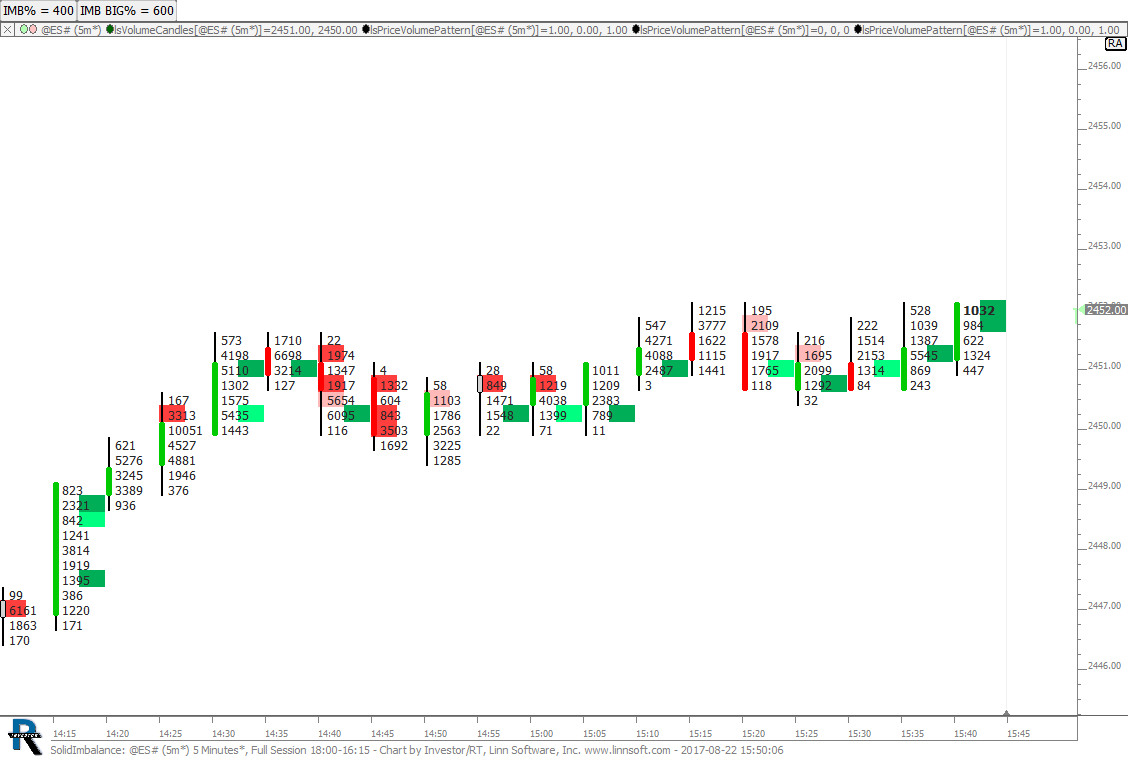 |
SolidImbalance (@ES#) cpayne [totalcount]
8 years 11 months ago
Solid Imbalance. This chart was uploaded by Investor/RT 12.7.7 showing symbol: @ES#. |
View |
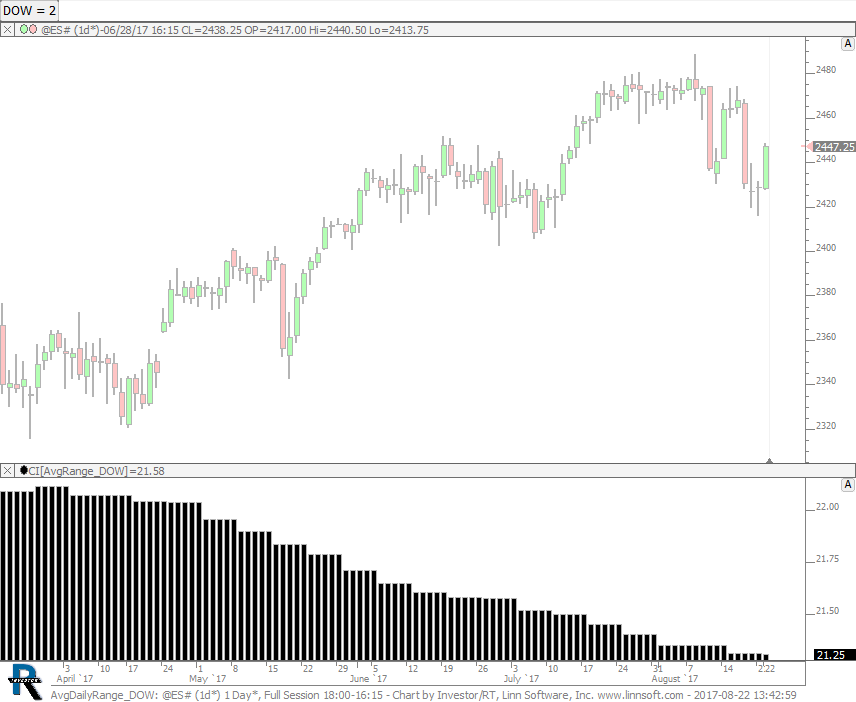 |
AvgDailyRange DOW (@ES#) cpayne [totalcount]
8 years 11 months ago
Average Range - Day of Week. This chart was uploaded by Investor/RT 12.7.7 showing symbol: @ES#. |
View |
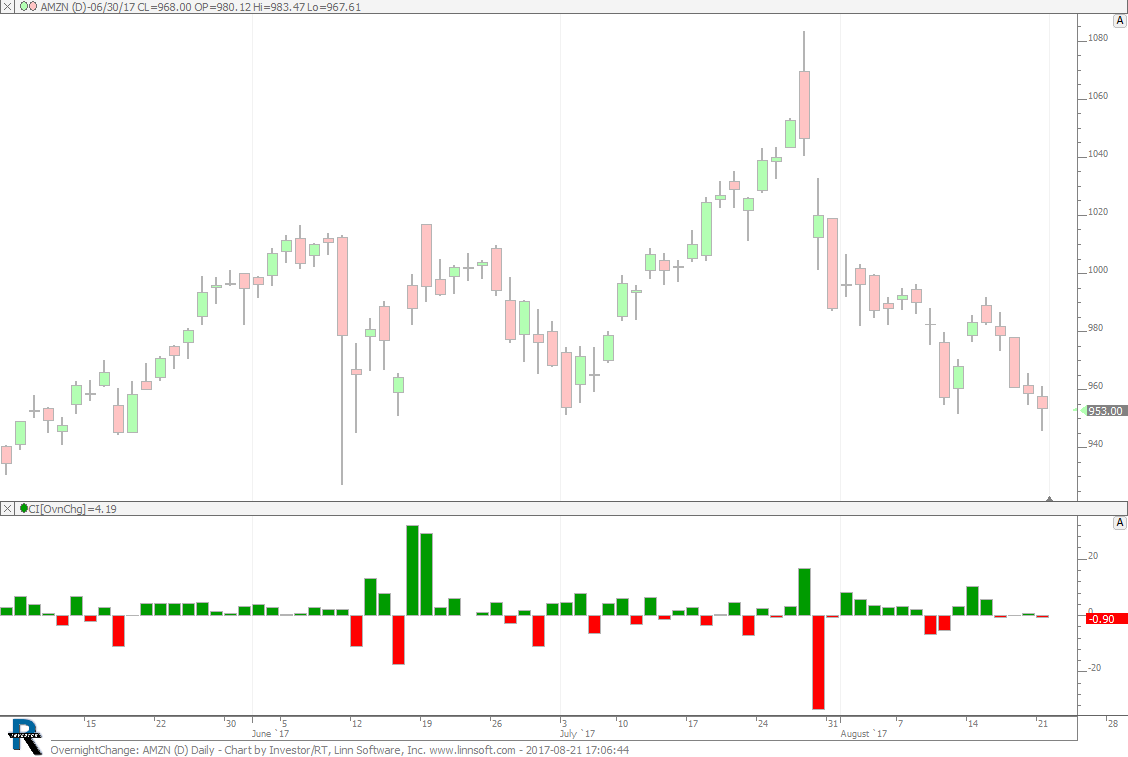 |
OvernightChange (AMZN) cpayne [totalcount]
8 years 11 months ago
Overnight Change. This chart was uploaded by Investor/RT 12.7.7 showing symbol: AMZN. |
View |
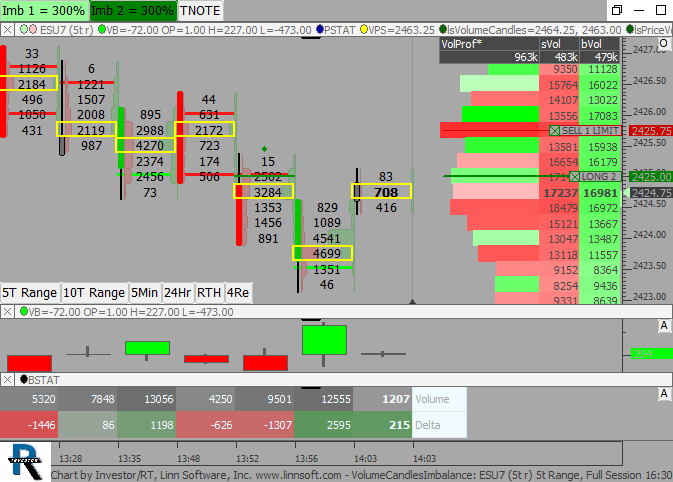 |
VolumeCandlesImbalance (ESU7) SPetkov [totalcount]
8 years 11 months ago
This chart was uploaded by Investor/RT 12.7.6 showing symbol: ESU7. |
View |
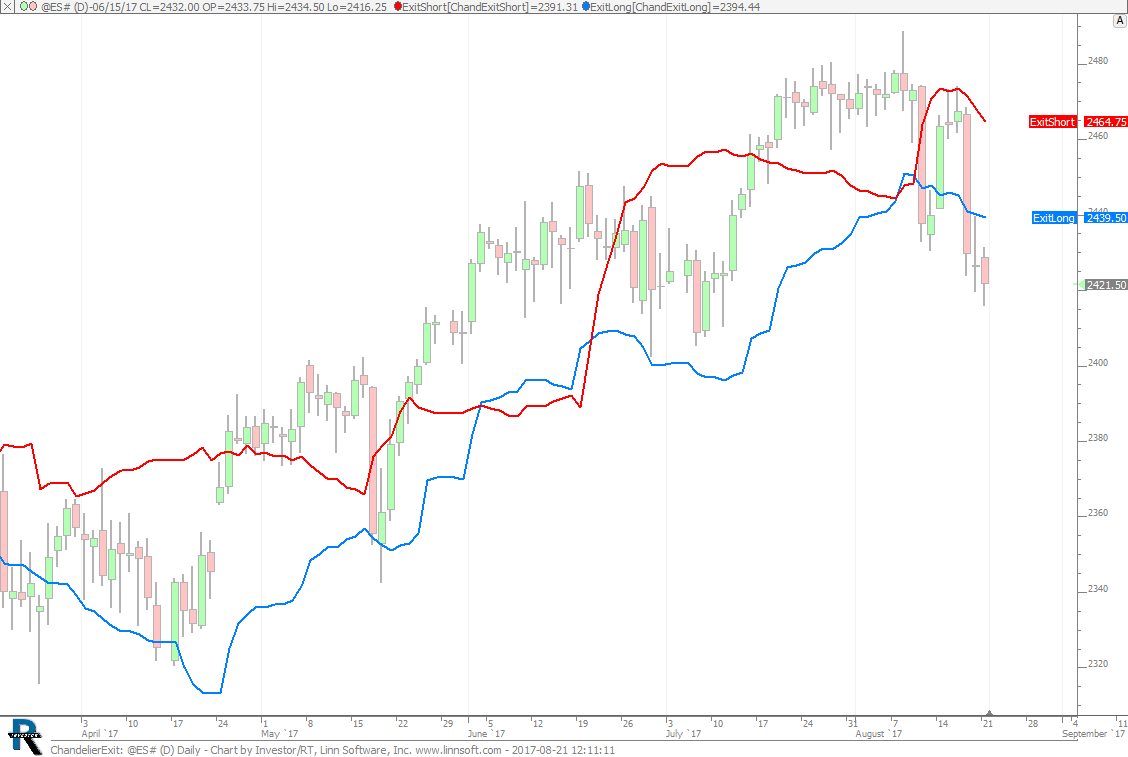 |
ChandelierExit (@ES#) cpayne [totalcount]
8 years 11 months ago
Chandelier Exit. This chart was uploaded by Investor/RT 12.7.7 showing symbol: @ES#. |
View |
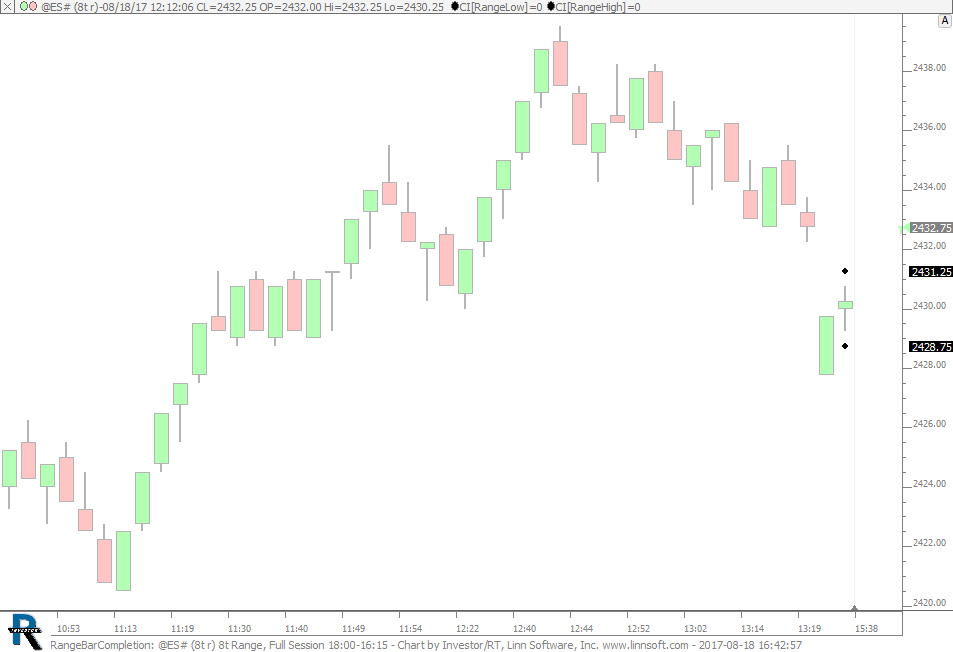 |
RangeBarCompletion (@ES#) cpayne [totalcount]
8 years 11 months ago
Range Bar Forecast. This chart was uploaded by Investor/RT 12.7.7 showing symbol: @ES#. |
View |
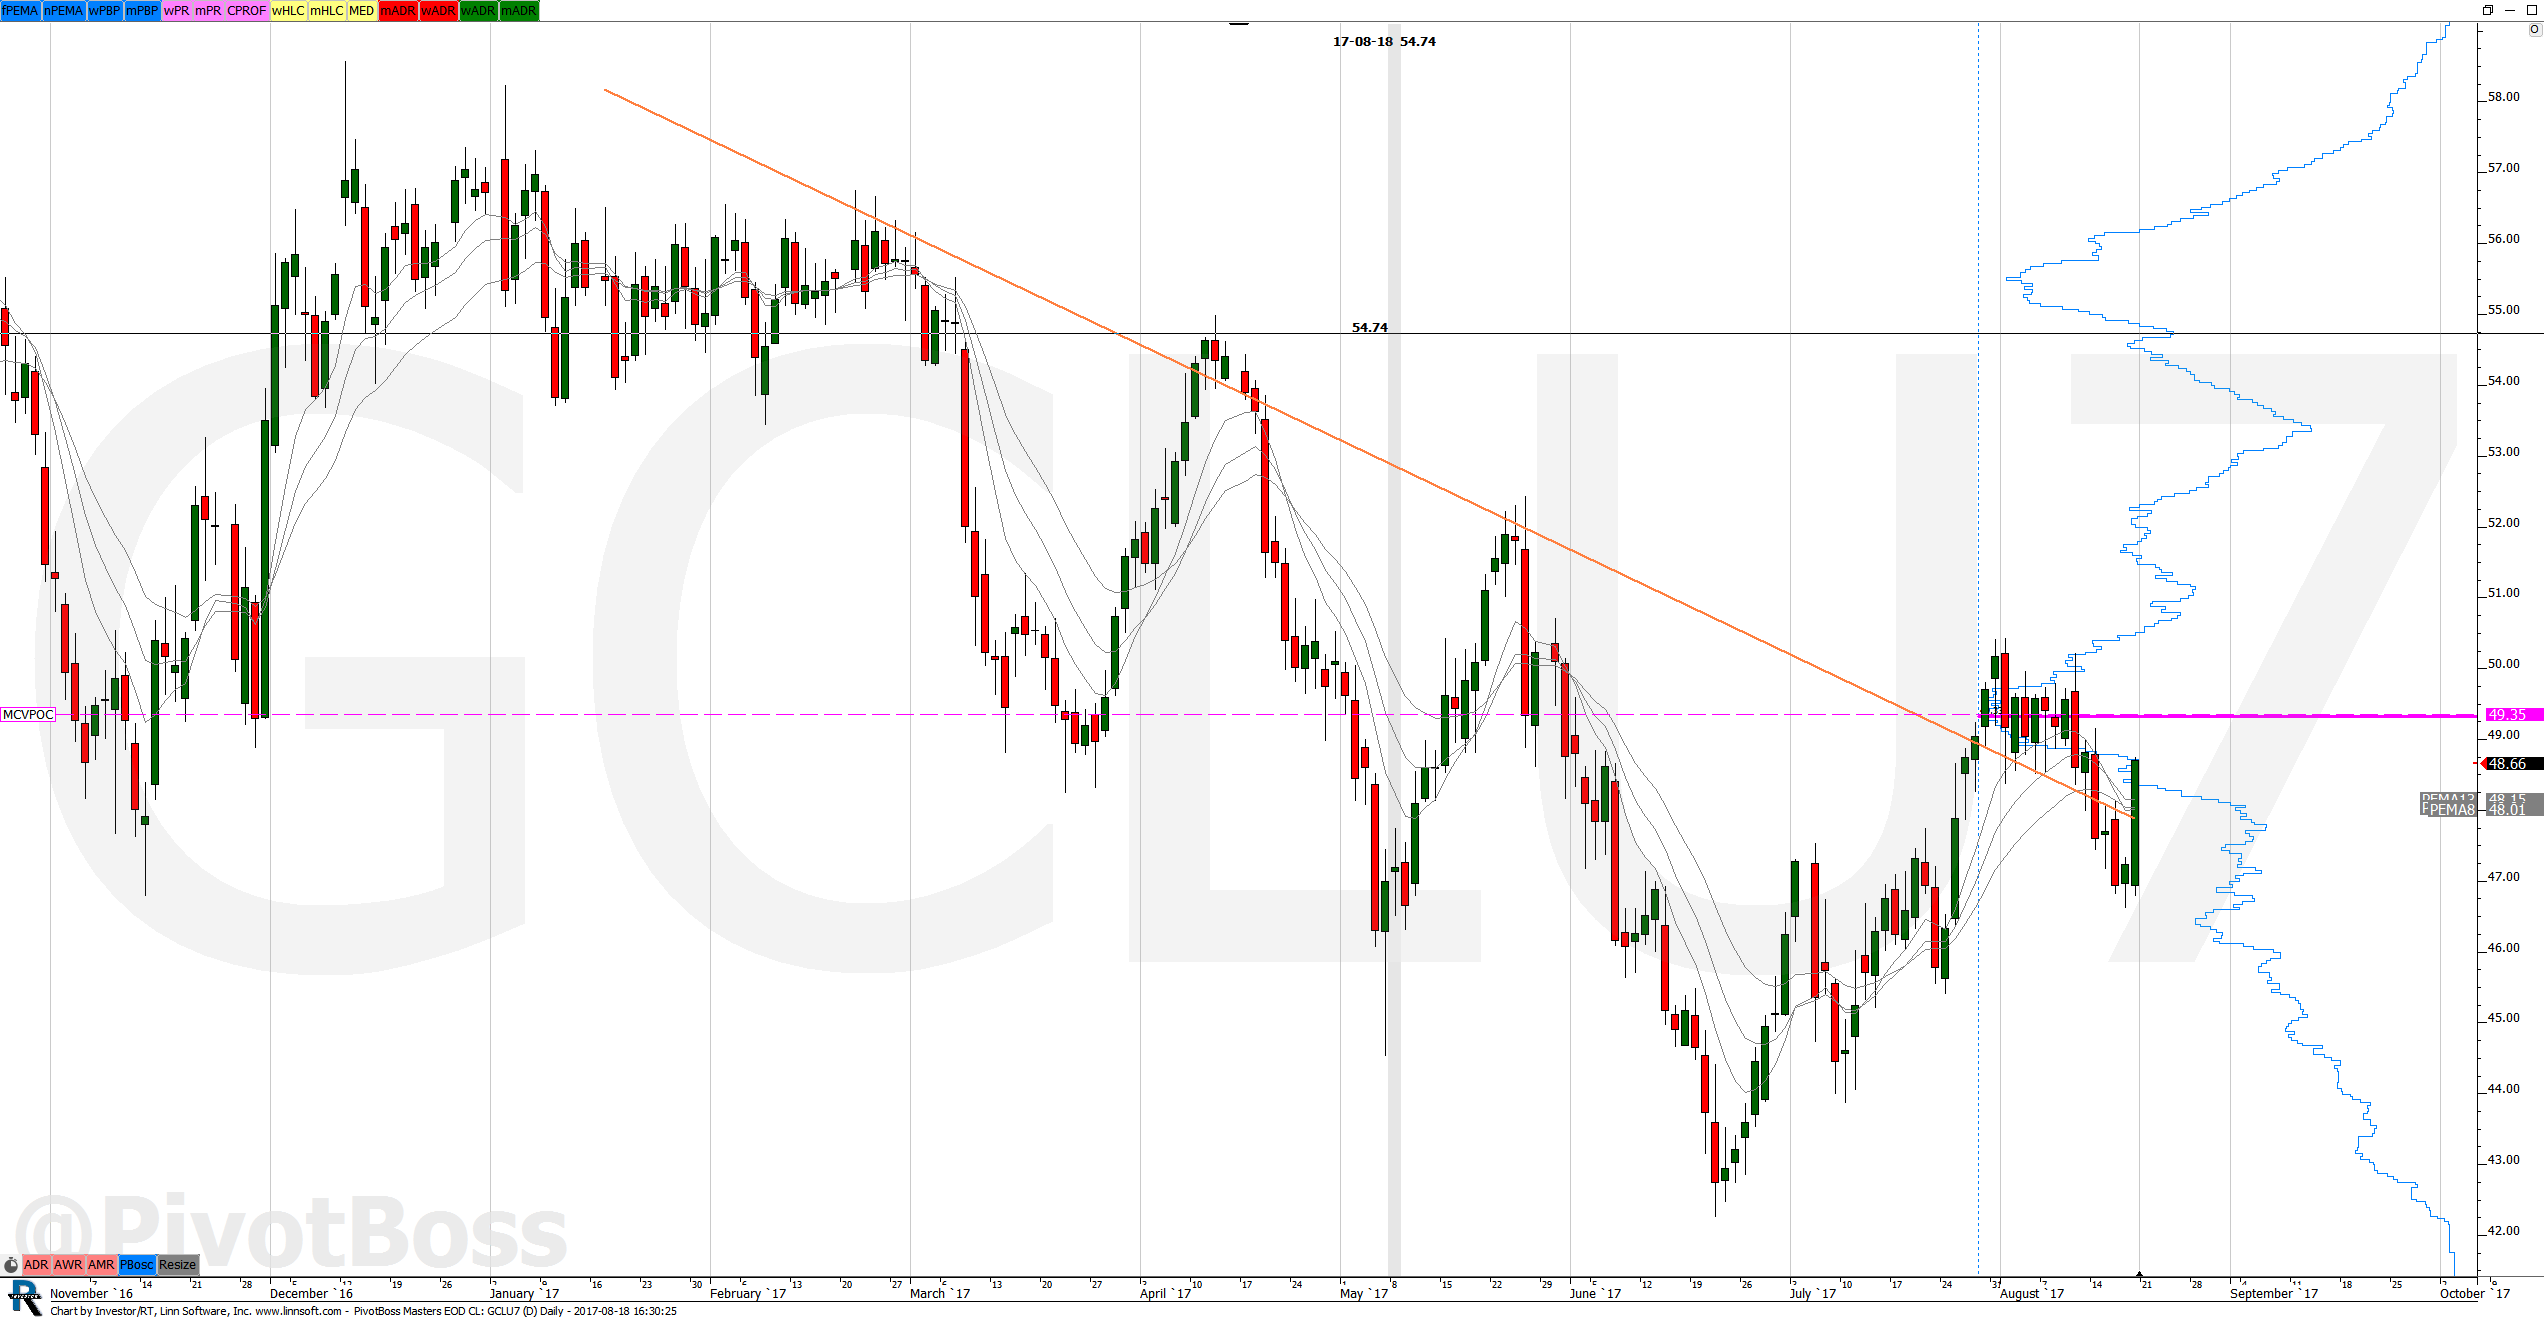 |
PivotBoss Masters EOD CL (GCLU7) ABartuli [totalcount]
8 years 11 months ago
Pleas help me to set up PRINT option. All my charts are damaged when I print them out. This chart was uploaded by Investor/RT 12.7.6 showing symbol: GCLU7. |
View |
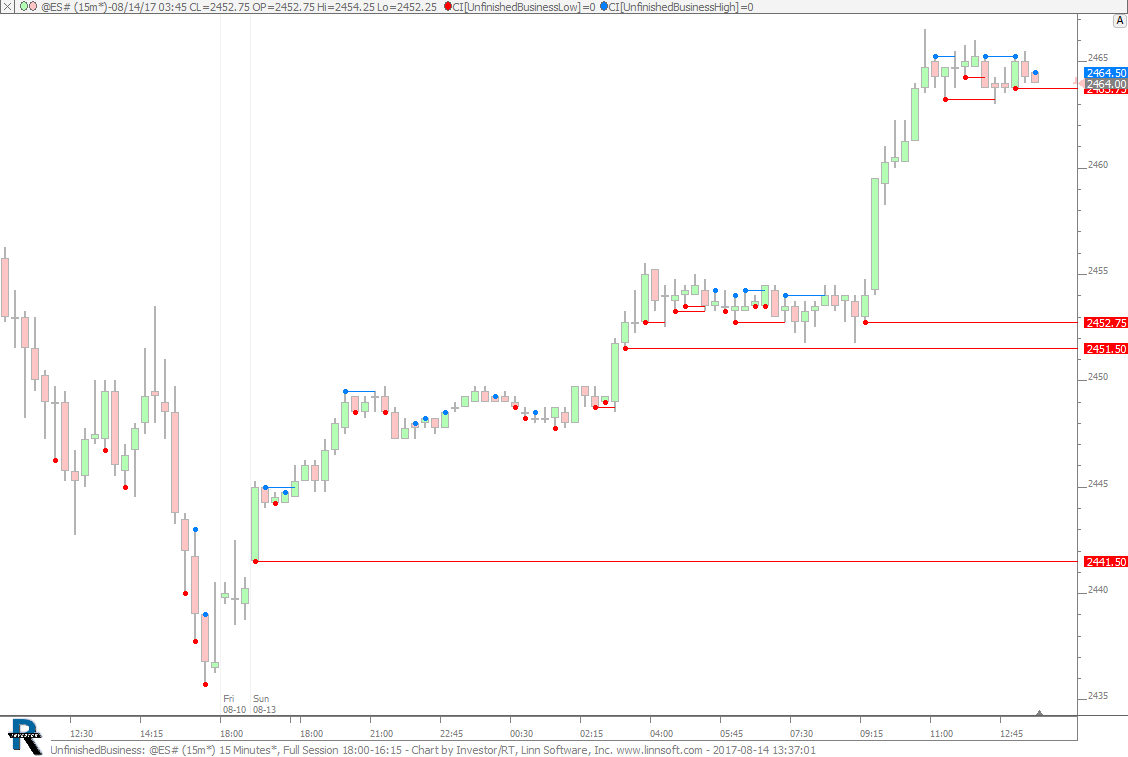 |
UnfinishedBusiness (@ES#) cpayne [totalcount]
8 years 11 months ago
Unfinished Business. This chart was uploaded by Investor/RT 12.7.7 showing symbol: @ES#. |
View |
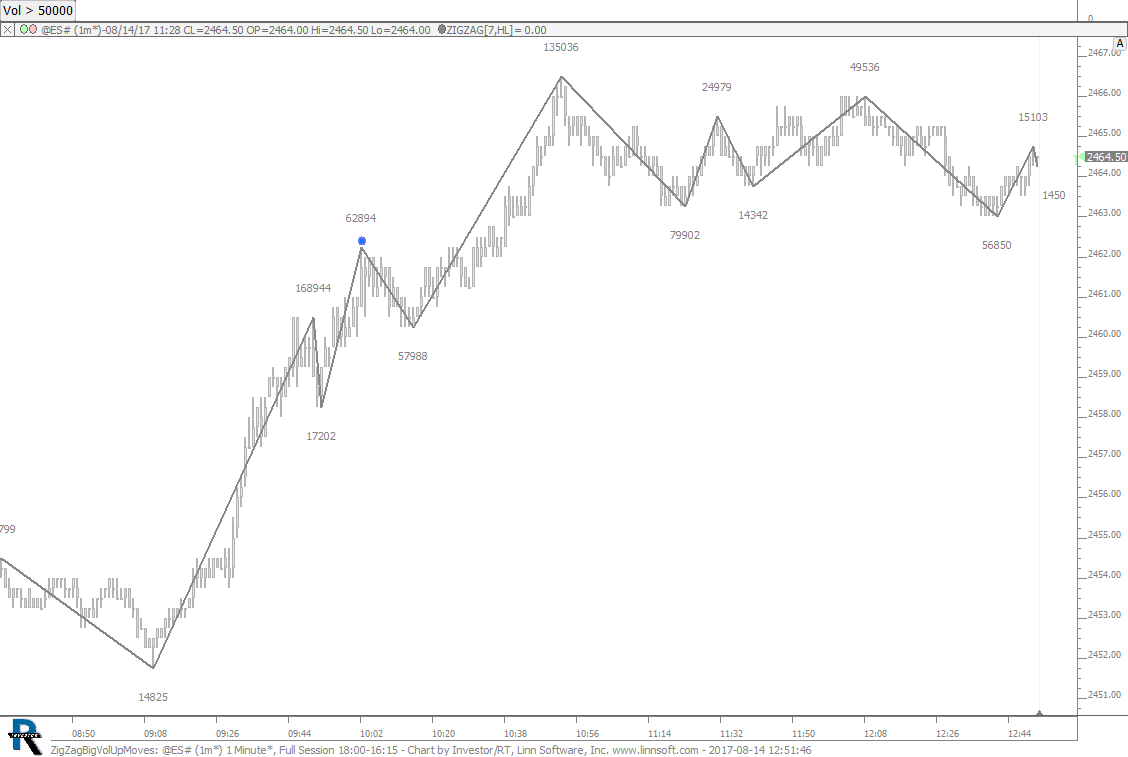 |
ZigZagBigVolUpMoves (@ES#) cpayne [totalcount]
8 years 11 months ago
Zig Zag Big Volume Up Moves (2 Consecutive - 2nd less vol than 1st). This chart was uploaded by Investor/RT 12.7.7 showing symbol: @ES#. |
View |
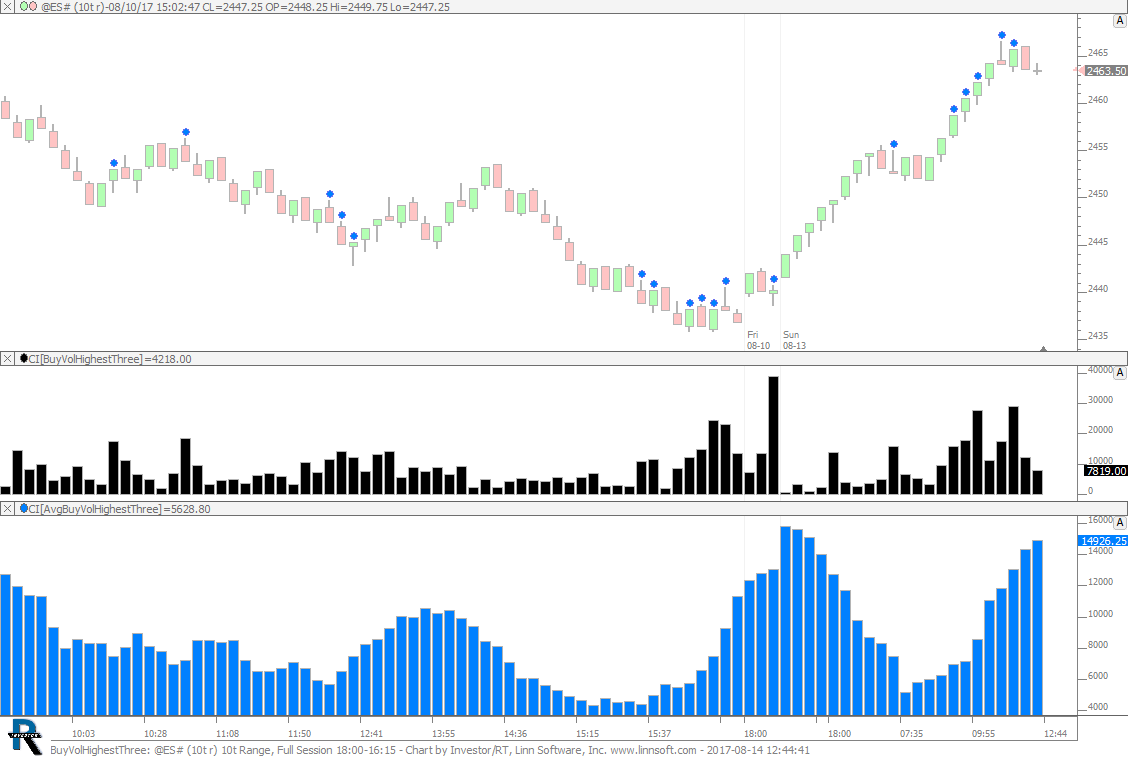 |
BuyVolHighestThree (@ES#) cpayne [totalcount]
8 years 11 months ago
Finds Excessive Volume In Upper Three Prices. This chart was uploaded by Investor/RT 12.7.7 showing symbol: @ES#. |
View |
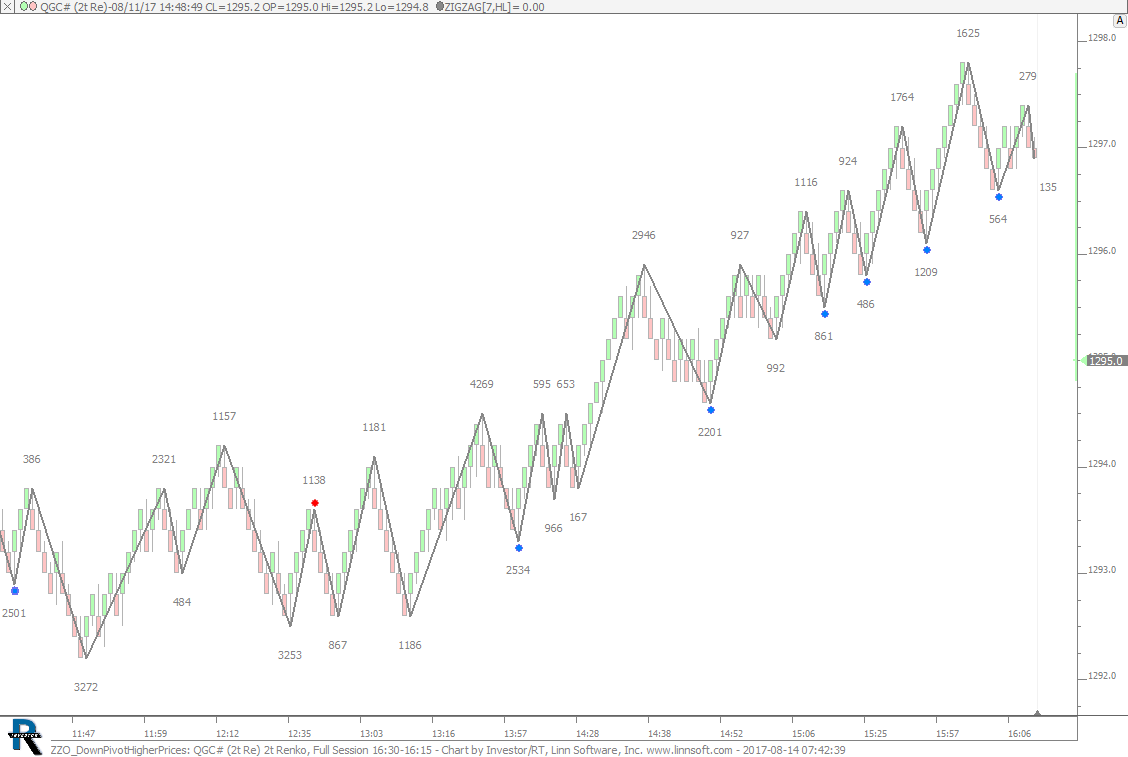 |
ZZO DownPivotHigherPrices (QGC#) cpayne [totalcount]
8 years 11 months ago
ZZO - Down Pivot Higher Prices. This chart was uploaded by Investor/RT 12.7.7 showing symbol: QGC#. |
View |
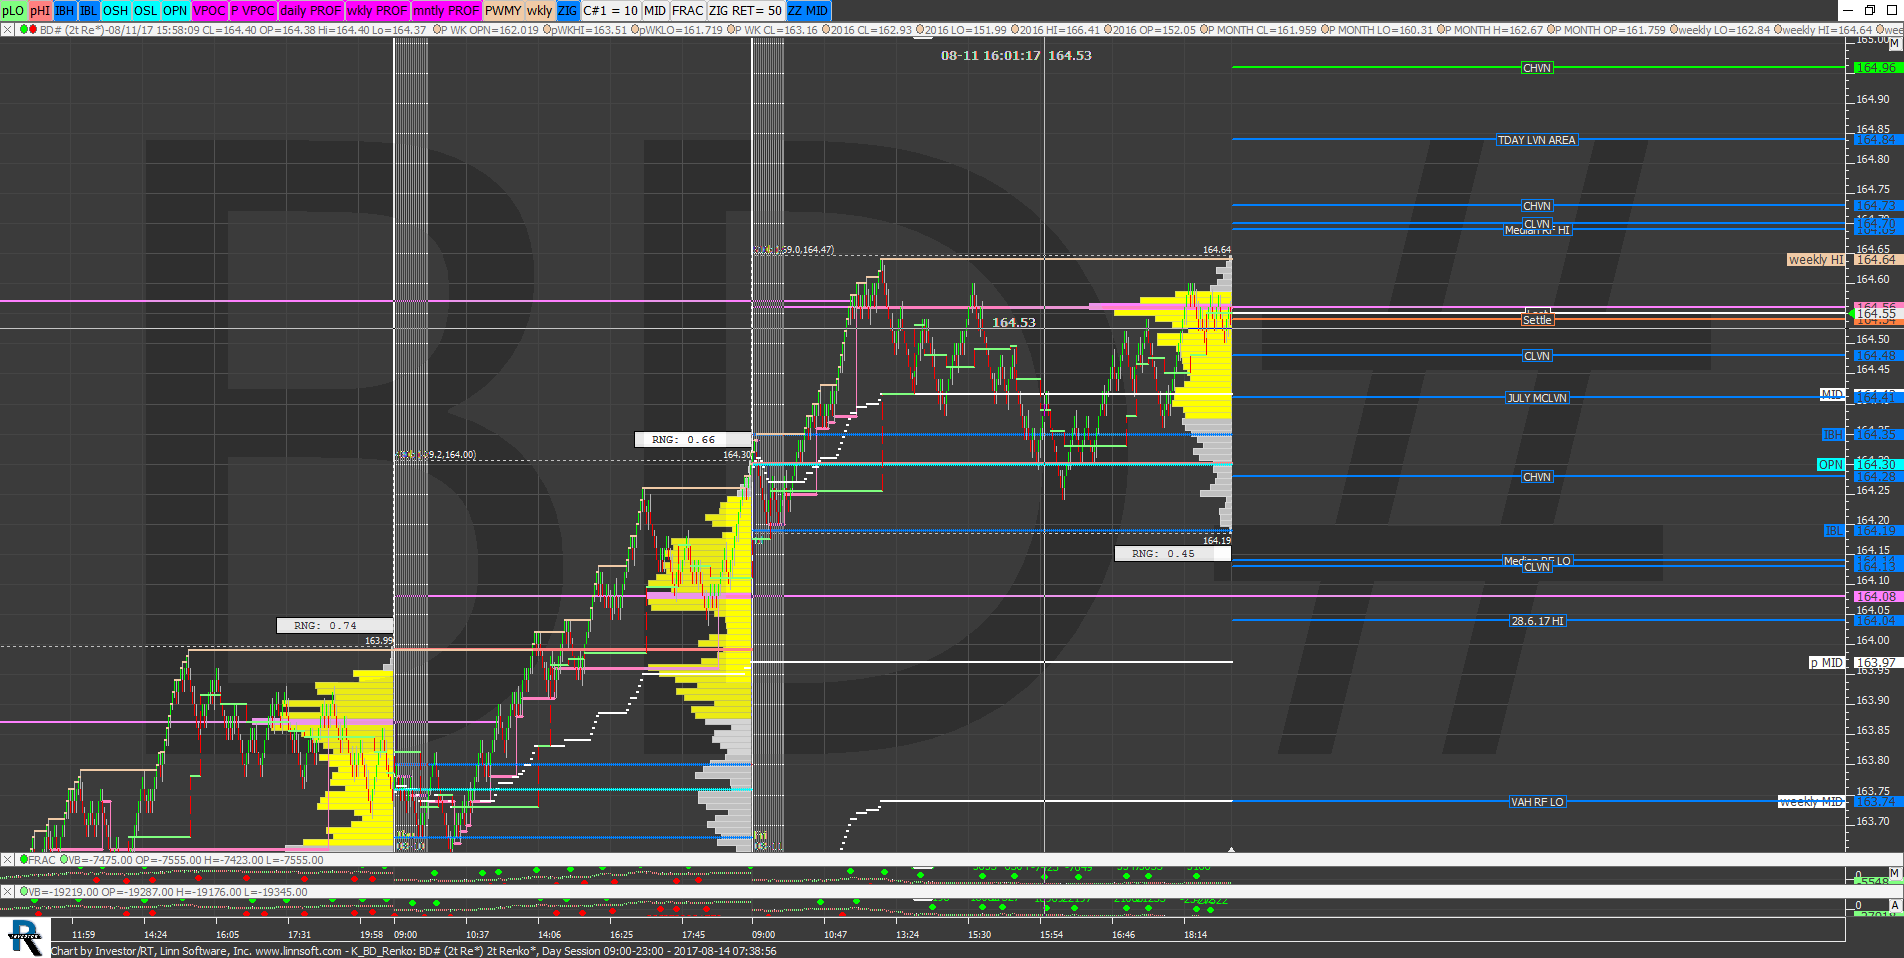 |
K BD Renko (BD#) Ran Mor [totalcount]
8 years 11 months ago
BD Renko 14082017. This chart was uploaded by Investor/RT 12.7.6 showing symbol: BD#. |
View |
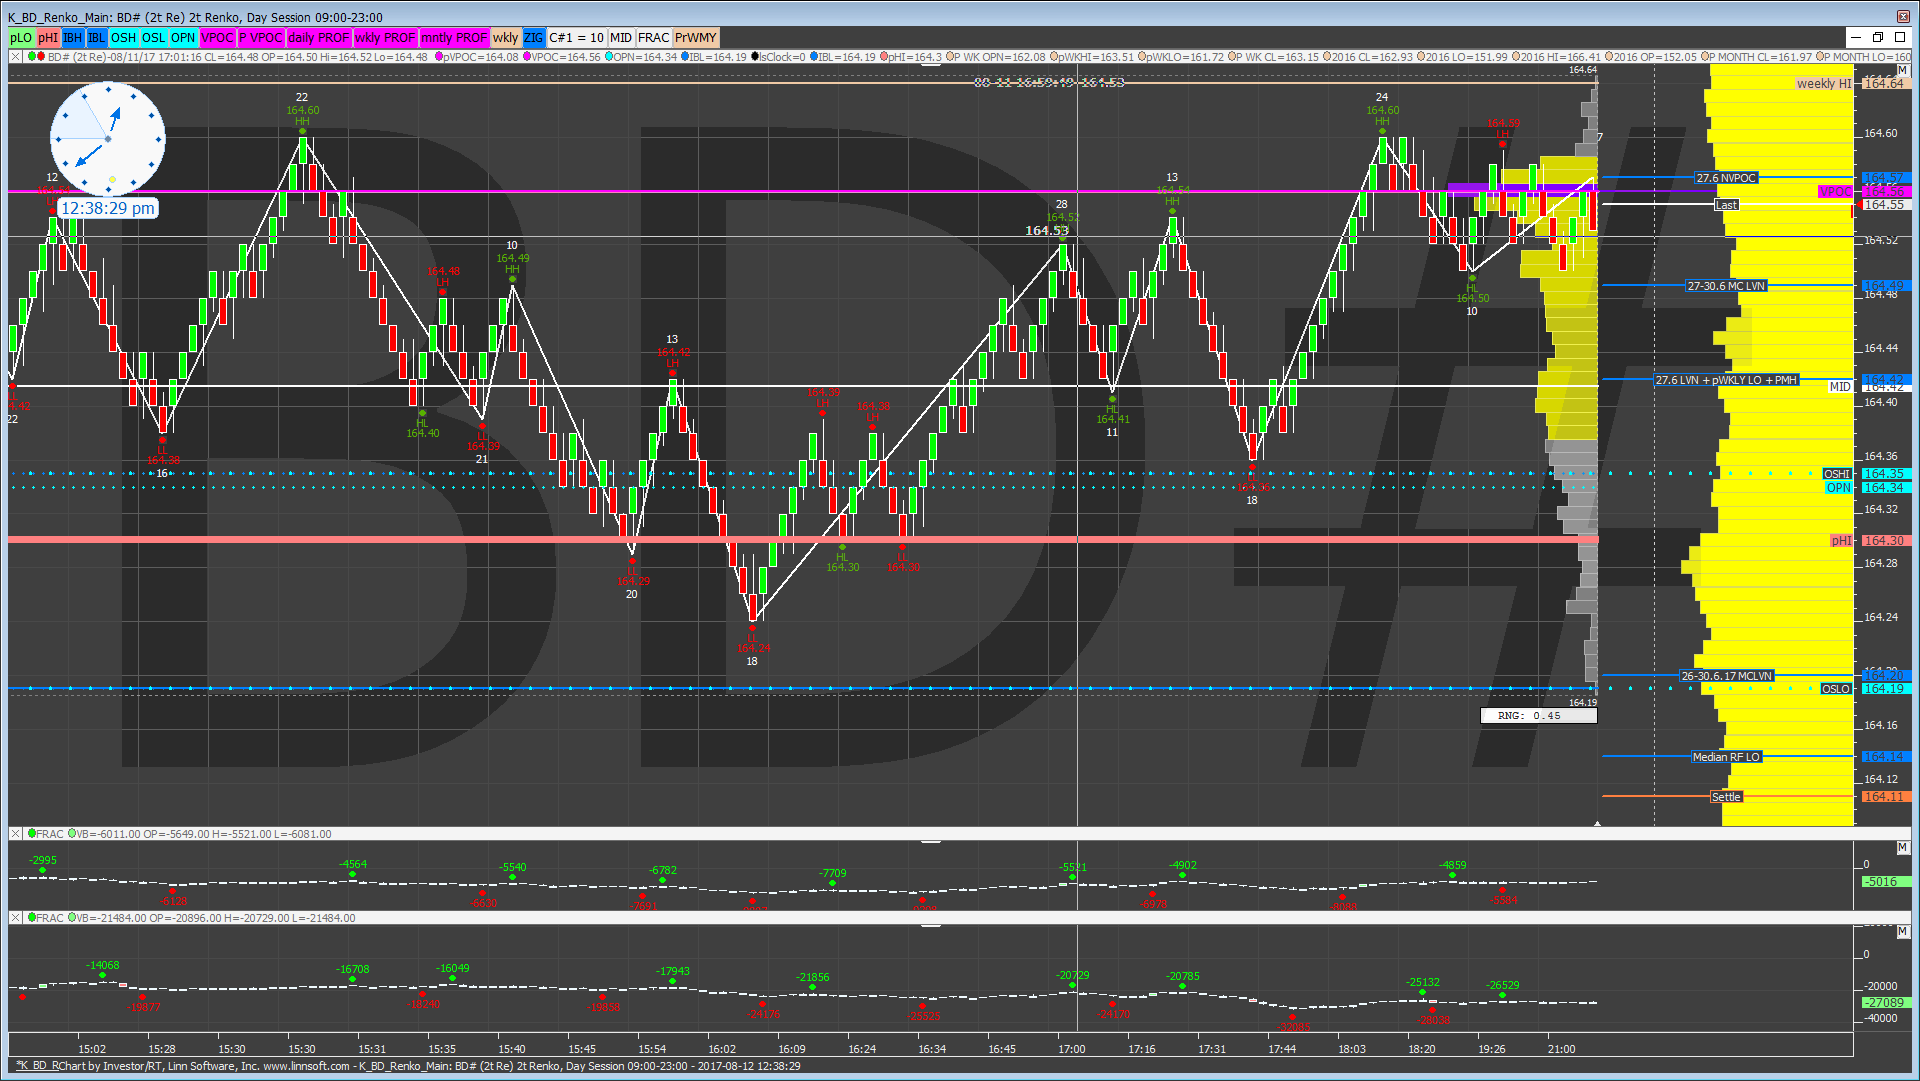 |
K BD Renko Main (BD#) Ran Mor [totalcount]
8 years 11 months ago
This chart was uploaded by Investor/RT 12.7.6 showing symbol: BD#. |
View |
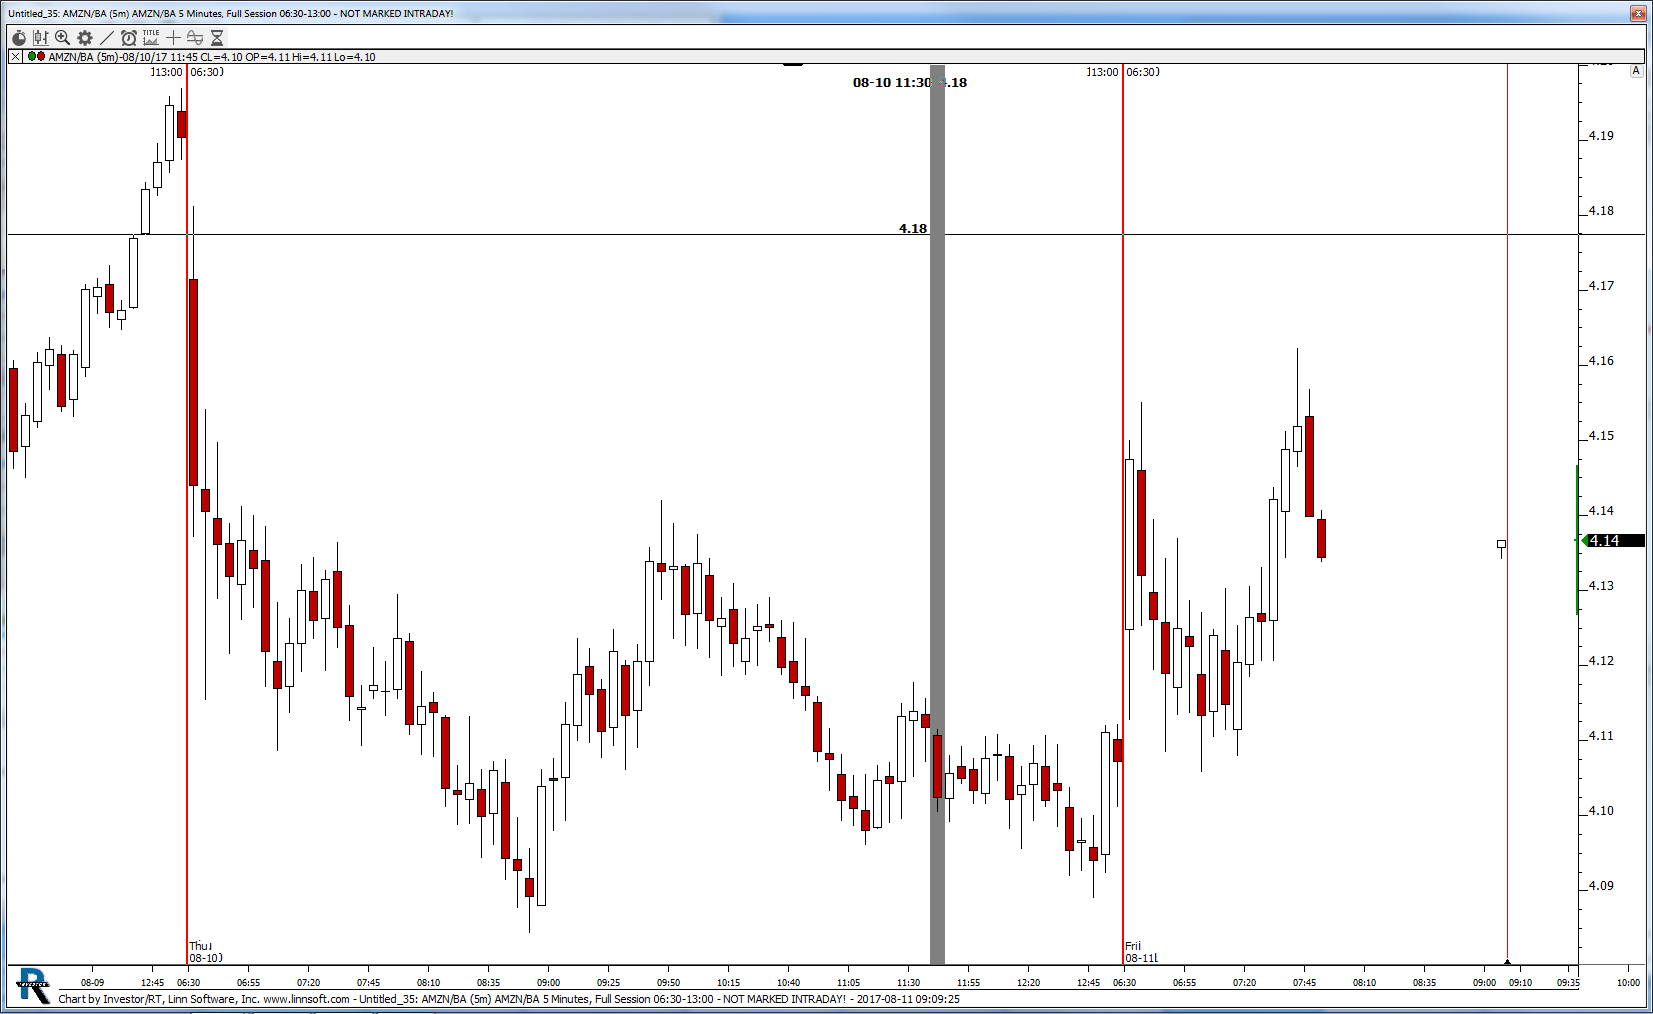 |
Untitled (AMZN/BA) kencassorla [totalcount]
8 years 11 months ago
amzn/ba. This chart was uploaded by Investor/RT 12.7.6 showing symbol: AMZN/BA. |
View |
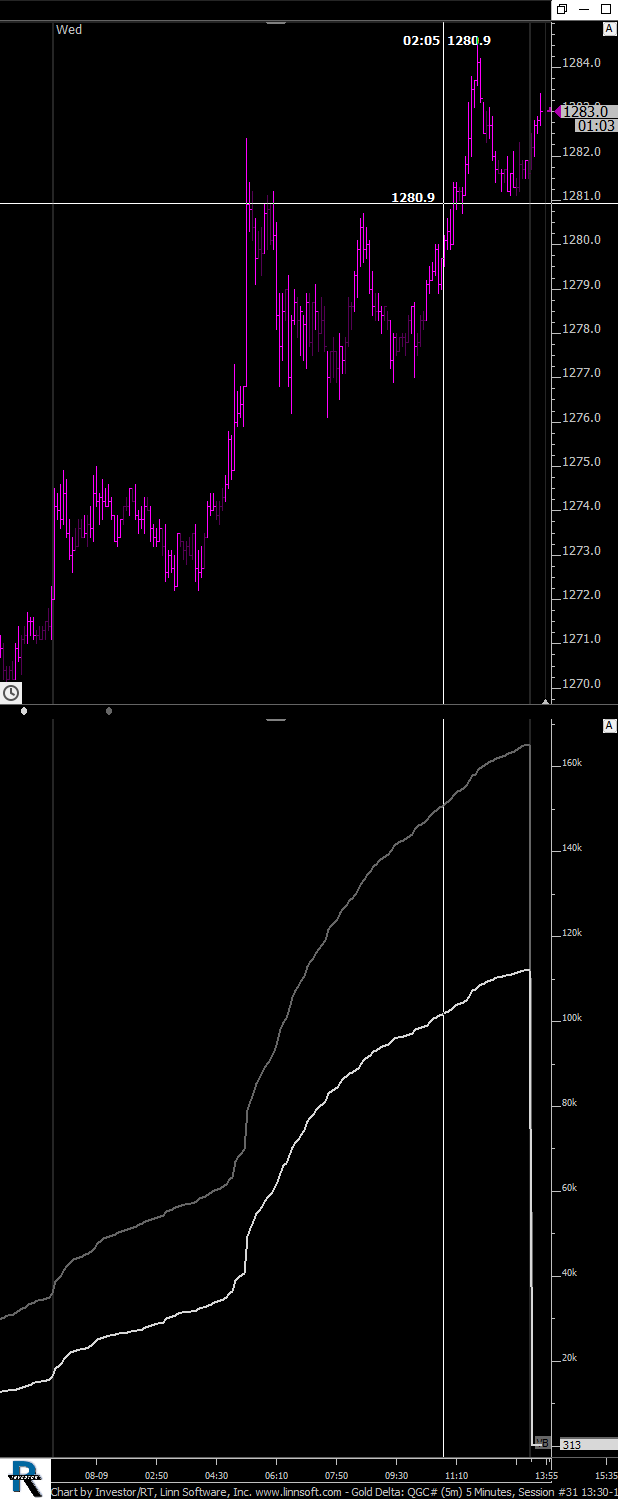 |
Gold Delta (QGC#) drms76 [totalcount]
8 years 11 months ago
This chart was uploaded by Investor/RT 12.7.6 showing symbol: QGC#. |
View |