 |
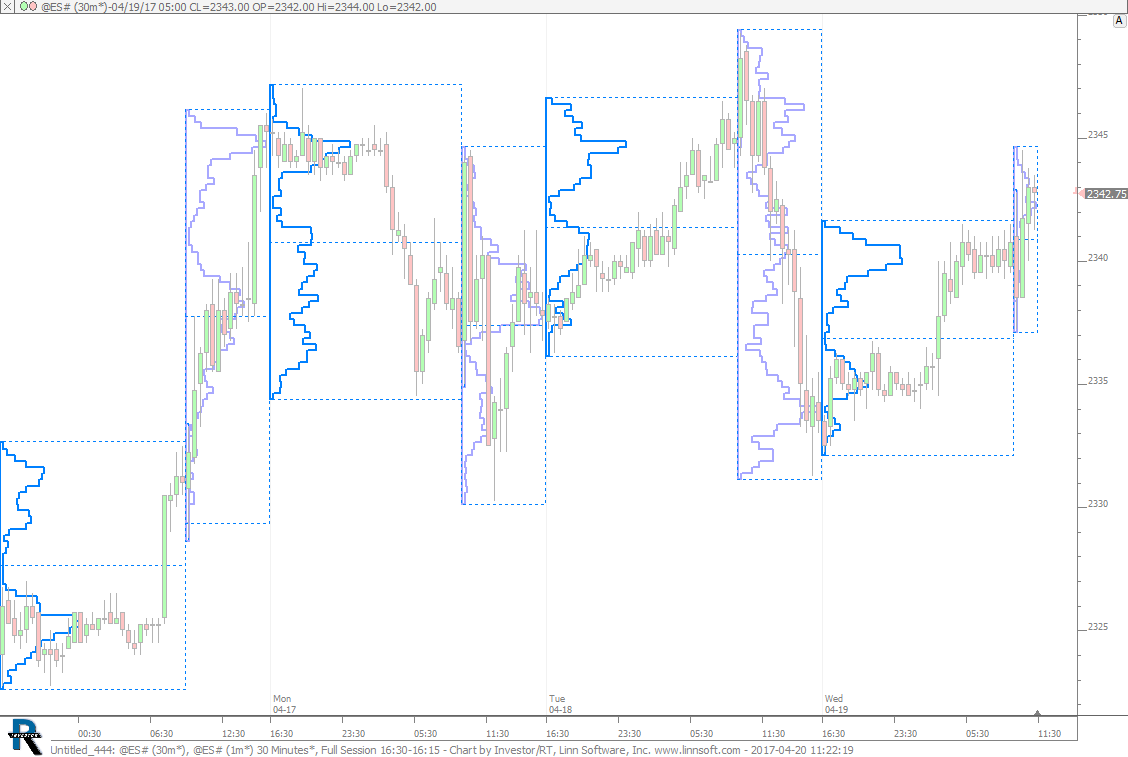
Untitled 444 (@ES#) cpayne [totalcount]
9 years 3 months ago
This chart was uploaded by Investor/RT 12.7.1 showing symbol: @ES#. |
View |
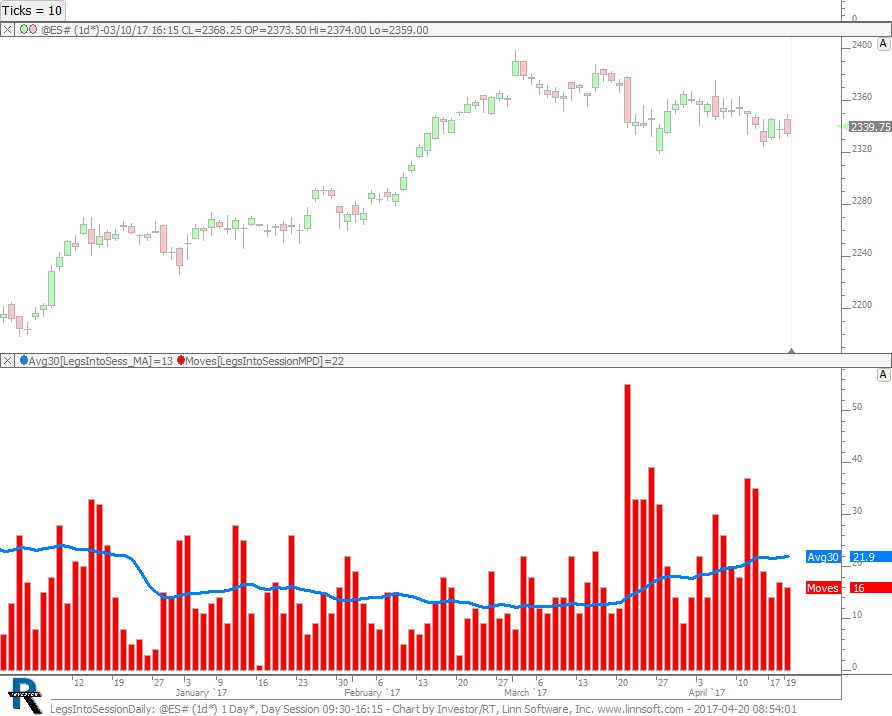 |
LegsIntoSessionDaily (@ES#) cpayne [totalcount]
9 years 3 months ago
Legs Into Session - Daily with Average. This chart was uploaded by Investor/RT 12.7.1 showing symbol: @ES#. |
View |
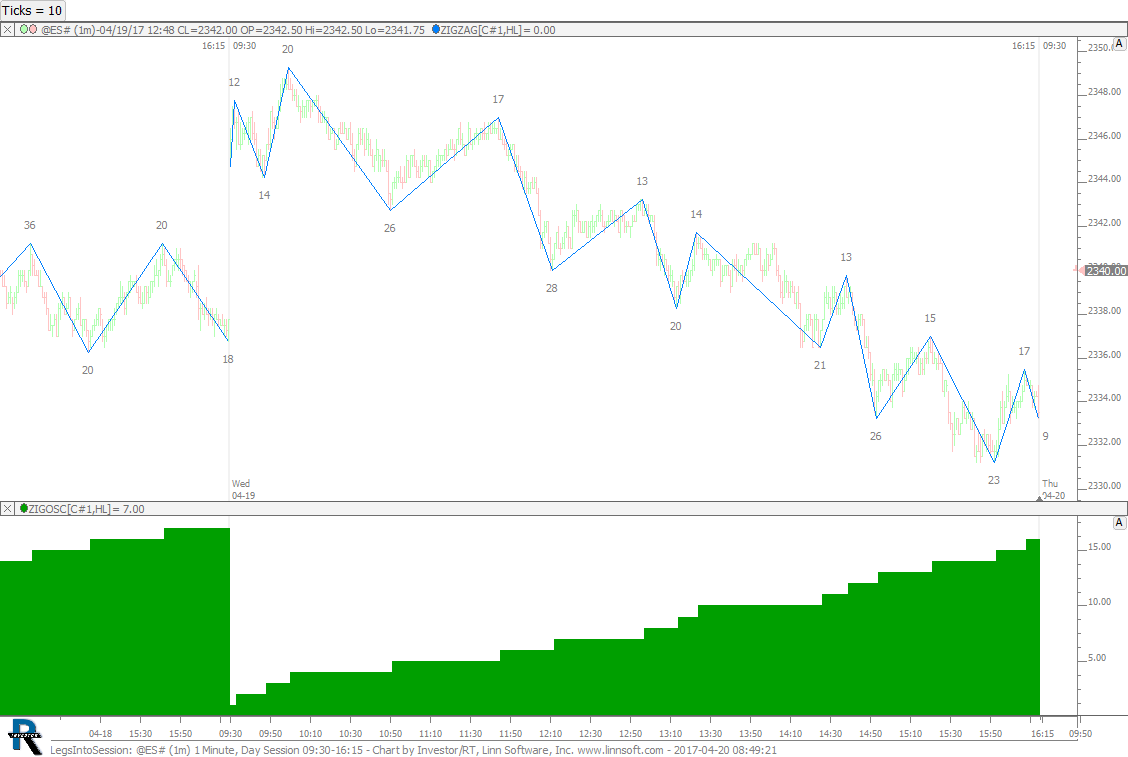 |
LegsIntoSession (@ES#) cpayne [totalcount]
9 years 3 months ago
Legs Into Session - Intraday. This chart was uploaded by Investor/RT 12.7.1 showing symbol: @ES#. |
View |
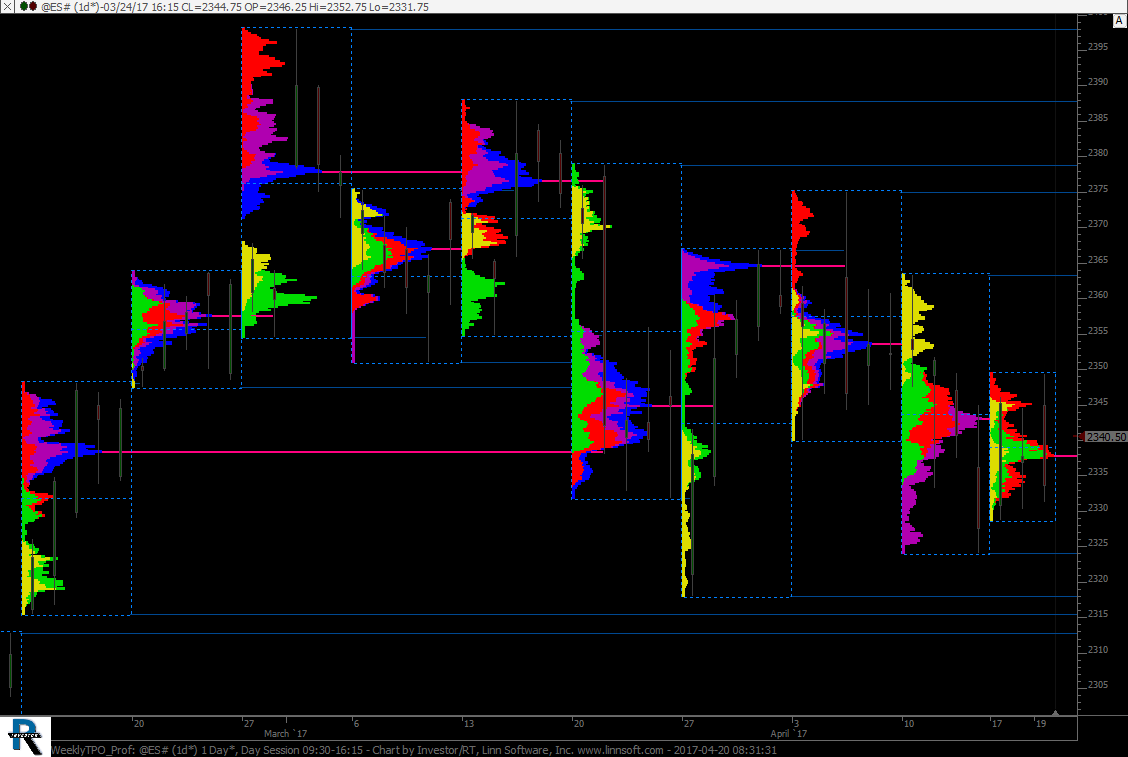 |
WeeklyTPO Prof (@ES#) cpayne [totalcount]
9 years 3 months ago
Weekly Volume Profile Chart using Profile Indicator. This chart was uploaded by Investor/RT 12.7.1 showing symbol: @ES#. |
View |
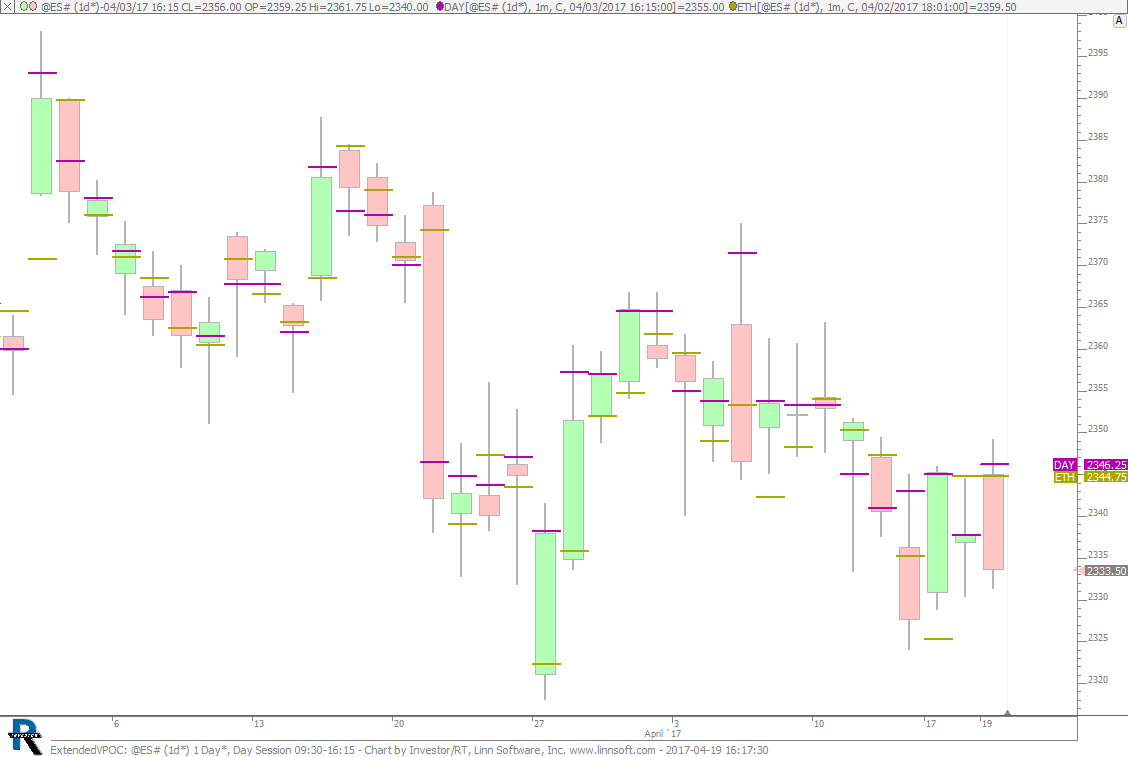 |
ExtendedVPOC (@ES#) cpayne [totalcount]
9 years 3 months ago
Day and Overnight Session VPOC. This chart was uploaded by Investor/RT 12.7.1 showing symbol: @ES#. |
View |
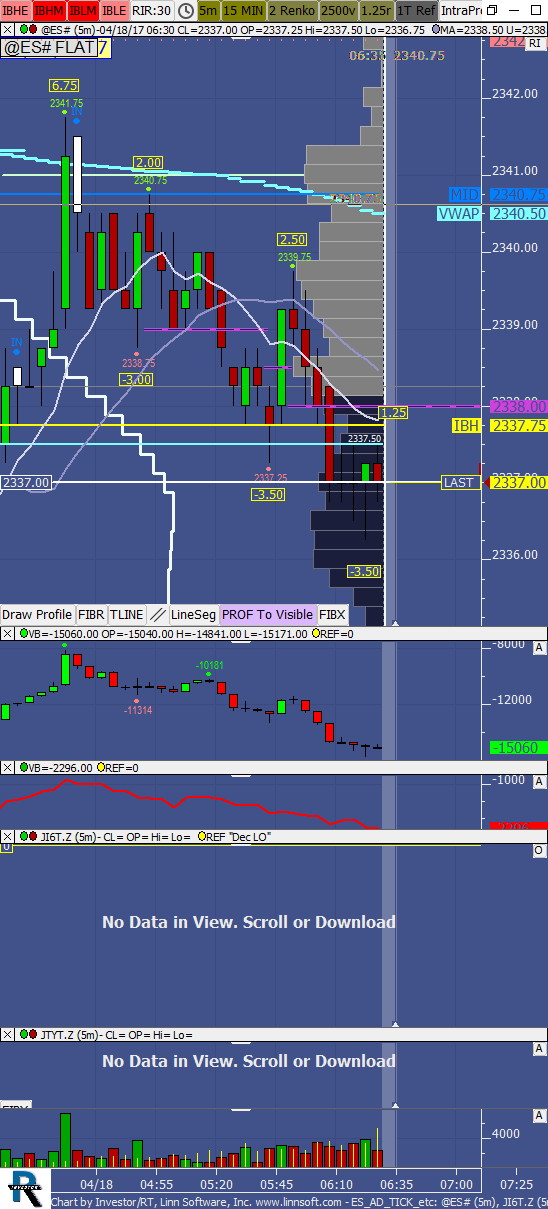 |
ES AD TICK etc (@ES#) sjk-obl [totalcount]
9 years 3 months ago
4TR Keltner. This chart was uploaded by Investor/RT 12.7.1 showing symbol: @ES#. |
View |
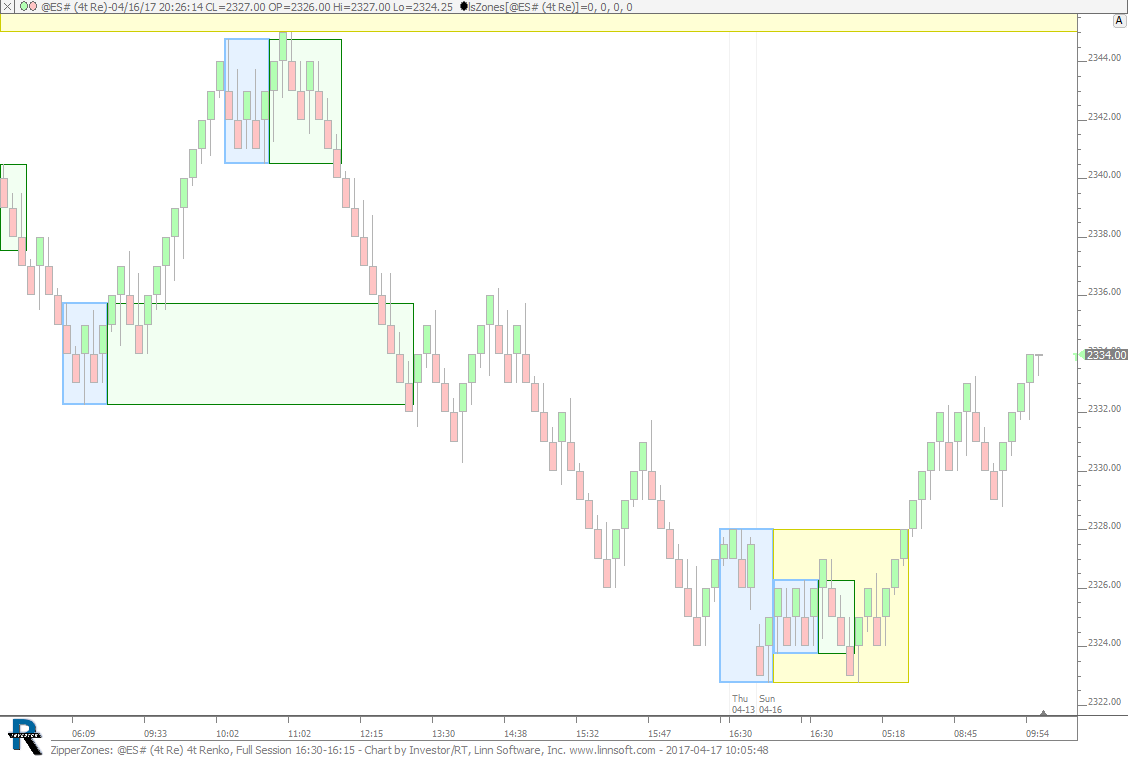 |
ZipperZones (@ES#) cpayne [totalcount]
9 years 3 months ago
Zipper Zones. This chart was uploaded by Investor/RT 12.7.1 showing symbol: @ES#. |
View |
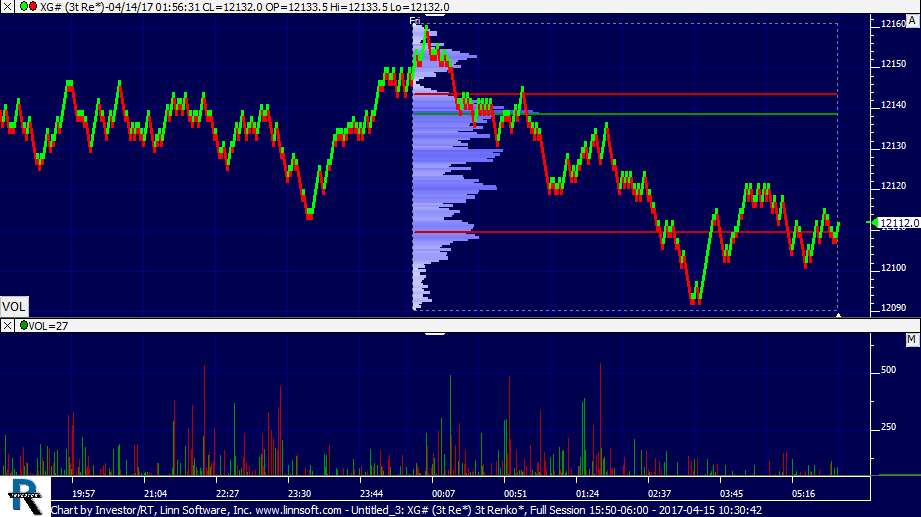 |
Untitled 3 (XG#) Byron Peeters [totalcount]
9 years 3 months ago
This chart was uploaded by Investor/RT 12.6.9 showing symbol: XG#. |
View |
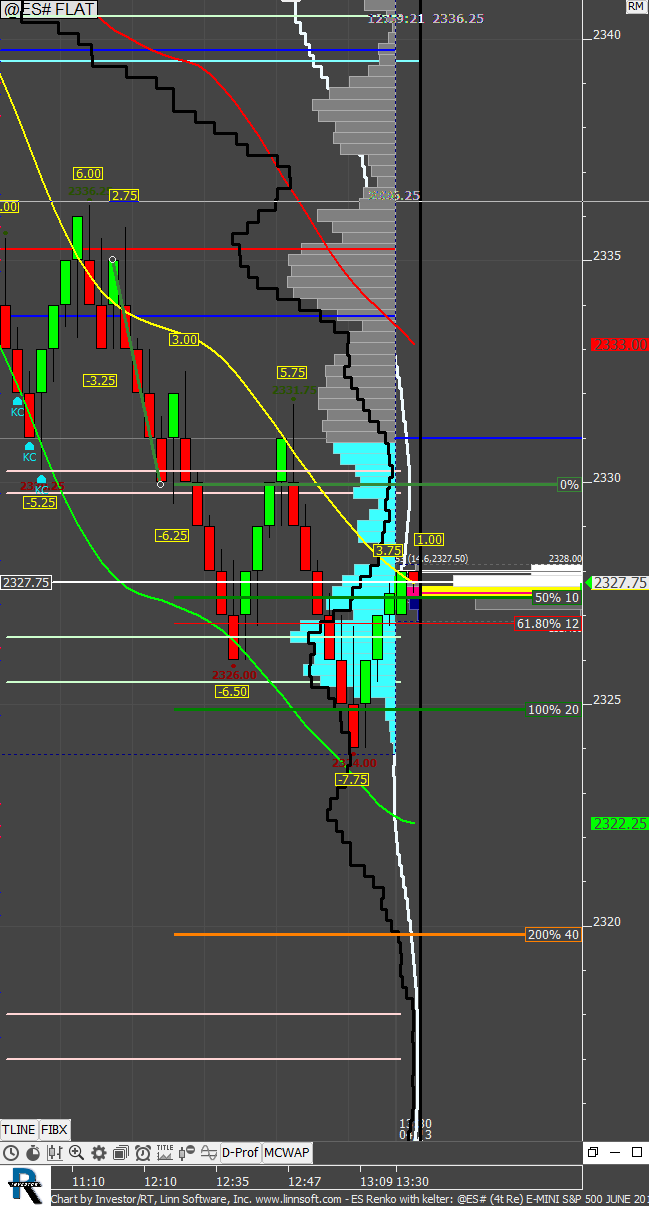 |
ES Renko with kelter (@ES#) sjk-obl [totalcount]
9 years 3 months ago
4TR Keltner. This chart was uploaded by Investor/RT 12.7.1 showing symbol: @ES#. |
View |
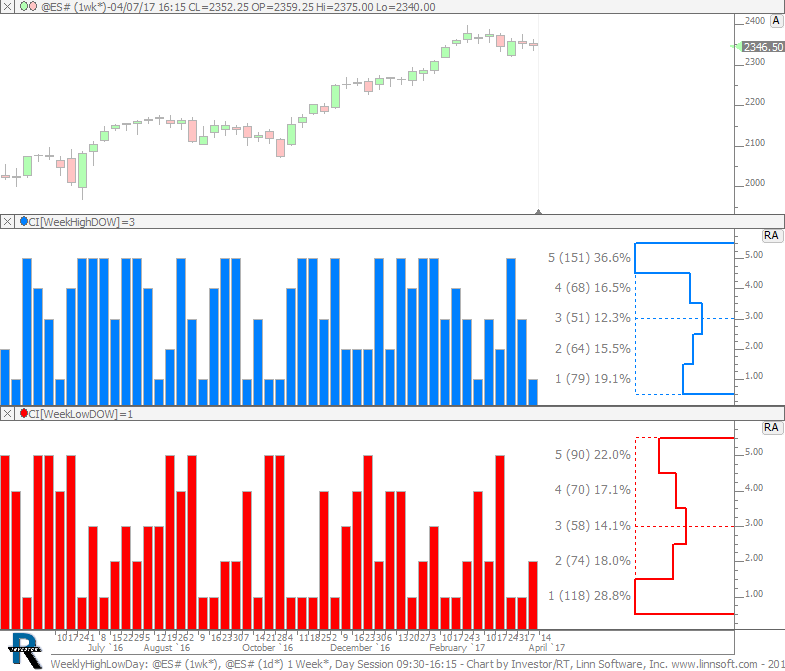 |
WeeklyHighLowDay (@ES#) cpayne [totalcount]
9 years 3 months ago
Day of Week that makes Weekly High and Low. This chart was uploaded by Investor/RT 12.7.1 showing symbol: @ES#. |
View |
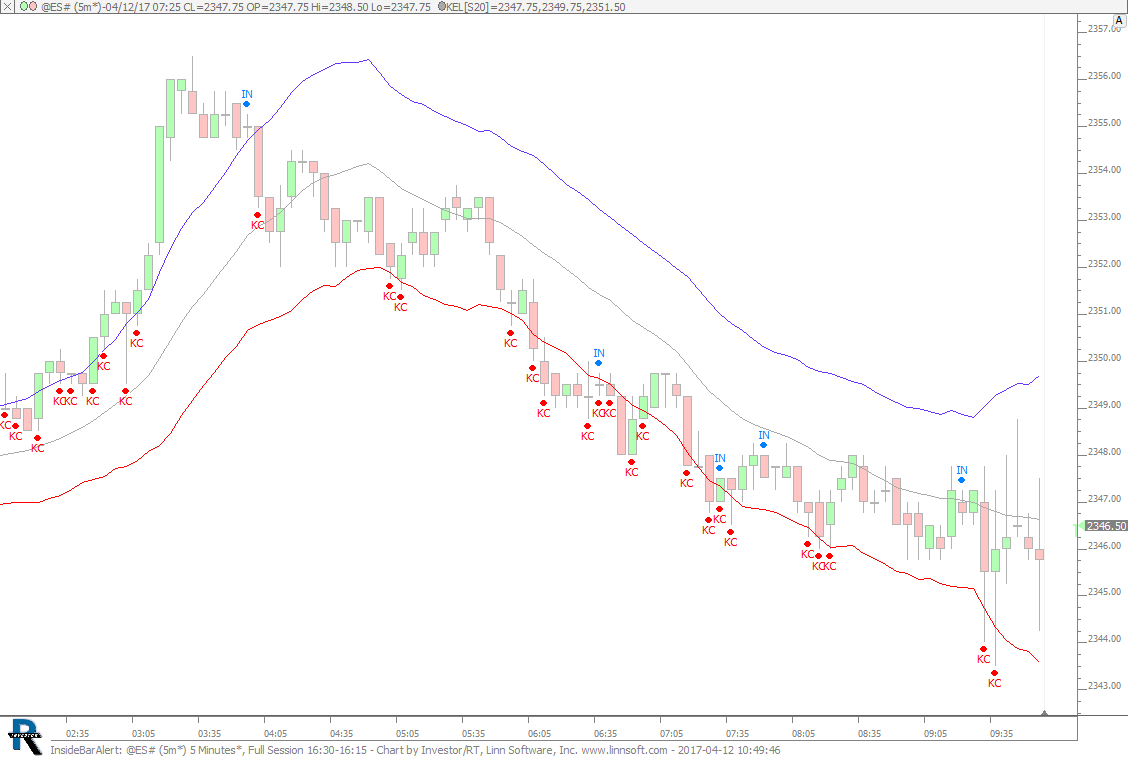 |
InsideBarAlert (@ES#) cpayne [totalcount]
9 years 3 months ago
Inside Bar with Alert. This chart was uploaded by Investor/RT 12.7.1 showing symbol: @ES#. |
View |
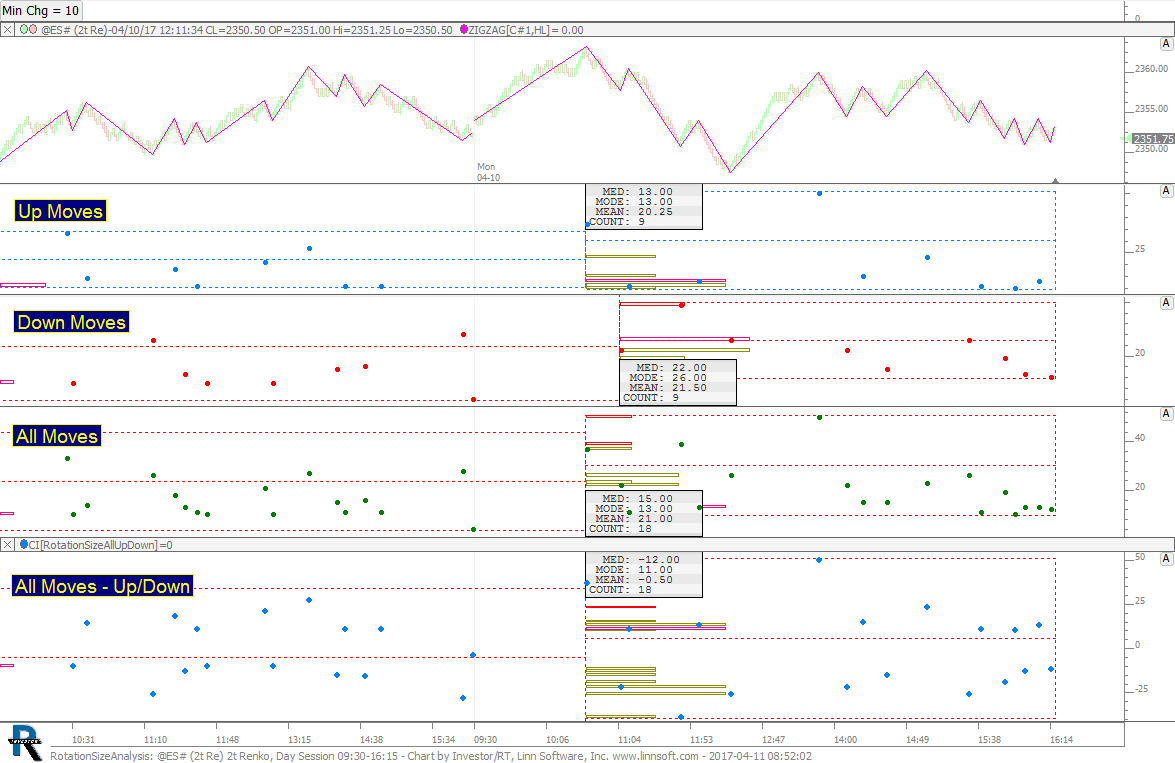 |
RotationSizeAnalysis (@ES#) cpayne [totalcount]
9 years 3 months ago
Rotation Size Analysis. This chart was uploaded by Investor/RT 12.5.5 showing symbol: @ES#. |
View |
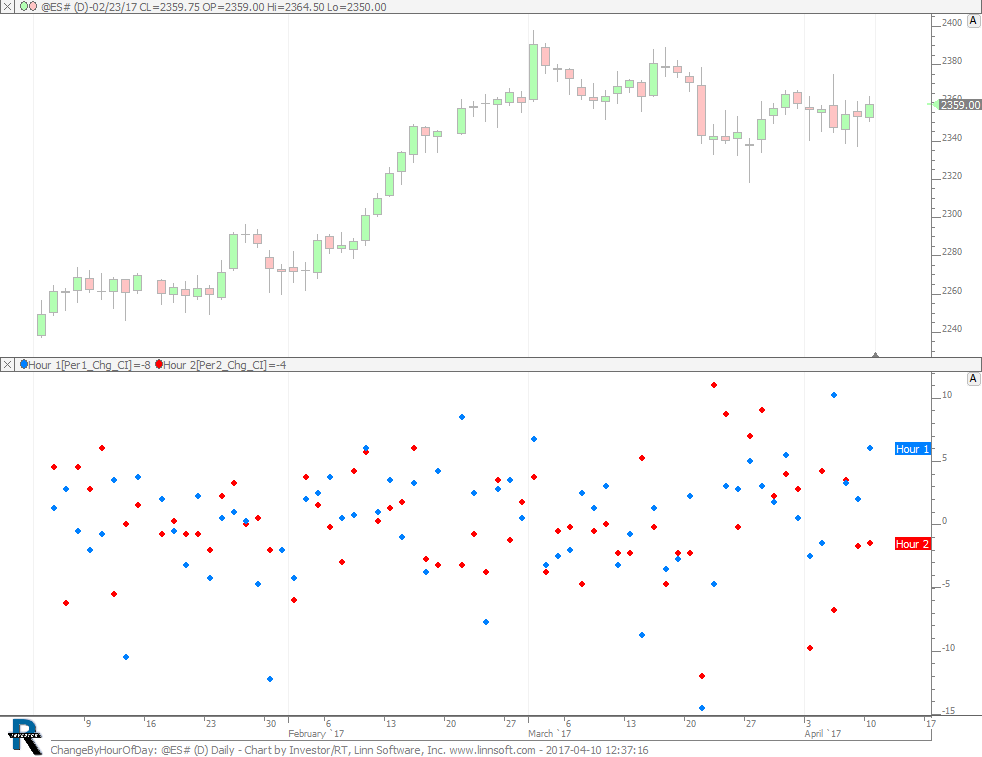 |
ChangeByHourOfDay (@ES#) cpayne [totalcount]
9 years 3 months ago
Change by Hour of Day. This chart was uploaded by Investor/RT 12.7.1 showing symbol: @ES#. |
View |
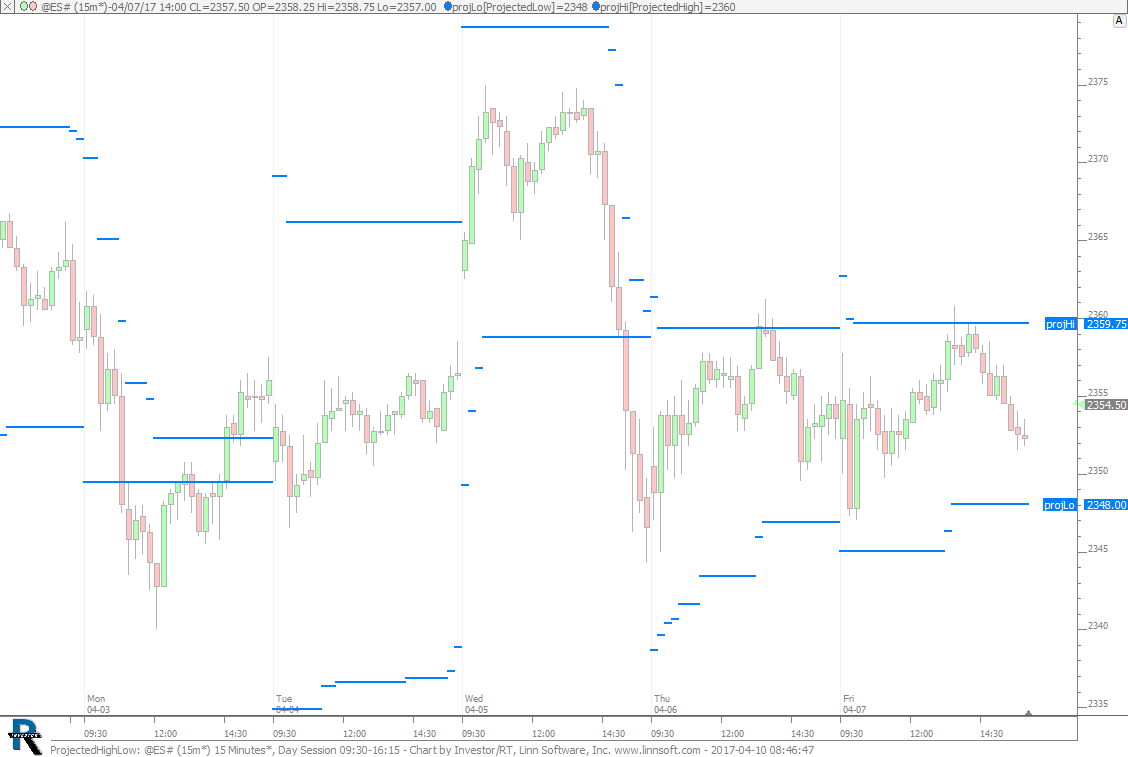 |
ProjectedHighLow (@ES#) cpayne [totalcount]
9 years 3 months ago
Projected High and Low of Session. This chart was uploaded by Investor/RT 12.7.1 showing symbol: @ES#. |
View |
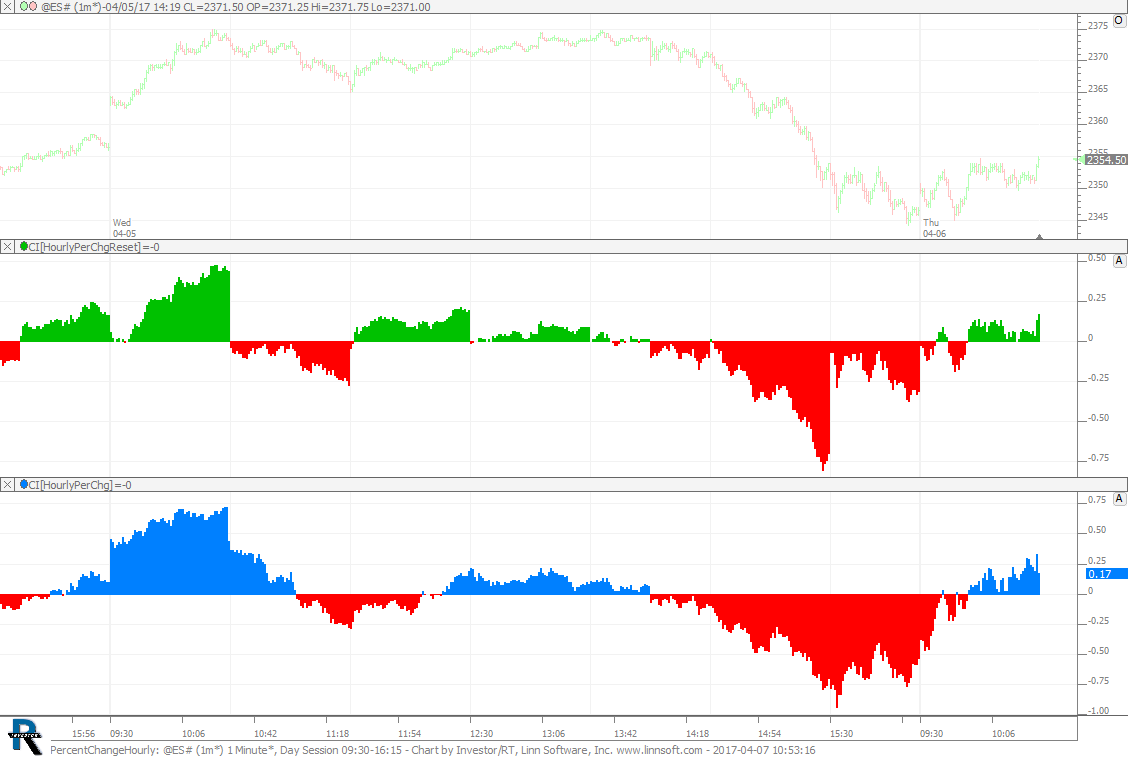 |
PercentChangeHourly (@ES#) cpayne [totalcount]
9 years 3 months ago
Percent Change Hourly. This chart was uploaded by Investor/RT 12.7.1 showing symbol: @ES#. |
View |
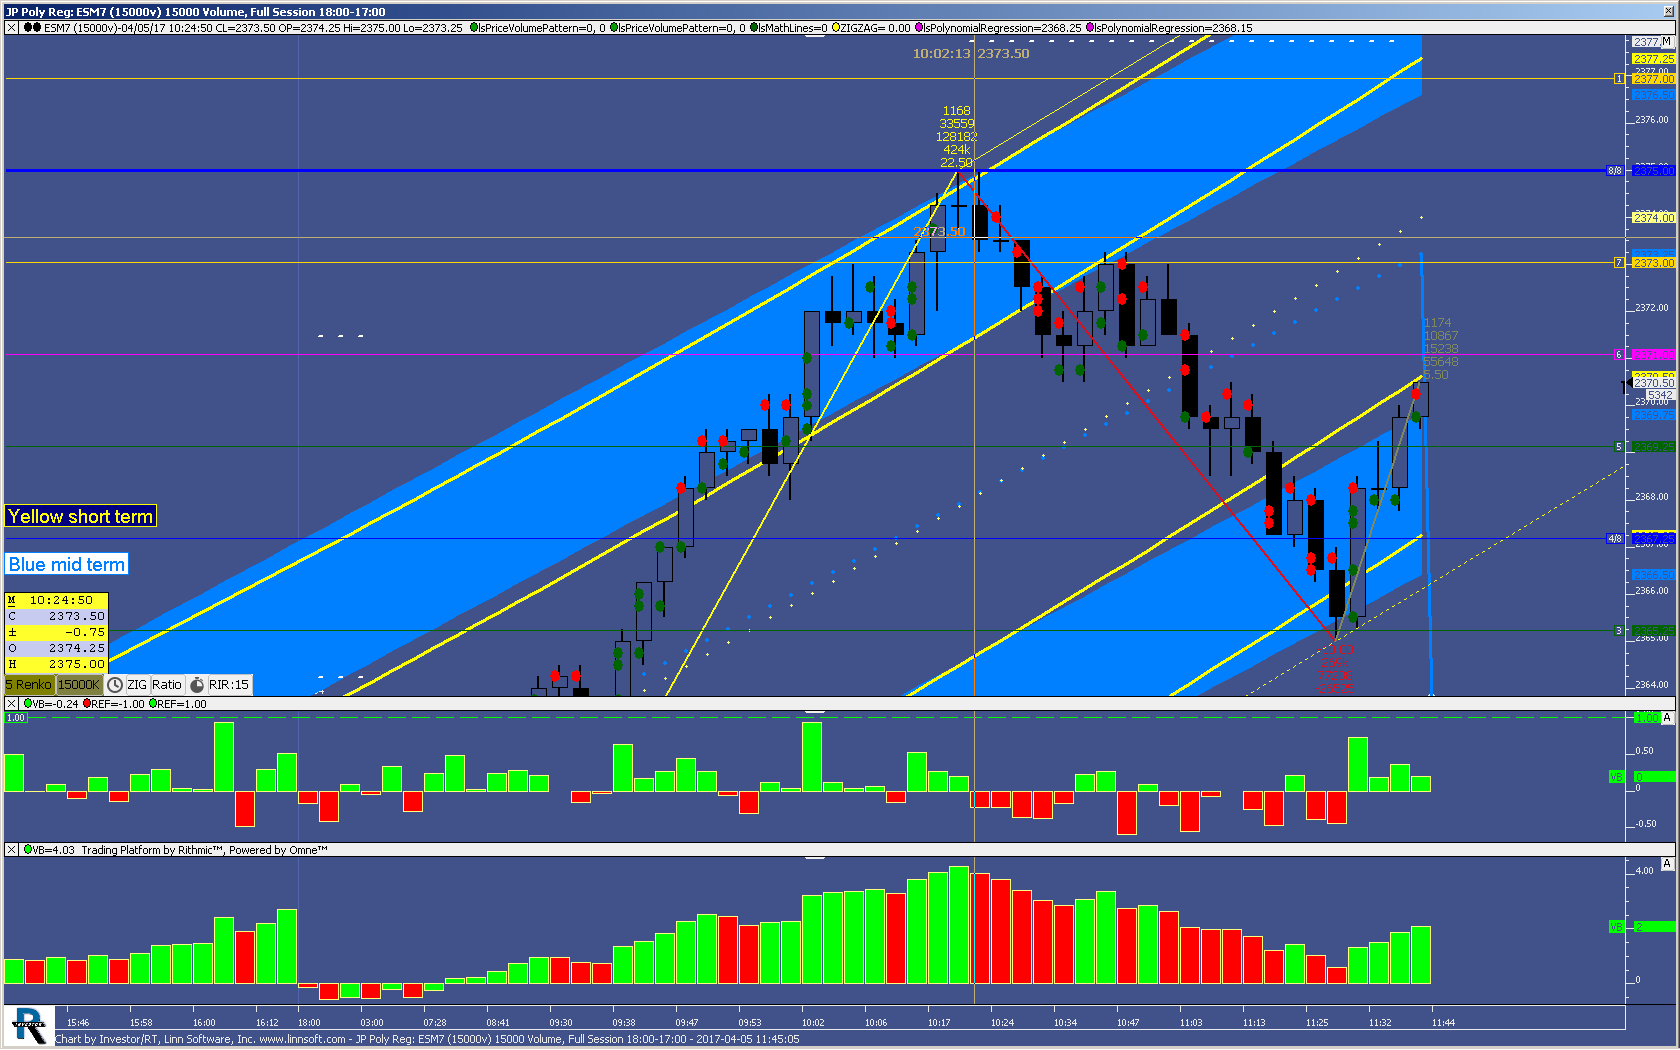 |
JP Poly Reg (ESM7) ALBORCA [totalcount]
9 years 3 months ago
Alborca From JPJ trading chat room. This chart was uploaded by Investor/RT 12.6.9 showing symbol: ESM7. |
View |
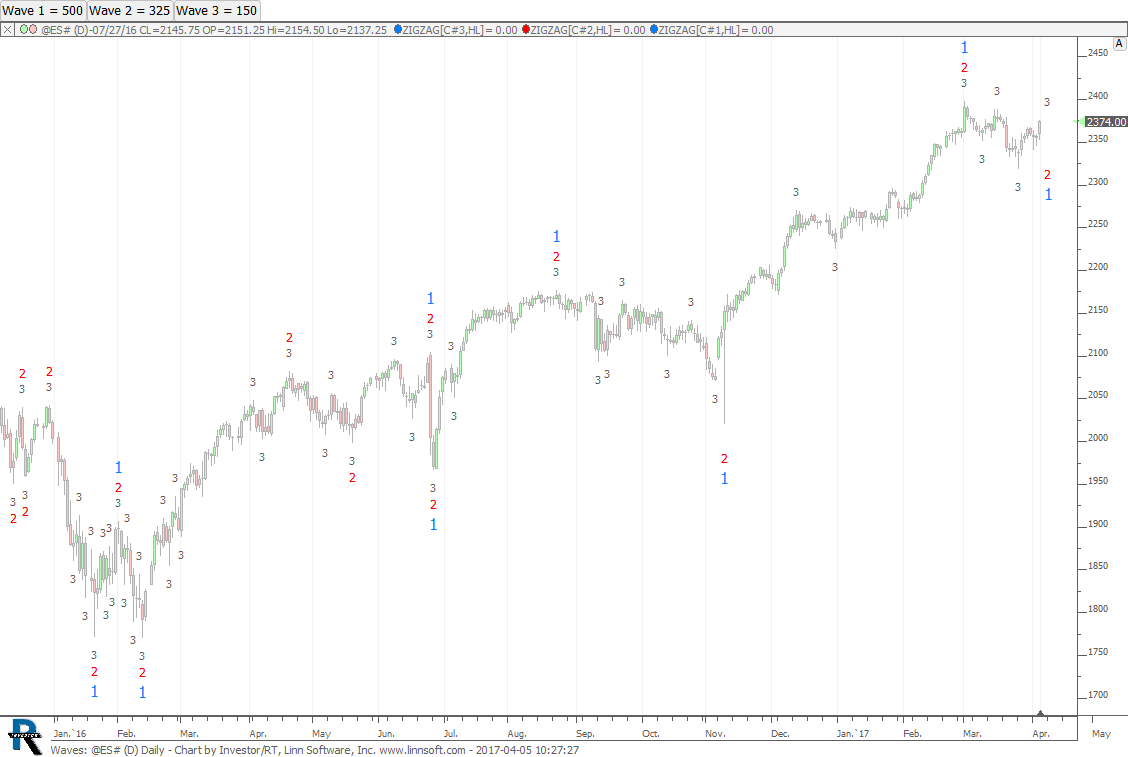 |
Waves (@ES#) cpayne [totalcount]
9 years 3 months ago
Waves. This chart was uploaded by Investor/RT 12.7.1 showing symbol: @ES#. |
View |
 |
PriceStatsVolumeCandles (@ES#) cpayne [totalcount]
9 years 3 months ago
Price Statistic and Volume Candles. This chart was uploaded by Investor/RT 12.7.1 showing symbol: @ES#. |
View |
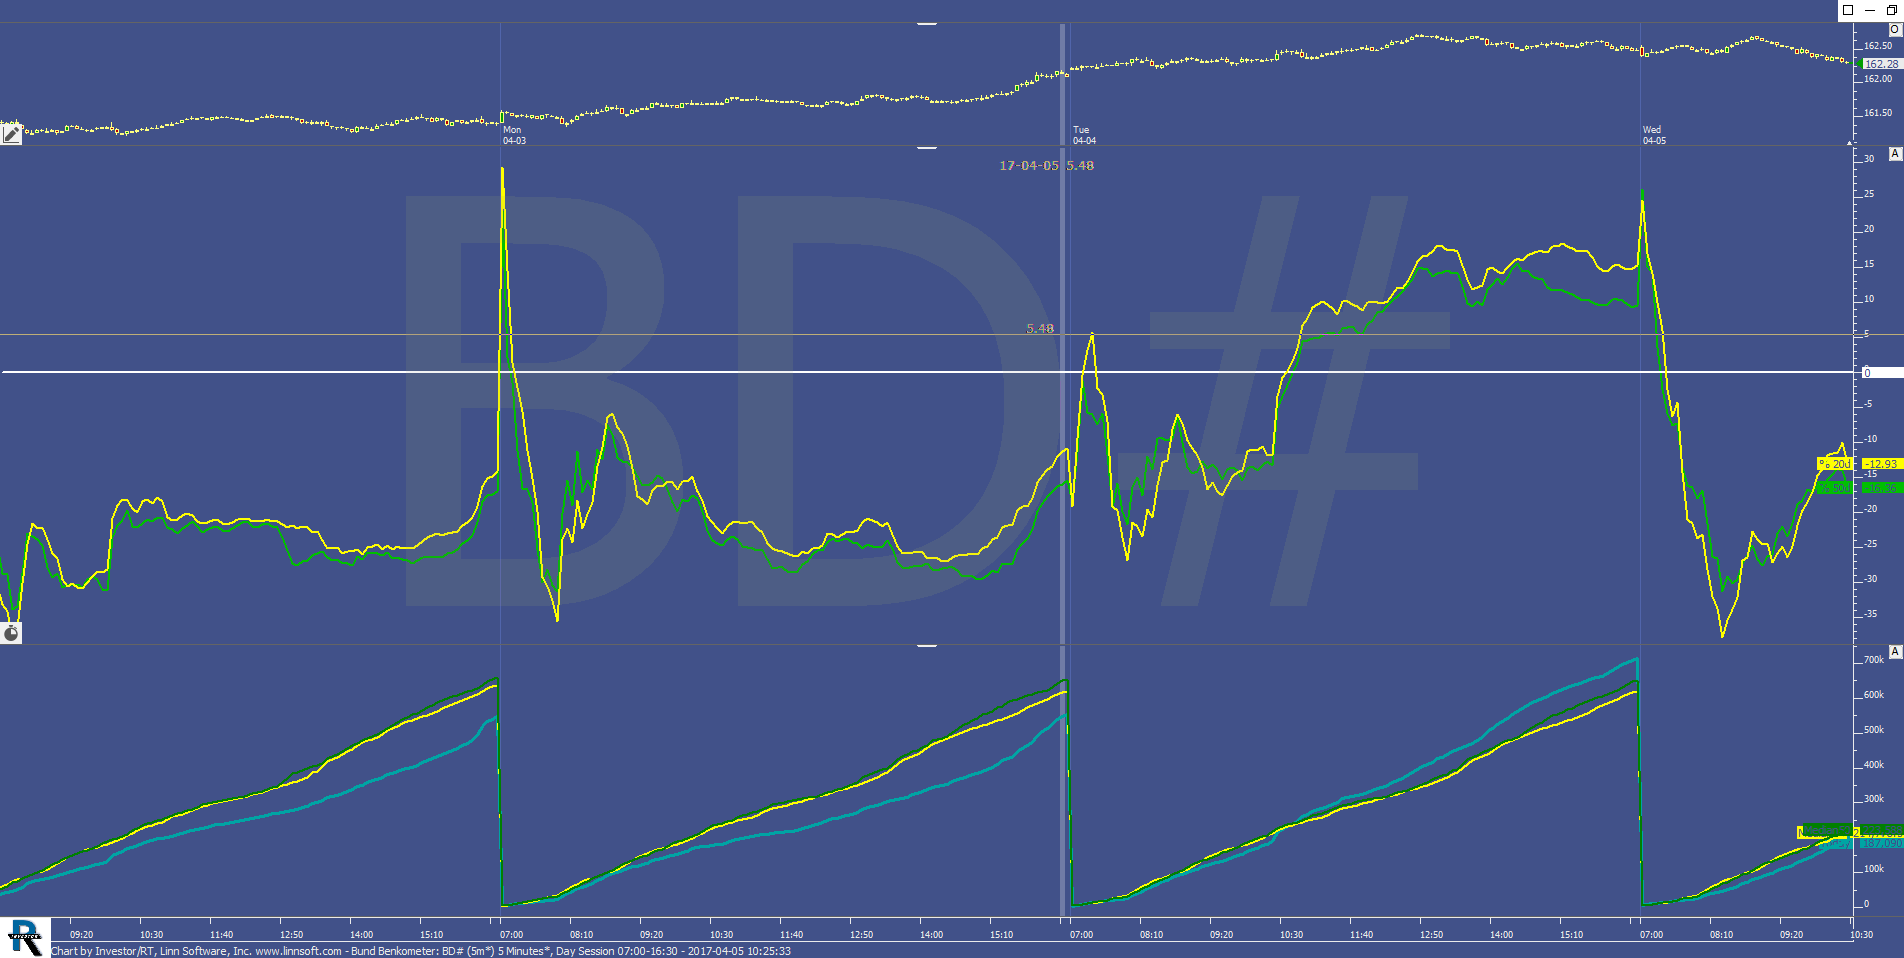 |
Bund Benkometer (BD#) san-gambhir [totalcount]
9 years 3 months ago
This chart was uploaded by Investor/RT 12.6.9 showing symbol: BD#. |
View |
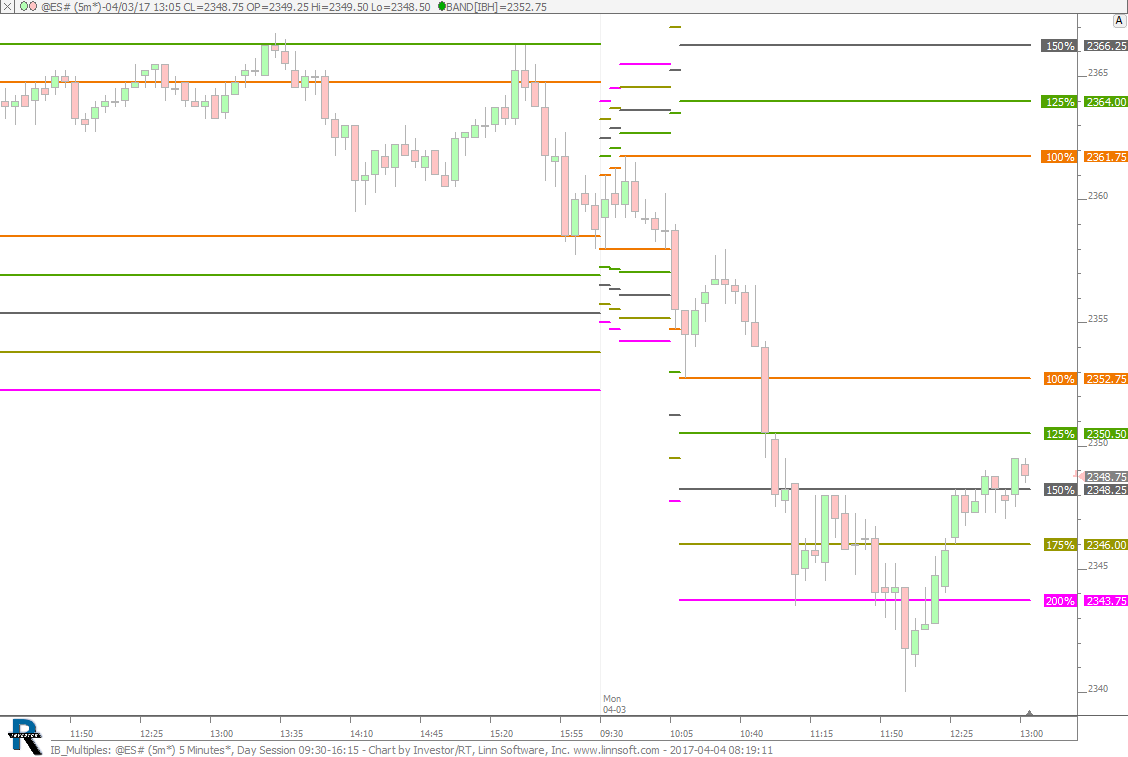 |
IB Multiples (@ES#) cpayne [totalcount]
9 years 4 months ago
Initial Balance Multiples using Bands Indicator. This chart was uploaded by Investor/RT 12.7.1 showing symbol: @ES#. |
View |
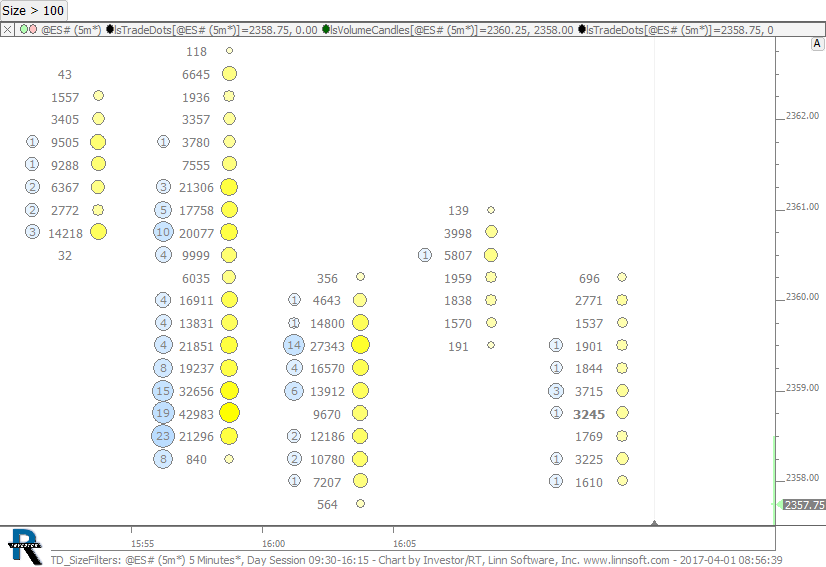 |
TD SizeFilters (@ES#) cpayne [totalcount]
9 years 4 months ago
TradeDots with Volume Filtering and Accumulated Trades. This chart was uploaded by Investor/RT 12.7.1 showing symbol: @ES#. |
View |
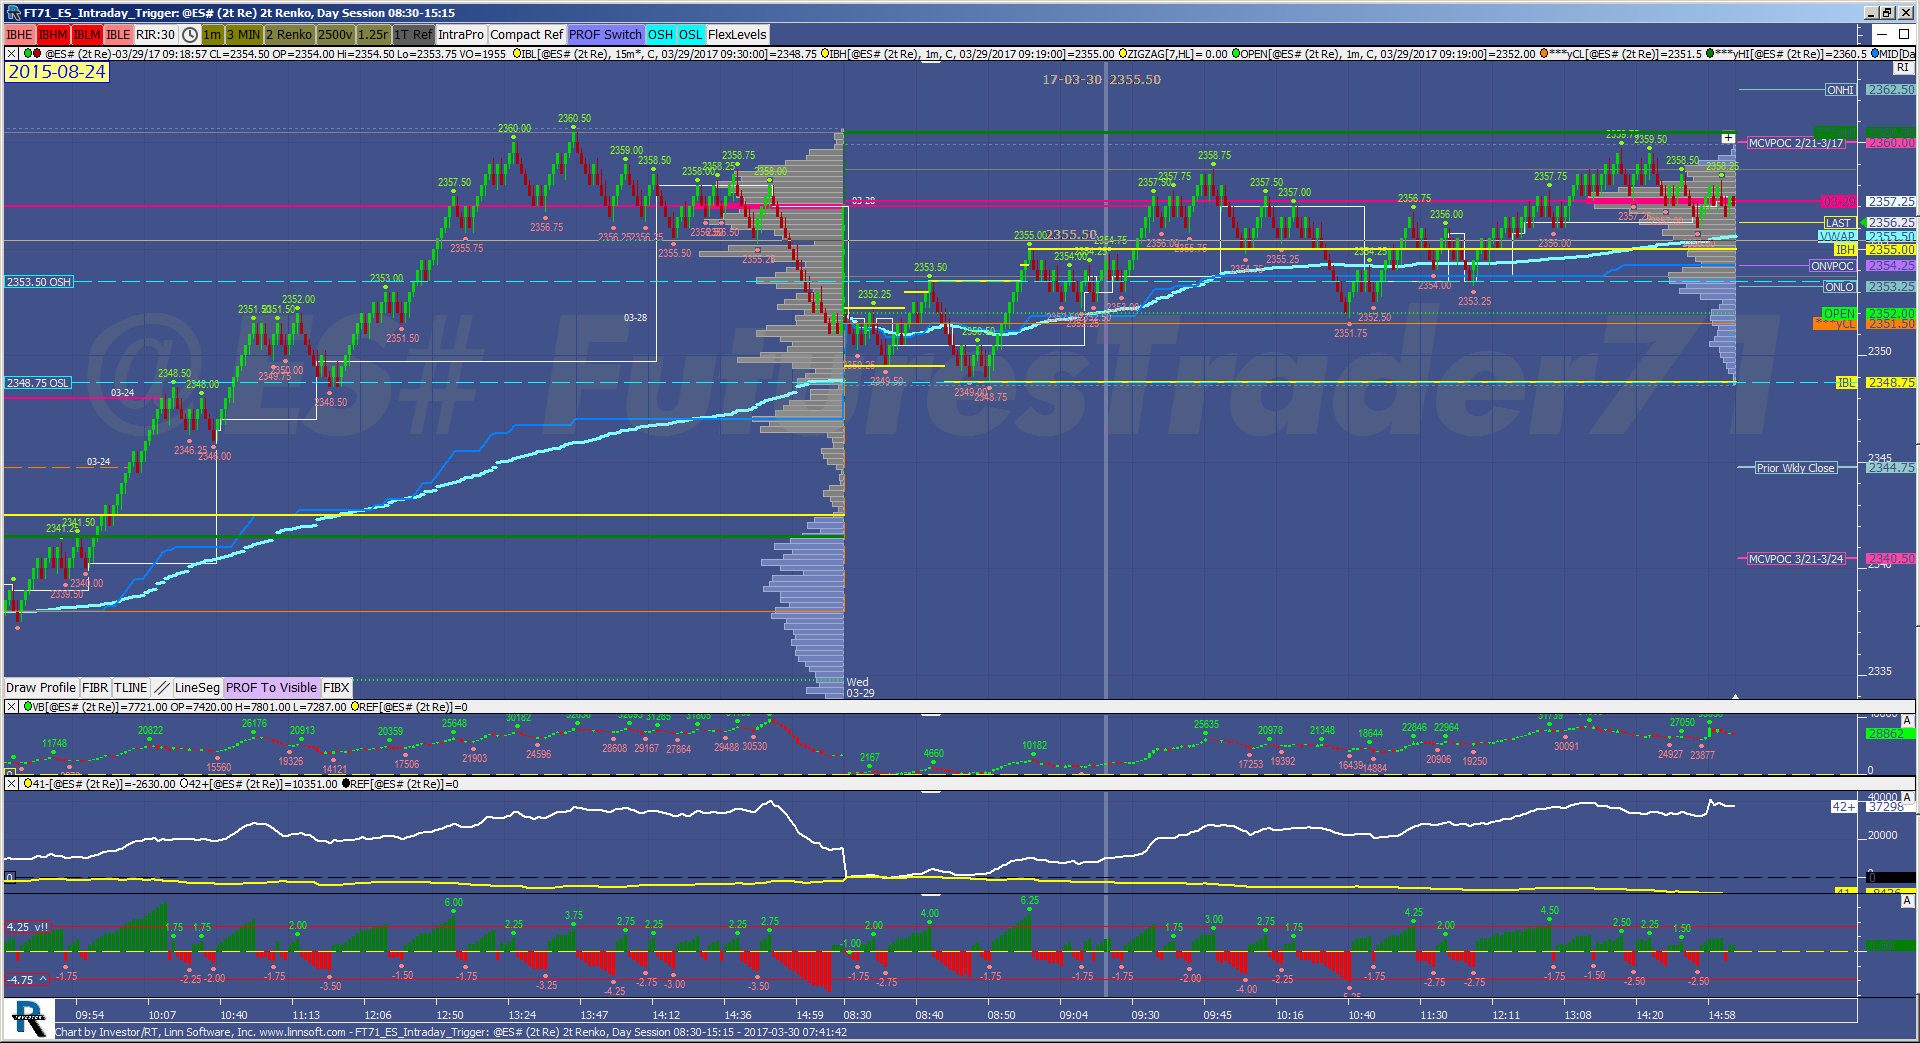 |
FT71 ES Intraday Trigger (@ES#) futurestrader71 [totalcount]
9 years 4 months ago
This chart was uploaded by Investor/RT 12.5.6 showing symbol: @ES#. |
View |
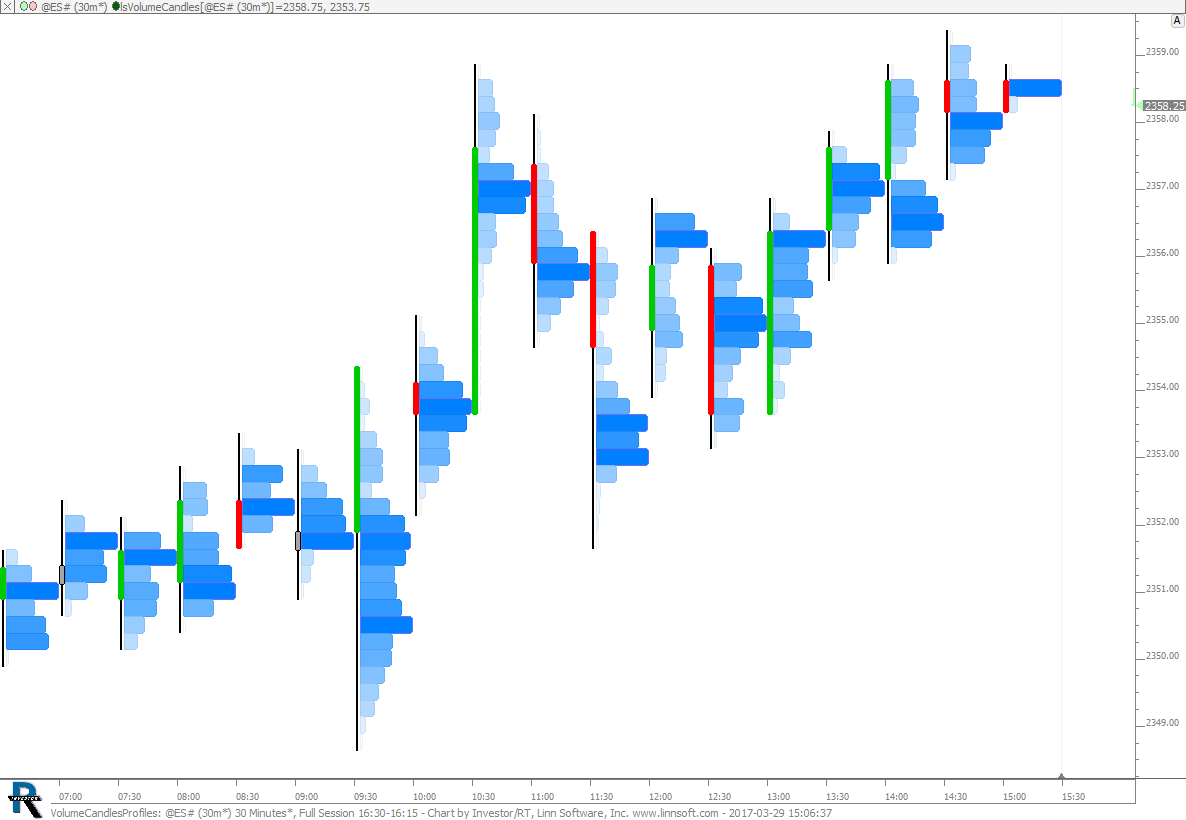 |
VolumeCandlesProfiles (@ES#) cpayne [totalcount]
9 years 4 months ago
Volume Candles - Profiles. This chart was uploaded by Investor/RT 12.7.1 showing symbol: @ES#. |
View |
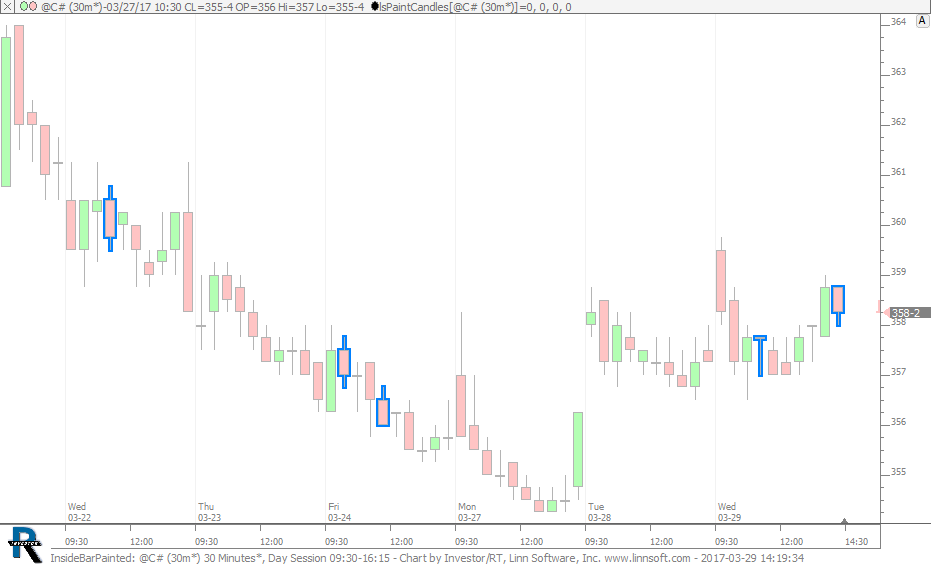 |
InsideBarPainted (@C#) cpayne [totalcount]
9 years 4 months ago
Inside Bars. This chart was uploaded by Investor/RT 12.7.1 showing symbol: @C#. |
View |
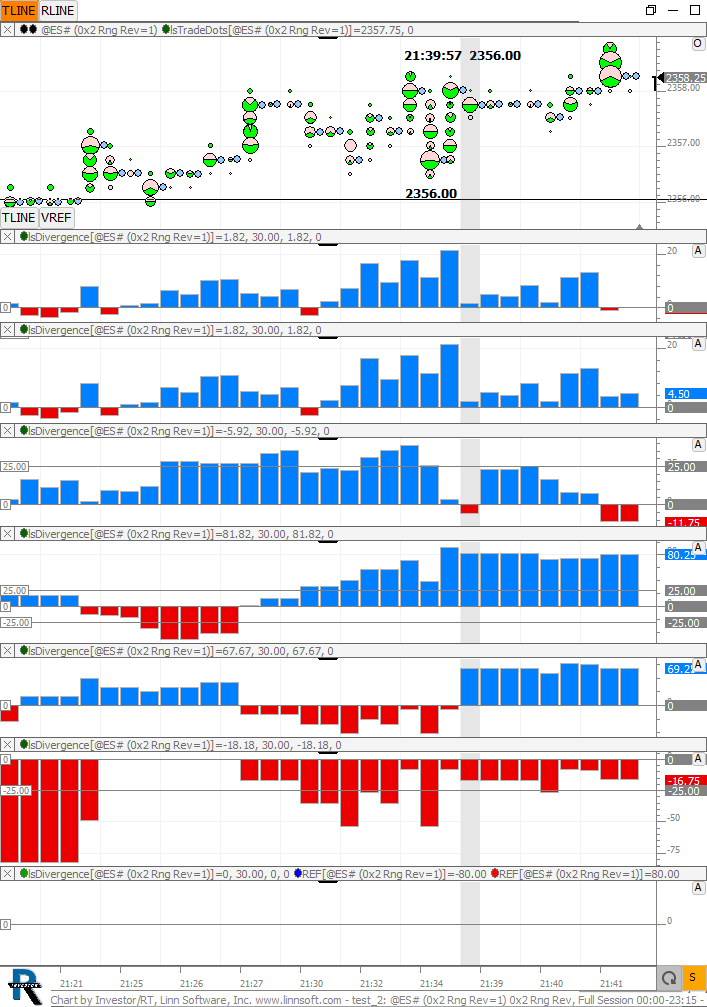 |
test (@ES#) tosaxx [totalcount]
9 years 4 months ago
This chart was uploaded by Investor/RT 12.6.9 showing symbol: @ES#. |
View |