 |
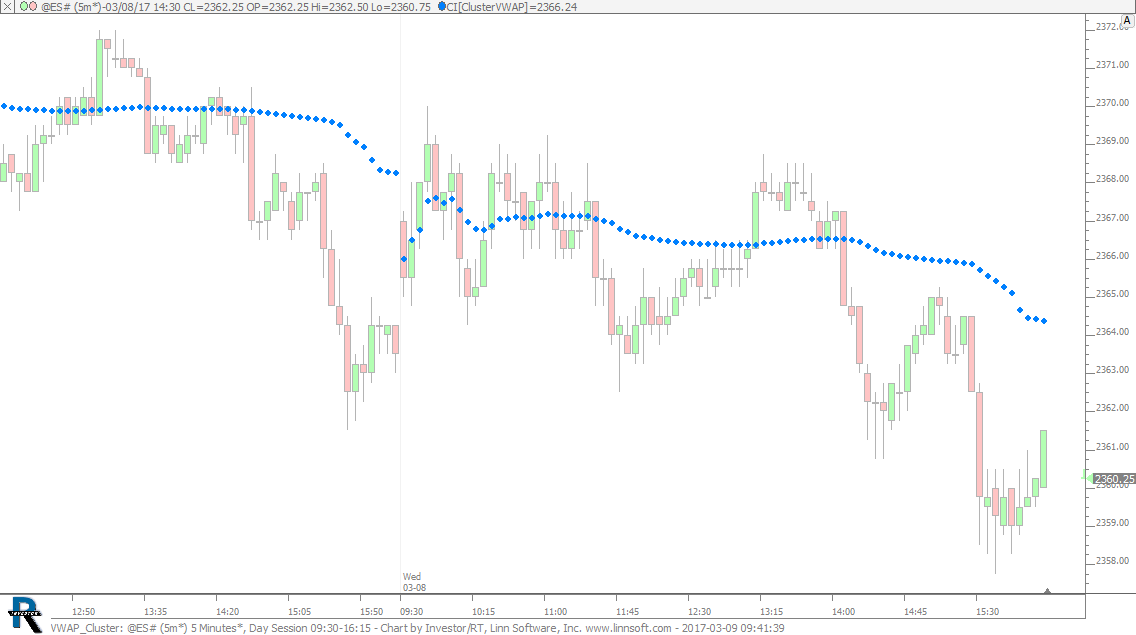
VWAP Cluster (@ES#) cpayne [totalcount]
9 years 4 months ago
Cluster VWAP. This chart was uploaded by Investor/RT 12.7.1 showing symbol: @ES#. |
View |
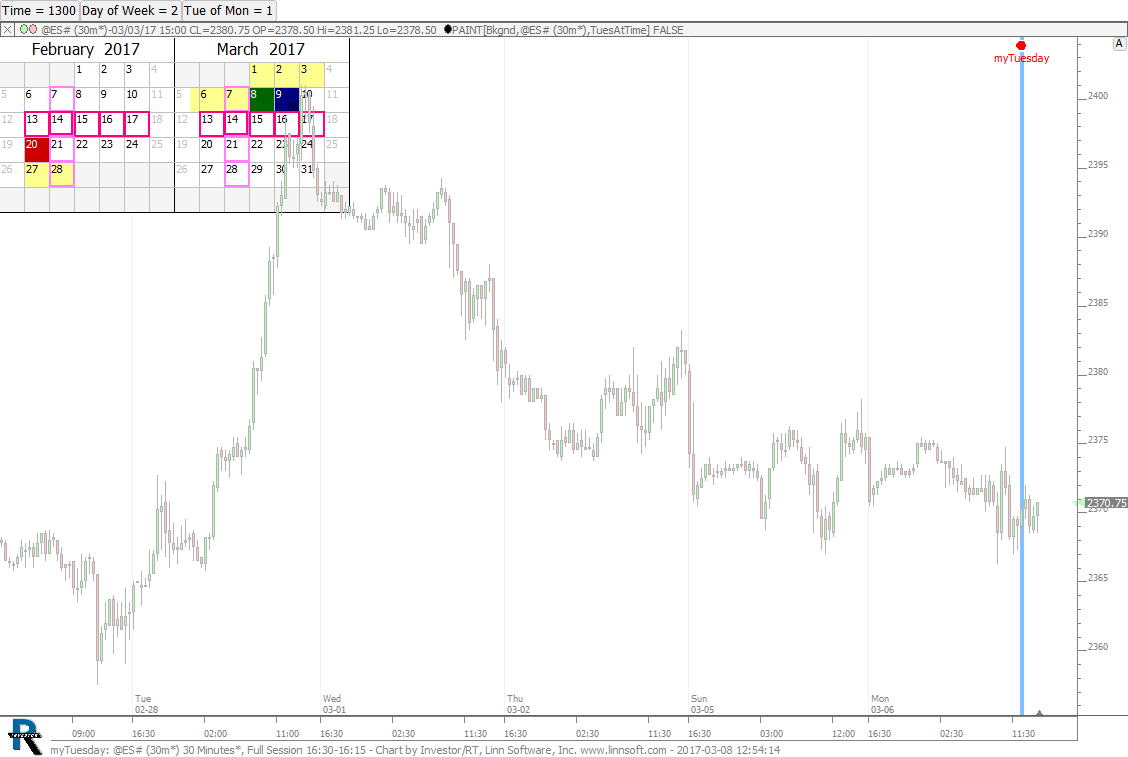 |
myTuesday (@ES#) cpayne [totalcount]
9 years 4 months ago
myTuesday - 3rd Tuesday of Month at 1300. This chart was uploaded by Investor/RT 12.7.1 showing symbol: @ES#. |
View |
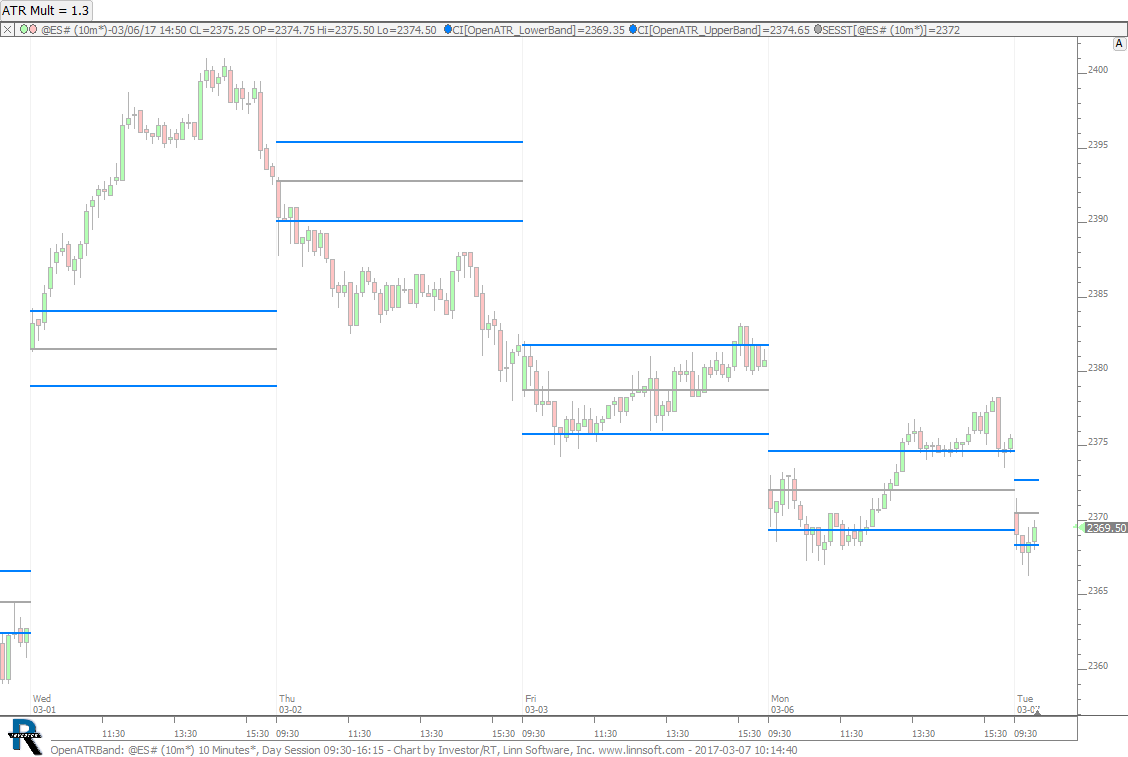 |
OpenATRBand (@ES#) cpayne [totalcount]
9 years 4 months ago
Bands from Open - Multiple of ATR Controlled by Button. This chart was uploaded by Investor/RT 12.7.1 showing symbol: @ES#. |
View |
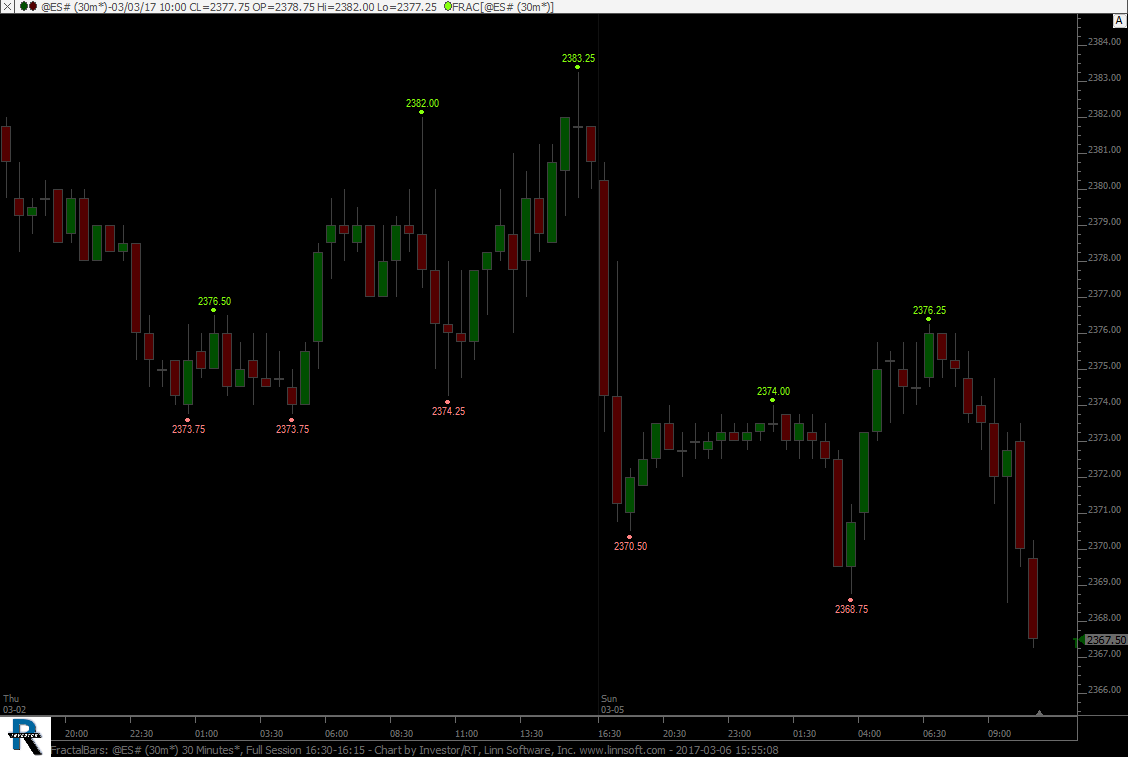 |
FractalBars (@ES#) cpayne [totalcount]
9 years 4 months ago
Fractal Bars. This chart was uploaded by Investor/RT 12.7.1 showing symbol: @ES#. |
View |
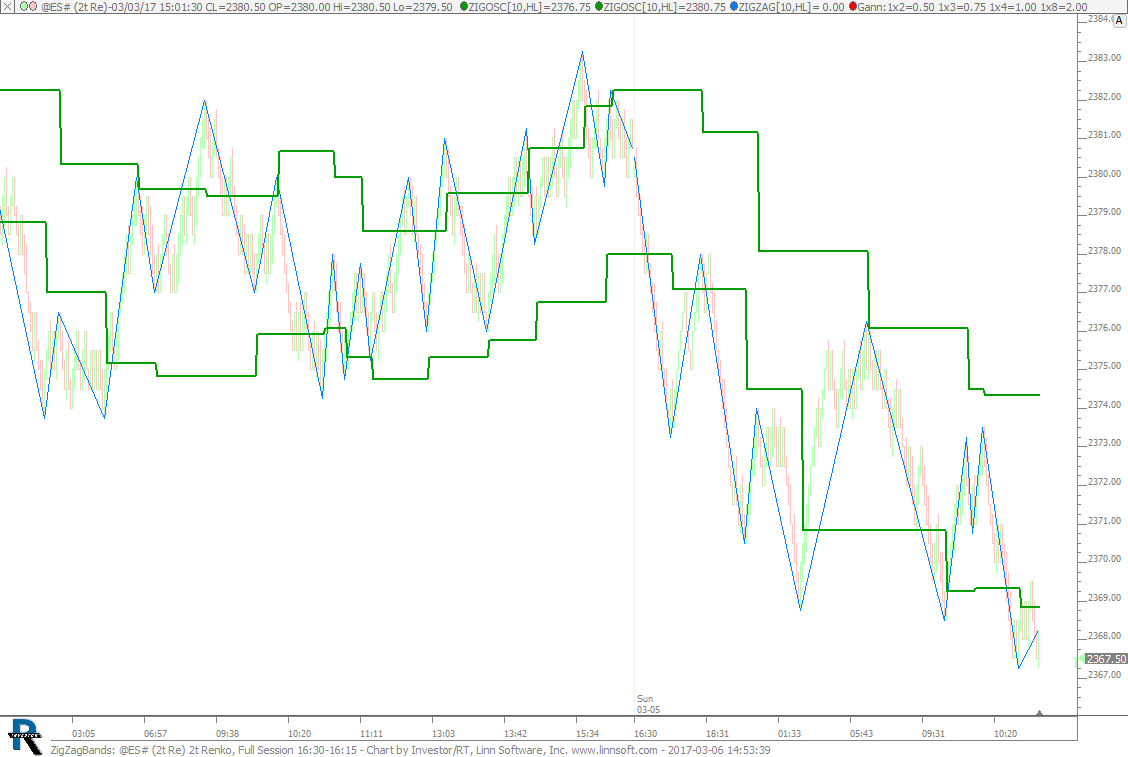 |
ZigZagBands (@ES#) cpayne [totalcount]
9 years 4 months ago
Zig Zag Bands. This chart was uploaded by Investor/RT 12.7.1 showing symbol: @ES#. |
View |
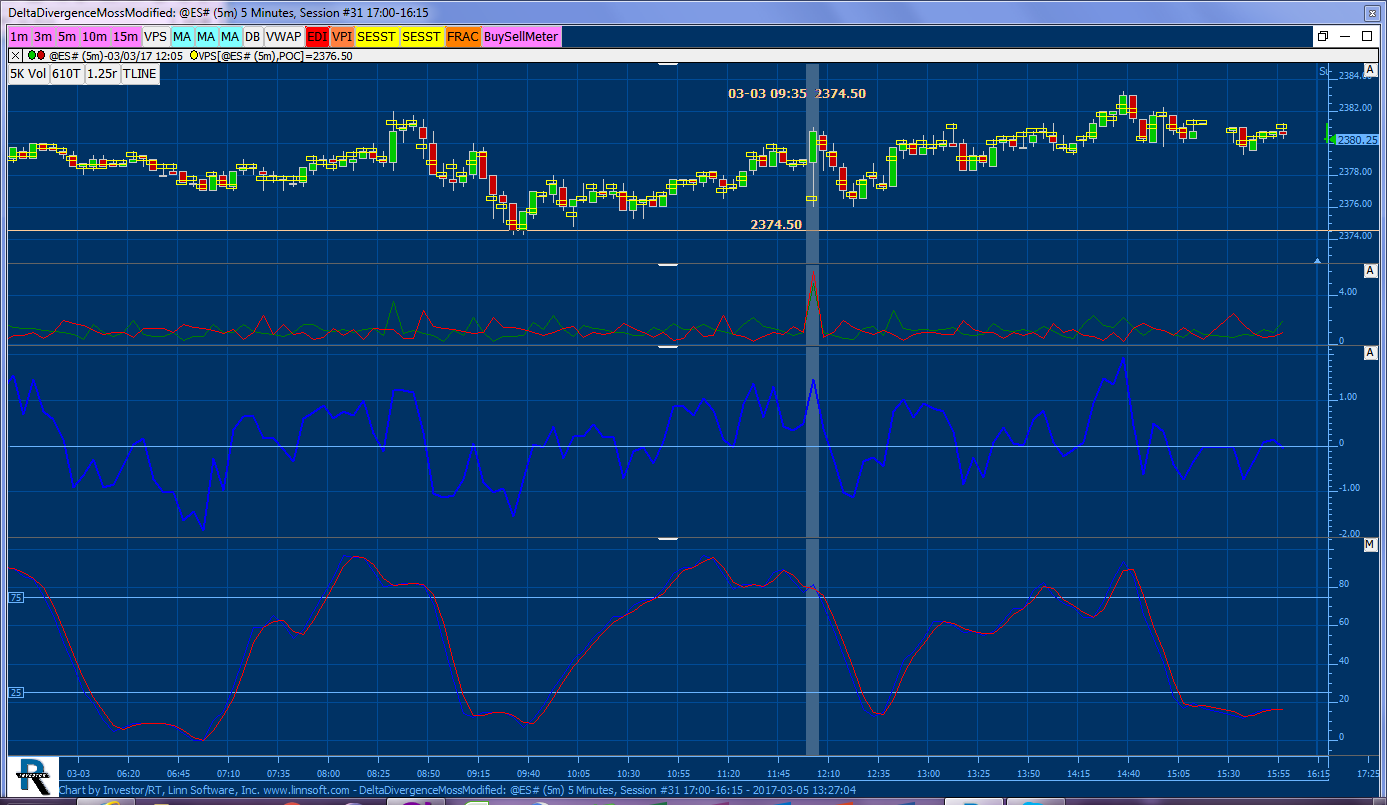 |
DeltaDivergenceMossModified (@ES#) John Moss [totalcount]
9 years 4 months ago
Signal in Question is RandomWalkChartMillSell. This chart was uploaded by Investor/RT 12.7.1 showing symbol: @ES#. |
View |
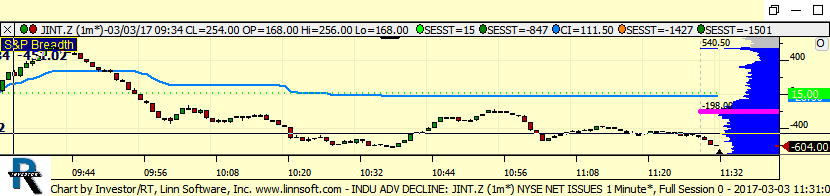 |
INDU ADV DECLINE (JINT.Z) tradercrm [totalcount]
9 years 5 months ago
This chart was uploaded by Investor/RT 12.6.8 showing symbol: JINT.Z. |
View |
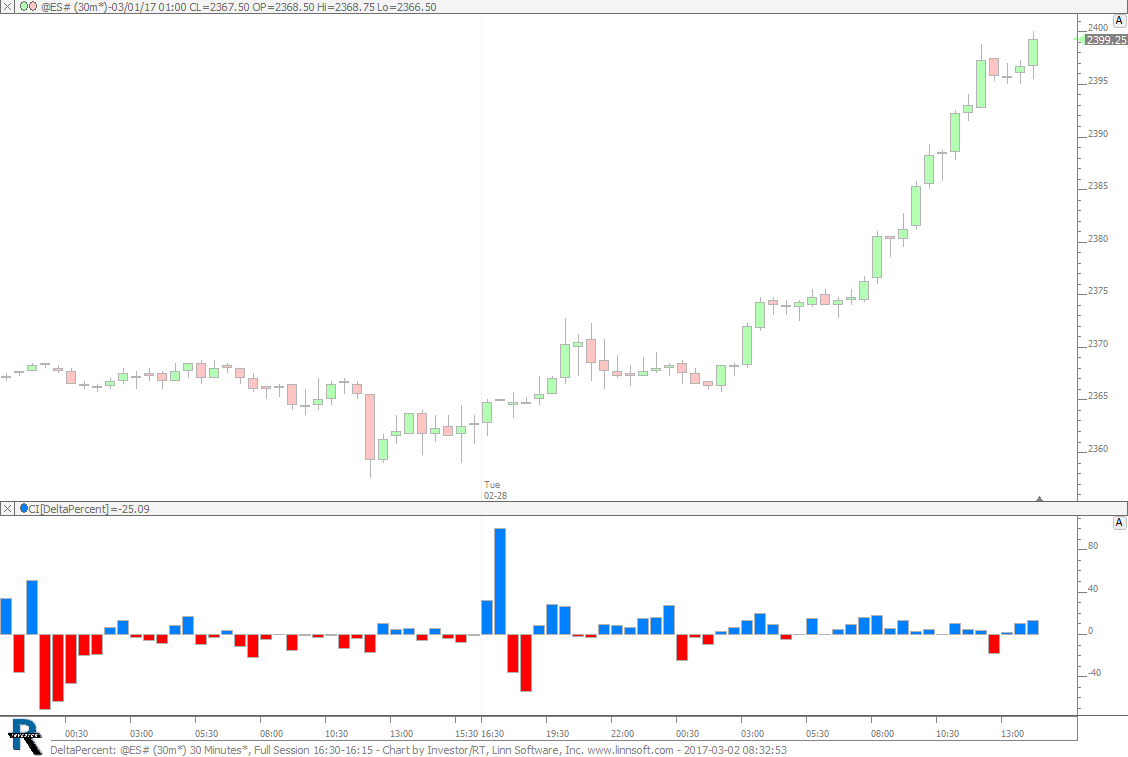 |
DeltaPercent (@ES#) cpayne [totalcount]
9 years 5 months ago
Delta Percent. This chart was uploaded by Investor/RT 12.7.1 showing symbol: @ES#. |
View |
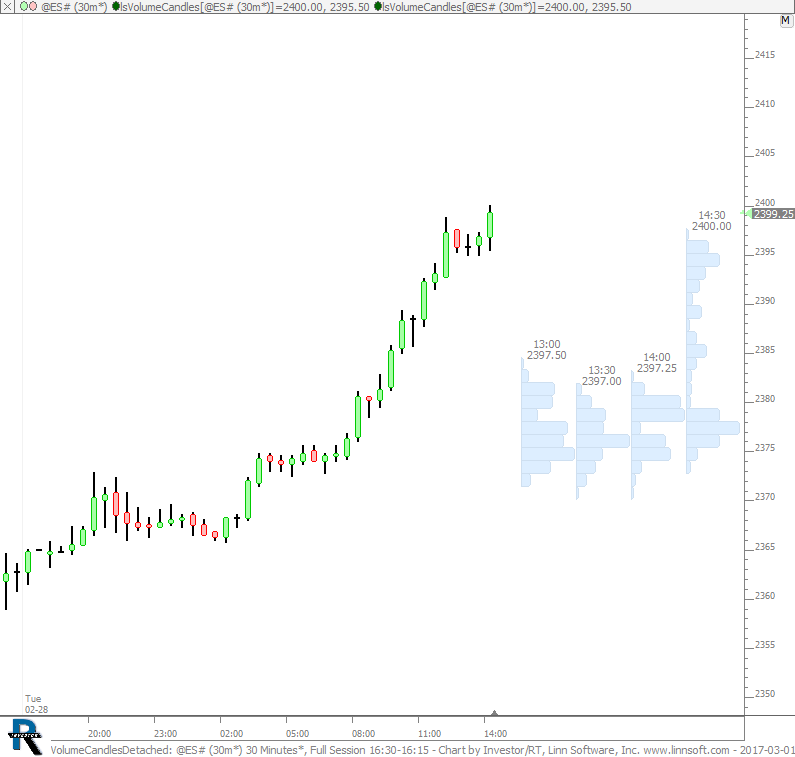 |
VolumeCandlesDetached (@ES#) cpayne [totalcount]
9 years 5 months ago
Detached Volume Candles. This chart was uploaded by Investor/RT 12.7.1 showing symbol: @ES#. |
View |
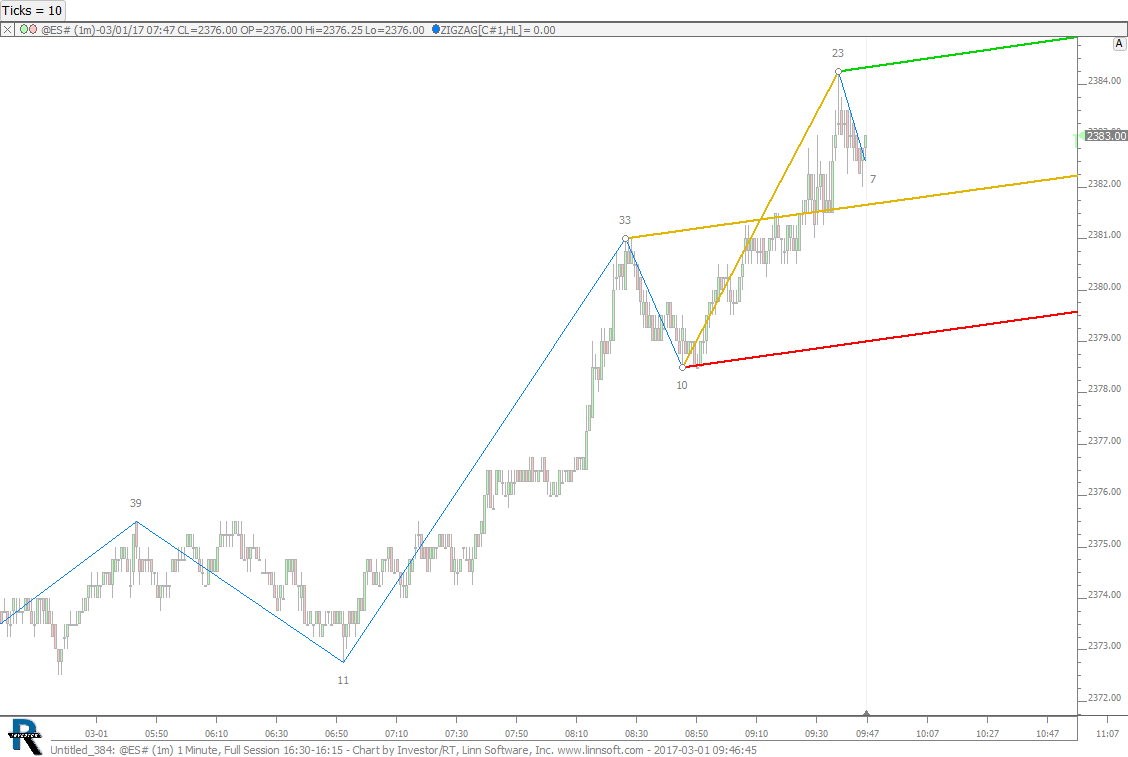 |
Untitled 384 (@ES#) cpayne [totalcount]
9 years 5 months ago
Auto Forks. This chart was uploaded by Investor/RT 12.7.1 showing symbol: @ES#. |
View |
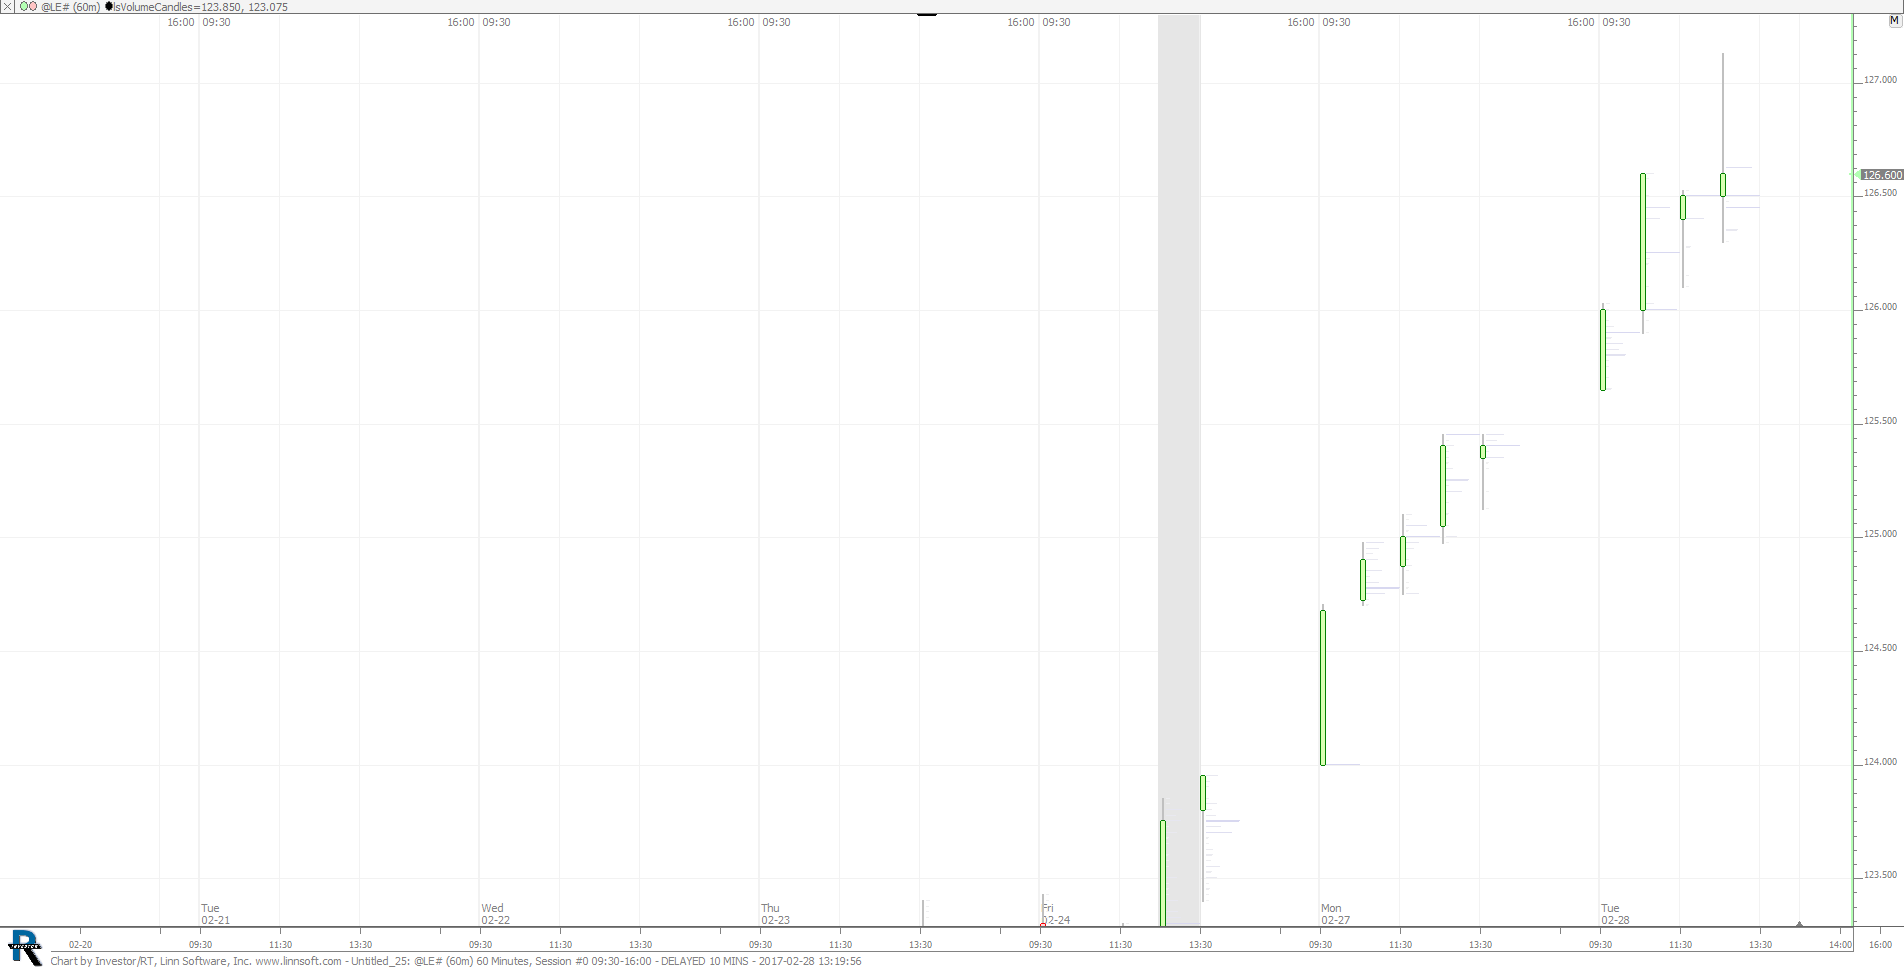 |
Untitled 25 (@LE#) scooke [totalcount]
9 years 5 months ago
This chart was uploaded by Investor/RT 12.7.1 showing symbol: @LE#. |
View |
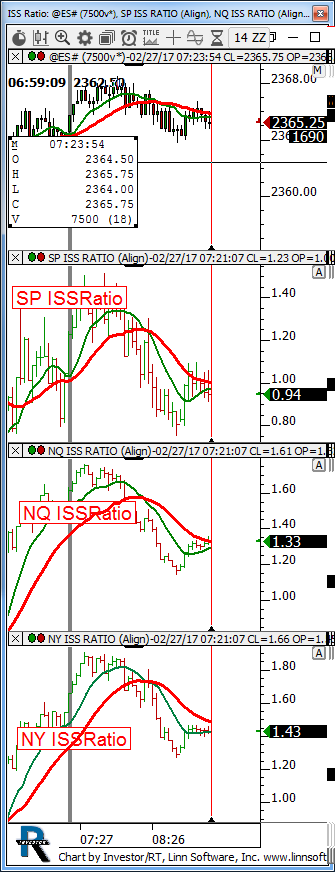 |
ISS Ratio (@ES#) kencassorla [totalcount]
9 years 5 months ago
ISS Ratio. This chart was uploaded by Investor/RT 12.6.8 showing symbol: @ES#. |
View |
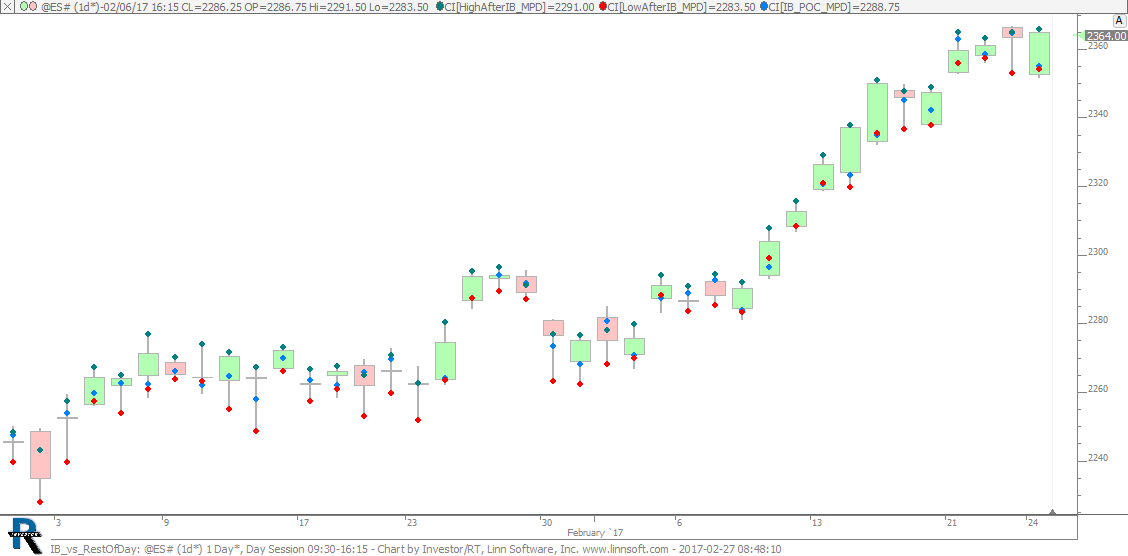 |
IB vs RestOfDay (@ES#) cpayne [totalcount]
9 years 5 months ago
Red Dot = IB POC. This chart was uploaded by Investor/RT 12.7.1 showing symbol: @ES#. |
View |
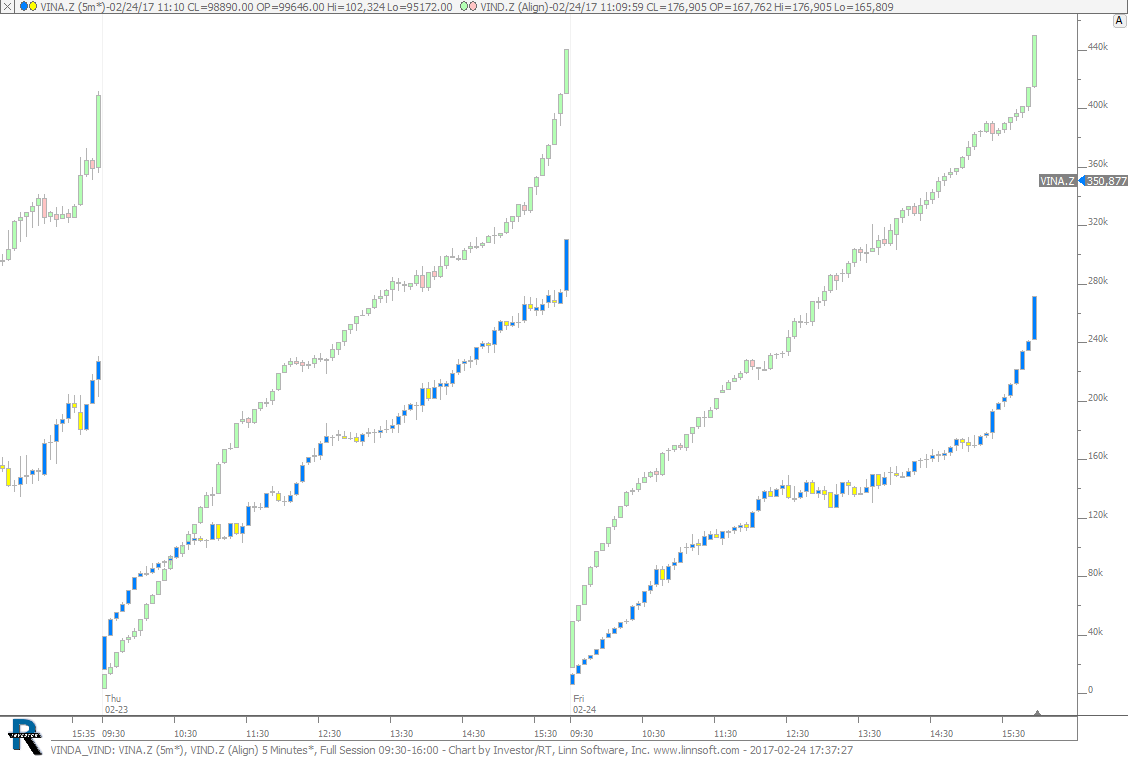 |
VINDA VIND (VINA.Z) cpayne [totalcount]
9 years 5 months ago
VIND VIND. This chart was uploaded by Investor/RT 12.7.1 showing symbol: VINA.Z. |
View |
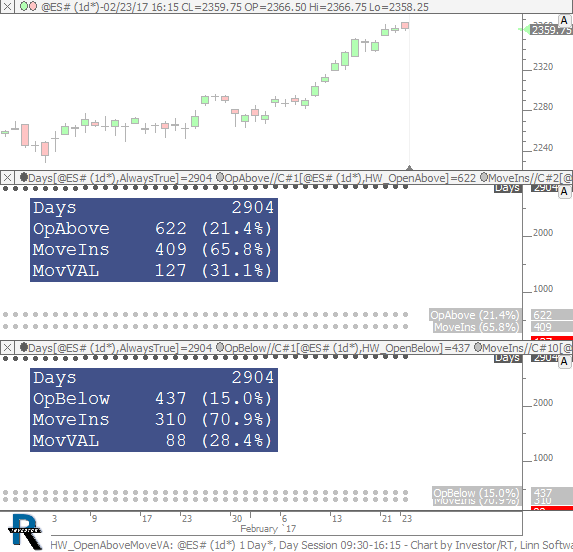 |
HW OpenAboveMoveVA (@ES#) cpayne [totalcount]
9 years 5 months ago
Open Above - Move Inside - Move VAL. This chart was uploaded by Investor/RT 12.7.1 showing symbol: @ES#. |
View |
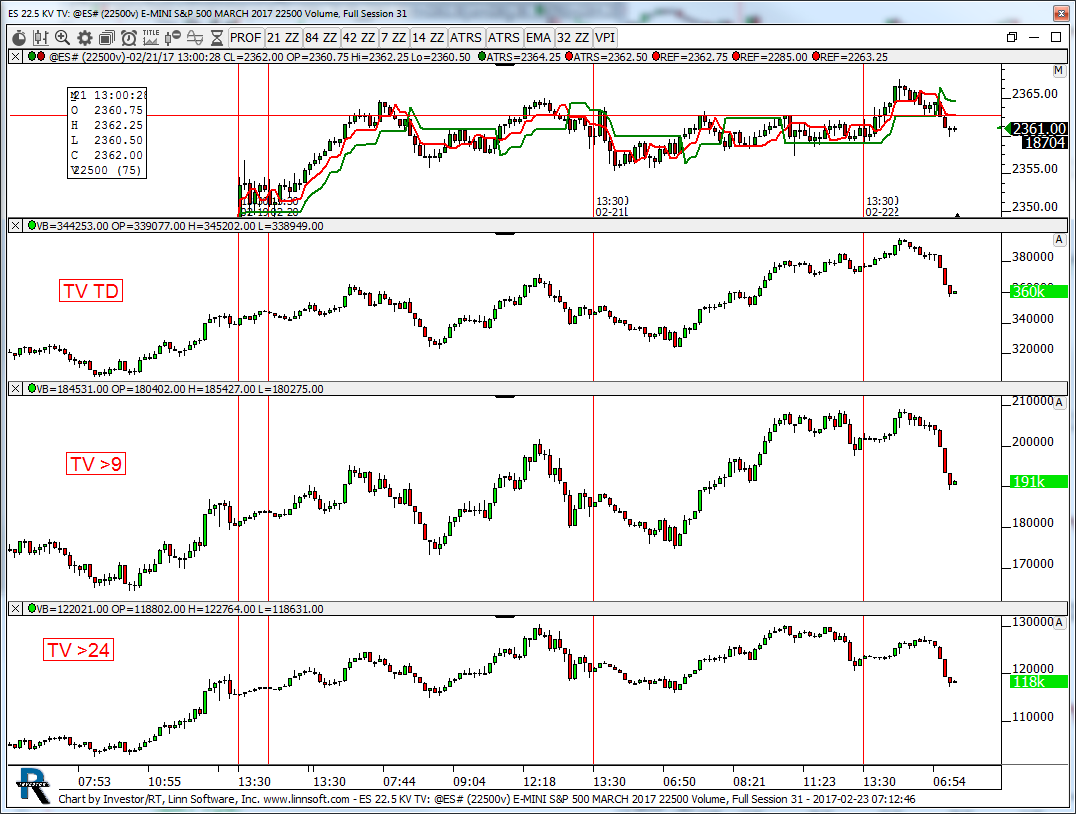 |
ES 225 KV TV (@ES#) kencassorla [totalcount]
9 years 5 months ago
es 22.5 KV. This chart was uploaded by Investor/RT 12.6.8 showing symbol: @ES#. |
View |
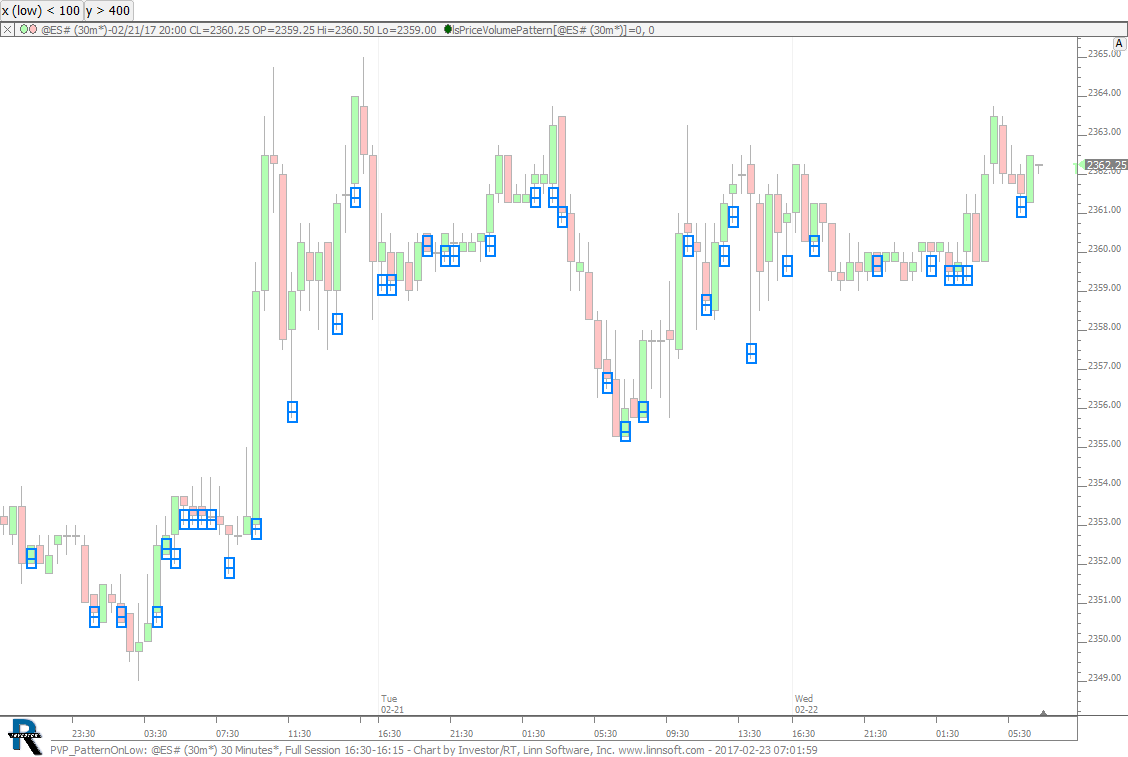 |
PVP PatternOnLow (@ES#) cpayne [totalcount]
9 years 5 months ago
PVP - Pattern on Low - volume of low < x and volume of price above low > y. This chart was uploaded by Investor/RT 12.7.1 showing symbol: @ES#. |
View |
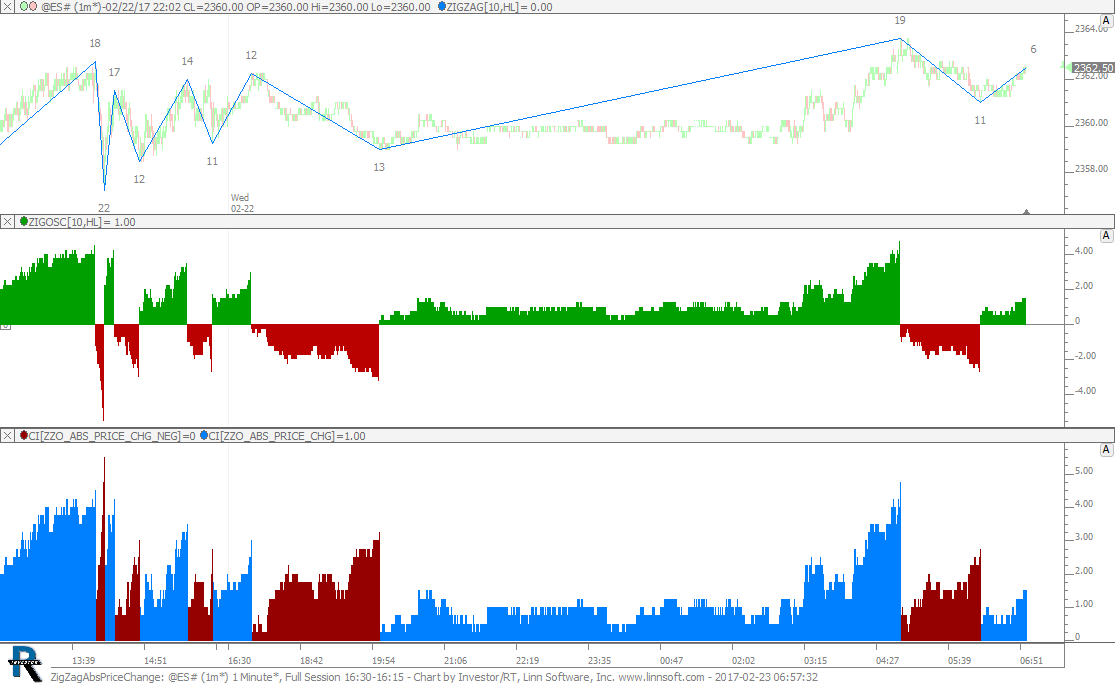 |
ZigZagAbsPriceChange (@ES#) cpayne [totalcount]
9 years 5 months ago
Zig Zag - Absolute Value of Price Change. This chart was uploaded by Investor/RT 12.7.1 showing symbol: @ES#. |
View |
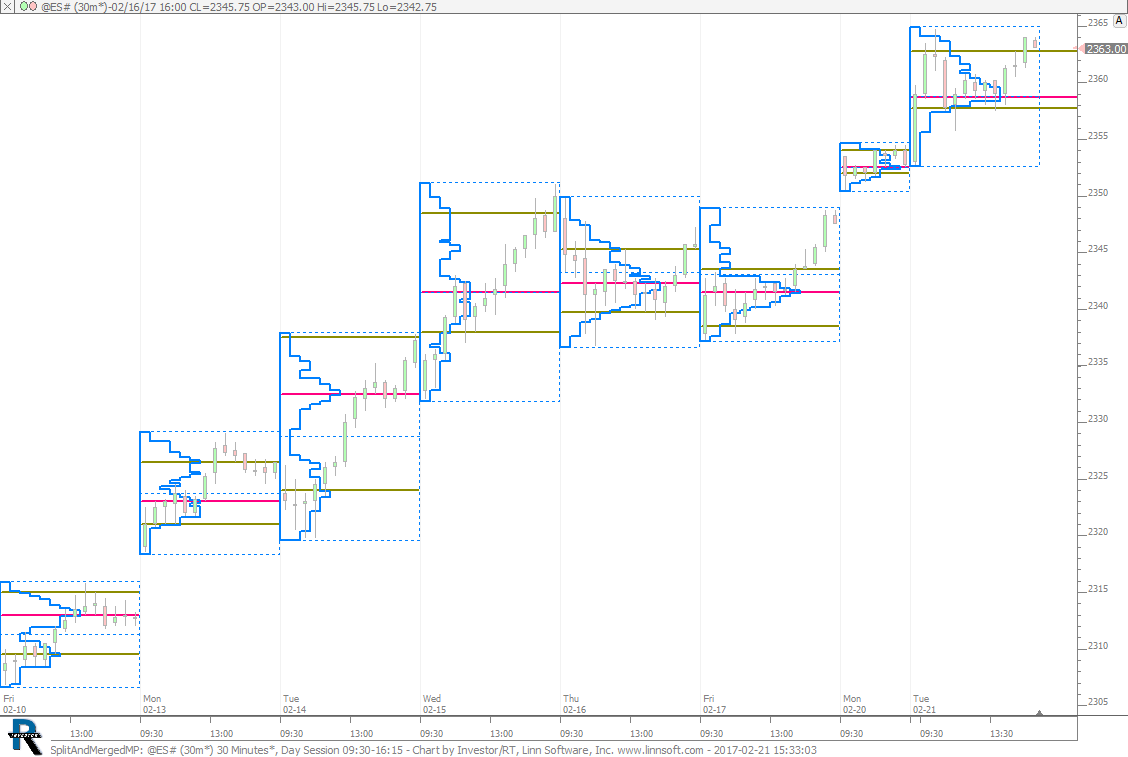 |
SplitAndMergedMP (@ES#) cpayne [totalcount]
9 years 5 months ago
This chart was uploaded by Investor/RT 12.7.1 showing symbol: @ES#. |
View |
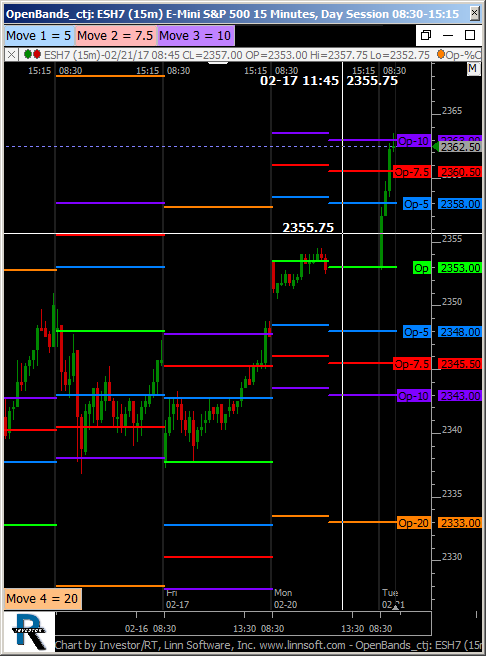 |
OpenBands ctj (ESH7) ctj0601 [totalcount]
9 years 5 months ago
This chart was uploaded by Investor/RT 12.7.1 showing symbol: ESH7. |
View |
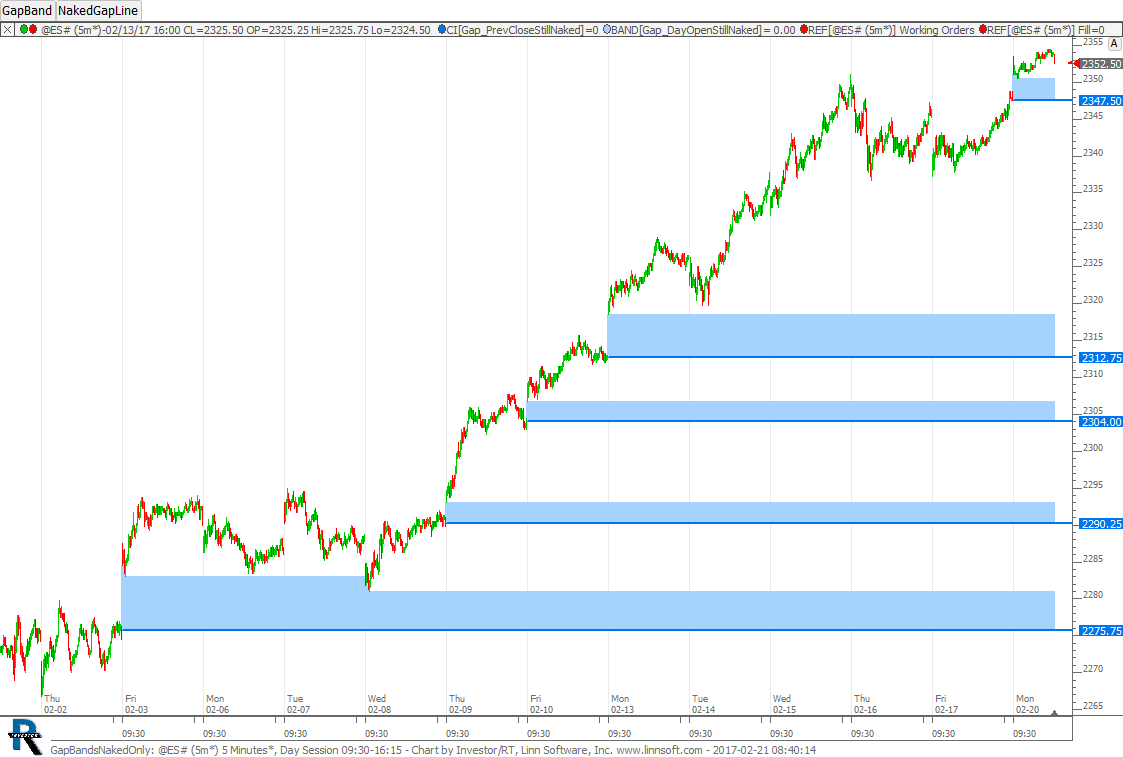 |
GapBandsNakedOnly (@ES#) cpayne [totalcount]
9 years 5 months ago
Gaps between sessions extended while naked and only shows the bands that are STILL naked. |
View |
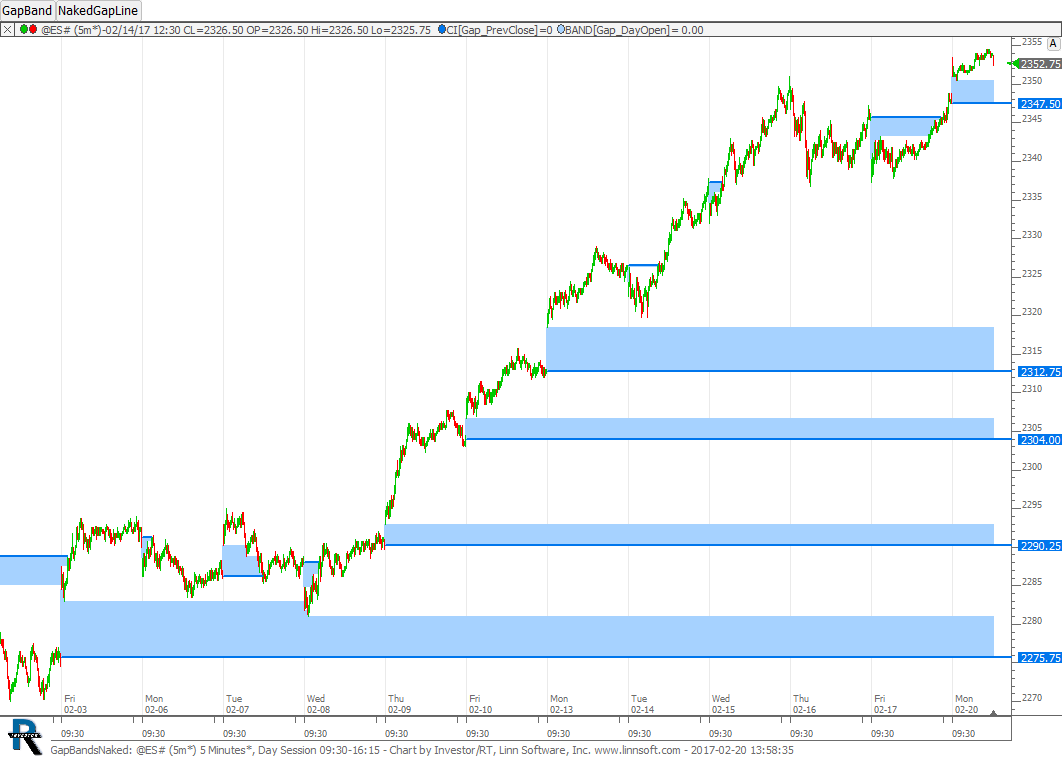 |
GapBandsNaked (@ES#) cpayne [totalcount]
9 years 5 months ago
Naked Gap Bands - Extends the gap between sessions until filled. This chart was uploaded by Investor/RT 12.7.1 showing symbol: @ES#. |
View |
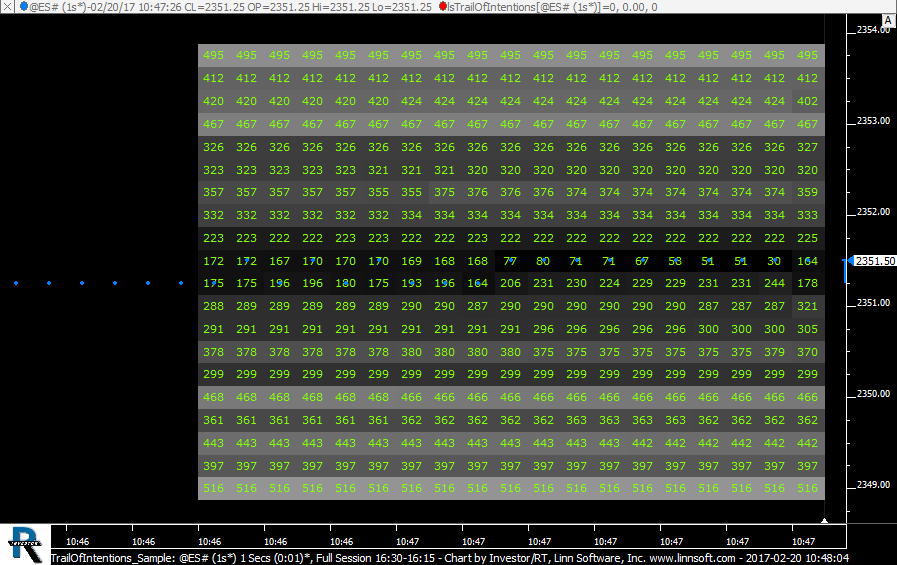 |
TrailOfIntentions Sample (@ES#) cpayne [totalcount]
9 years 5 months ago
TINT Sample. This chart was uploaded by Investor/RT 12.7.1 showing symbol: @ES#. |
View |
 |
Untitled (ESH7) ctj0601 [totalcount]
9 years 5 months ago
how to maximize price stats update speed?. This chart was uploaded by Investor/RT 12.6.9 showing symbol: ESH7. |
View |
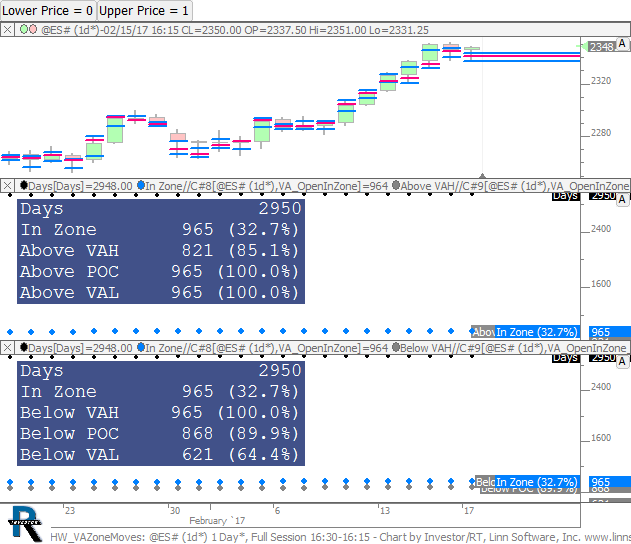 |
HW VAZoneMoves (@ES#) cpayne [totalcount]
9 years 5 months ago
Value Area Zone Move Analysis. This chart was uploaded by Investor/RT 12.7.1 showing symbol: @ES#. |
View |