 |
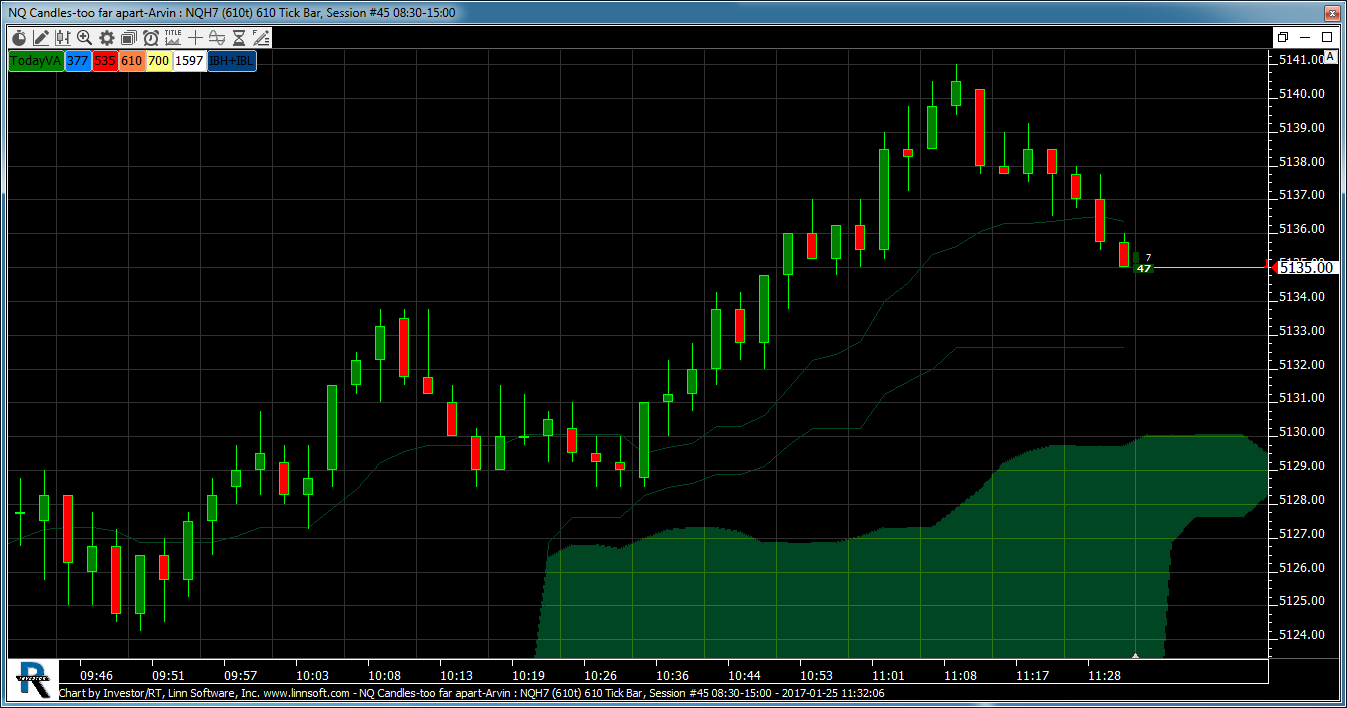
NQ Candles too far apart Arvin (NQH7) arvins [totalcount]
9 years 6 months ago
NQ Candles at 24:10 want Bars much closer together. This chart was uploaded by Investor/RT 12.6.9 showing symbol: NQH7. |
View |
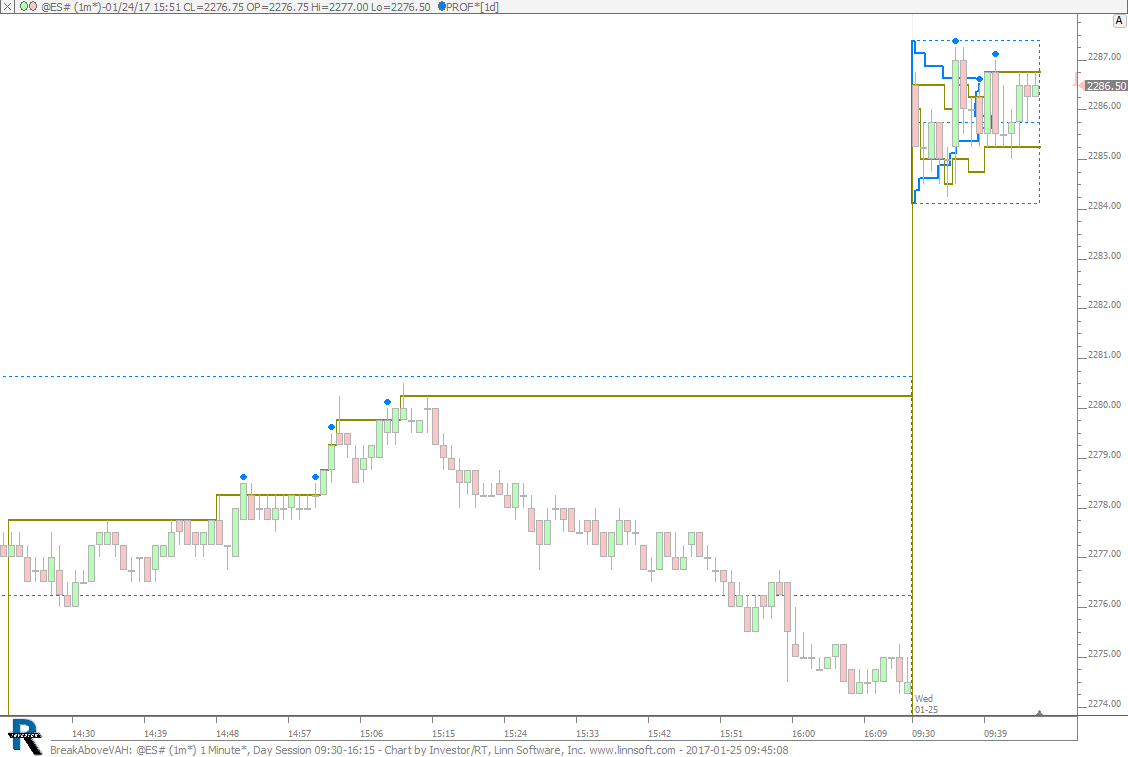 |
BreakAboveVAH (@ES#) cpayne [totalcount]
9 years 6 months ago
Break Above VAH. This chart was uploaded by Investor/RT 12.7.1 showing symbol: @ES#. |
View |
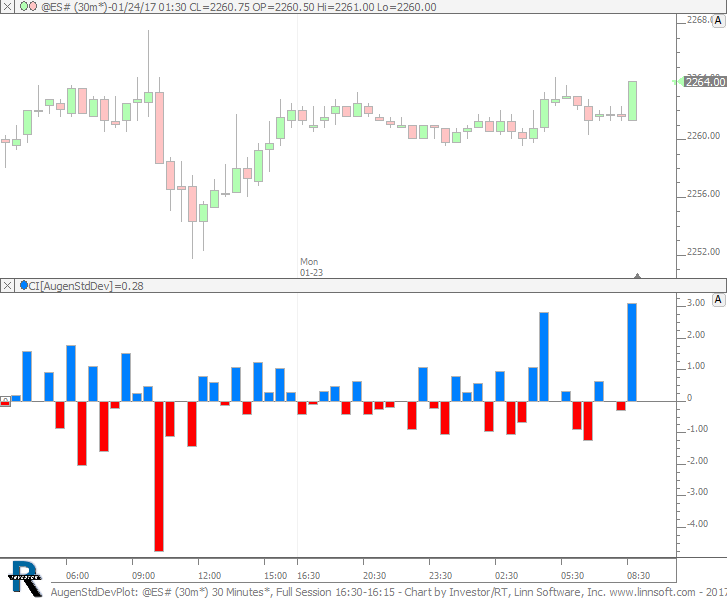 |
AugenStdDevPlot (@ES#) cpayne [totalcount]
9 years 6 months ago
Augen Standard Deviation Plot. This chart was uploaded by Investor/RT 12.7.1 showing symbol: @ES#. |
View |
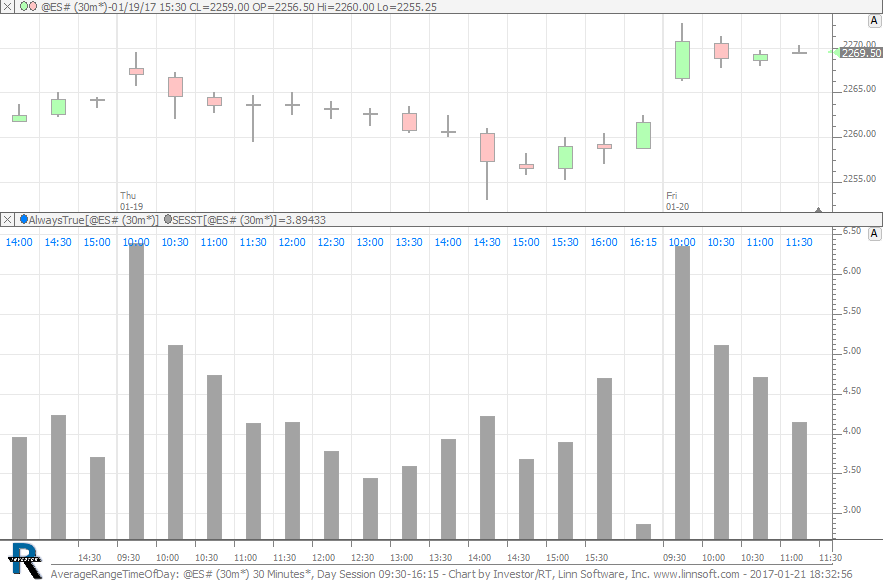 |
AverageRangeTimeOfDay (@ES#) cpayne [totalcount]
9 years 6 months ago
Average Range - Time of Day. This chart was uploaded by Investor/RT 12.7.1 showing symbol: @ES#. |
View |
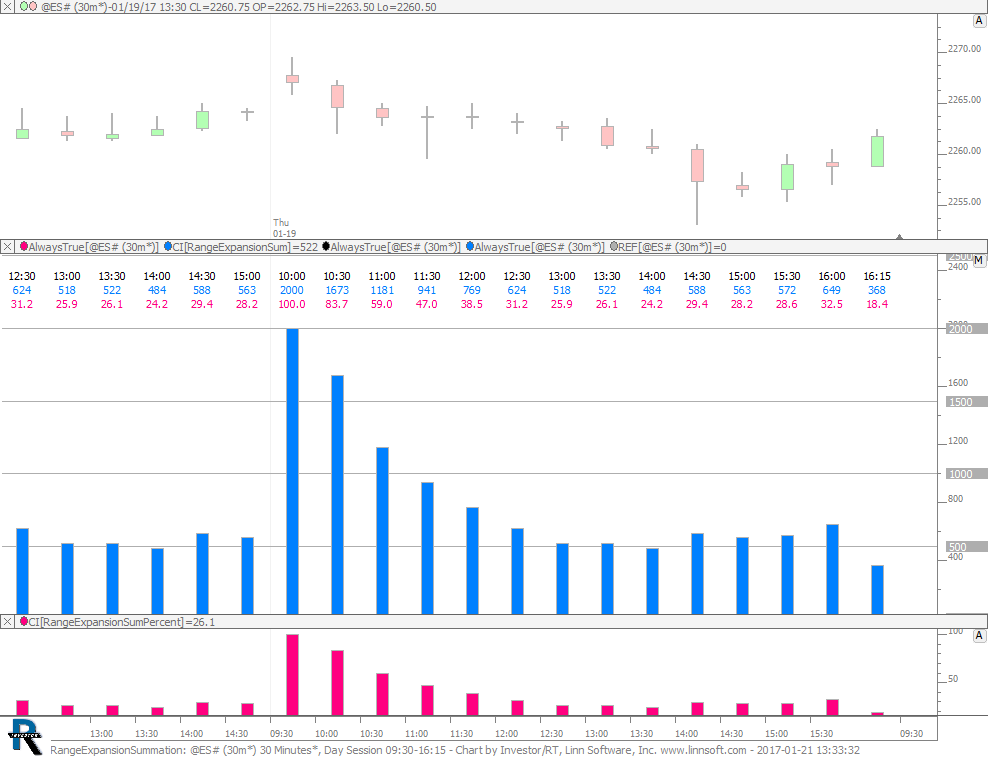 |
RangeExpansionSummation (@ES#) cpayne [totalcount]
9 years 6 months ago
Range Expansion Summation. This chart was uploaded by Investor/RT 12.7.1 showing symbol: @ES#. |
View |
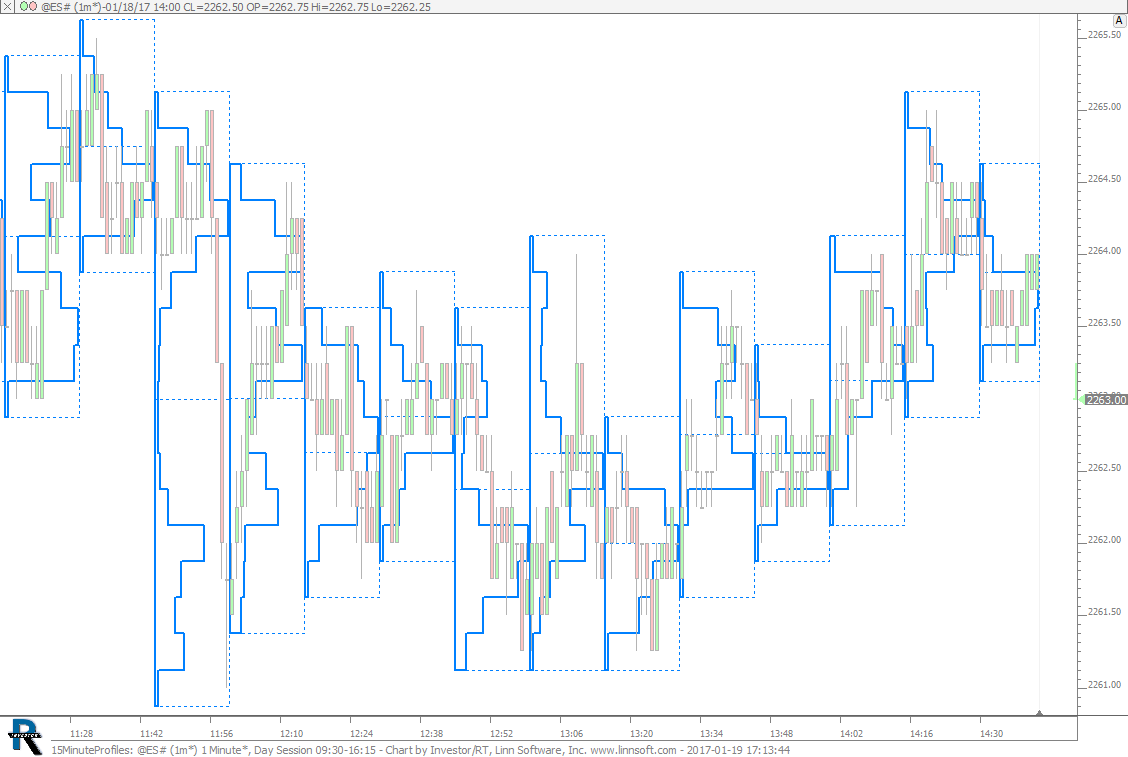 |
15MinuteProfiles (@ES#) cpayne [totalcount]
9 years 6 months ago
15 Minute Profiles. This chart was uploaded by Investor/RT 12.7.1 showing symbol: @ES#. |
View |
 |
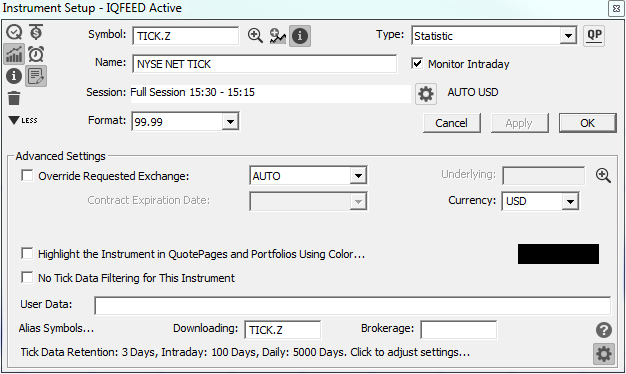
Instrument Setup IQFEED Activ 2 jcreadon [totalcount]
9 years 6 months ago
This chart was uploaded by Investor/RT 12.6.8. |
View |
 |
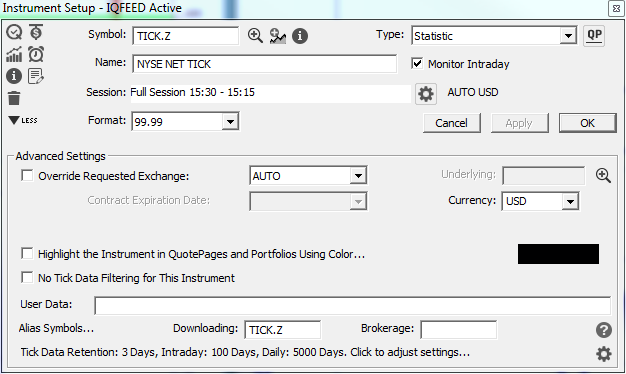
Instrument Setup IQFEED Activ jcreadon [totalcount]
9 years 6 months ago
This chart was uploaded by Investor/RT 12.6.8. |
View |
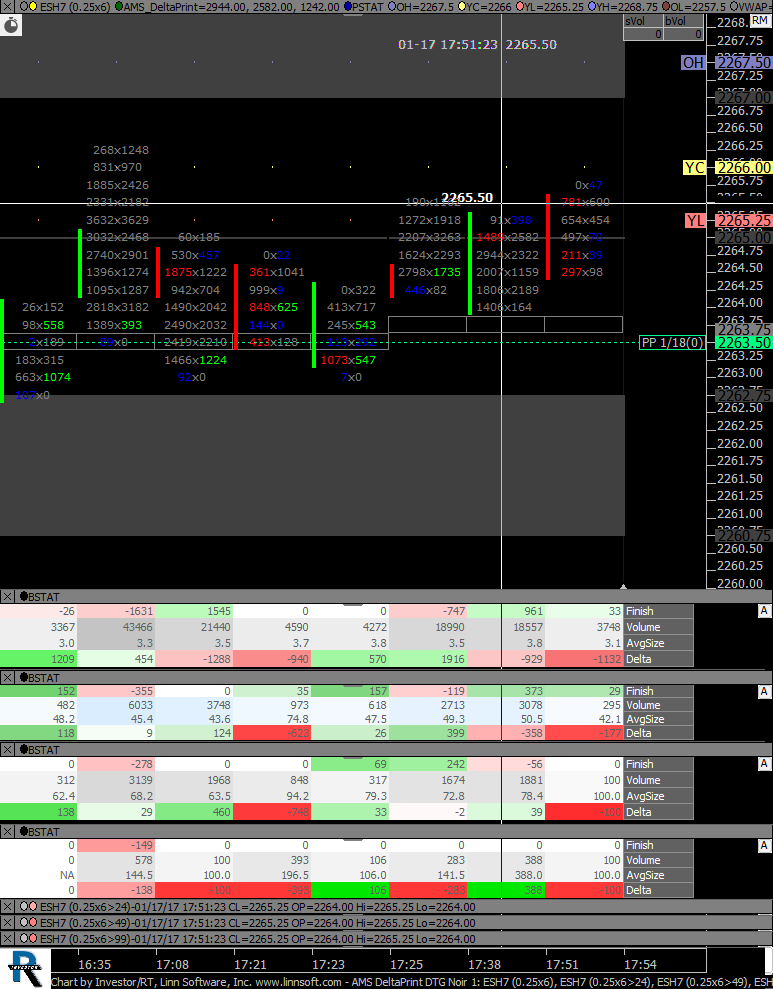 |
AMS DeltaPrint DTG Noir 1 (ESH7) Stumpy68 [totalcount]
9 years 6 months ago
AMS DTG. This chart was uploaded by Investor/RT 12.7.1 showing symbol: ESH7. |
View |
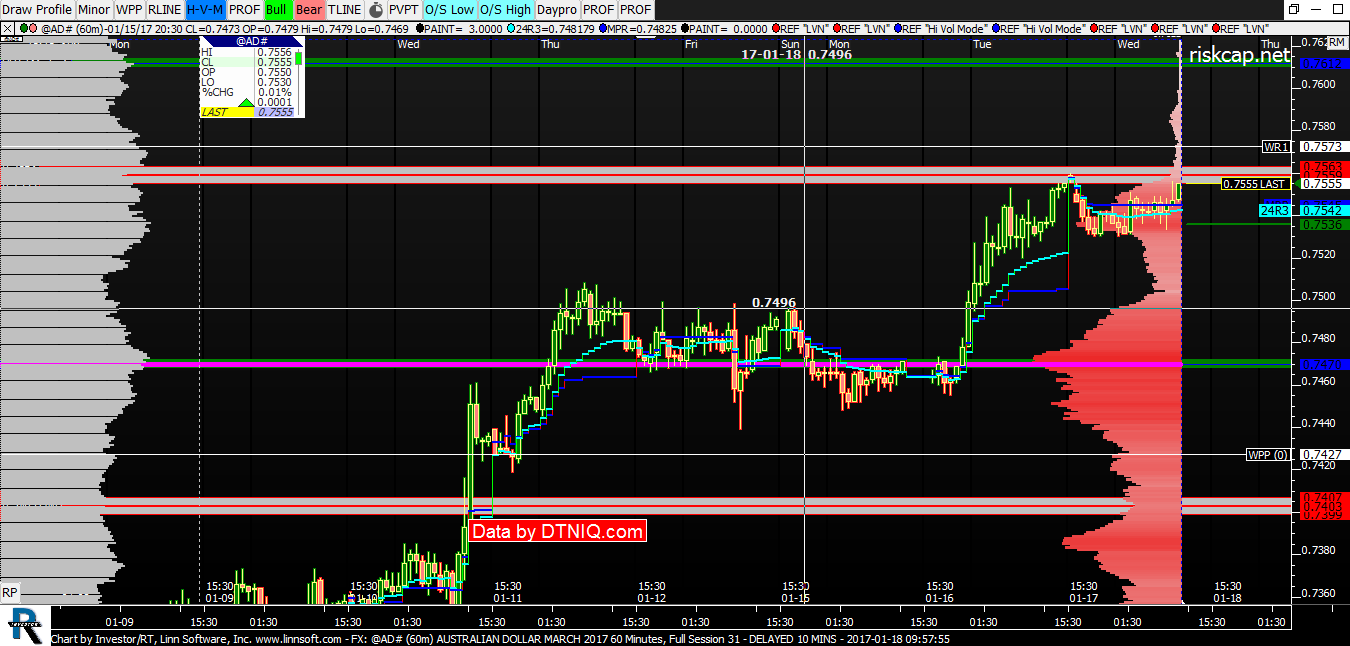 |
FX (@AD#) riskcap [totalcount]
9 years 6 months ago
AUD Levels AUDUSD Forex FX Futures USD. This chart was uploaded by Investor/RT 12.6.8 showing symbol: @AD#. |
View |
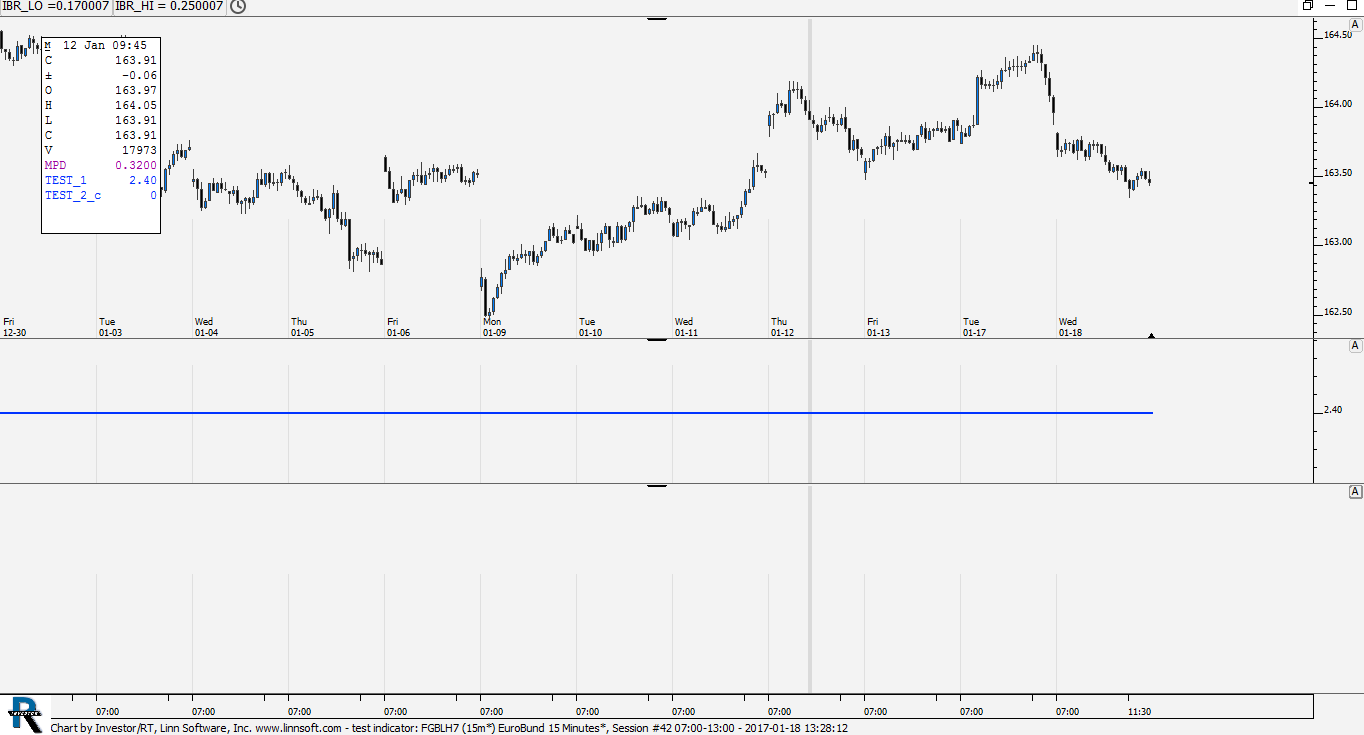 |
test indicator (FGBLH7) adrianfaiers [totalcount]
9 years 6 months ago
adeyf as per forum post. This chart was uploaded by Investor/RT 12.7.1 showing symbol: FGBLH7. |
View |
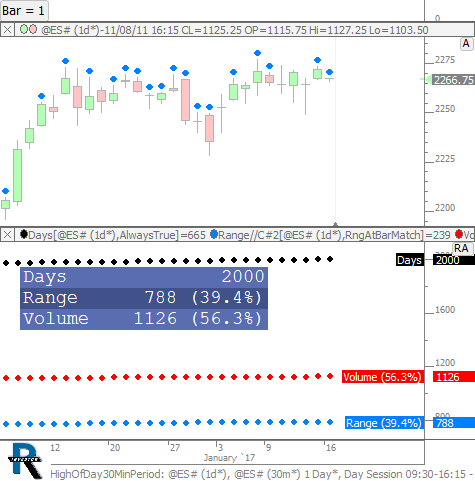 |
HighOfDay30MinPeriod (@ES#) cpayne [totalcount]
9 years 6 months ago
30 Minute Period with Max Range and Volume. This chart was uploaded by Investor/RT 12.7.1 showing symbol: @ES#. |
View |
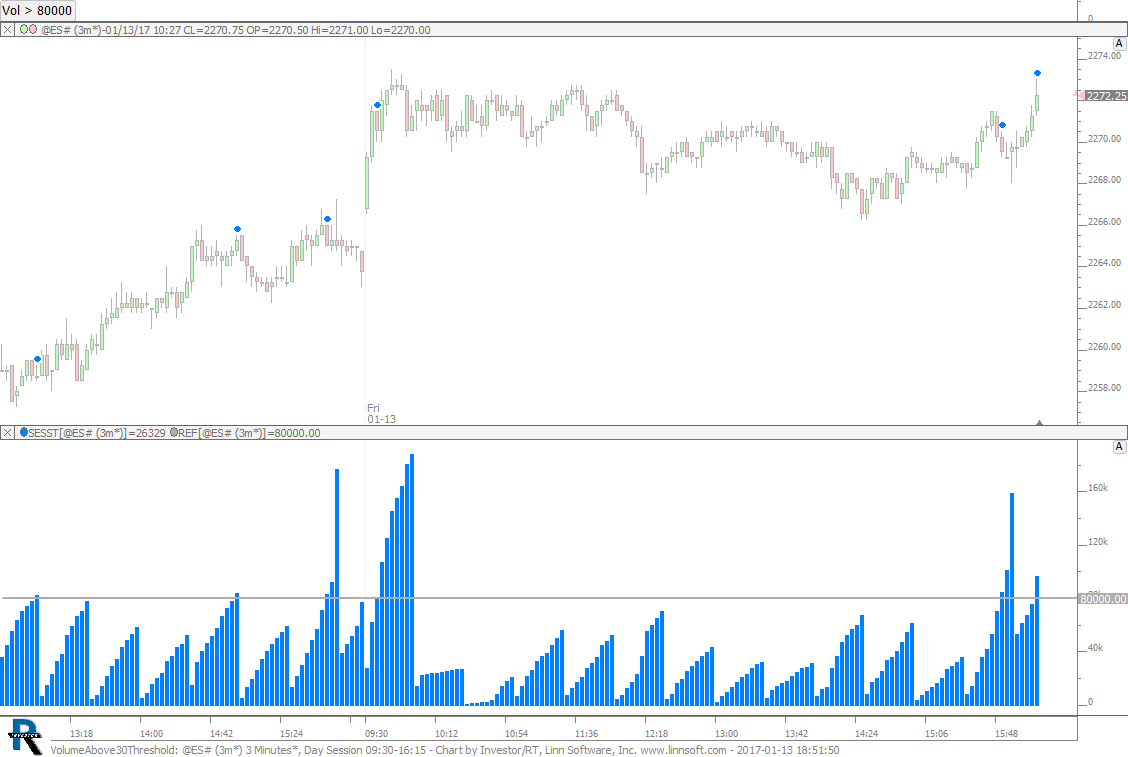 |
VolumeAbove30Threshold (@ES#) cpayne [totalcount]
9 years 6 months ago
Volume Above Threshold on 30 Minute Bars. This chart was uploaded by Investor/RT 12.7.1 showing symbol: @ES#. |
View |
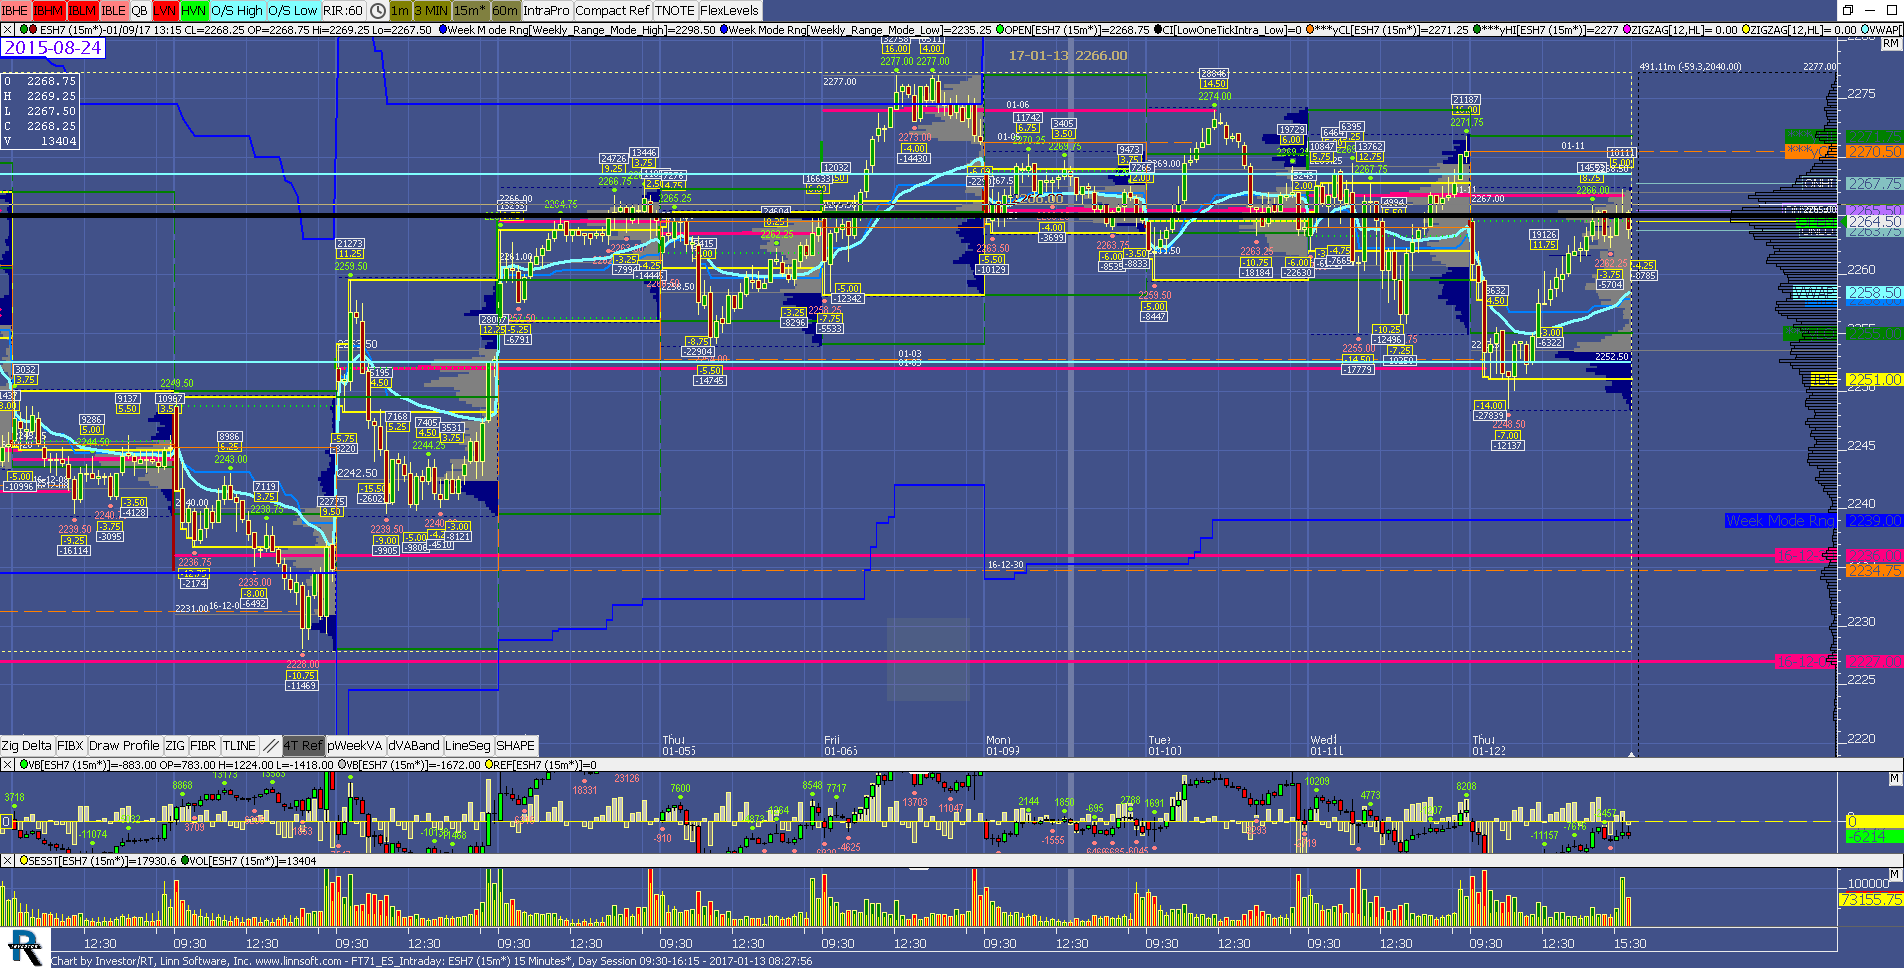 |
FT71 ES Intraday (ESH7) Food4Monkeys [totalcount]
9 years 6 months ago
After Download. This chart was uploaded by Investor/RT 12.7.1 showing symbol: ESH7. |
View |
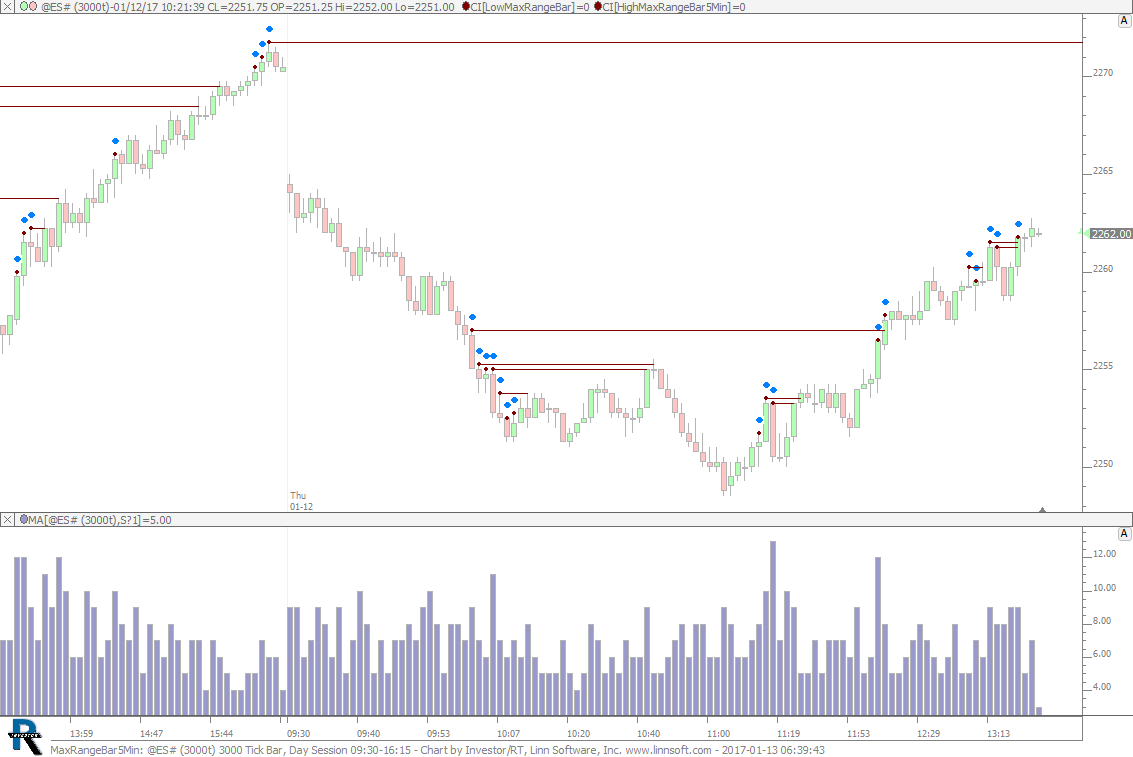 |
MaxRangeBar5Min (@ES#) cpayne [totalcount]
9 years 6 months ago
Max Range Bar - 5 Min. This chart was uploaded by Investor/RT 12.7.1 showing symbol: @ES#. |
View |
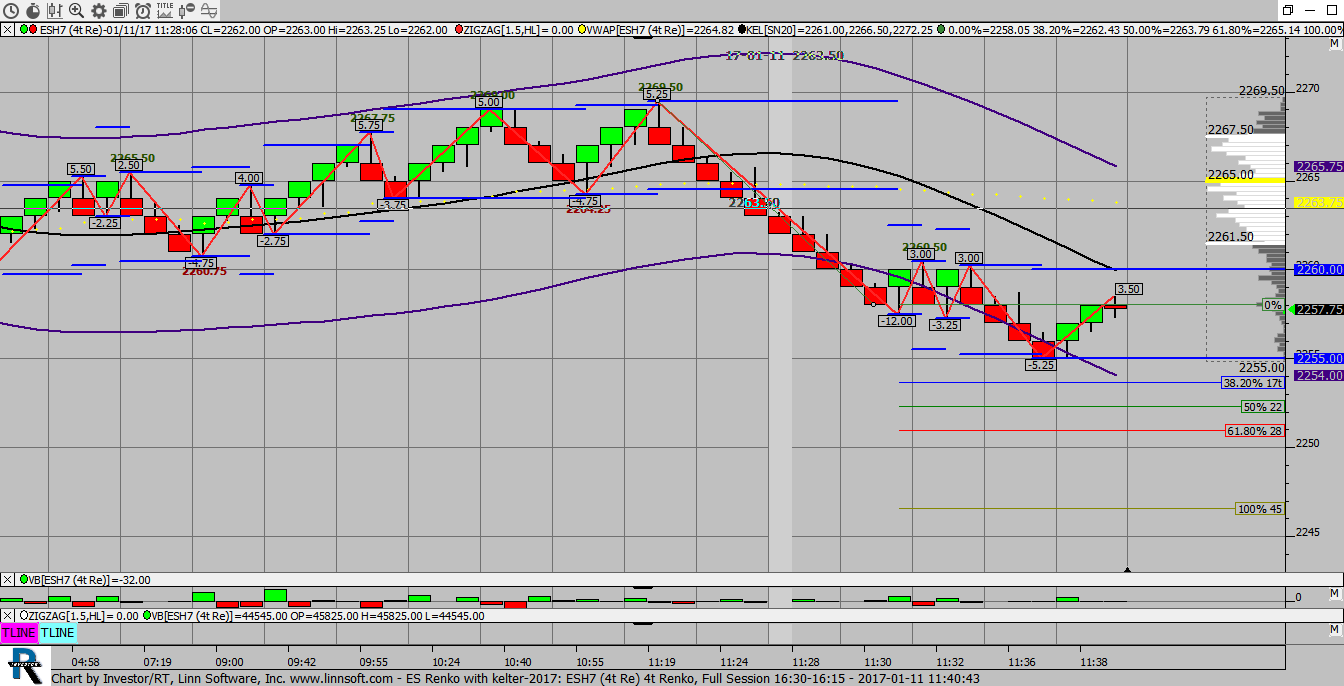 |
ES Renko with kelter (ESH7) Quantum Leap [totalcount]
9 years 6 months ago
This chart was uploaded by Investor/RT 12.6.9 showing symbol: ESH7. |
View |
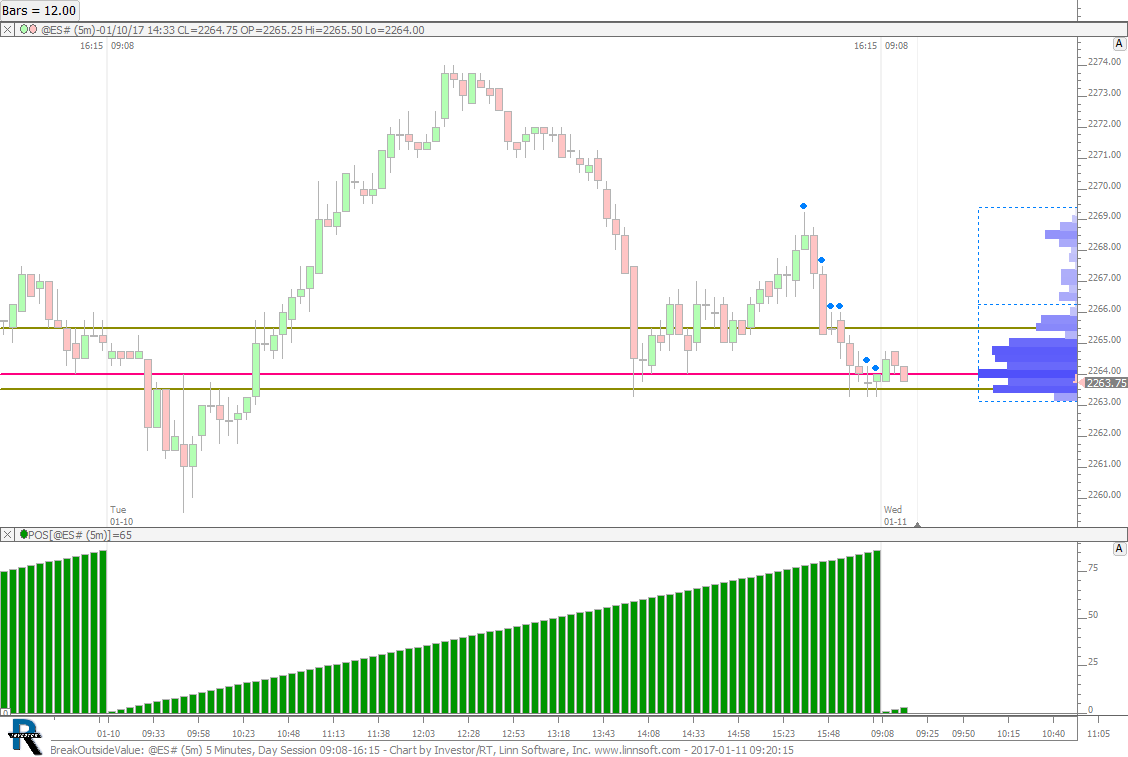 |
BreakOutsideValue (@ES#) cpayne [totalcount]
9 years 6 months ago
Price Breaking Outside of Value Area. This chart was uploaded by Investor/RT 12.7.1 showing symbol: @ES#. |
View |
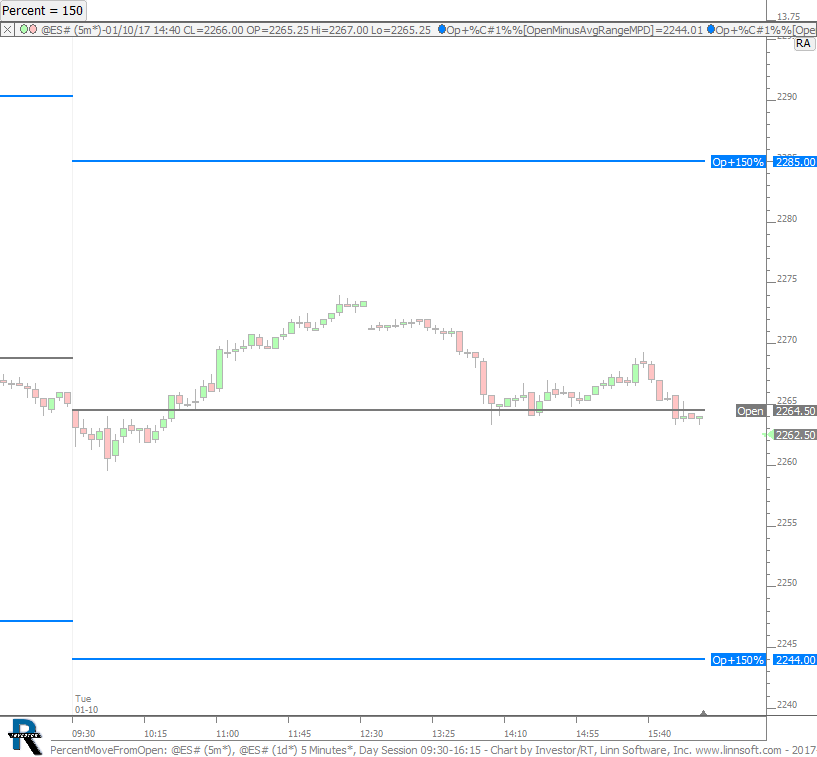 |
PercentMoveFromOpen (@ES#) cpayne [totalcount]
9 years 6 months ago
Open and Open Percent Bands. This chart was uploaded by Investor/RT 12.7.1 showing symbol: @ES#. |
View |
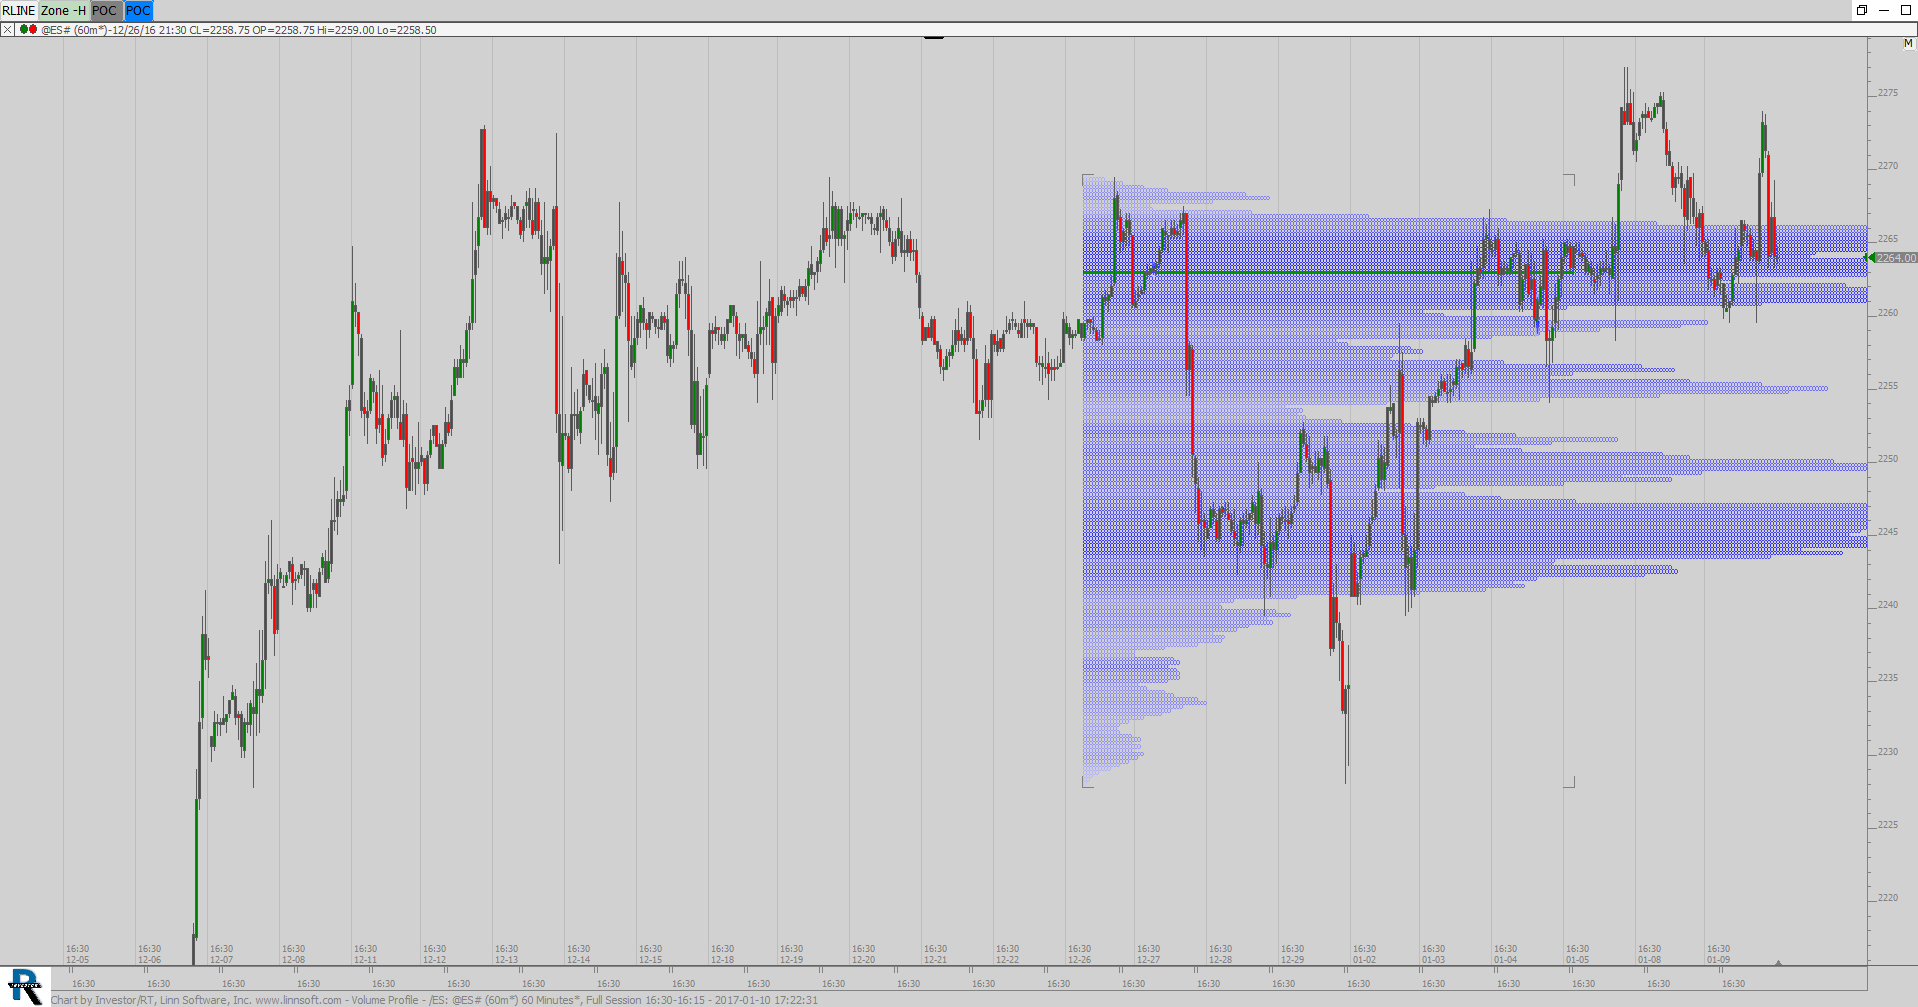 |
Volume Profile ES (@ES#) scooke [totalcount]
9 years 6 months ago
This chart was uploaded by Investor/RT 12.7.1 showing symbol: @ES#. |
View |
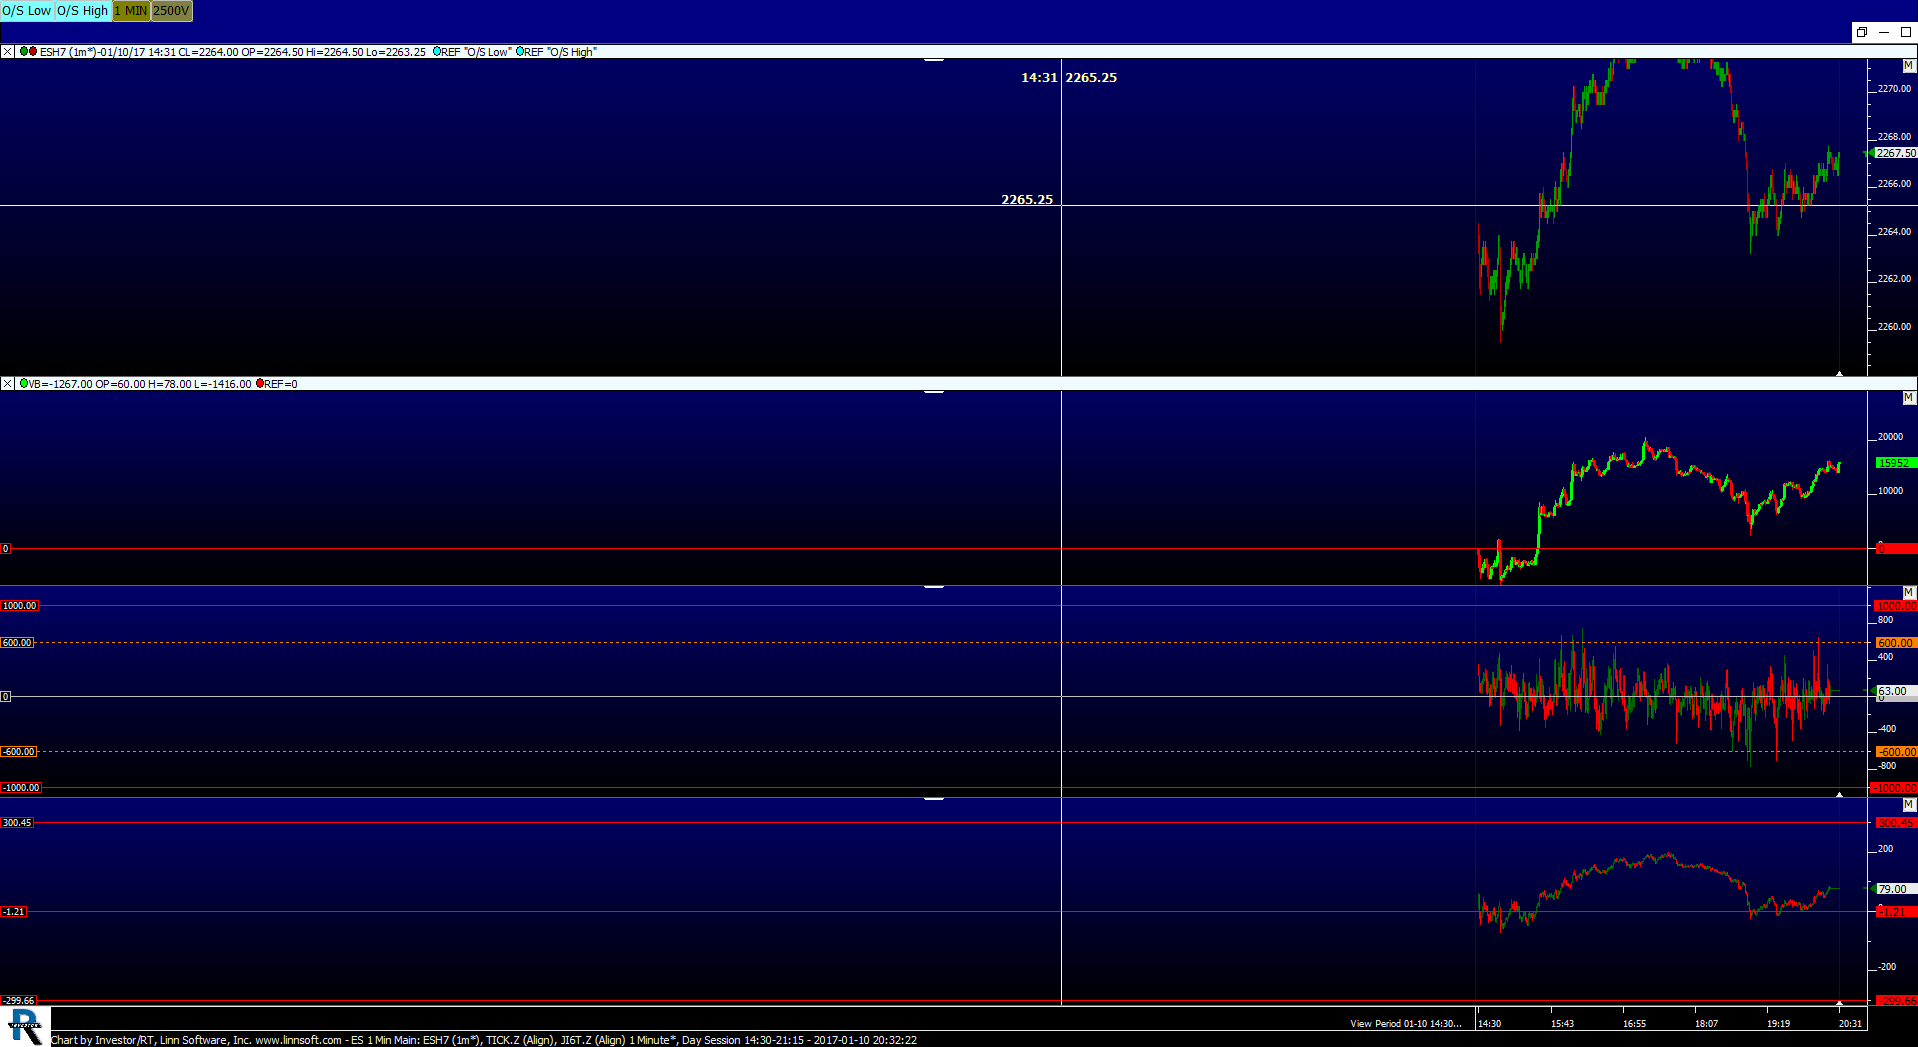 |
ES 1 Min Main (ESH7) Stumpy68 [totalcount]
9 years 6 months ago
ES 1 MIN. This chart was uploaded by Investor/RT 12.7.1 showing symbol: ESH7. |
View |
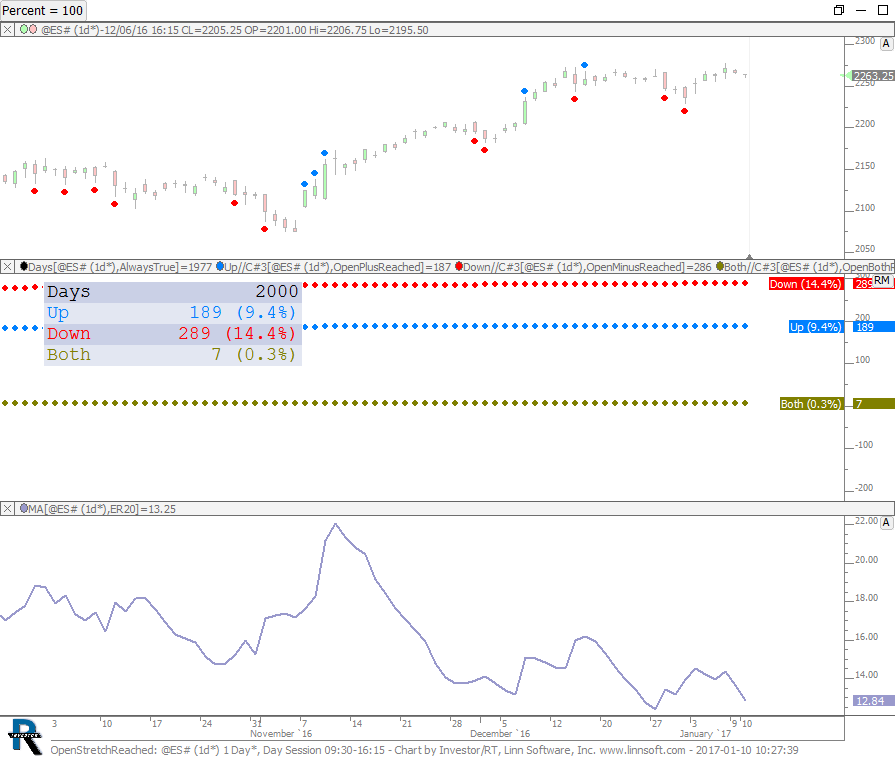 |
OpenStretchReached (@ES#) cpayne [totalcount]
9 years 6 months ago
Open Stretch - Moves from Open by Percent of Daily Range. This chart was uploaded by Investor/RT 12.7.1 showing symbol: @ES#. |
View |
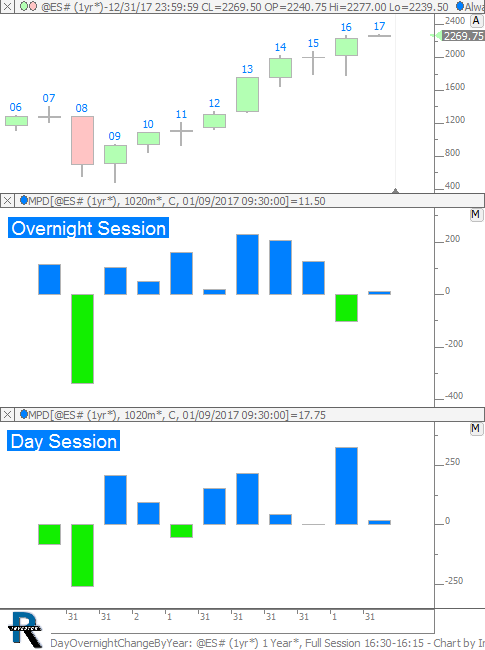 |
DayOvernightChangeByYear (@ES#) cpayne [totalcount]
9 years 6 months ago
Change of Year broken down by Day and Overnight Sessions. This chart was uploaded by Investor/RT 12.7.1 showing symbol: @ES#. |
View |
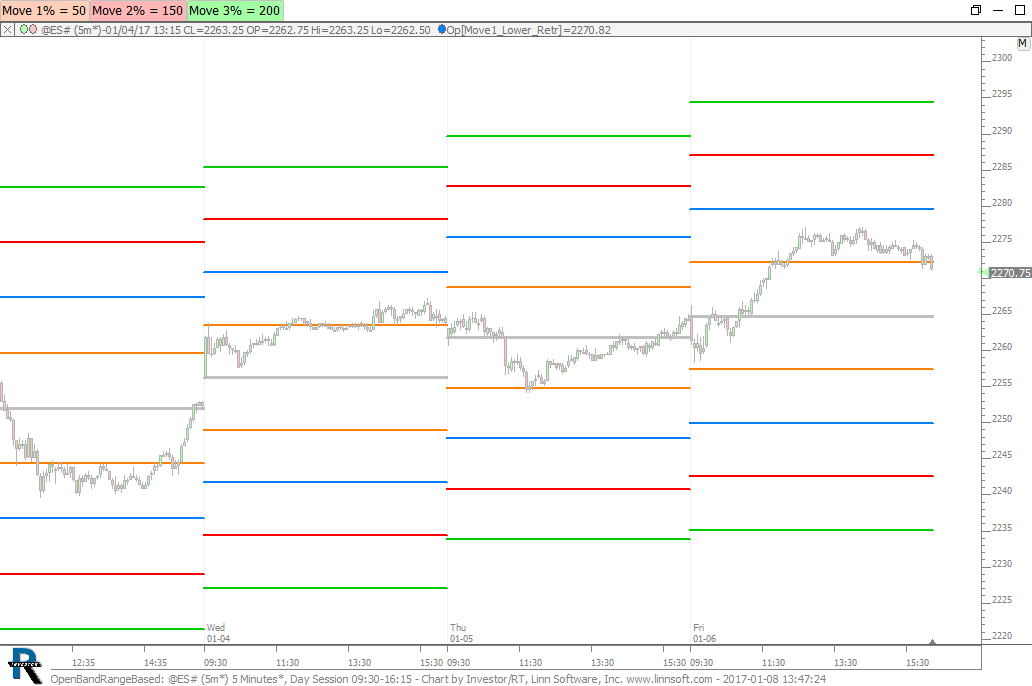 |
OpenBandRangeBased (@ES#) cpayne [totalcount]
9 years 6 months ago
Open Bands based on Percent of Average Daily Range. This chart was uploaded by Investor/RT 12.7.1 showing symbol: @ES#. |
View |
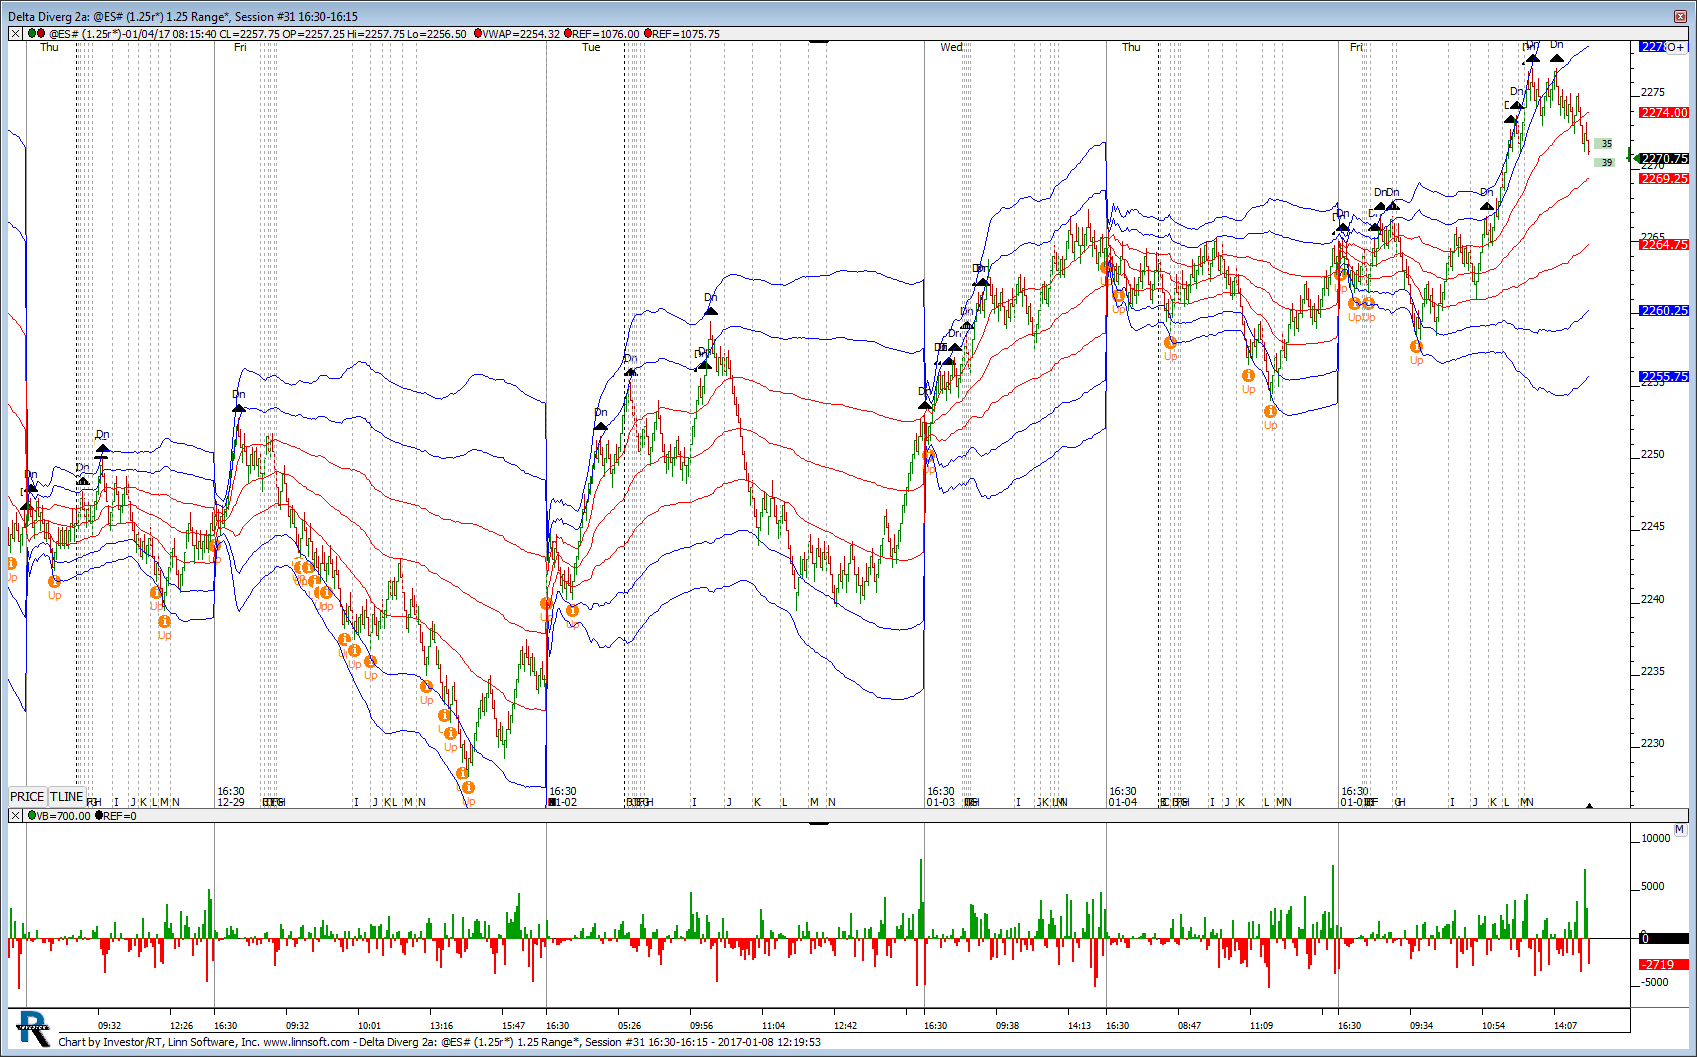 |
Delta Diverg 2a (@ES#) hsams1 [totalcount]
9 years 6 months ago
CURTIS. This chart was uploaded by Investor/RT 12.7.1 showing symbol: @ES#. |
View |
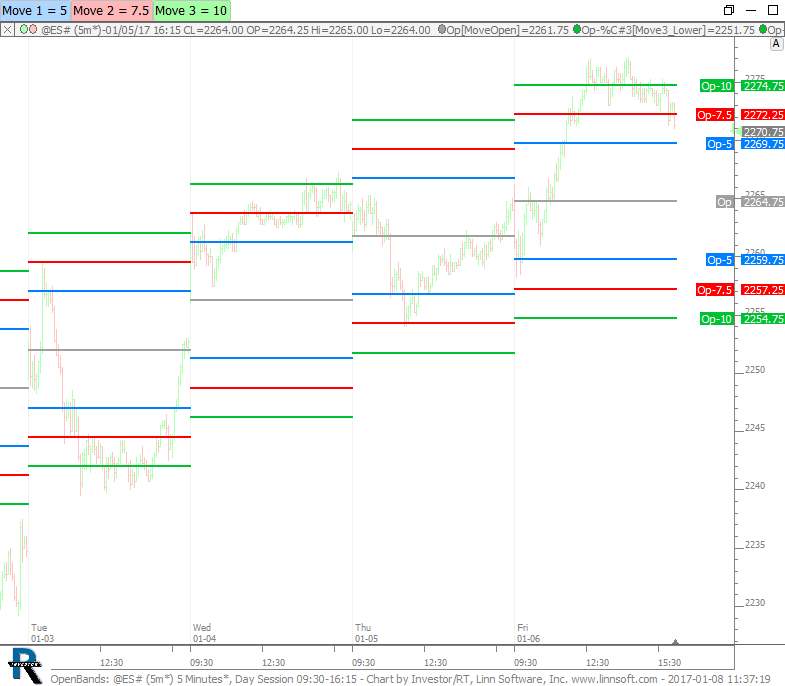 |
OpenBands (@ES#) cpayne [totalcount]
9 years 6 months ago
Measured bands from open. Control move magnitude with buttons. This chart was uploaded by Investor/RT 12.7.1 showing symbol: @ES#. |
View |