 |
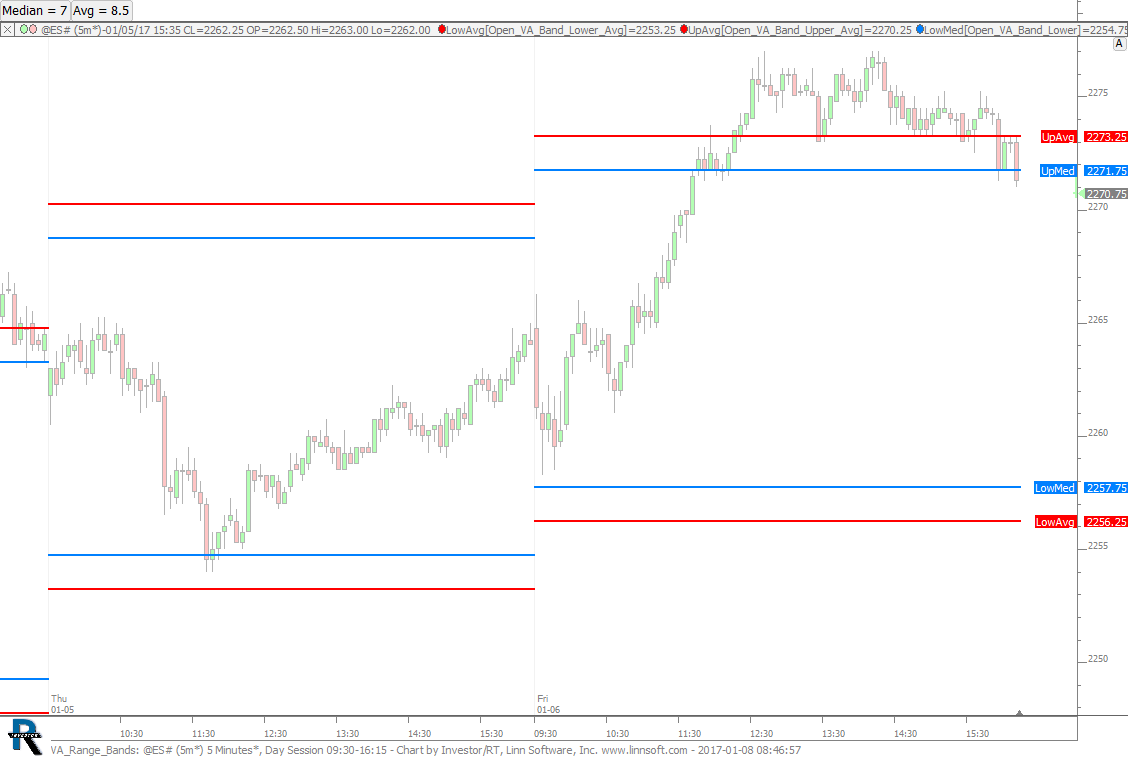
VA Range Bands (@ES#) cpayne [totalcount]
9 years 6 months ago
VA Range Bands. This chart was uploaded by Investor/RT 12.7.1 showing symbol: @ES#. |
View |
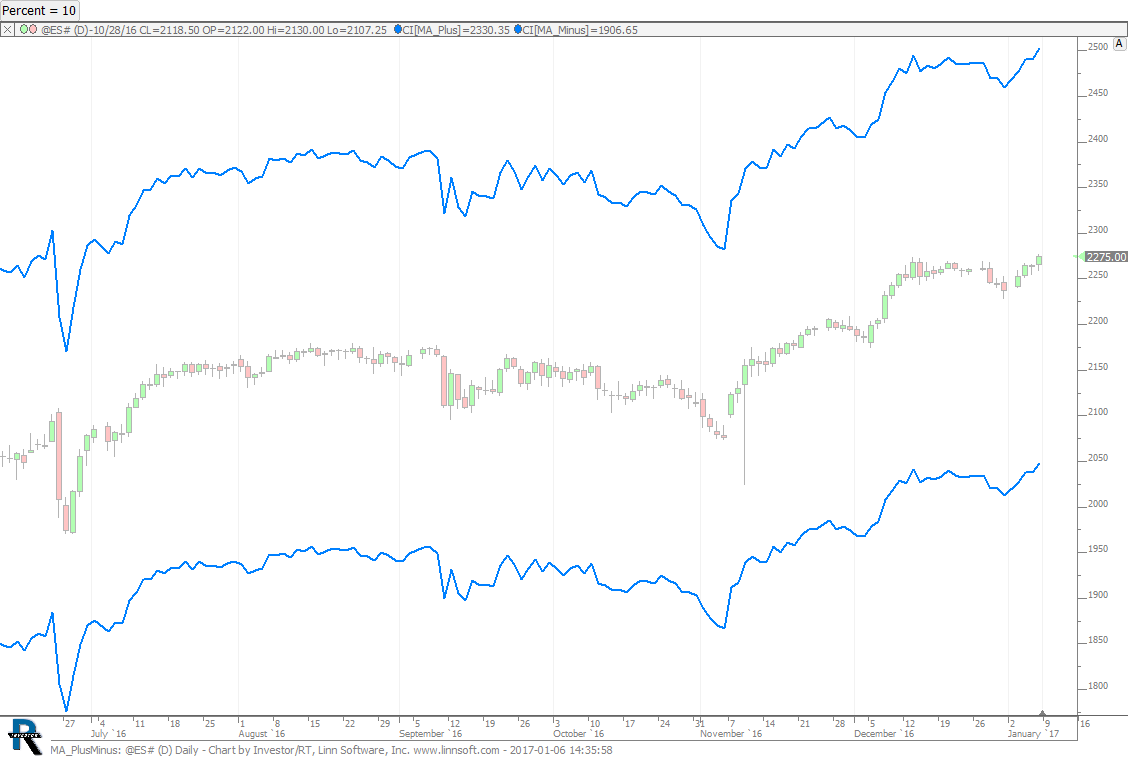 |
MA PlusMinus (@ES#) cpayne [totalcount]
9 years 6 months ago
Close Plus/Minus Percent. This chart was uploaded by Investor/RT 12.7.1 showing symbol: @ES#. |
View |
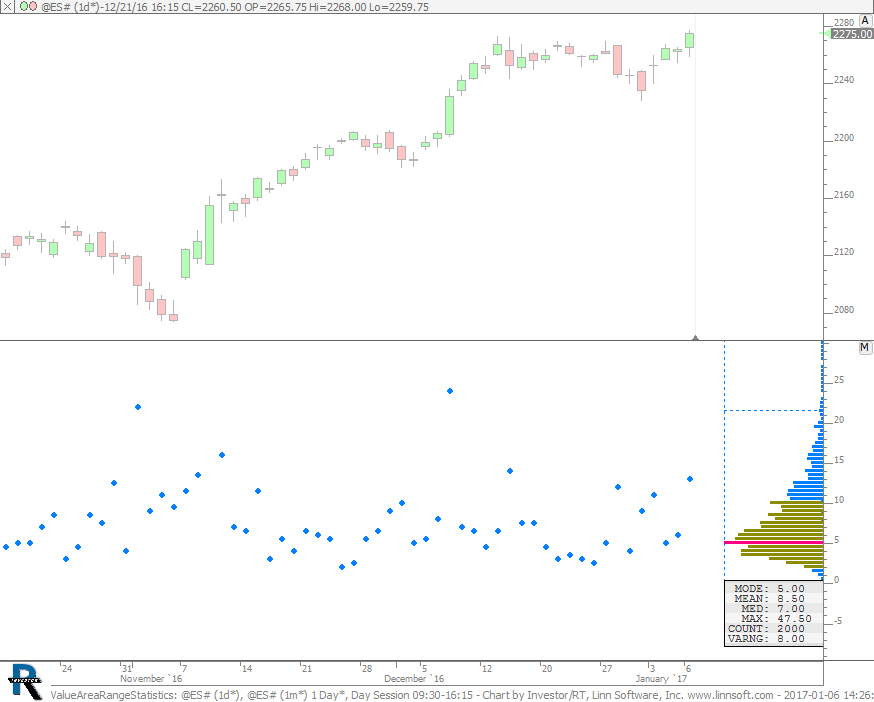 |
ValueAreaRangeStatistics (@ES#) cpayne [totalcount]
9 years 6 months ago
Value Area Range Statistics. This chart was uploaded by Investor/RT 12.7.1 showing symbol: @ES#. |
View |
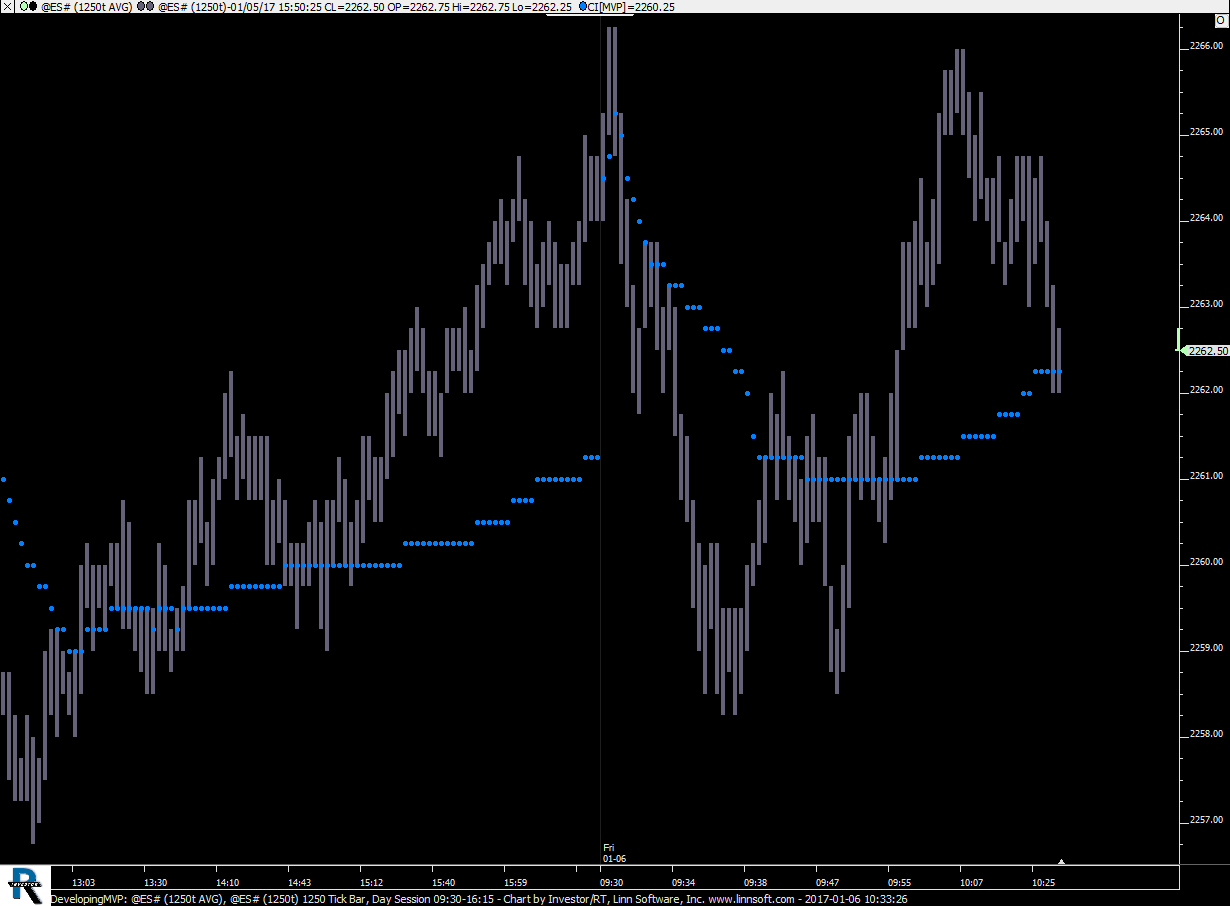 |
DevelopingMVP (@ES#) cpayne [totalcount]
9 years 6 months ago
Developing Mid Volume Price (Using Layered - Average Bars). This chart was uploaded by Investor/RT 12.7.1 showing symbol: @ES#. |
View |
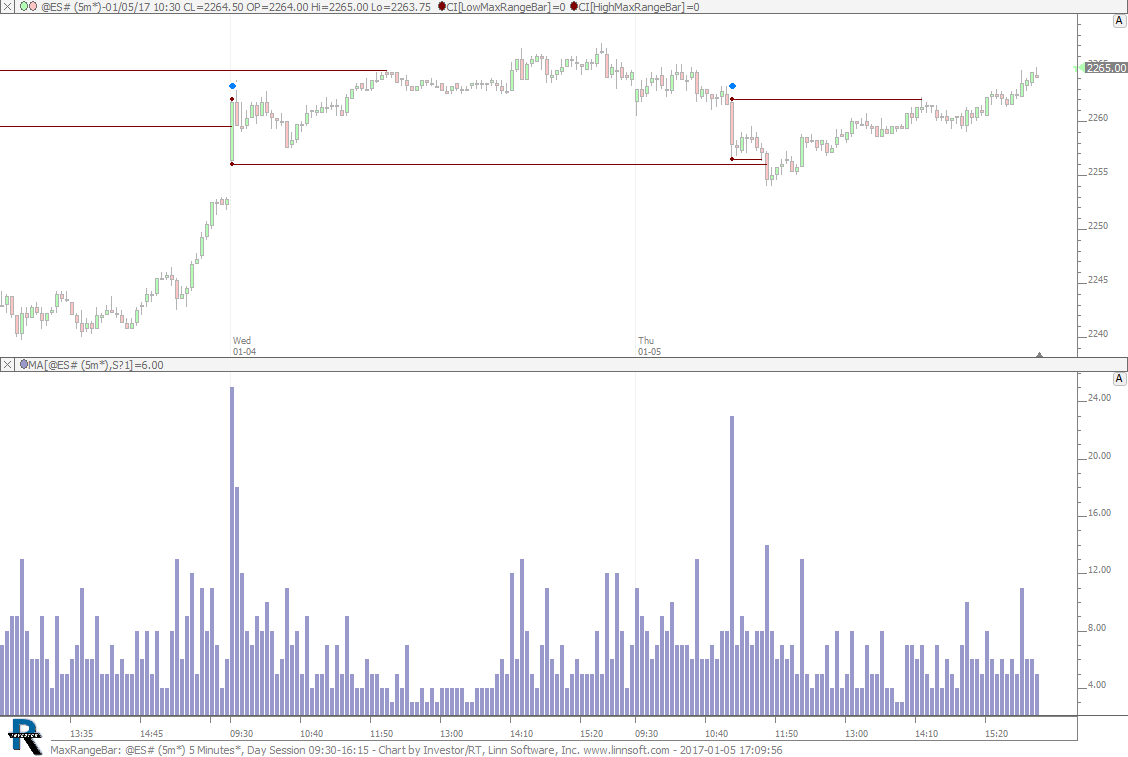 |
MaxRangeBar (@ES#) cpayne [totalcount]
9 years 6 months ago
Max Range Bar of Session. This chart was uploaded by Investor/RT 12.7.1 showing symbol: @ES#. |
View |
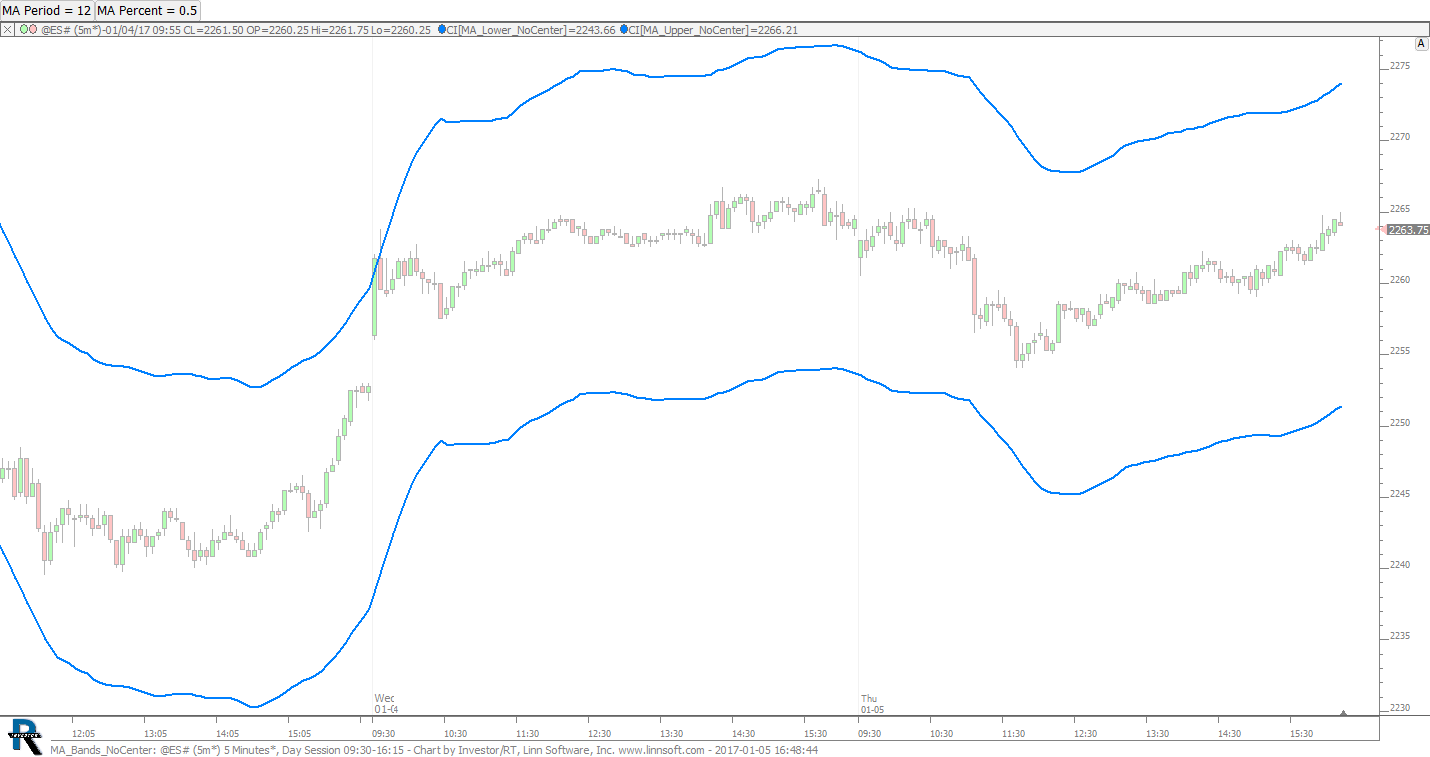 |
MA Bands NoCenter (@ES#) cpayne [totalcount]
9 years 6 months ago
Moving Average Percent Bands - No Center Band. This chart was uploaded by Investor/RT 12.7.1 showing symbol: @ES#. |
View |
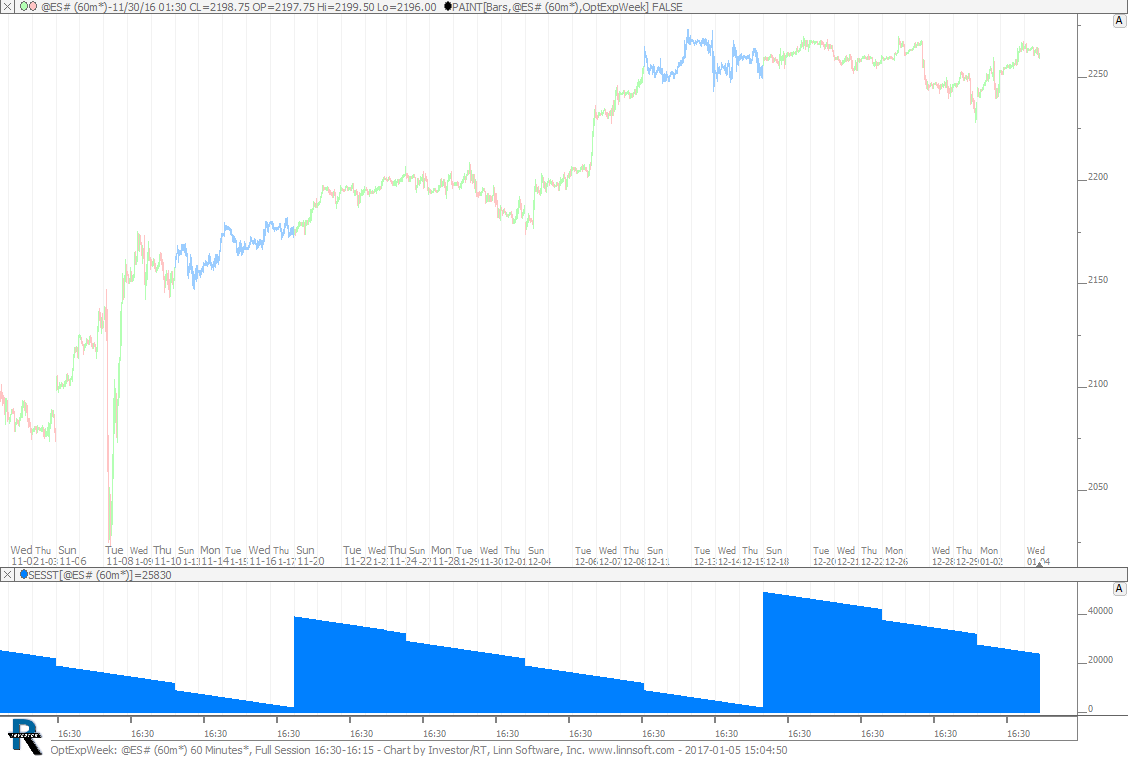 |
OptExpWeek (@ES#) cpayne [totalcount]
9 years 6 months ago
Painted Expiration Week. This chart was uploaded by Investor/RT 12.7.1 showing symbol: @ES#. |
View |
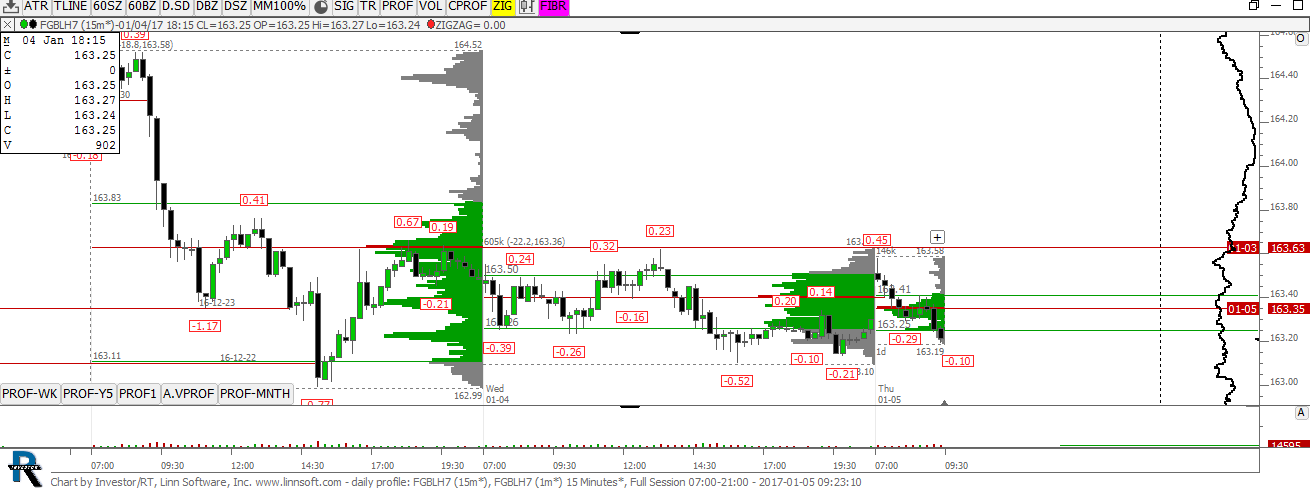 |
daily profile (FGBLH7) adrianfaiers [totalcount]
9 years 6 months ago
adeyf as per email. This chart was uploaded by Investor/RT 12.7.1 showing symbol: FGBLH7. |
View |
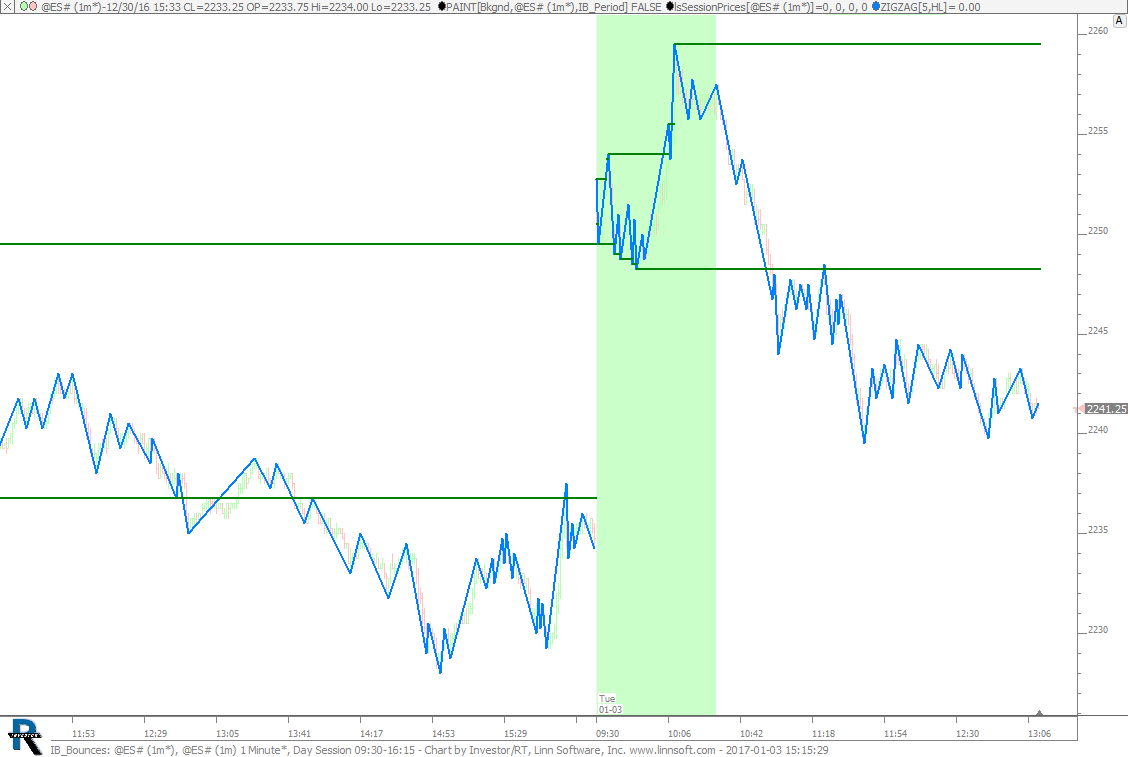 |
IB Bounces (@ES#) cpayne [totalcount]
9 years 7 months ago
IB Bounces. This chart was uploaded by Investor/RT 12.7.1 showing symbol: @ES#. |
View |
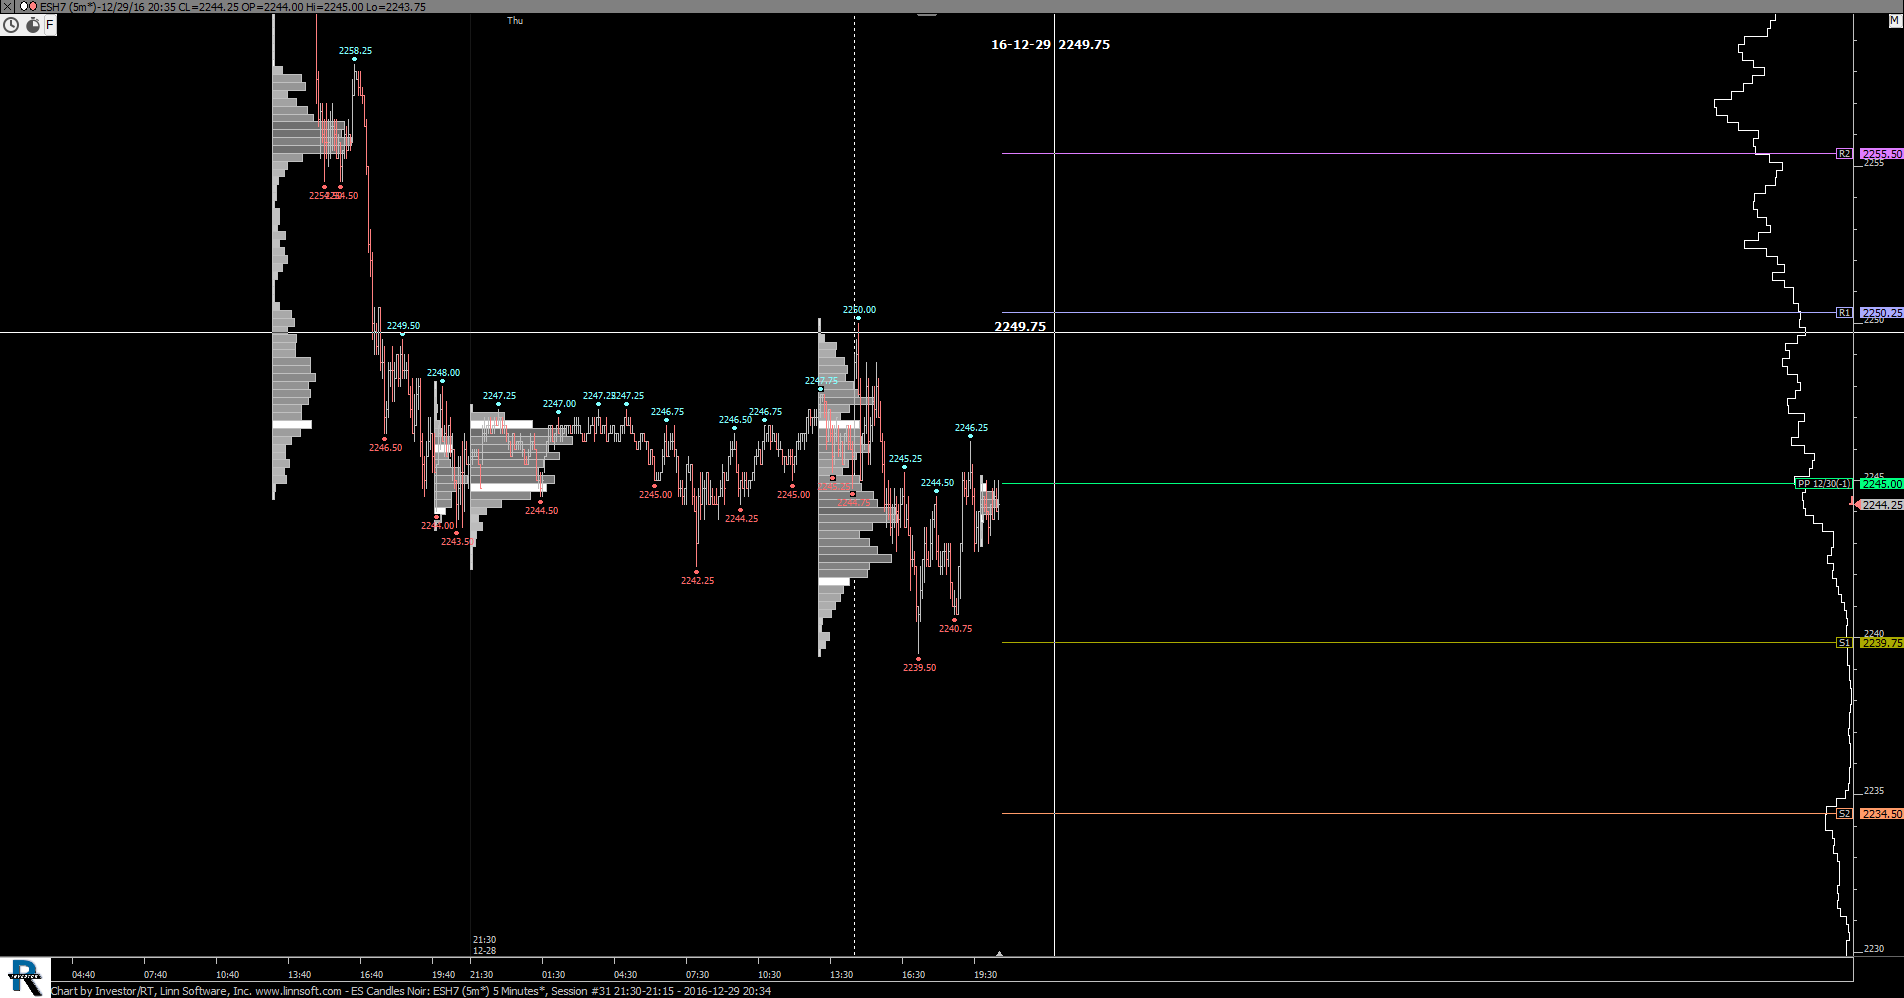 |
ES Candles Noir (ESH7) Stumpy68 [totalcount]
9 years 7 months ago
DTG Candles Noir. This chart was uploaded by Investor/RT 12.7.1 showing symbol: ESH7. |
View |
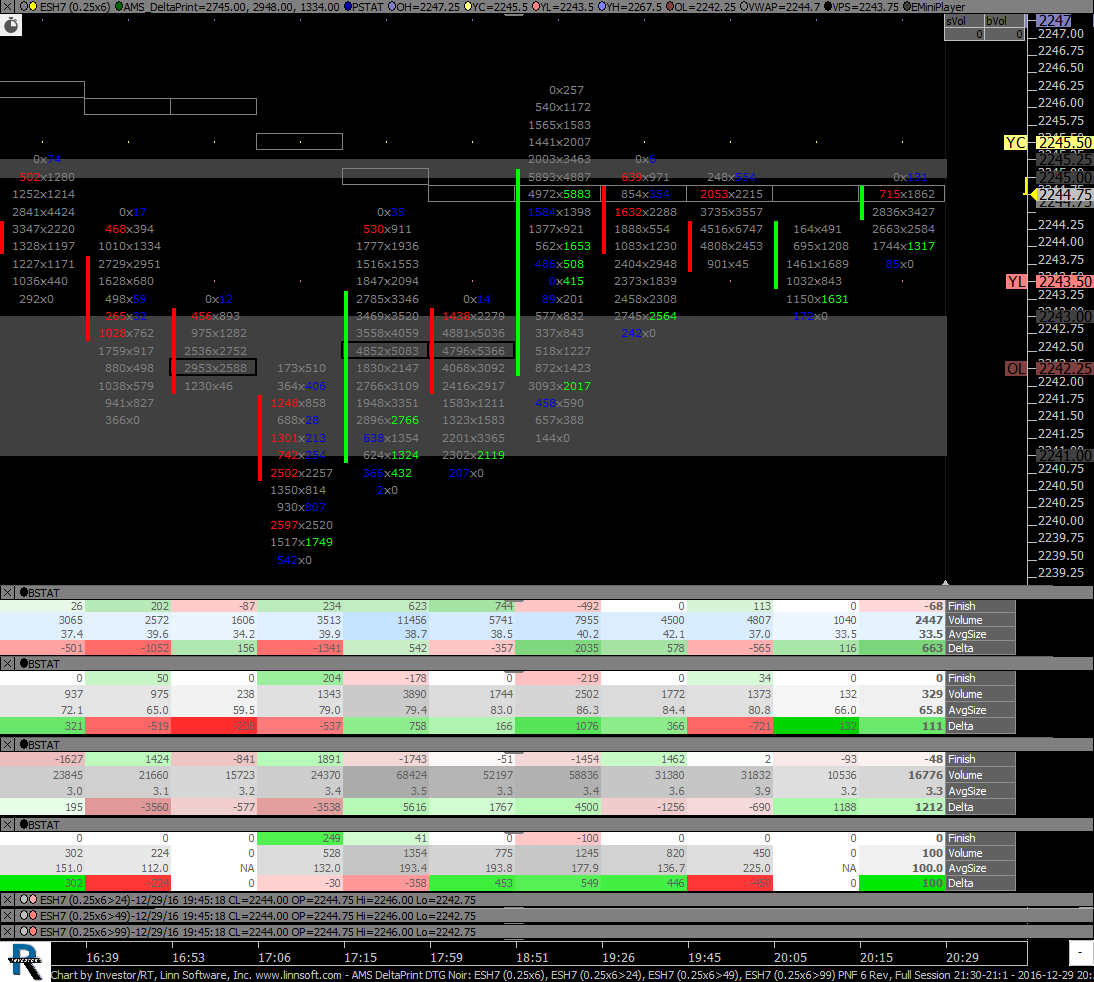 |
AMS DeltaPrint DTG Noir (ESH7) Stumpy68 [totalcount]
9 years 7 months ago
AMS DP Size. This chart was uploaded by Investor/RT 12.7.1 showing symbol: ESH7. |
View |
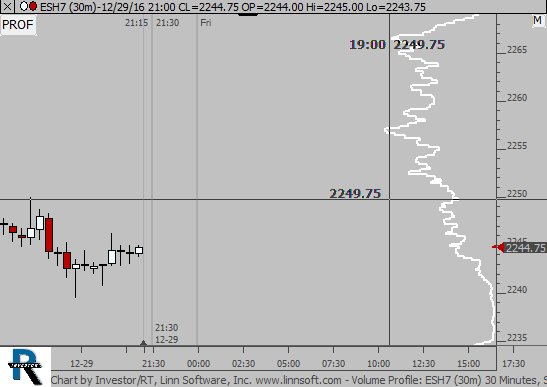 |
Volume Profile (ESH7) Stumpy68 [totalcount]
9 years 7 months ago
VP LONG. This chart was uploaded by Investor/RT 12.7.1 showing symbol: ESH7. |
View |
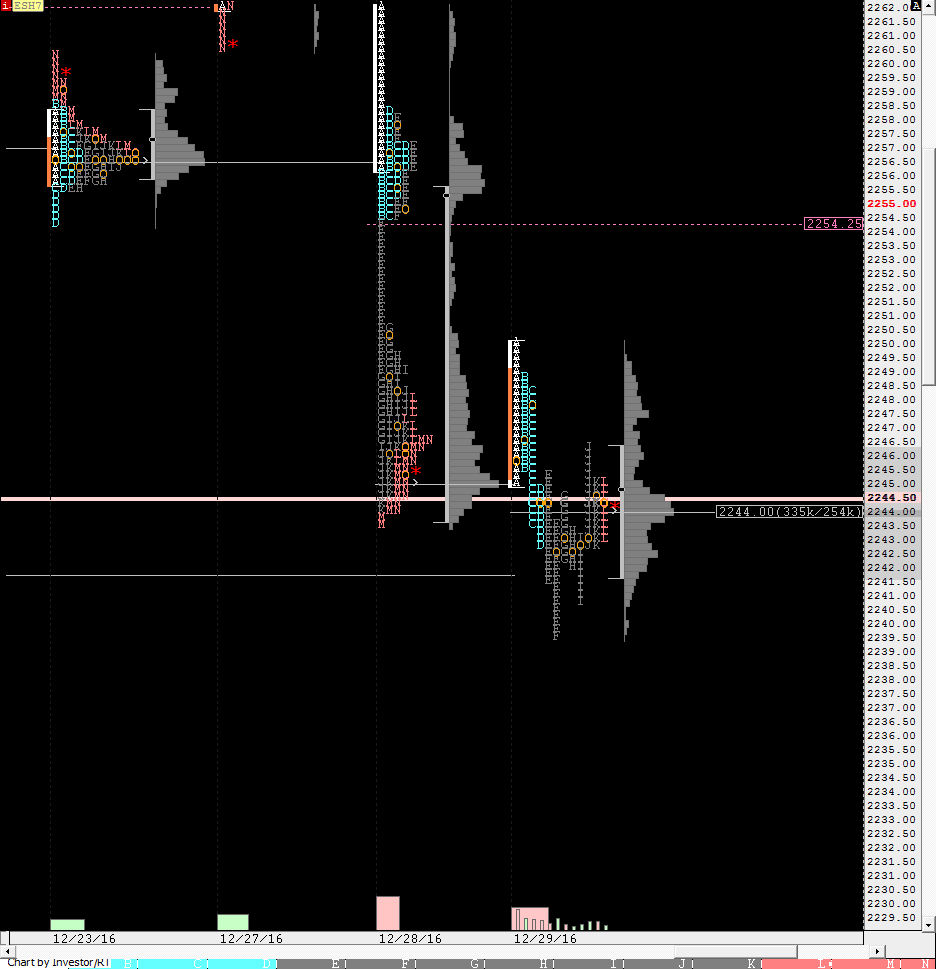 |
ES MP Noir (ESH7) Stumpy68 [totalcount]
9 years 7 months ago
ES MP NOIR. This chart was uploaded by Investor/RT 12.7.1 showing symbol: ESH7. |
View |
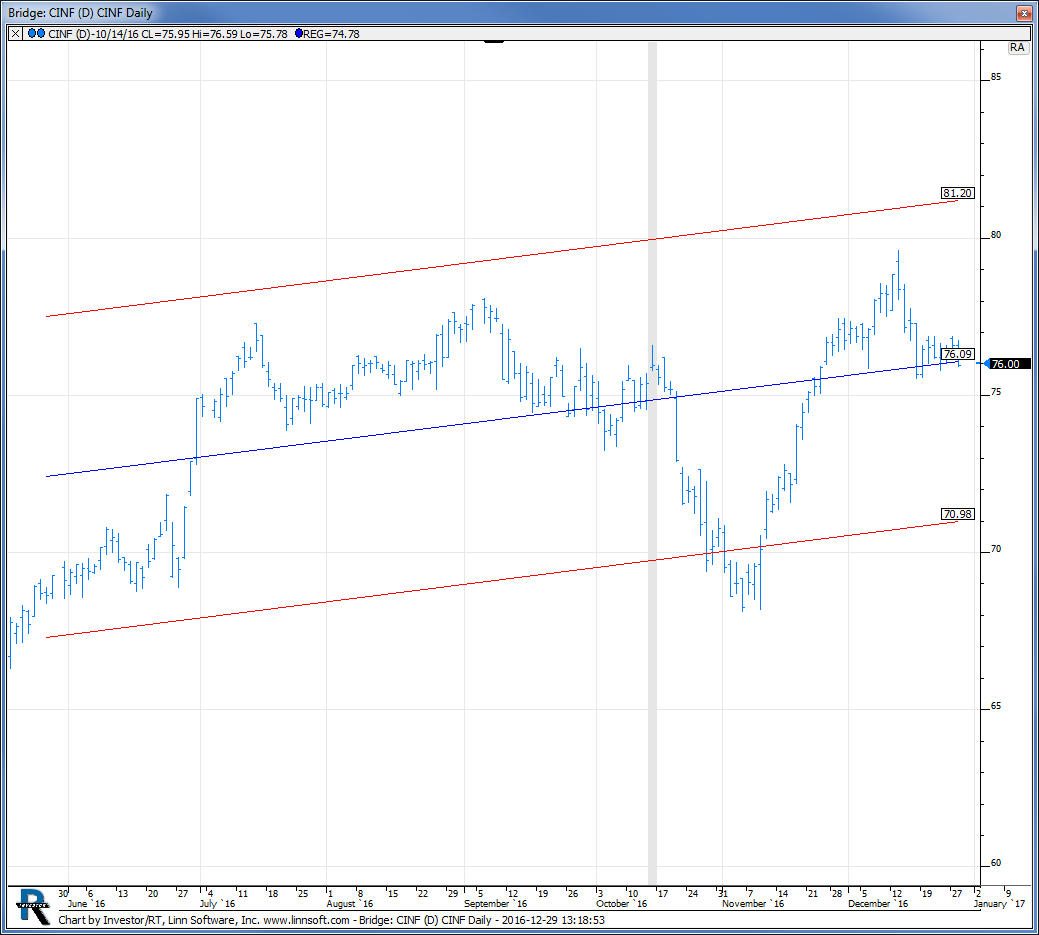 |
Bridge (CINF) mreed1 [totalcount]
9 years 7 months ago
This chart was uploaded by Investor/RT 12.6.8 showing symbol: CINF. |
View |
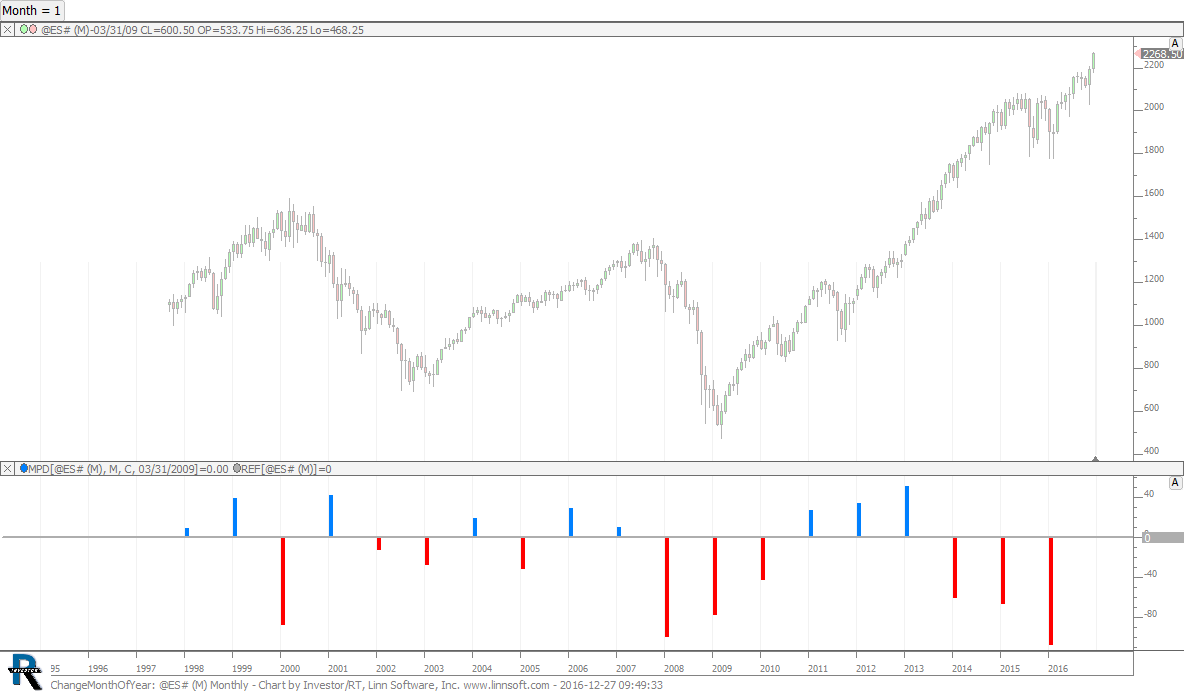 |
ChangeMonthOfYear (@ES#) cpayne [totalcount]
9 years 7 months ago
Change by Month. Use button at top to choose the month (1 for Jan, 2 for Feb, etc). This chart was uploaded by Investor/RT 12.7.1 showing symbol: @ES#. |
View |
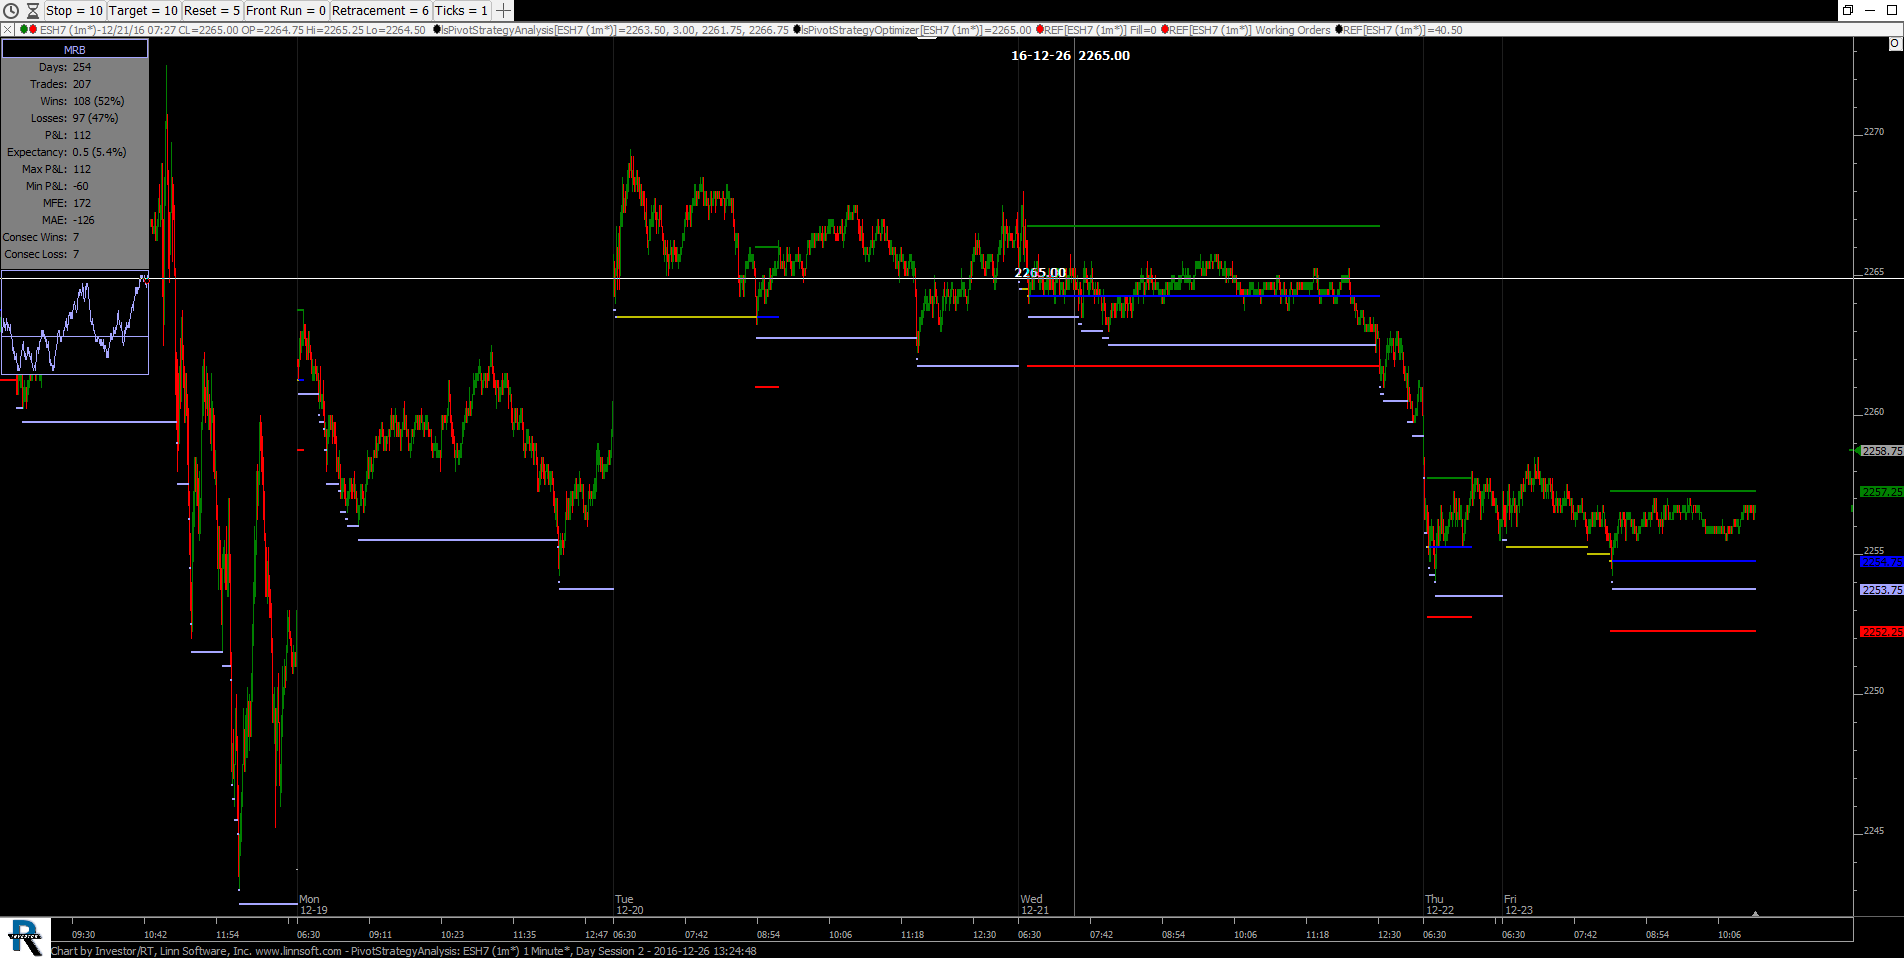 |
PivotStrategyAnalysis (ESH7) mostafacali [totalcount]
9 years 7 months ago
This chart was uploaded by Investor/RT 12.6.8 showing symbol: ESH7. |
View |
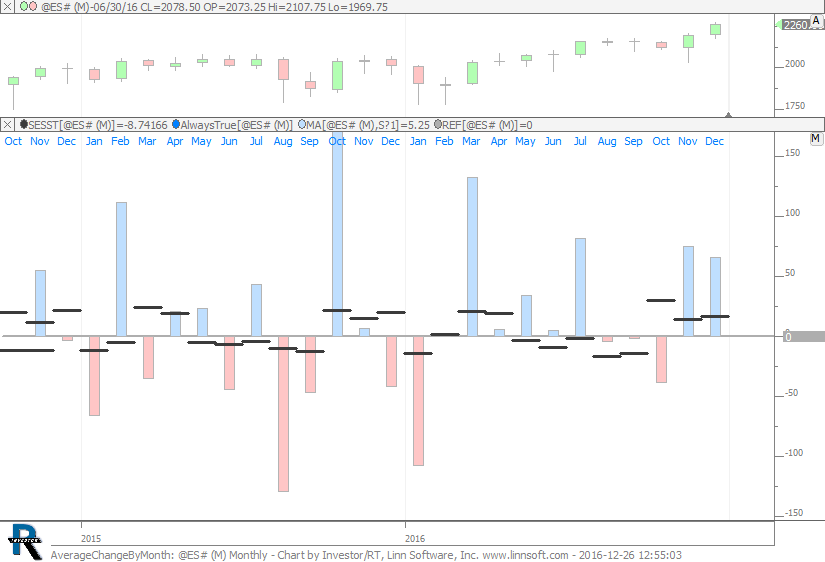 |
AverageChangeByMonth (@ES#) cpayne [totalcount]
9 years 7 months ago
Average Change By Month - Black is Average since 1998. Histogram is change of that month. This chart was uploaded by Investor/RT 12.7.1 showing symbol: @ES#. |
View |
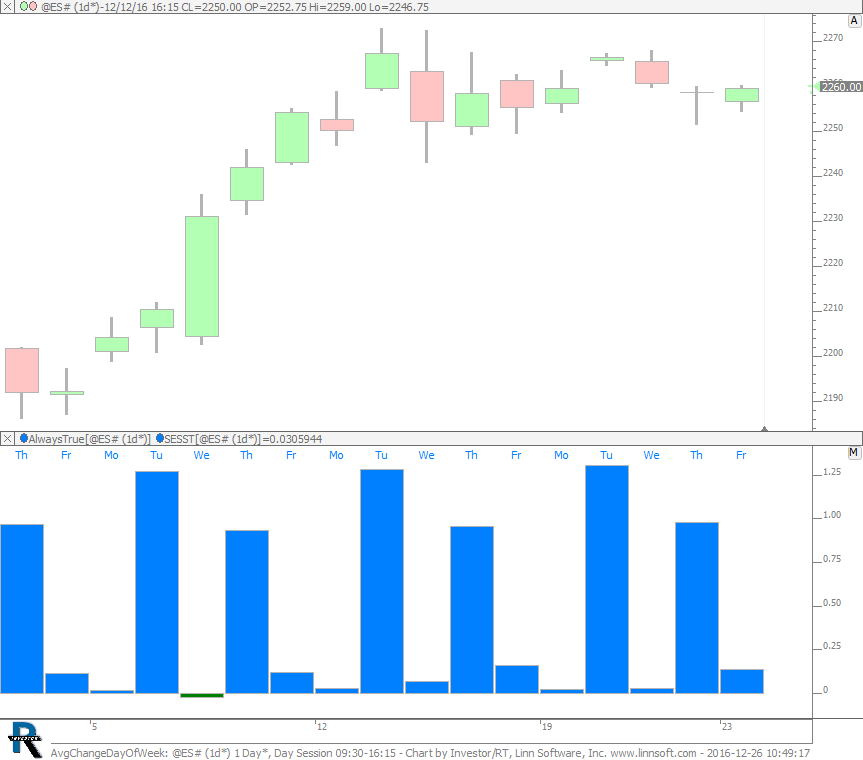 |
AvgChangeDayOfWeek (@ES#) cpayne [totalcount]
9 years 7 months ago
Average Change by Day of Week. This chart was uploaded by Investor/RT 12.7.1 showing symbol: @ES#. |
View |
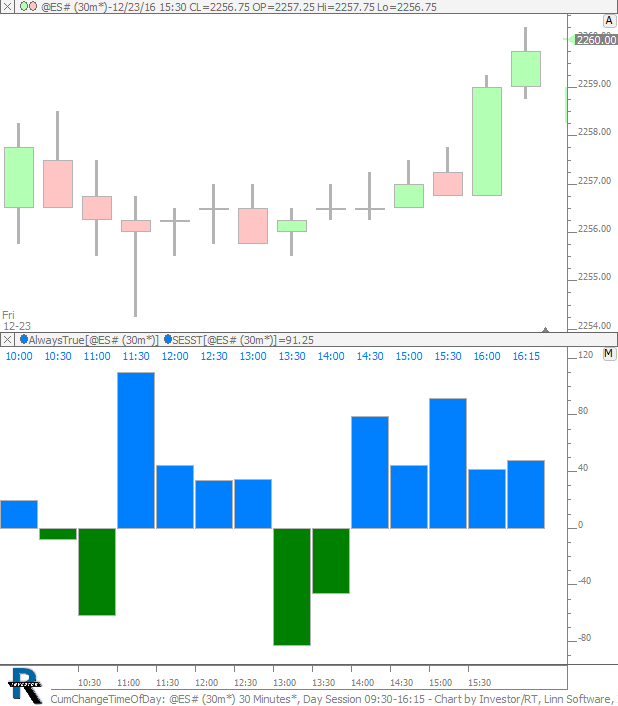 |
CumChangeTimeOfDay (@ES#) cpayne [totalcount]
9 years 7 months ago
Cumulative Change by Time of Day. This chart was uploaded by Investor/RT 12.7.1 showing symbol: @ES#. |
View |
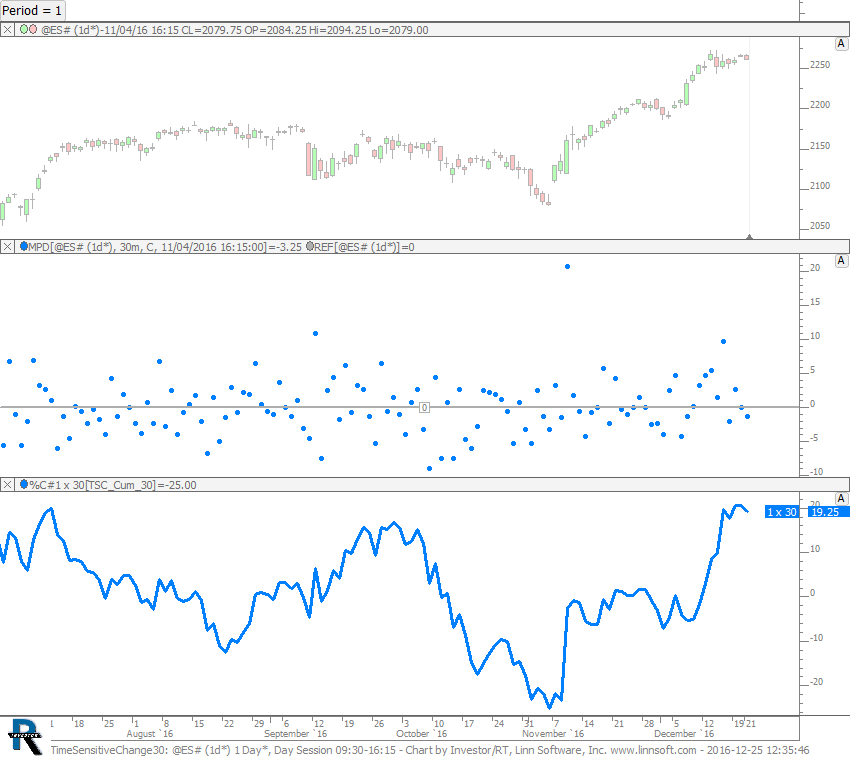 |
TimeSensitiveChange30 (@ES#) cpayne [totalcount]
9 years 7 months ago
Cumulative Change by Time of Day using 30-minute periods. This chart was uploaded by Investor/RT 12.7.1 showing symbol: @ES#. |
View |
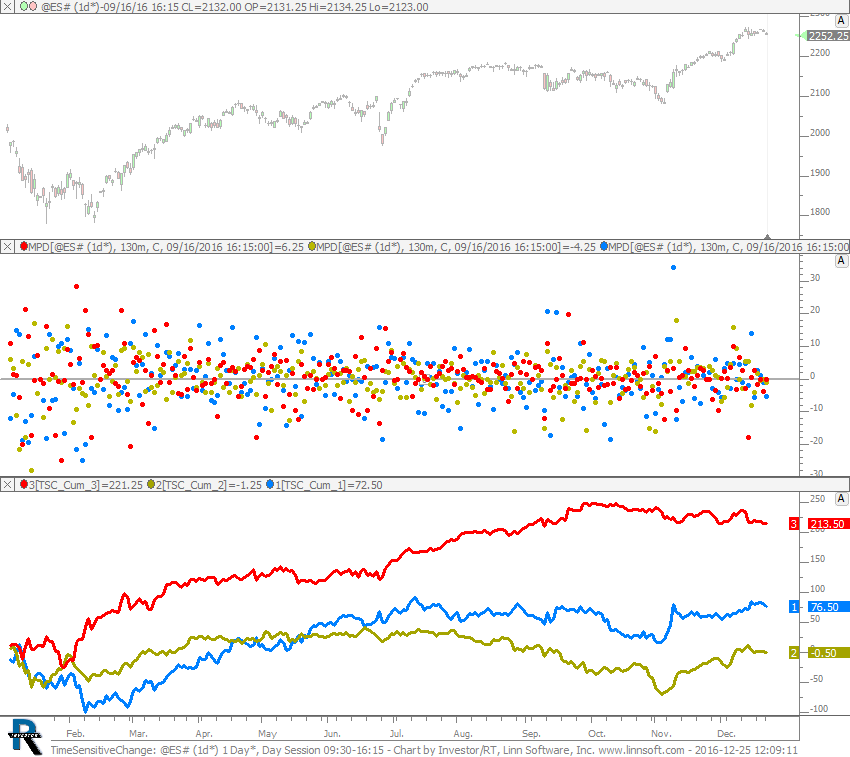 |
TimeSensitiveChange (@ES#) cpayne [totalcount]
9 years 7 months ago
Time Sensitive Change - Blue is 1st 130 minutes. Gold is 2nd 130 minutes. Red is 3rd 130 minutes of day session. |
View |
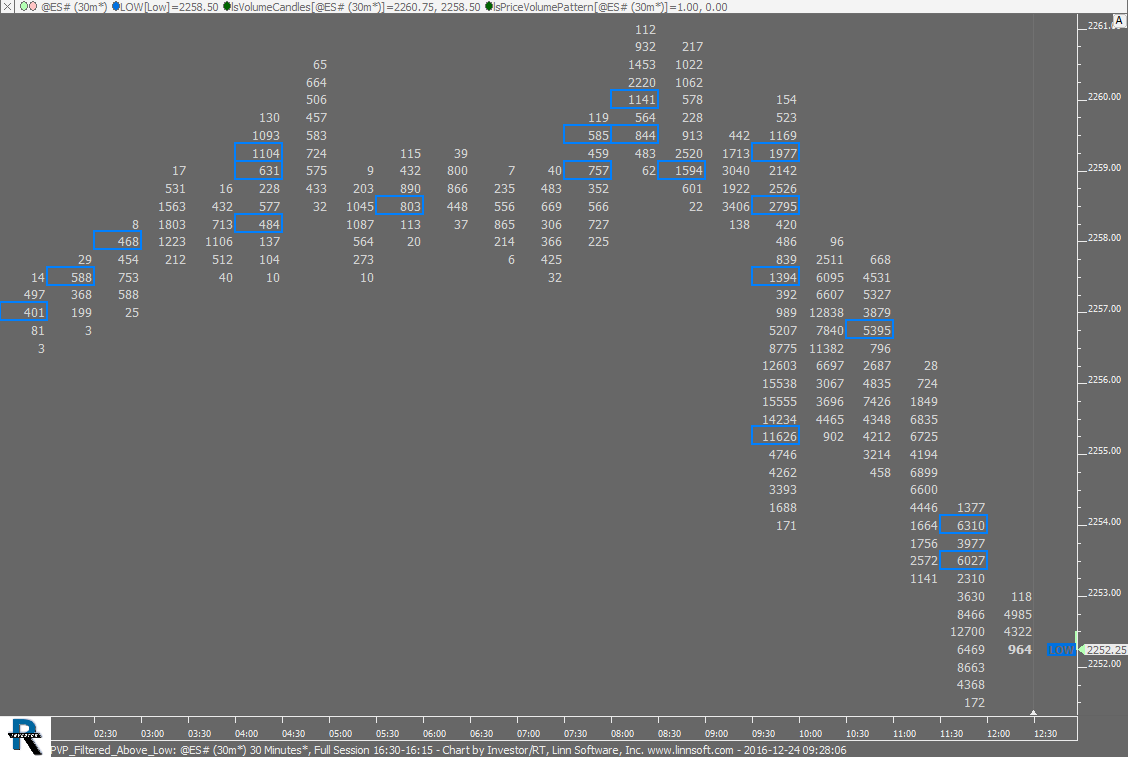 |
PVP Filtered Above Low (@ES#) cpayne [totalcount]
9 years 7 months ago
This chart was uploaded by Investor/RT 12.7.1 showing symbol: @ES#. |
View |
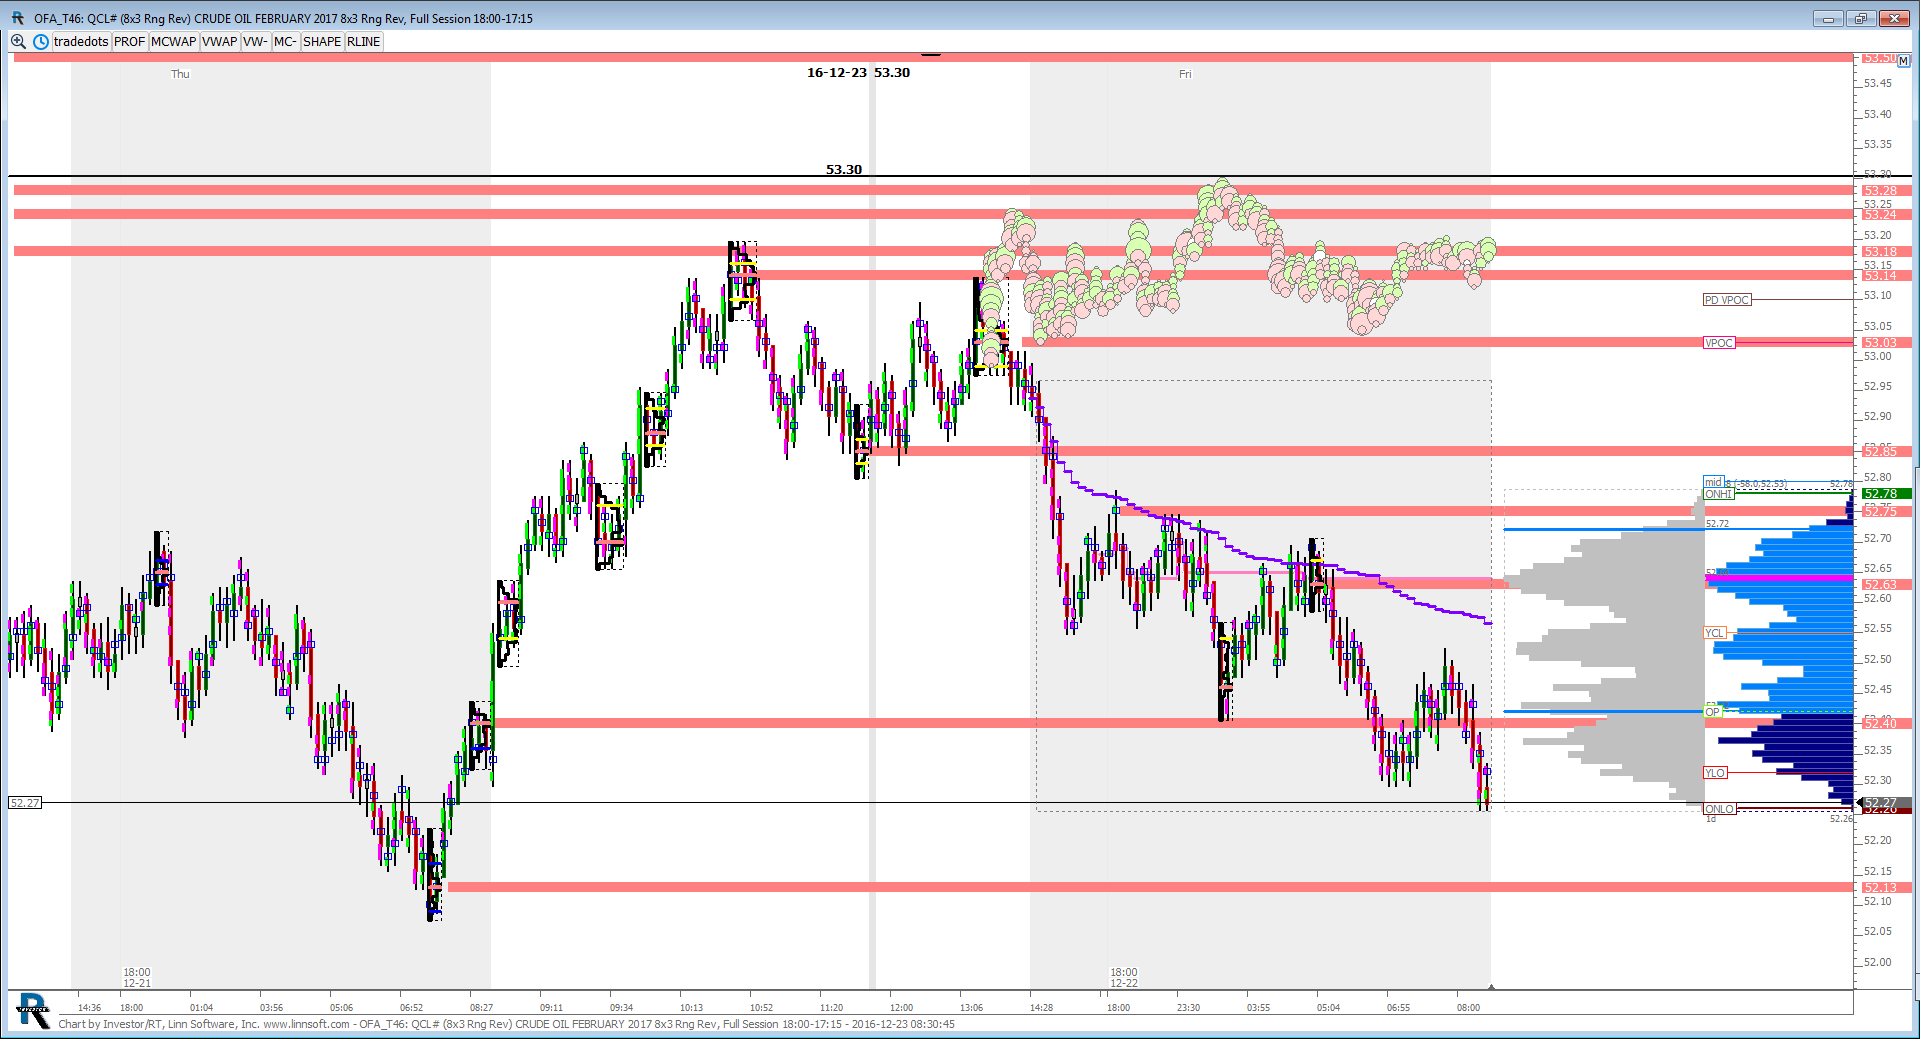 |
OFA T (QCL#) jayski51369 [totalcount]
9 years 7 months ago
This chart was uploaded by Investor/RT 12.7.1 showing symbol: QCL#. |
View |
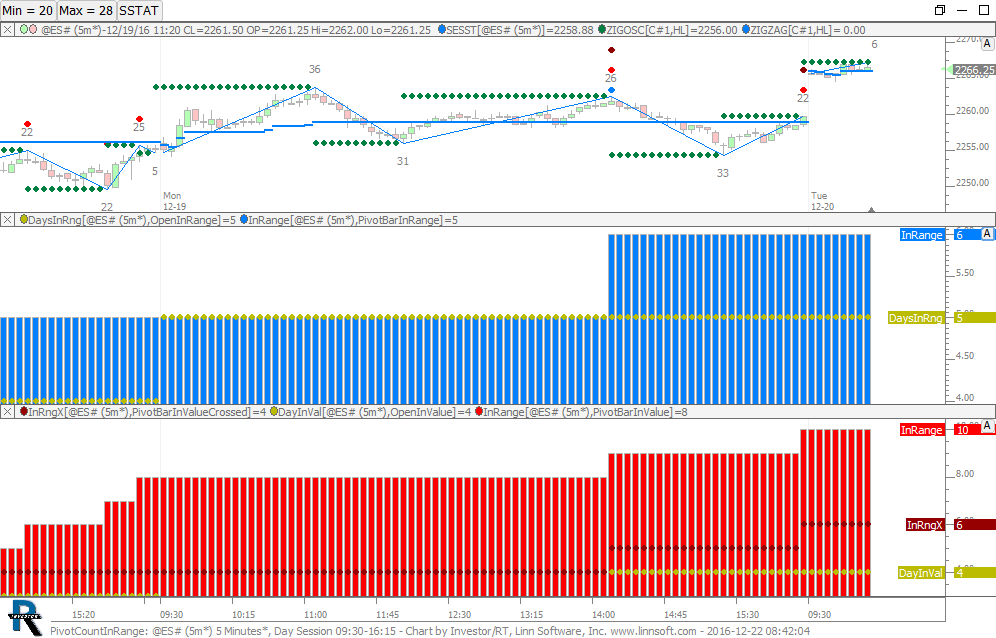 |
PivotCountInRange (@ES#) cpayne [totalcount]
9 years 7 months ago
Pivot Count In Range?. This chart was uploaded by Investor/RT 12.7.1 showing symbol: @ES#. |
View |
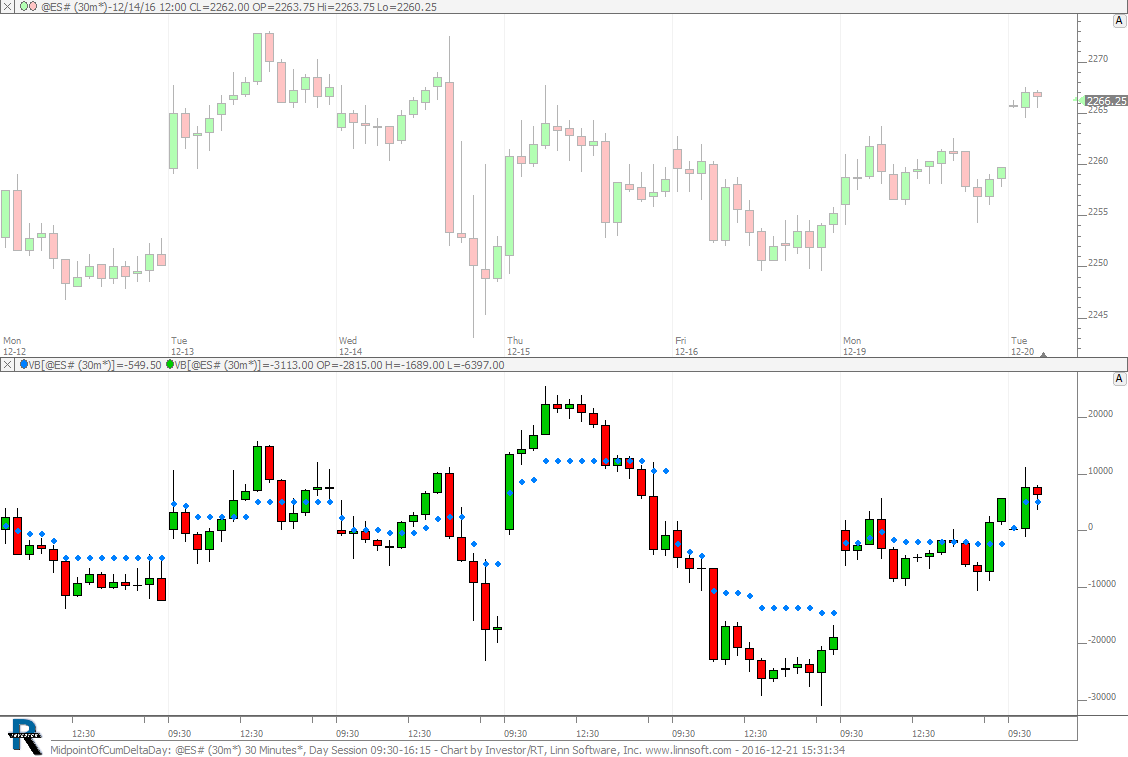 |
MidpointOfCumDeltaDay (@ES#) cpayne [totalcount]
9 years 7 months ago
Midpoint of daily cumulative delta. This chart was uploaded by Investor/RT 12.7.1 showing symbol: @ES#. |
View |