 |
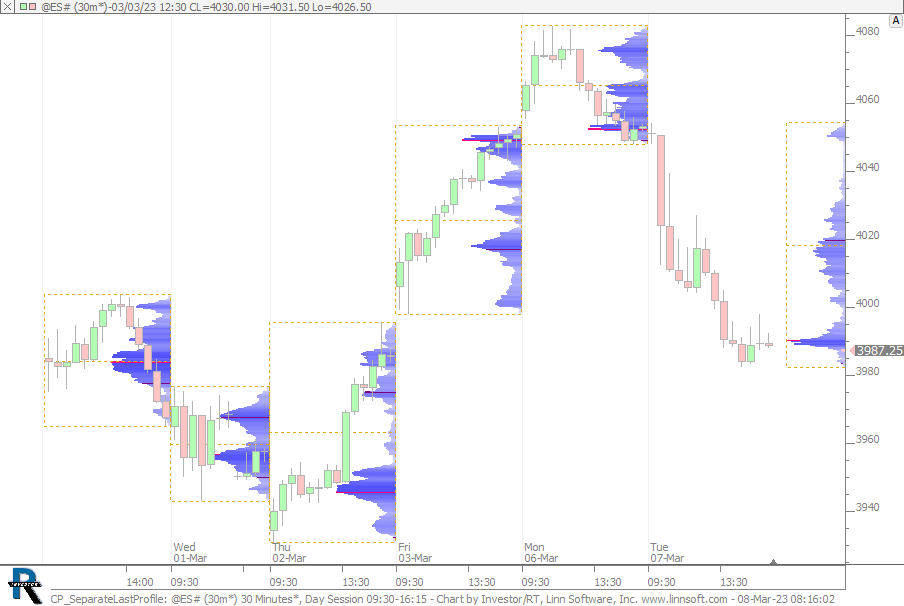
CP SeparateLastProfile (@ES#) cpayne [totalcount]
3 years 4 months ago
Chart demonstrates how to separate last profile (with another instance of Profile indicator) to move it off the current bars. |
View |
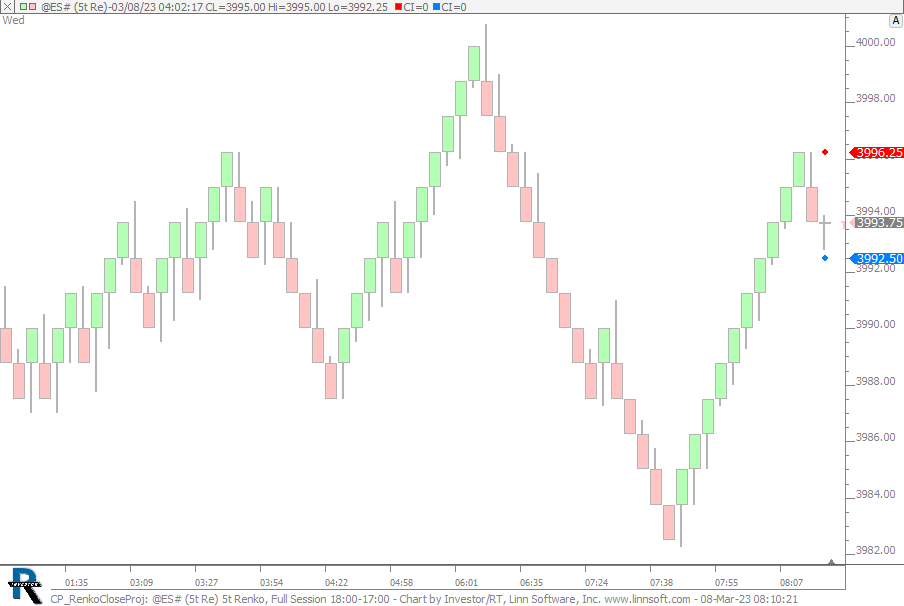 |
CP RenkoCloseProj (@ES#) cpayne [totalcount]
3 years 4 months ago
Projects the closing prices of Renko bars. This chart was uploaded by Investor/RT 15.1.15 showing symbol: @ES#. |
View |
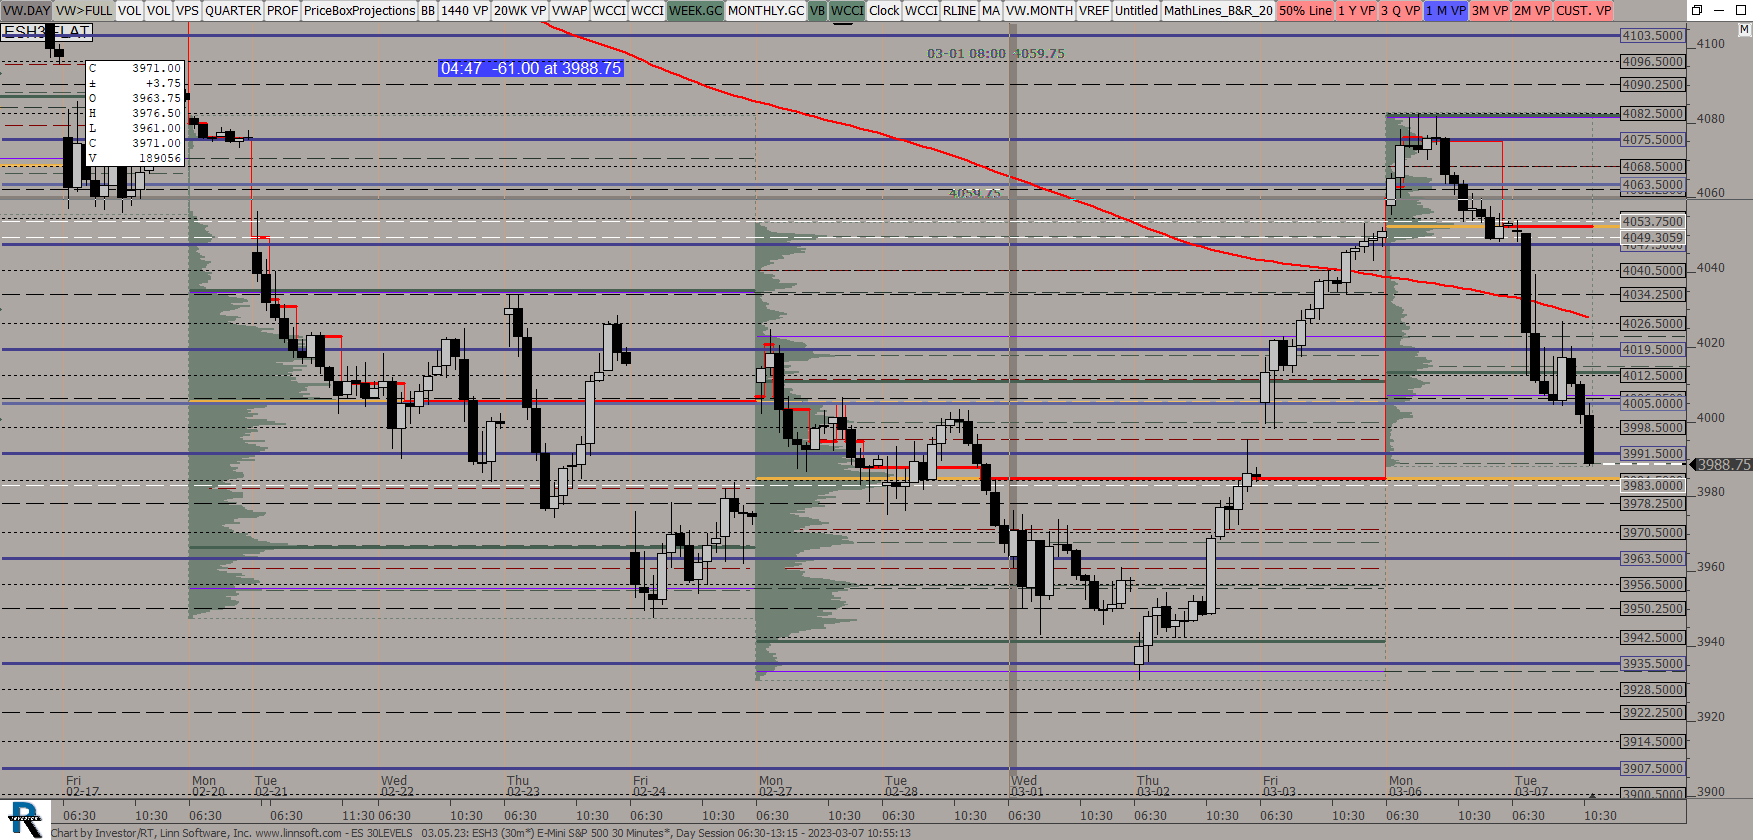 |
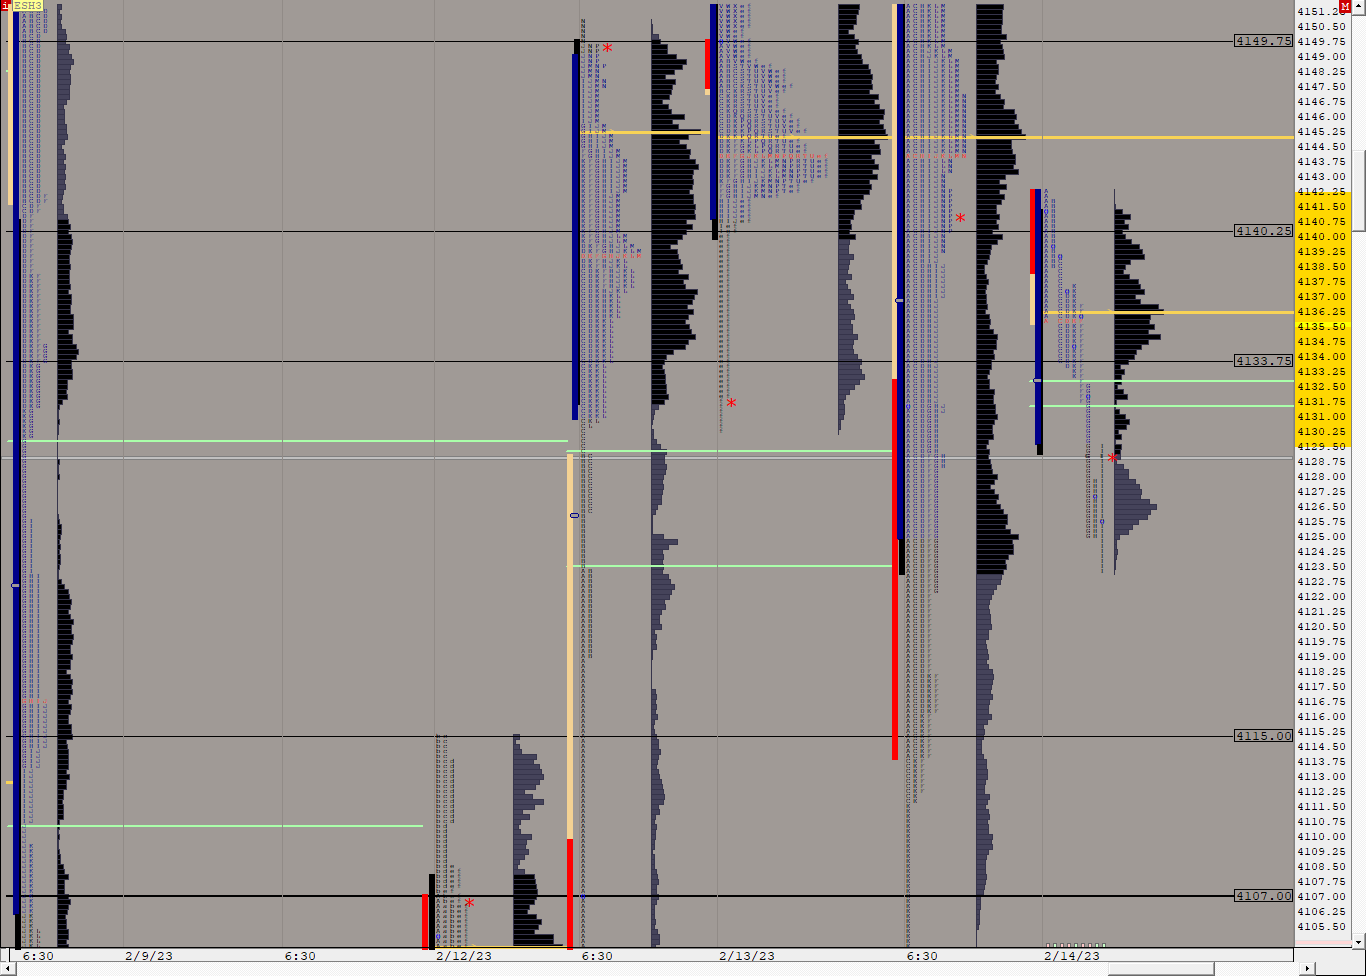
ES 30LEVELS (ESH3) ES42 [totalcount]
3 years 4 months ago
This chart was uploaded by Investor/RT 14.5.4 showing symbol: ESH3. |
View |
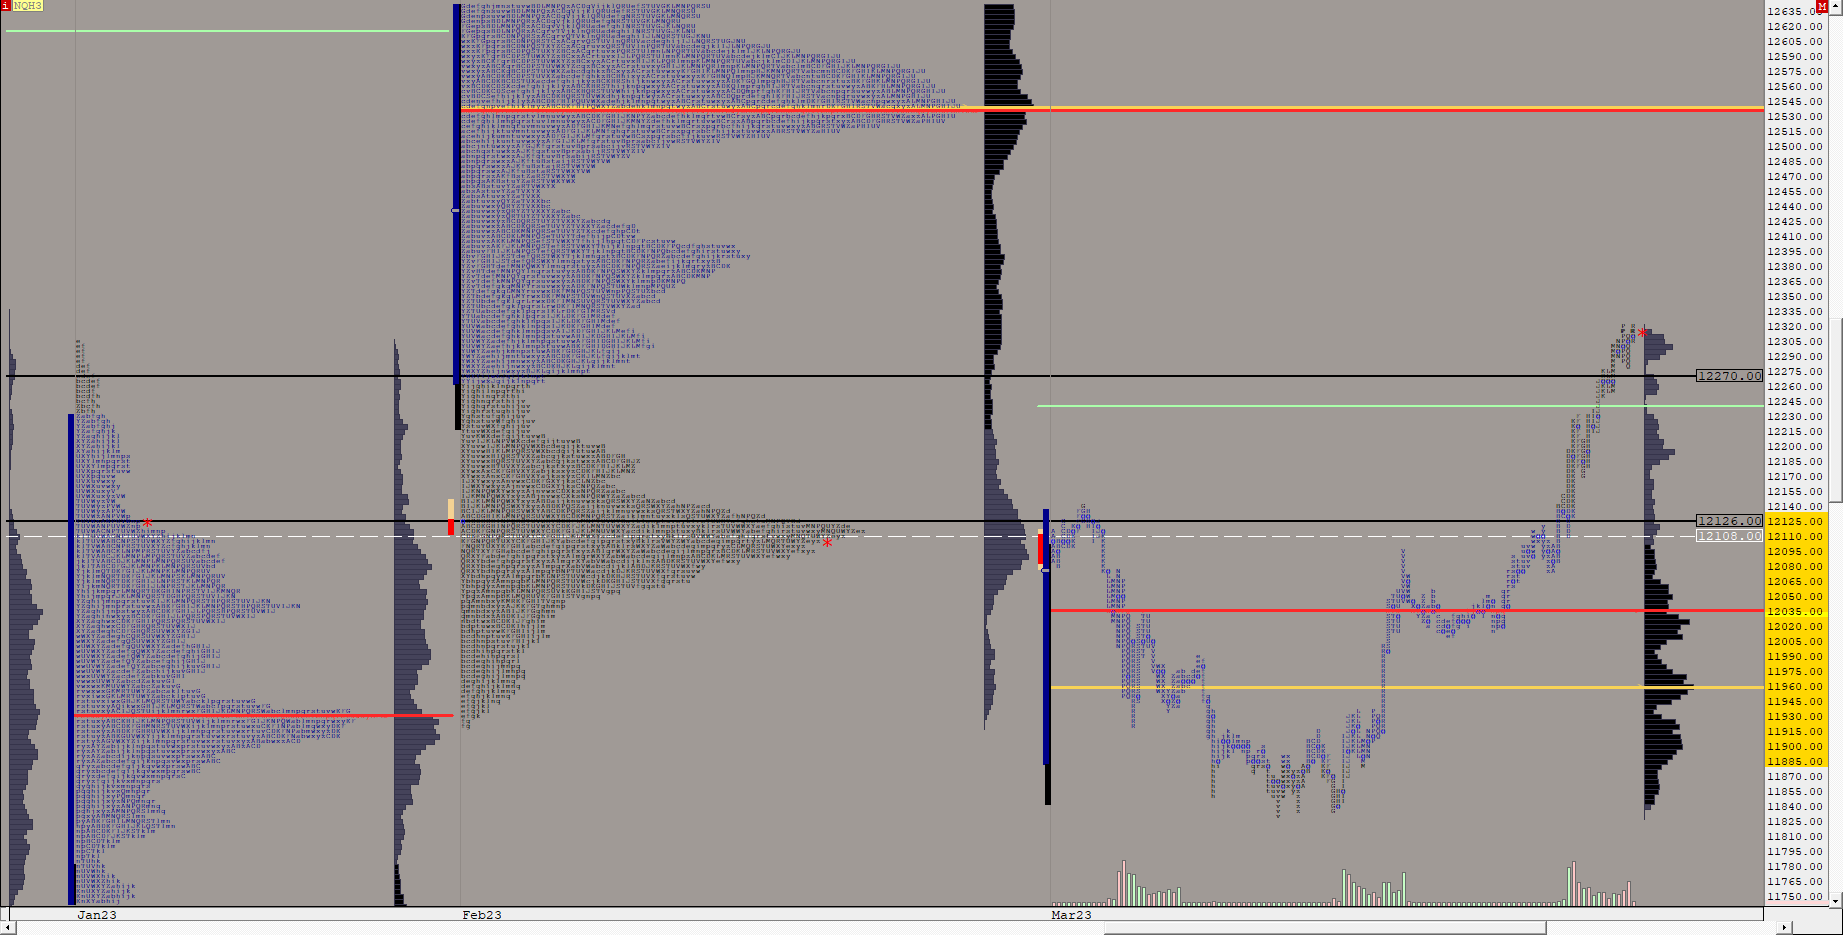 |
NQTPO Monthly Opens (NQH3) ES42 [totalcount]
3 years 4 months ago
This chart was uploaded by Investor/RT 14.5.4 showing symbol: NQH3. |
View |
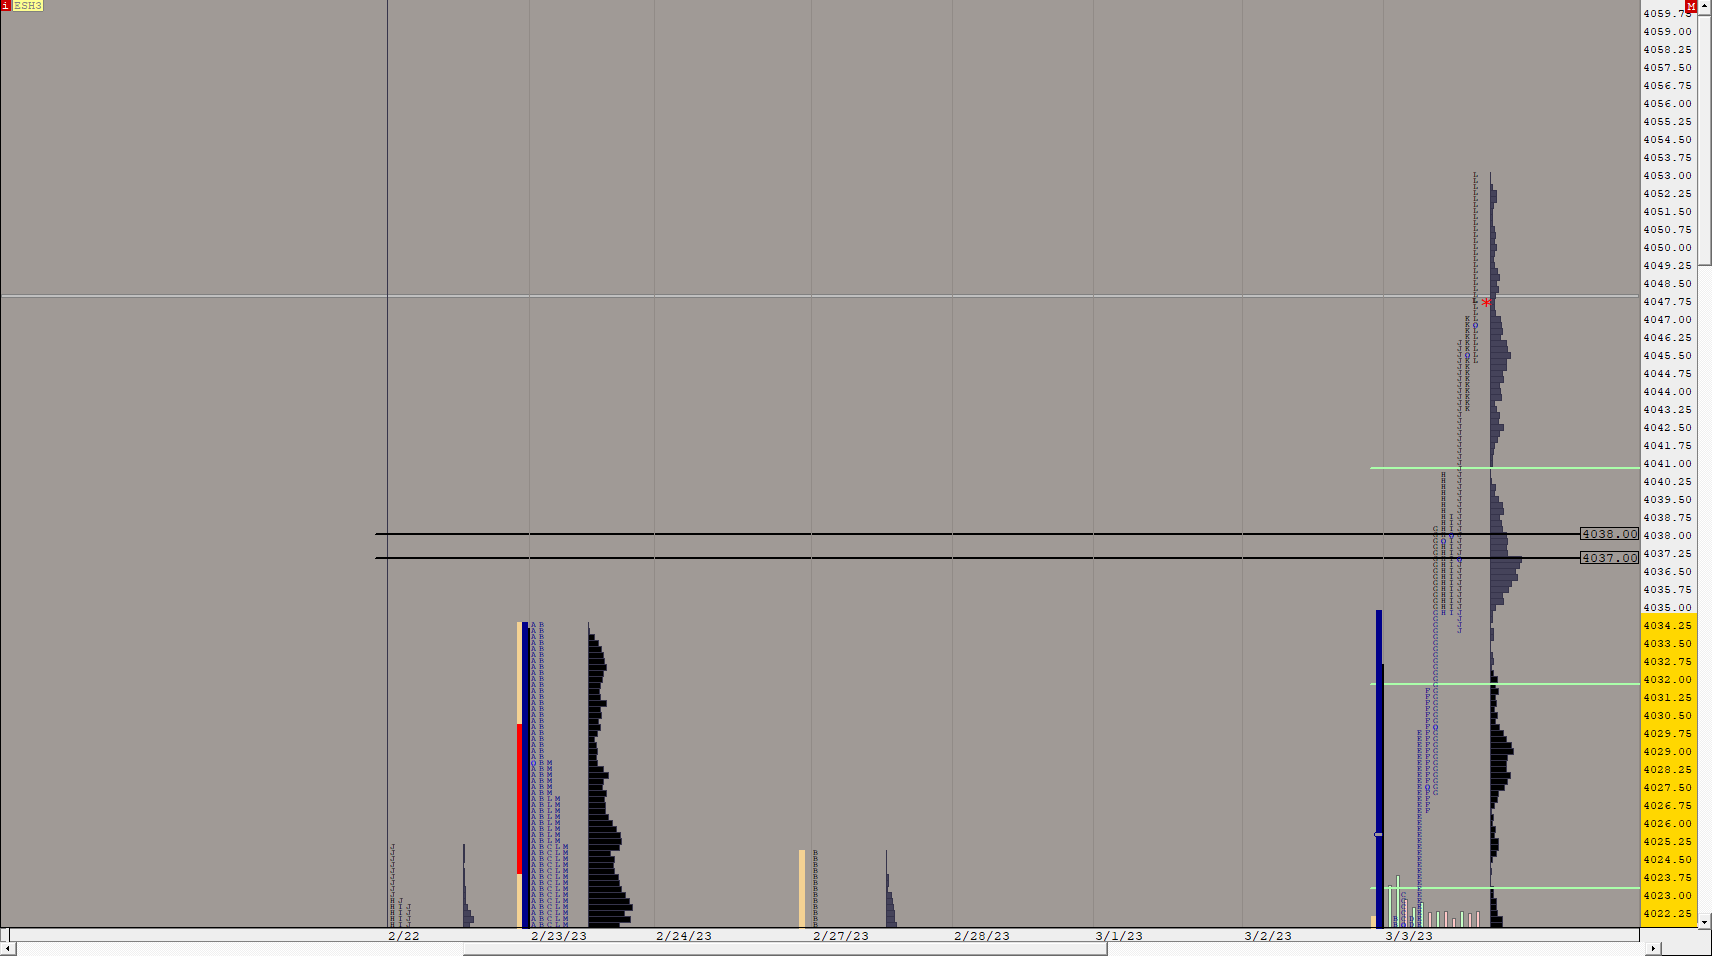 |
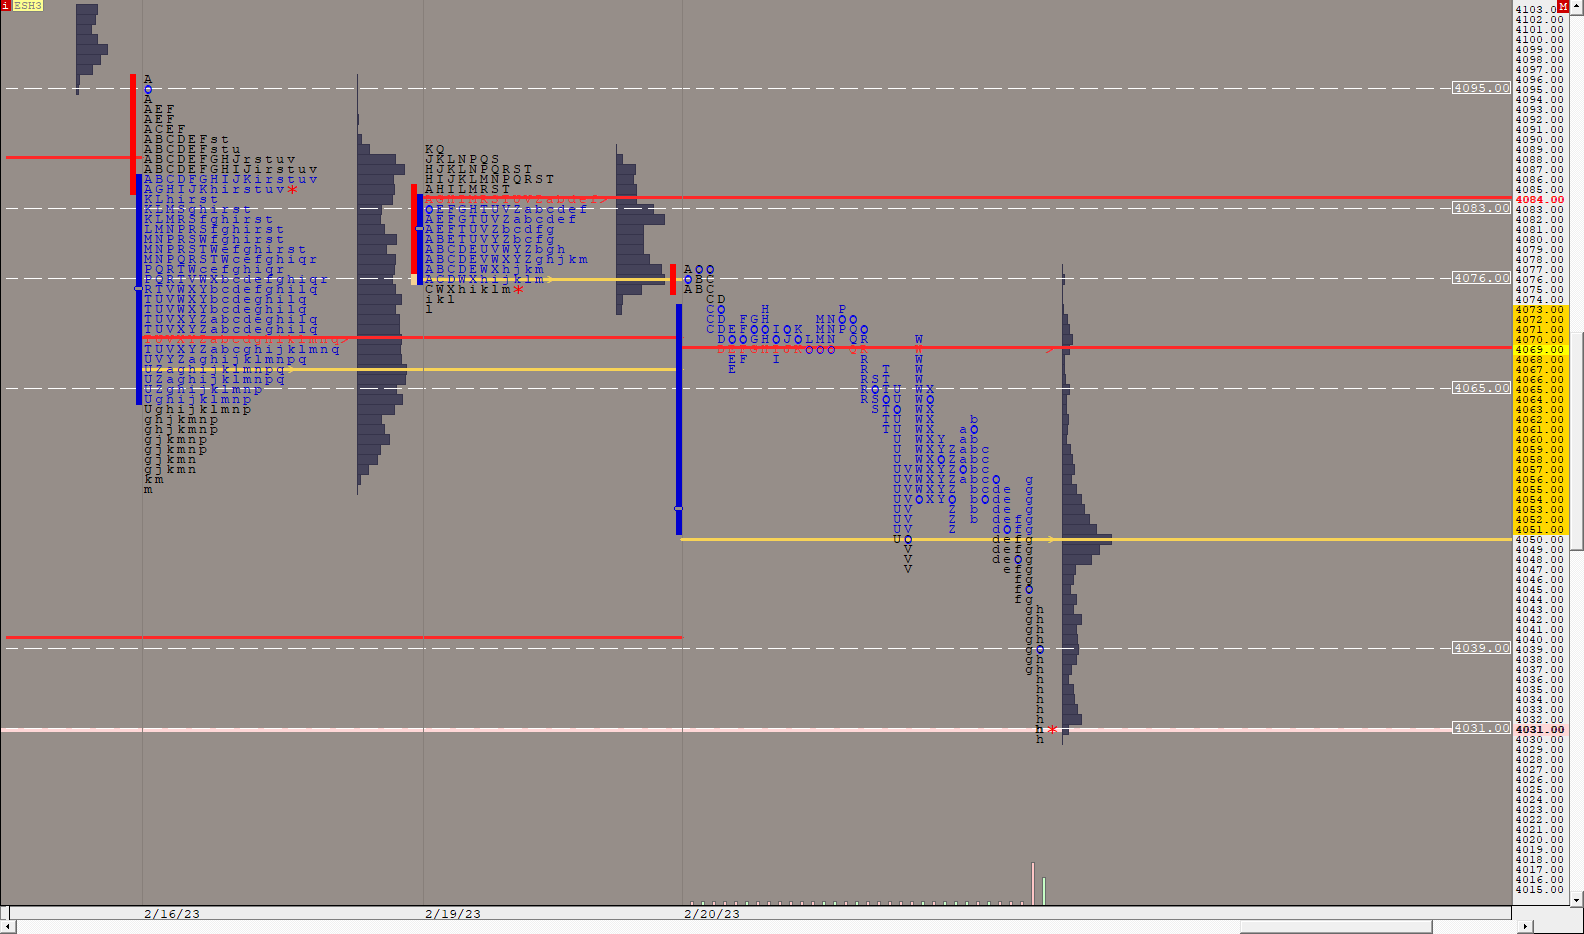
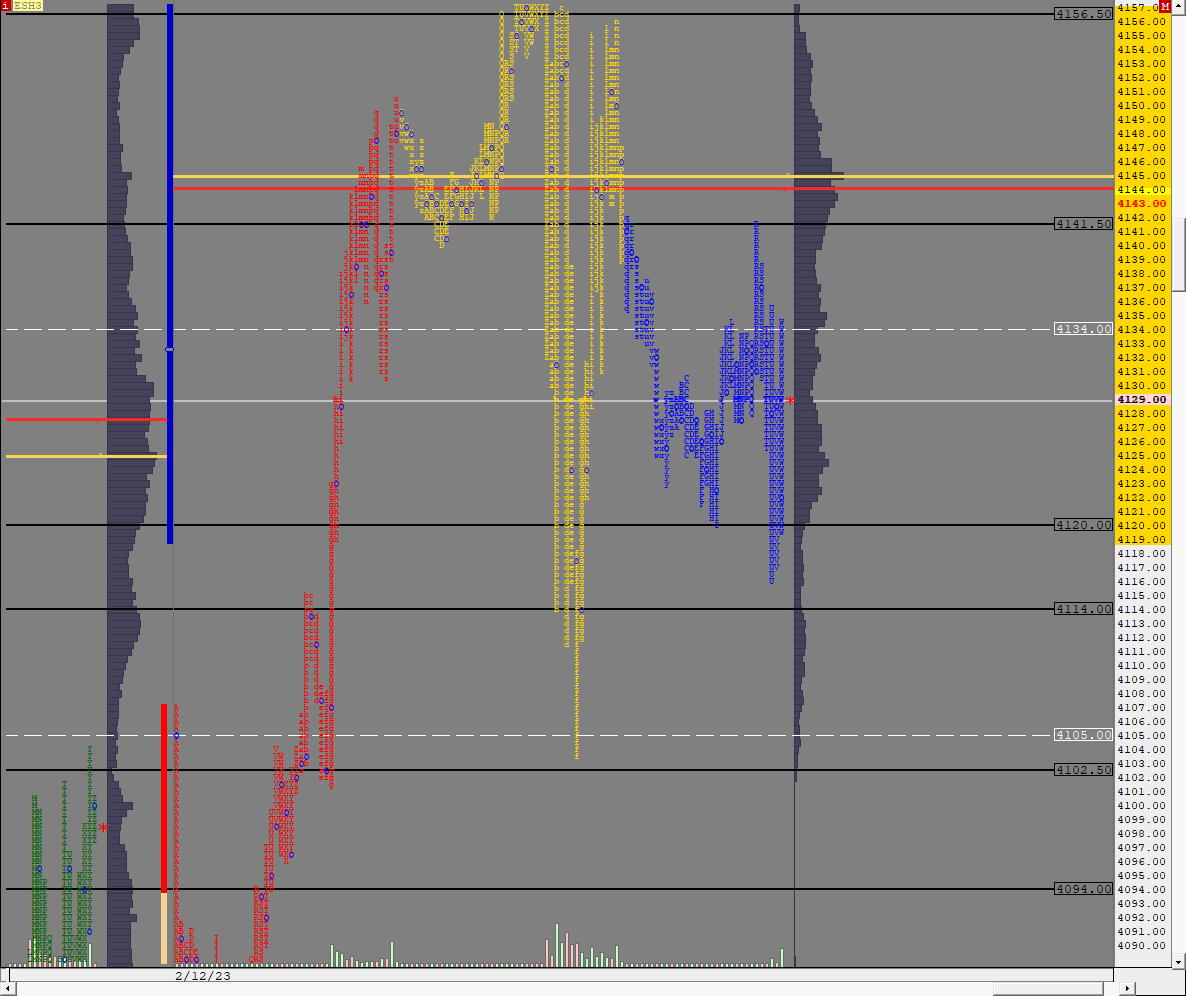
ESDAYTPOALT (ESH3) ES42 [totalcount]
3 years 4 months ago
This chart was uploaded by Investor/RT 14.5.4 showing symbol: ESH3. |
View |
 |
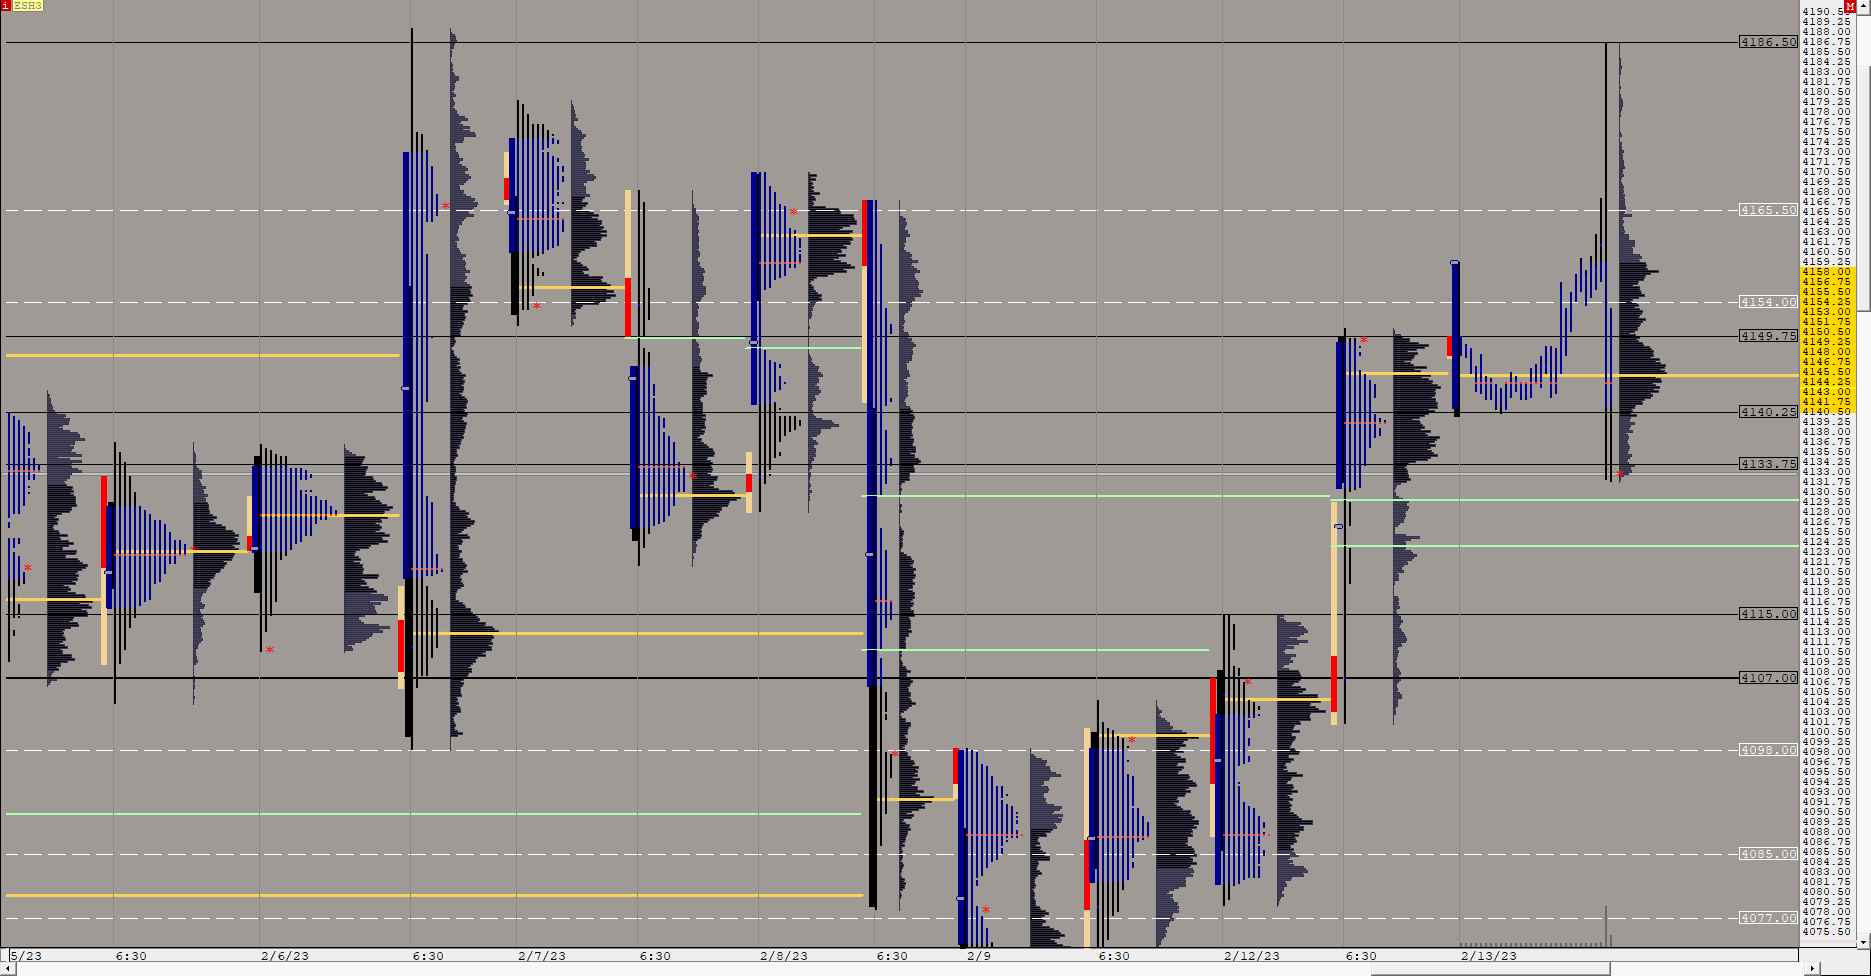
ESH3MONTHLY VALUE (ESH3) ES42 [totalcount]
3 years 5 months ago
This chart was uploaded by Investor/RT 14.5.4 showing symbol: ESH3. |
View |
 |
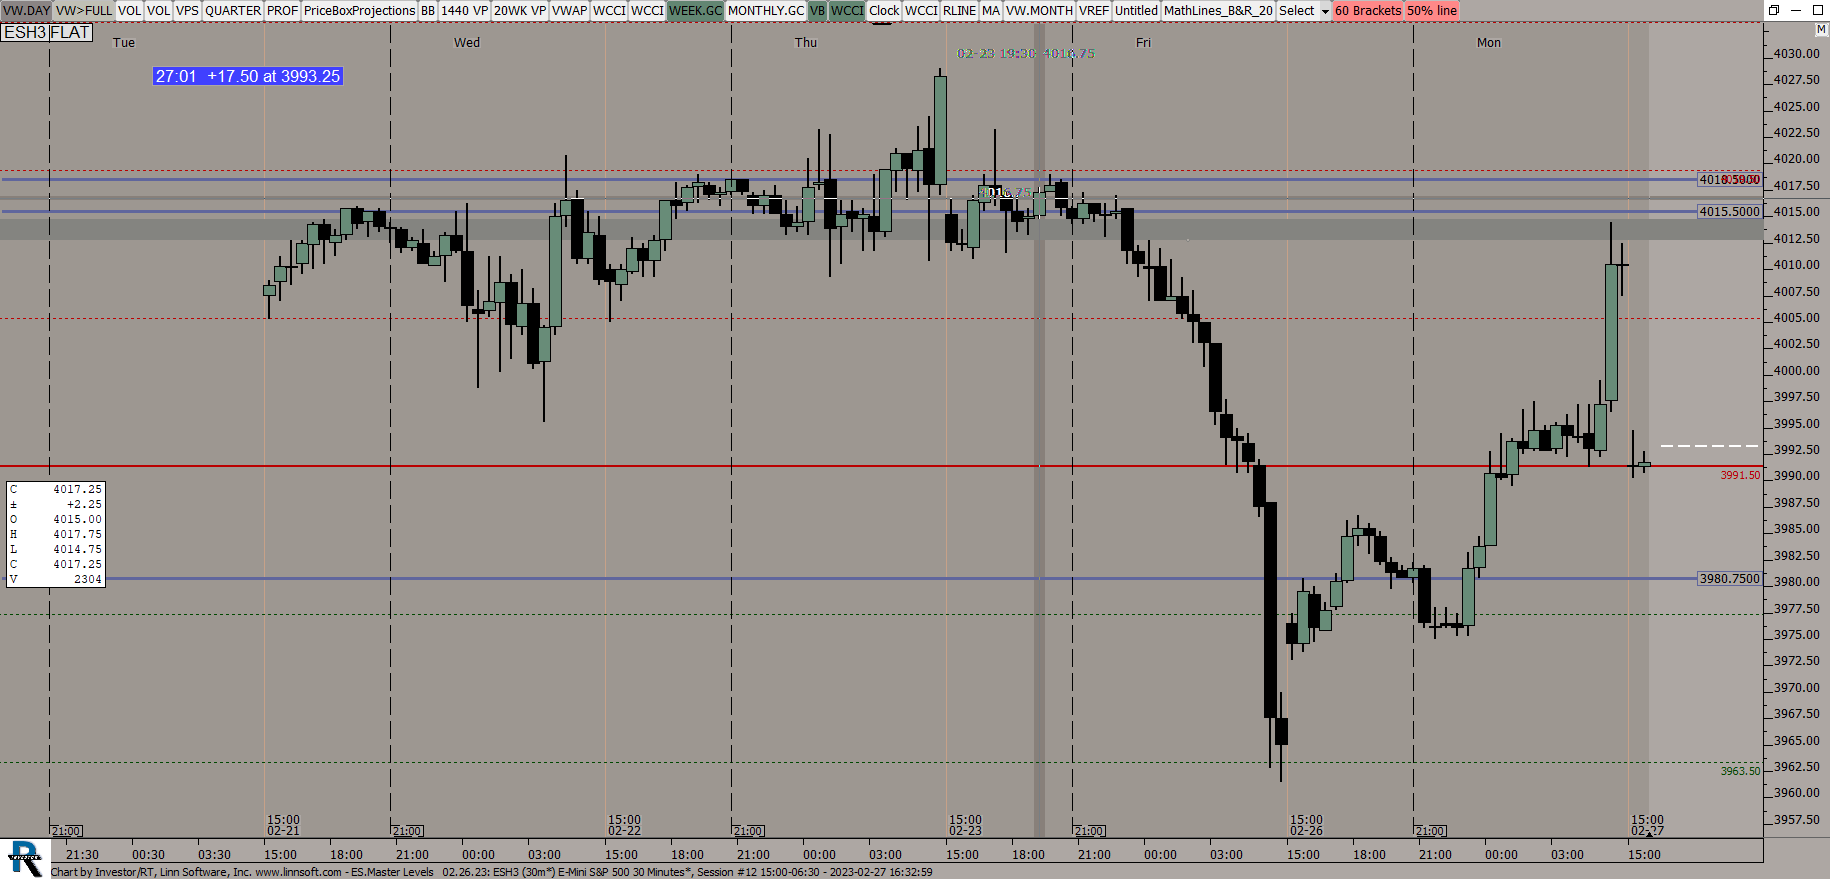
ESrENTRY (ESH3) ES42 [totalcount]
3 years 5 months ago
This chart was uploaded by Investor/RT 14.5.4 showing symbol: ESH3. |
View |
 |
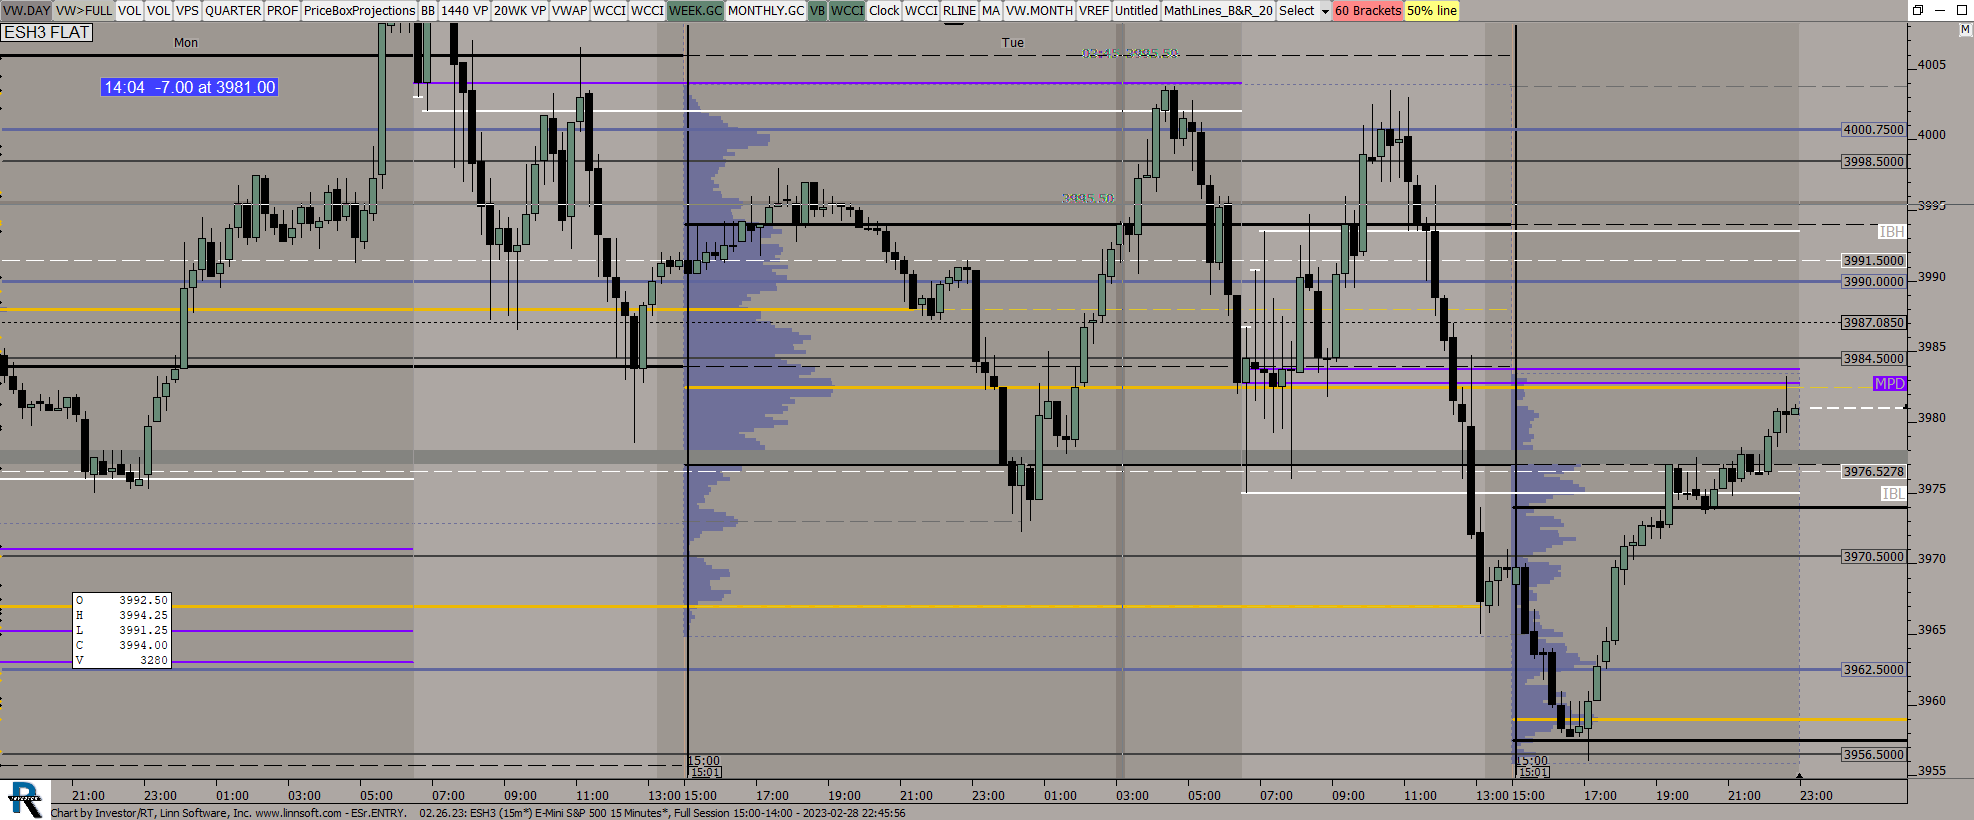
ESMaster Levels (ESH3) ES42 [totalcount]
3 years 5 months ago
This chart was uploaded by Investor/RT 14.5.4 showing symbol: ESH3. |
View |
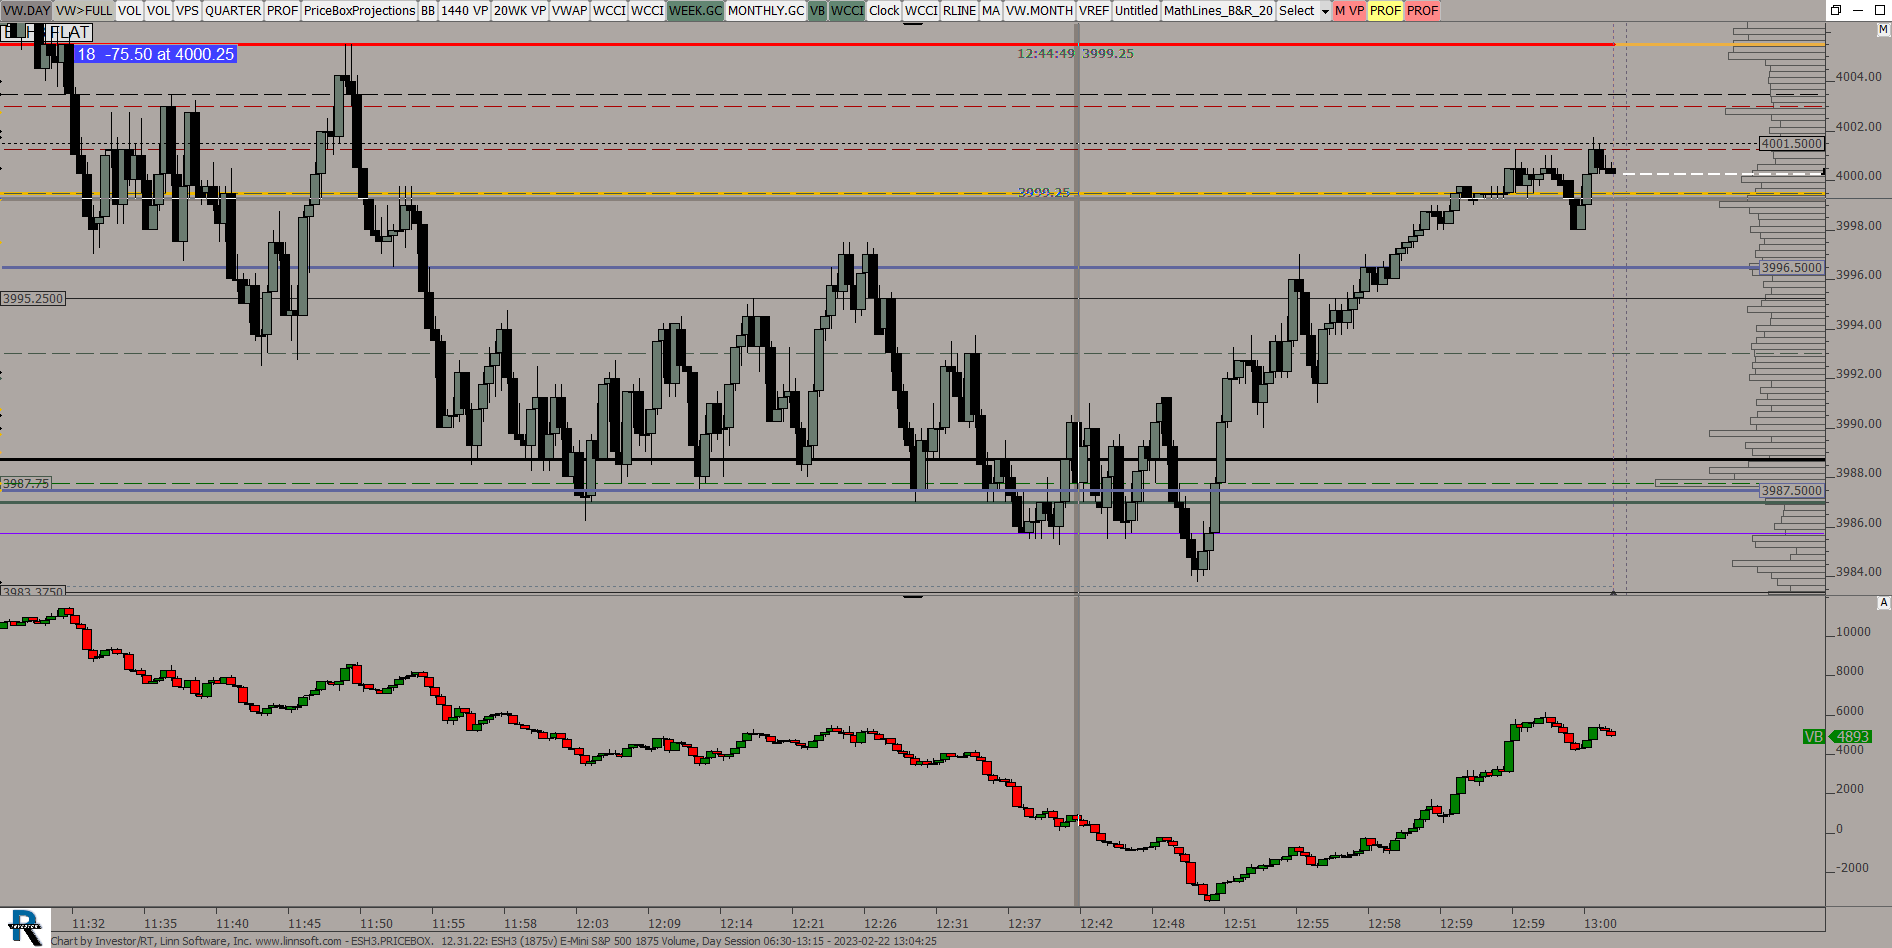 |
ESH3PRICEBOX (ESH3) ES42 [totalcount]
3 years 5 months ago
This chart was uploaded by Investor/RT 14.5.4 showing symbol: ESH3. |
View |
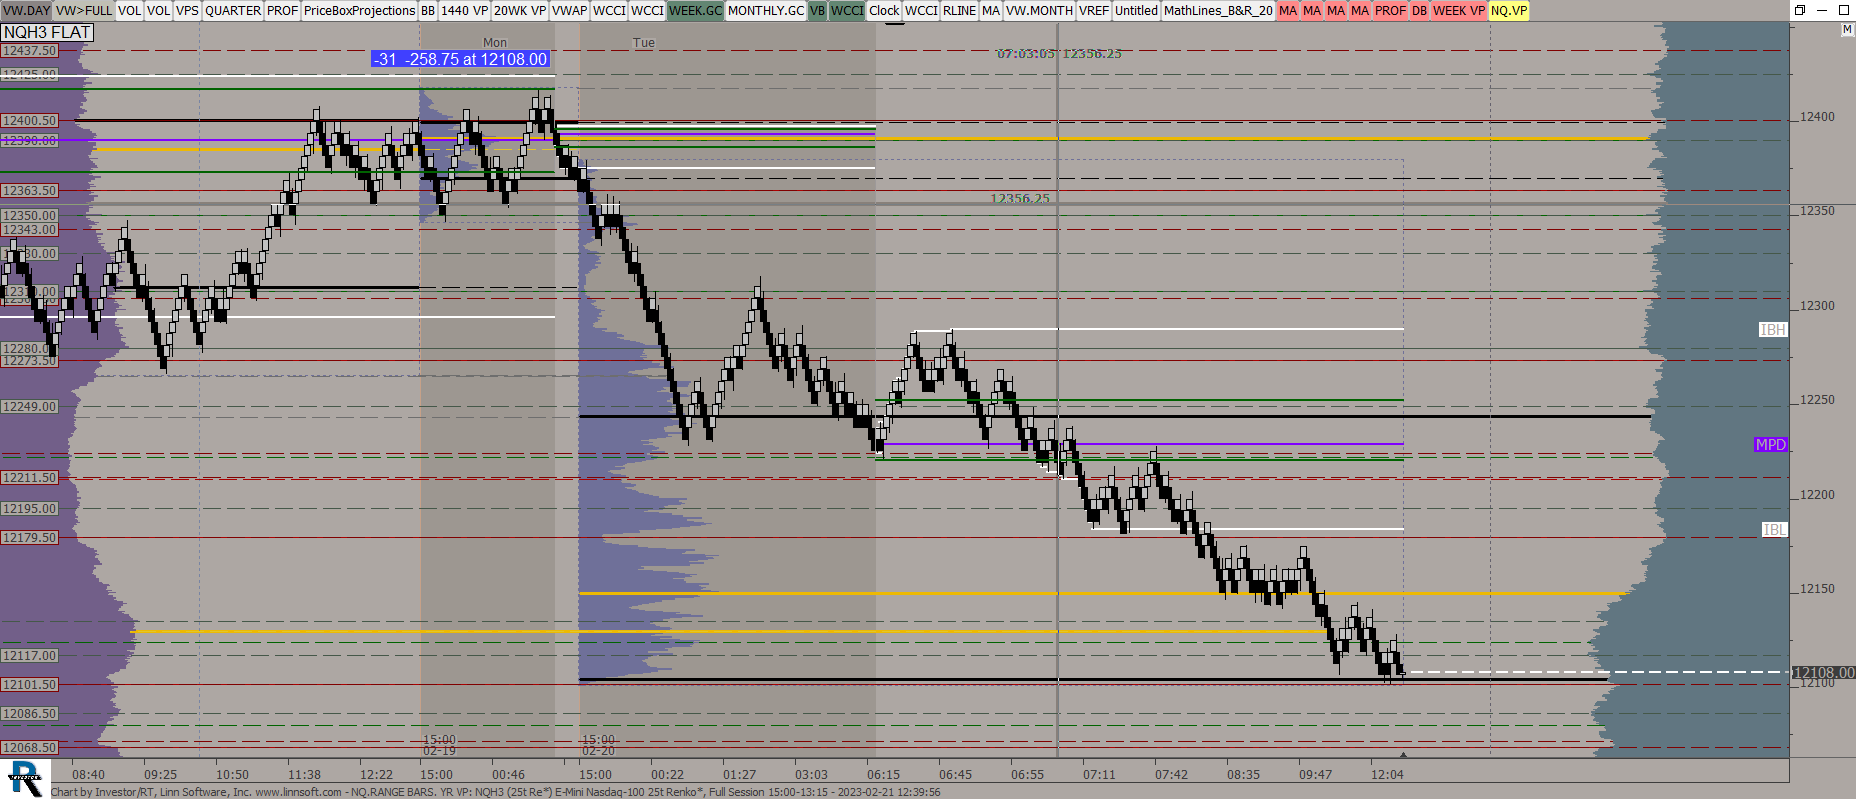 |
NQRANGE BARS YR VP (NQH3) ES42 [totalcount]
3 years 5 months ago
This chart was uploaded by Investor/RT 14.5.4 showing symbol: NQH3. |
View |
 |
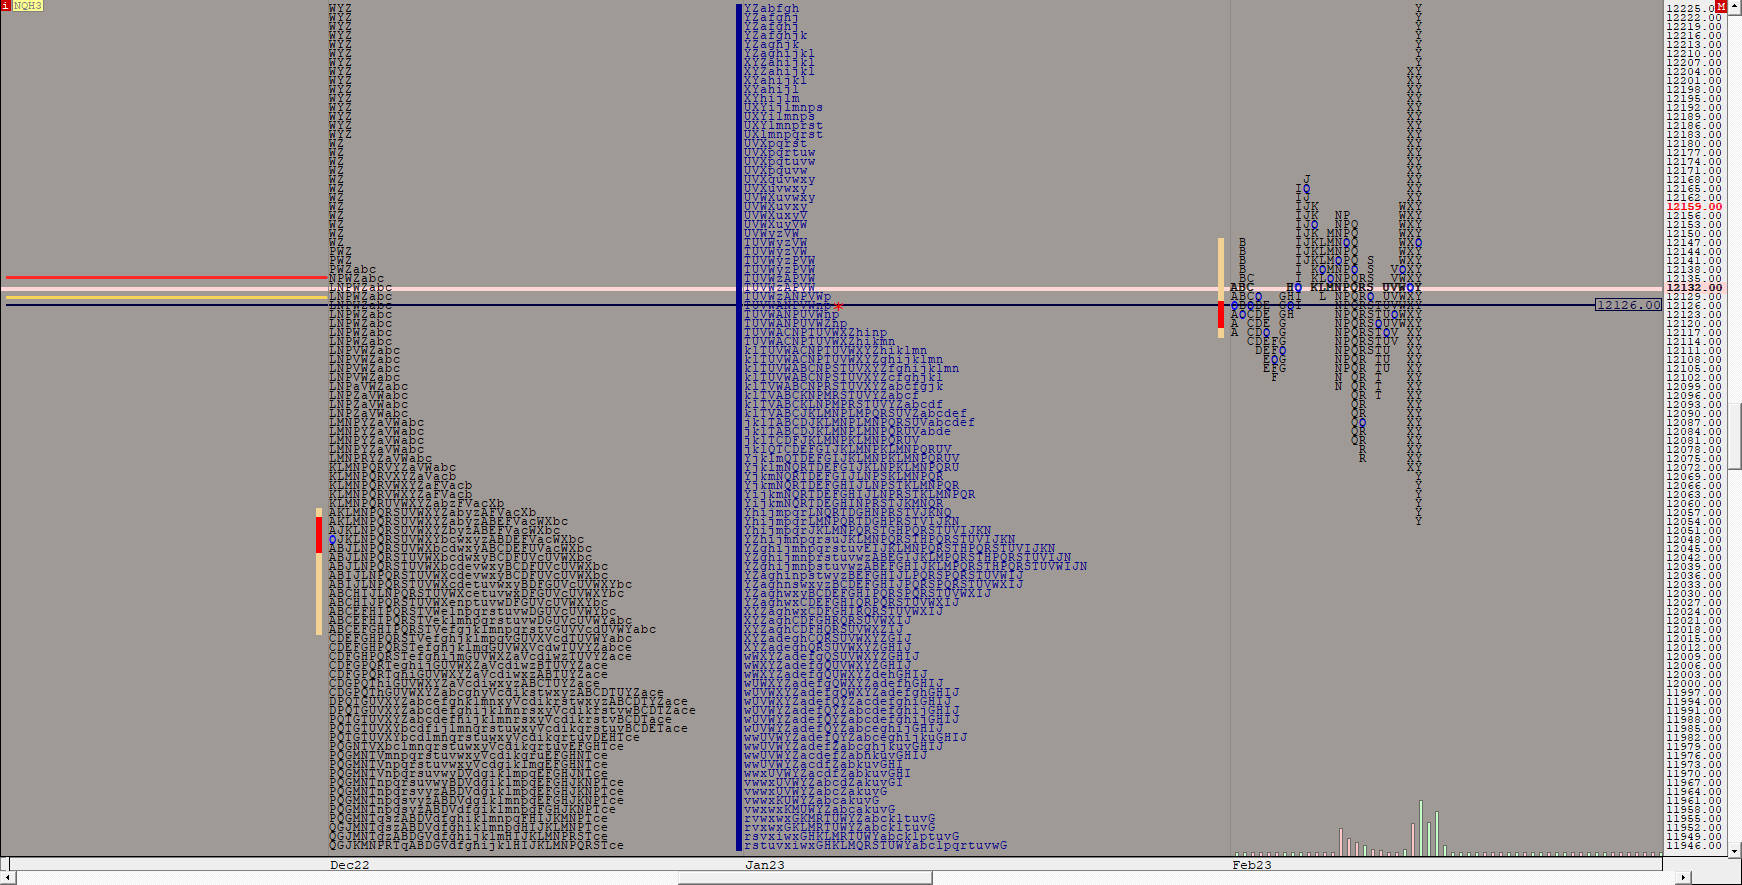
NQTPOWEEKLY (NQH3) ES42 [totalcount]
3 years 5 months ago
This chart was uploaded by Investor/RT 14.5.4 showing symbol: NQH3. |
View |
 |
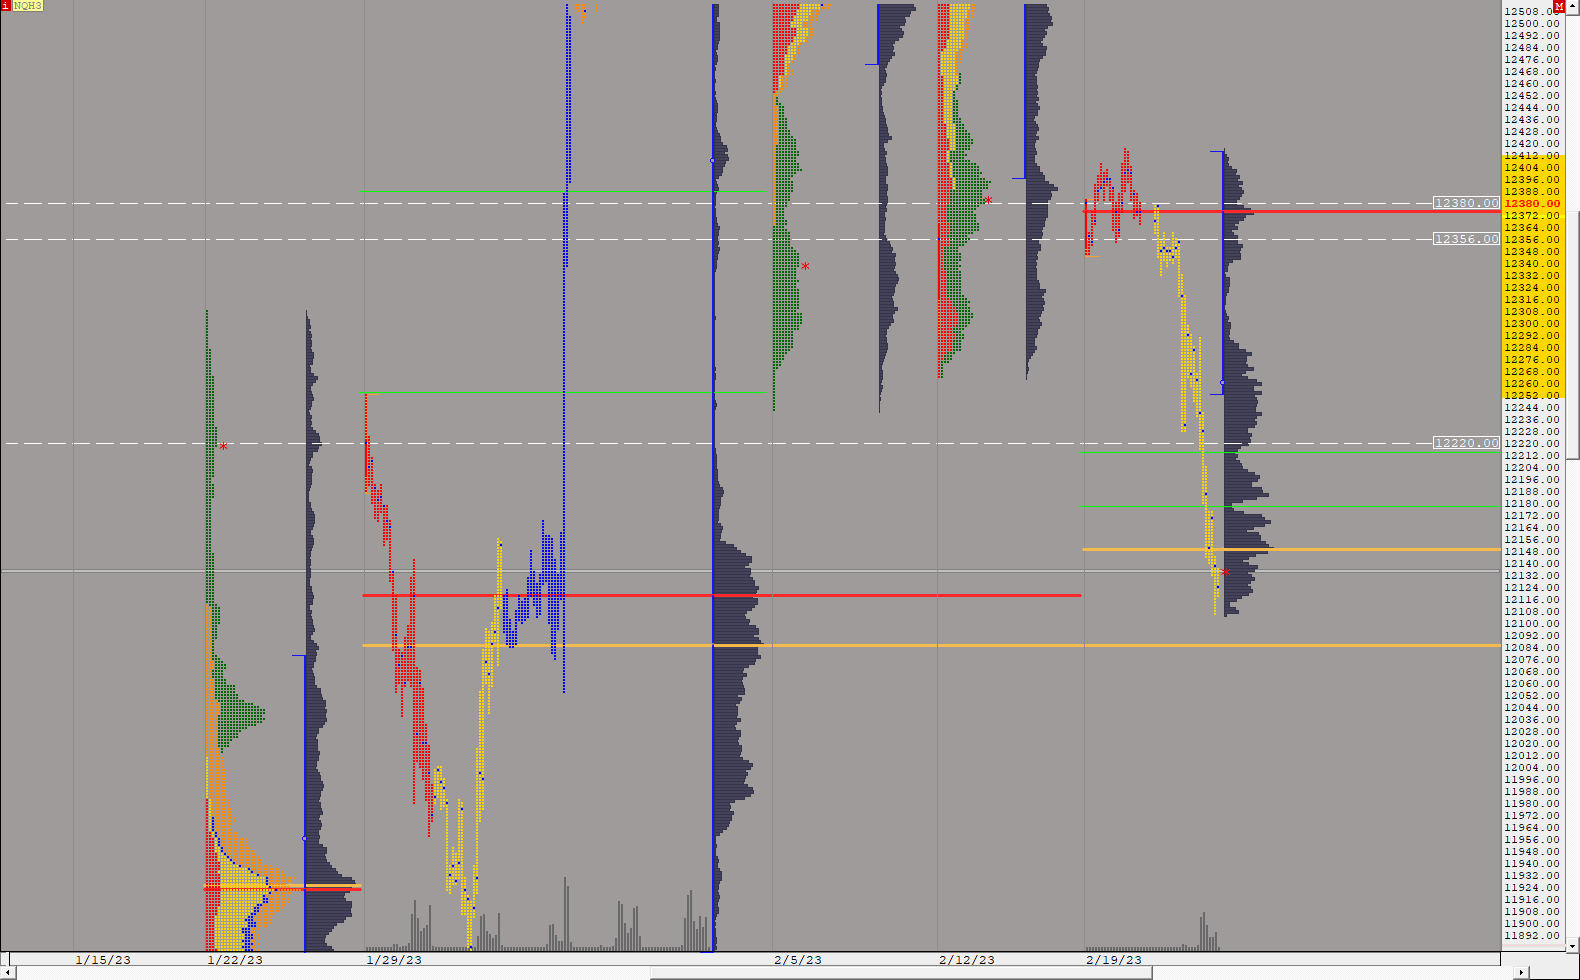
NQMONTHLY TPO (NQH3) ES42 [totalcount]
3 years 5 months ago
This chart was uploaded by Investor/RT 14.5.4 showing symbol: NQH3. |
View |
 |
ES24HROPEN ONLY (ESH3) ES42 [totalcount]
3 years 5 months ago
This chart was uploaded by Investor/RT 14.5.4 showing symbol: ESH3. |
View |
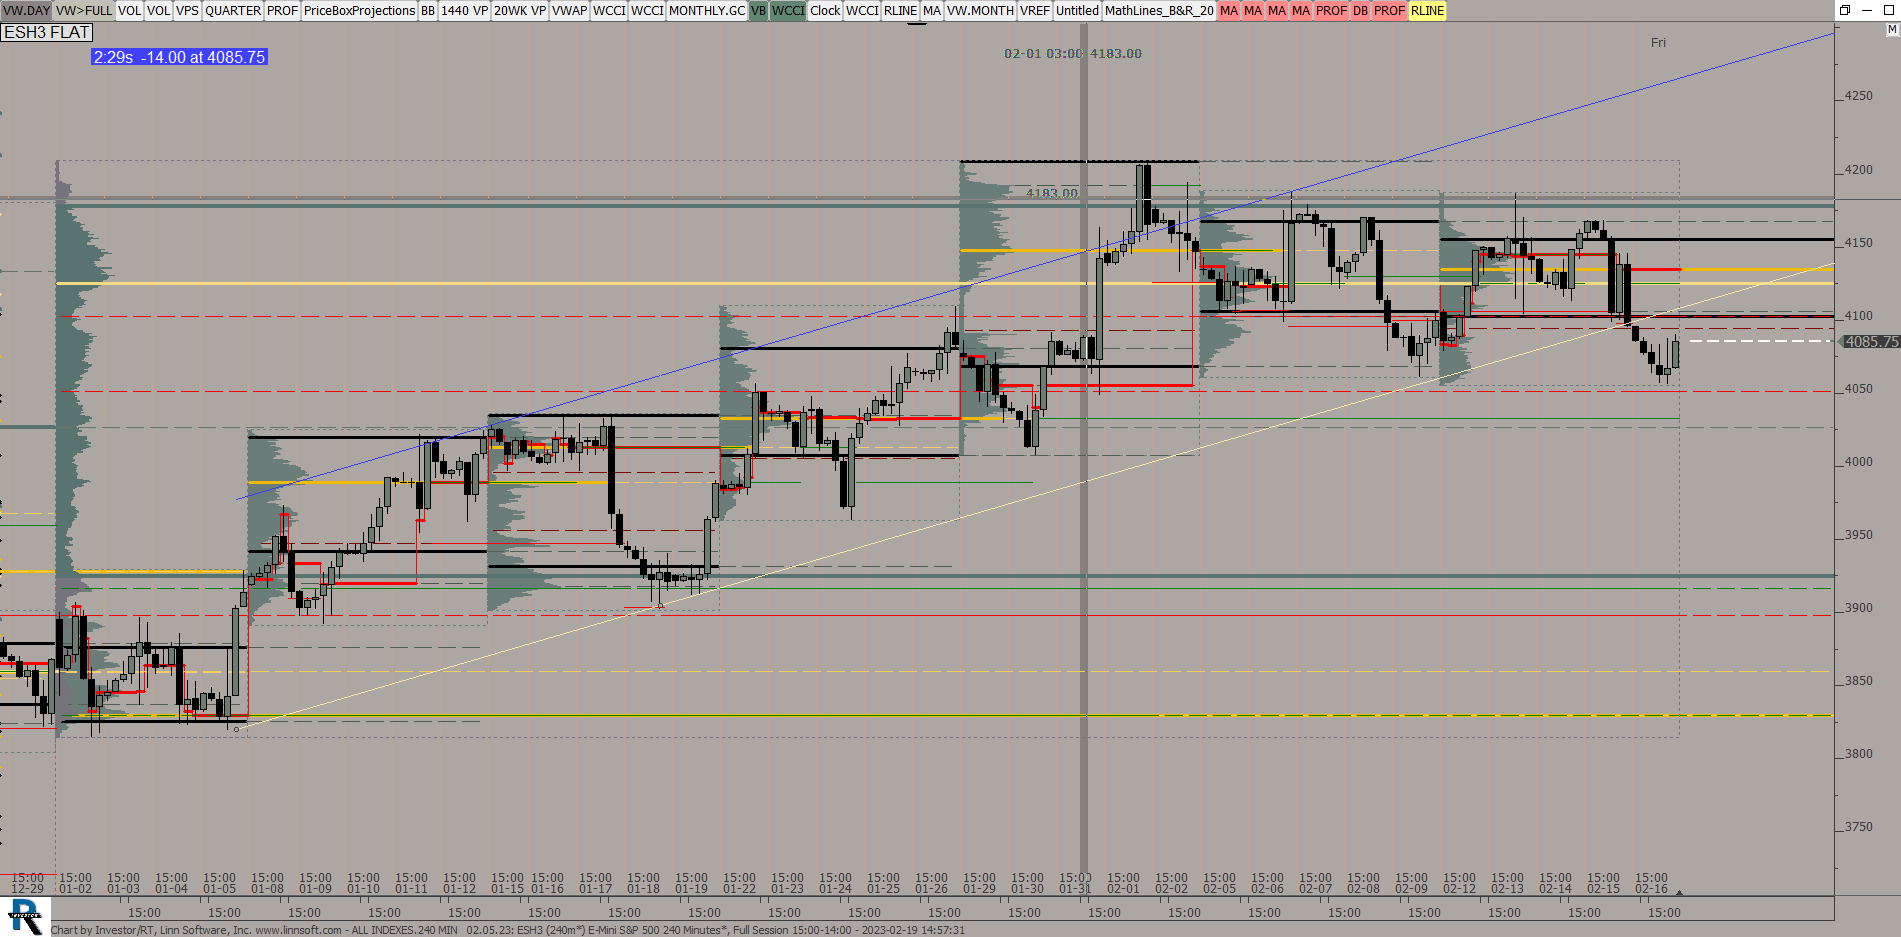 |
ALL INDEXES240 MIN (ESH3) ES42 [totalcount]
3 years 5 months ago
This chart was uploaded by Investor/RT 14.5.4 showing symbol: ESH3. |
View |
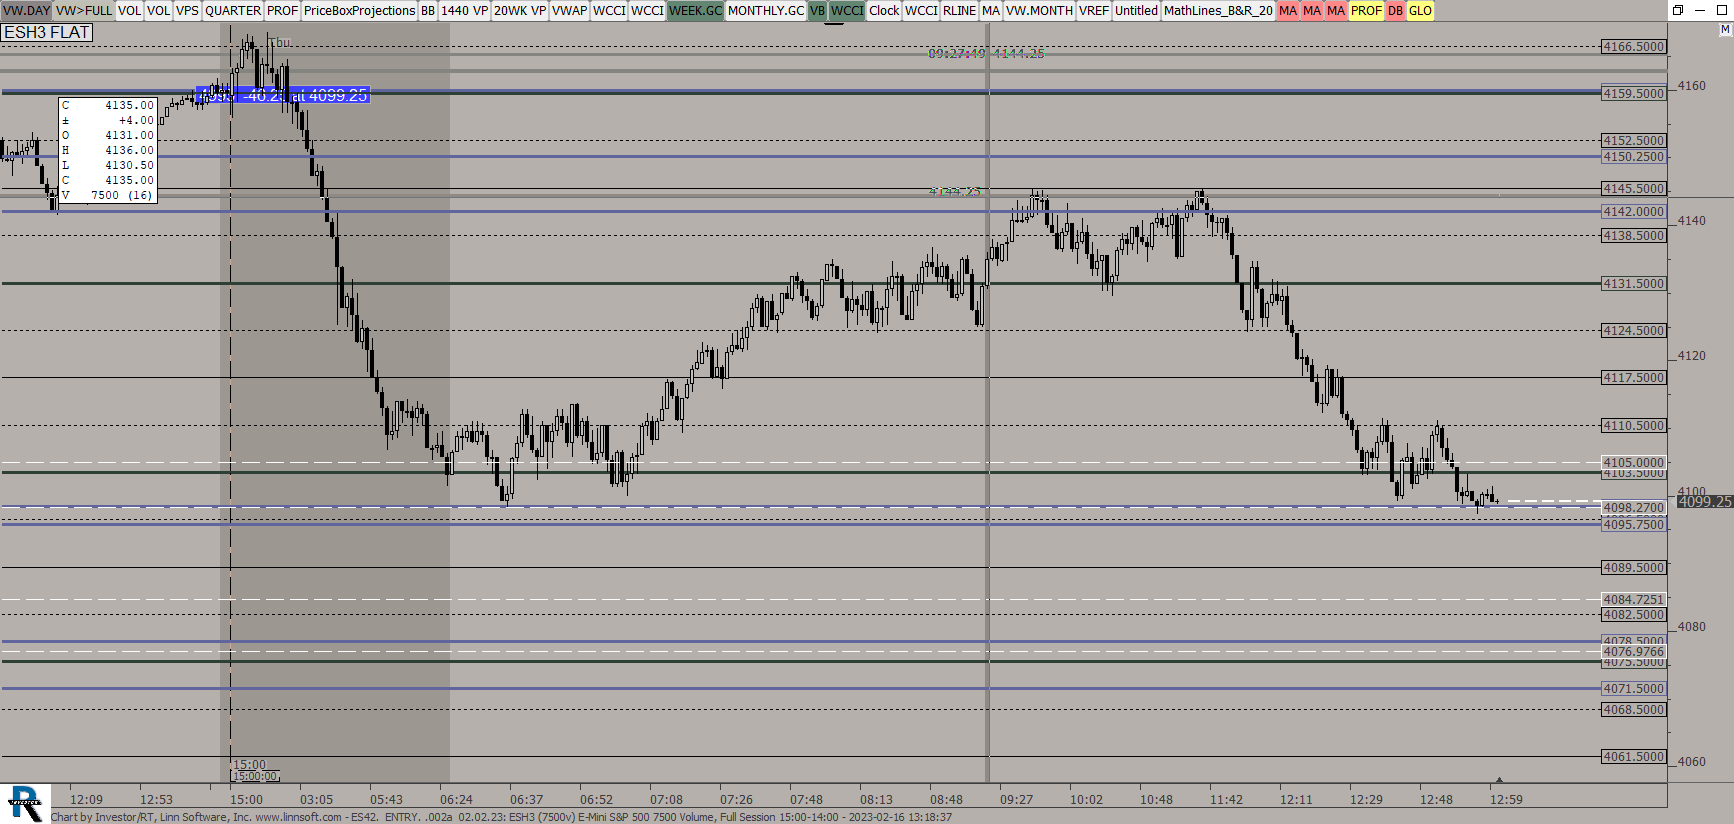 |
ES42 ENTRY 002a (ESH3) ES42 [totalcount]
3 years 5 months ago
This chart was uploaded by Investor/RT 14.5.4 showing symbol: ESH3. |
View |
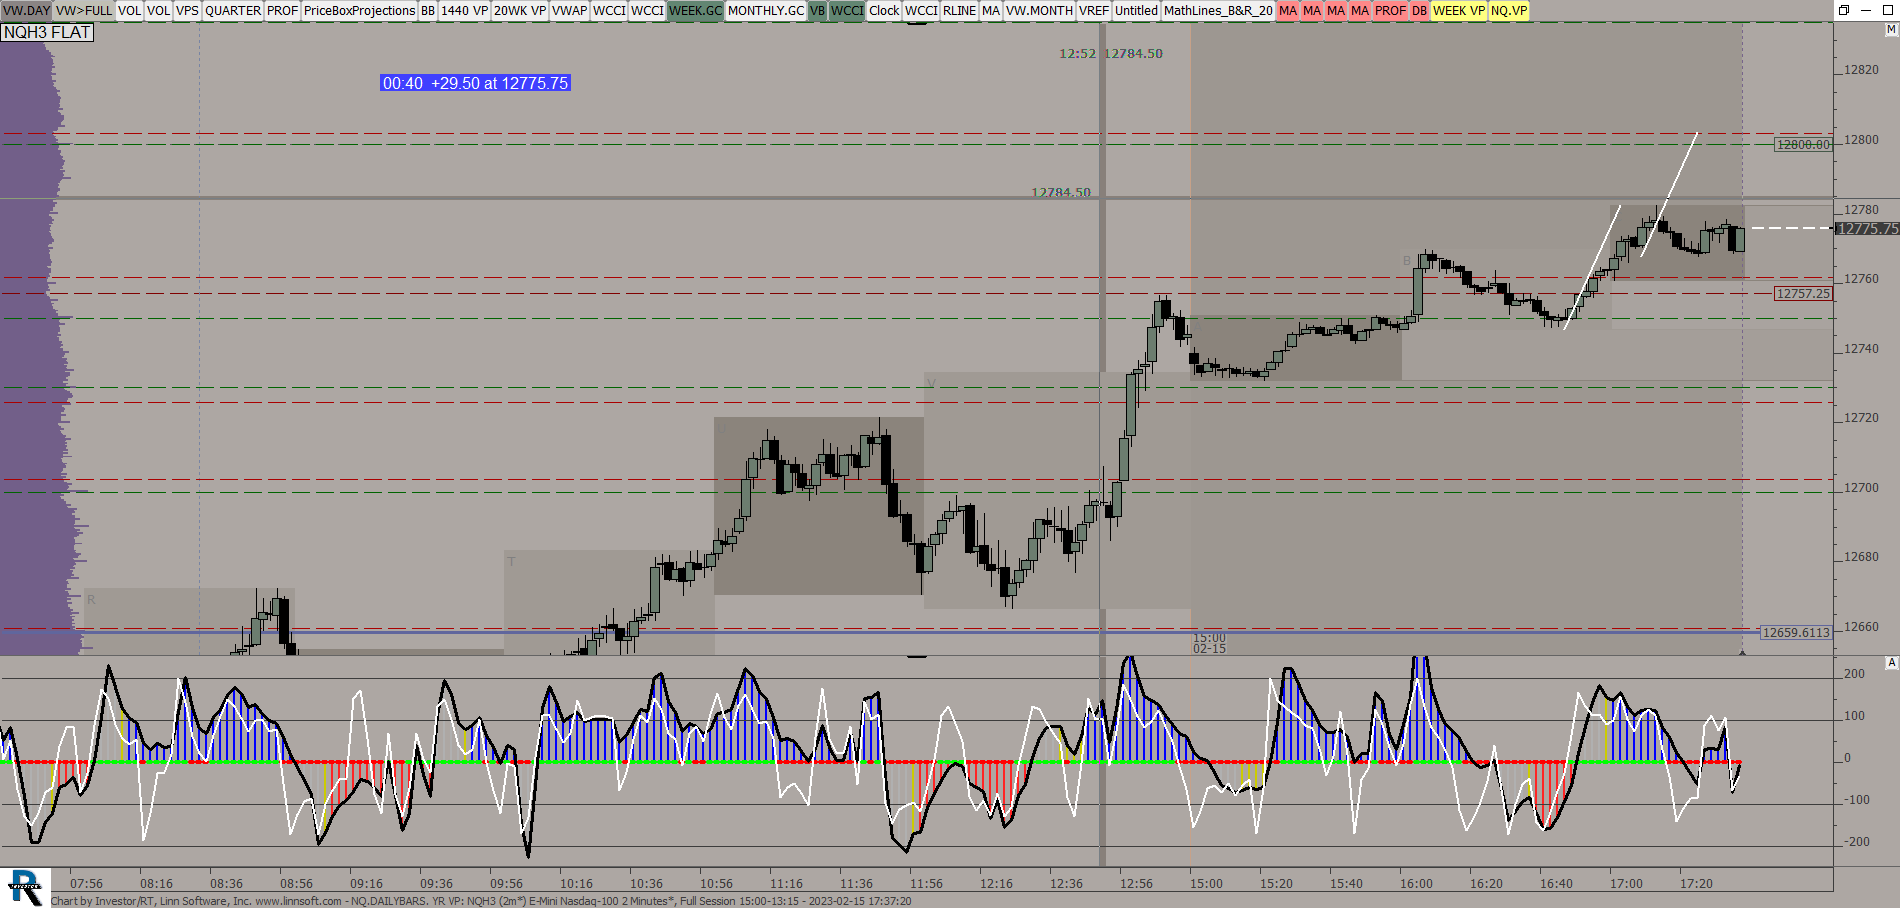 |
NQDAILYBARS YR VP (NQH3) ES42 [totalcount]
3 years 5 months ago
This chart was uploaded by Investor/RT 14.5.4 showing symbol: NQH3. |
View |
 |
ESH3Weekly VALUE ZONE (ESH3) ES42 [totalcount]
3 years 5 months ago
This chart was uploaded by Investor/RT 15.1.12 showing symbol: ESH3. |
View |
 |
ESGlobex GLO (ESH3) ES42 [totalcount]
3 years 5 months ago
This chart was uploaded by Investor/RT 14.5.4 showing symbol: ESH3. |
View |
 |
ESRTH ONLY GLO (ESH3) ES42 [totalcount]
3 years 5 months ago
This chart was uploaded by Investor/RT 14.5.4 showing symbol: ESH3. |
View |
 |
ESWEEKLY GLOONLY (ESH3) ES42 [totalcount]
3 years 5 months ago
This chart was uploaded by Investor/RT 14.5.4 showing symbol: ESH3. |
View |
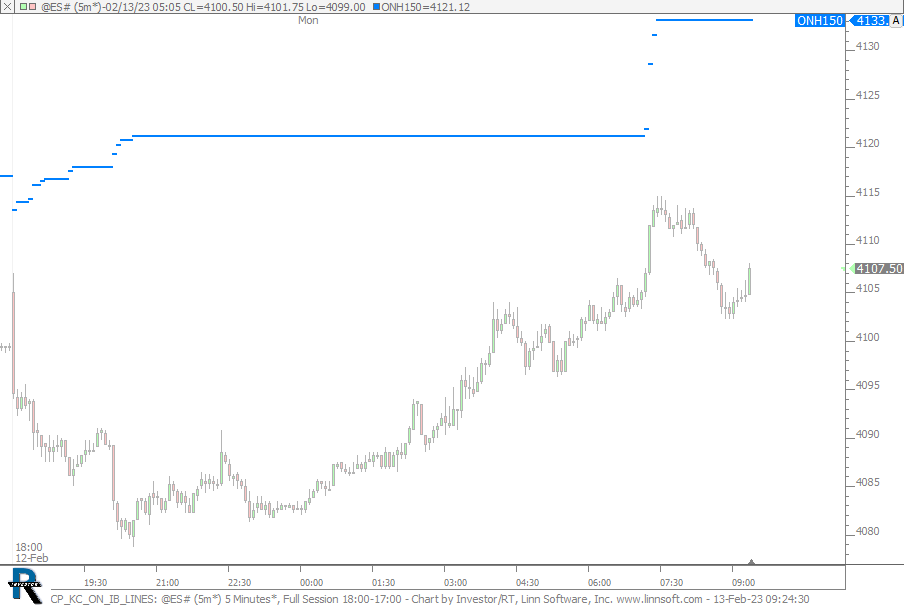 |
CP KC ON IB LINES (@ES#) cpayne [totalcount]
3 years 5 months ago
Overnight and IB Multiple Lines. This chart was uploaded by Investor/RT 15.1.15 showing symbol: @ES#. |
View |
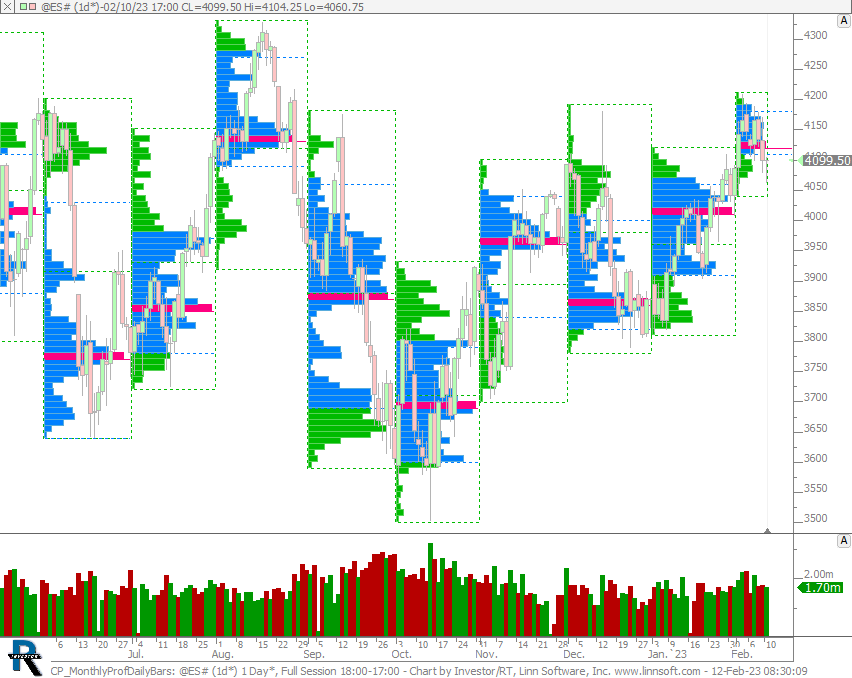 |
CP MonthlyProfDailyBars (@ES#) cpayne [totalcount]
3 years 5 months ago
Monthly Profiles Daily Bars. This chart was uploaded by Investor/RT 15.1.15 showing symbol: @ES#. |
View |
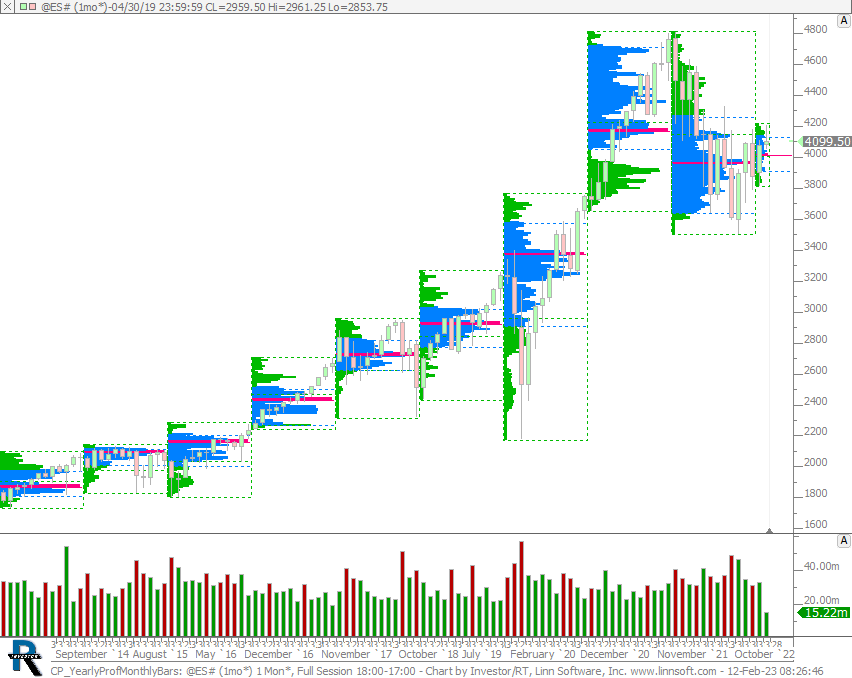 |
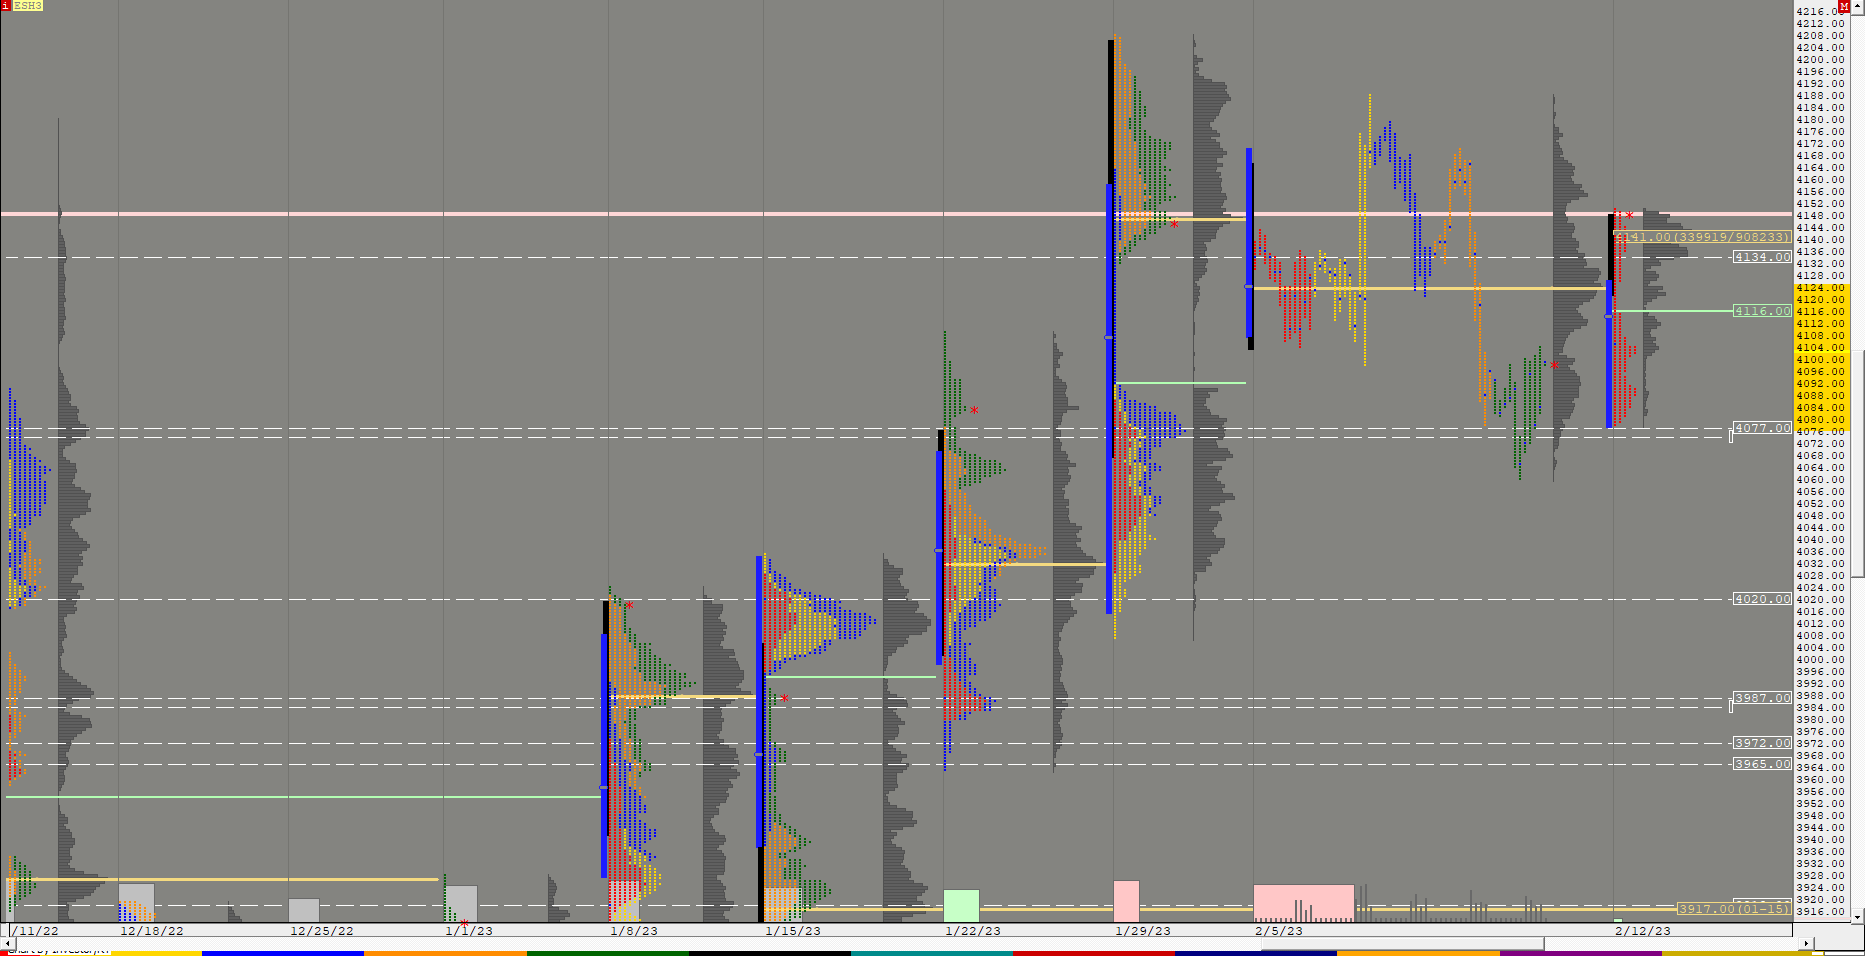
CP YearlyProfMonthlyBars (@ES#) cpayne [totalcount]
3 years 5 months ago
Yearly Profiles Monthly Bars. This chart was uploaded by Investor/RT 15.1.15 showing symbol: @ES#. |
View |
 |
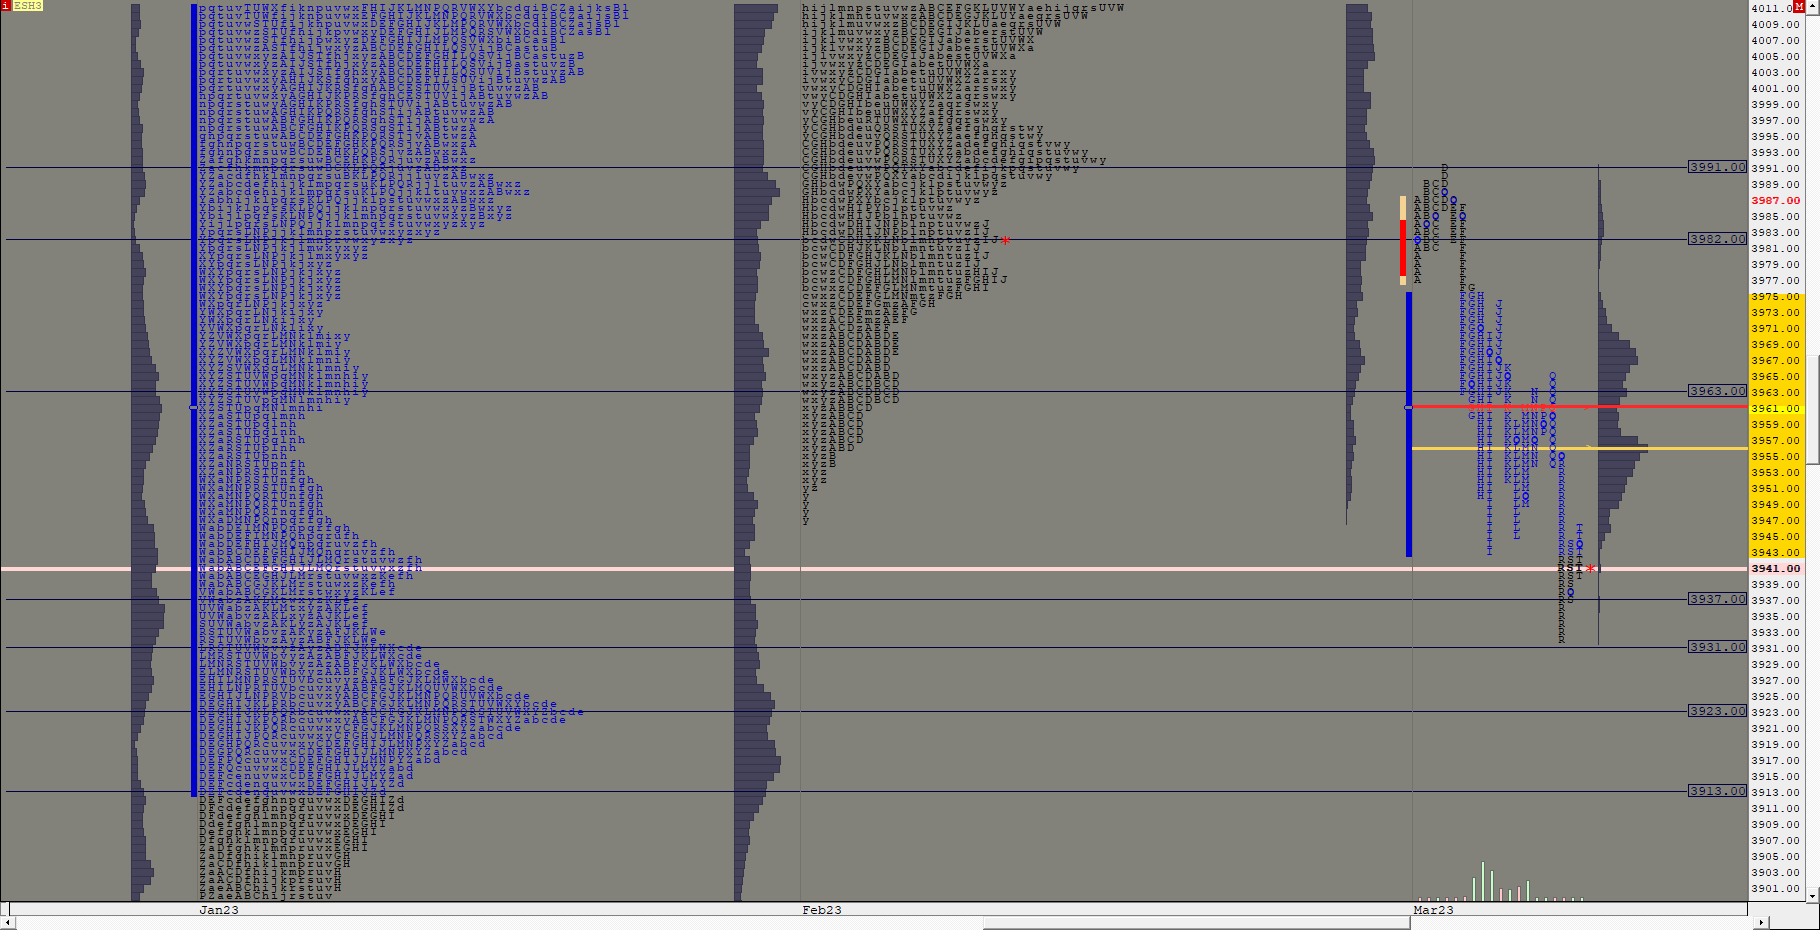
TEST TPO (ESH3) ES42 [totalcount]
3 years 5 months ago
This chart was uploaded by Investor/RT 14.5.4 showing symbol: ESH3. |
View |
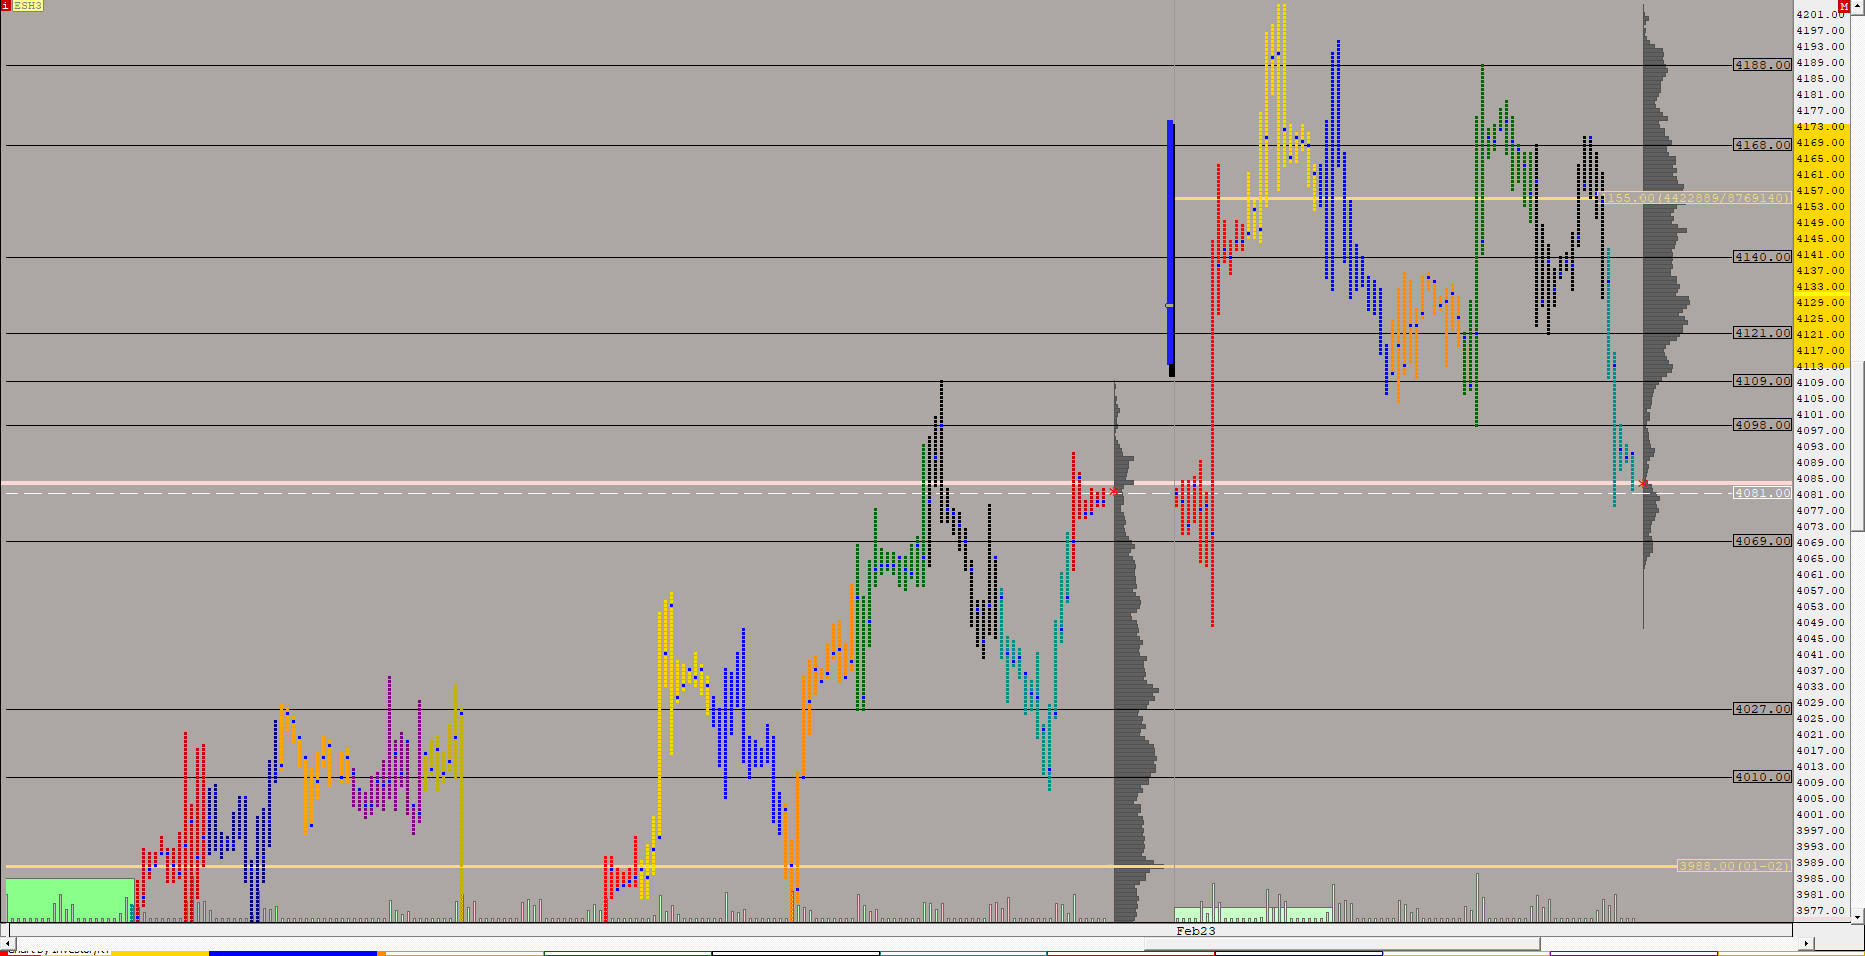 |
ESMONTHLY TPO (ESH3) ES42 [totalcount]
3 years 5 months ago
This chart was uploaded by Investor/RT 14.5.4 showing symbol: ESH3. |
View |