 |
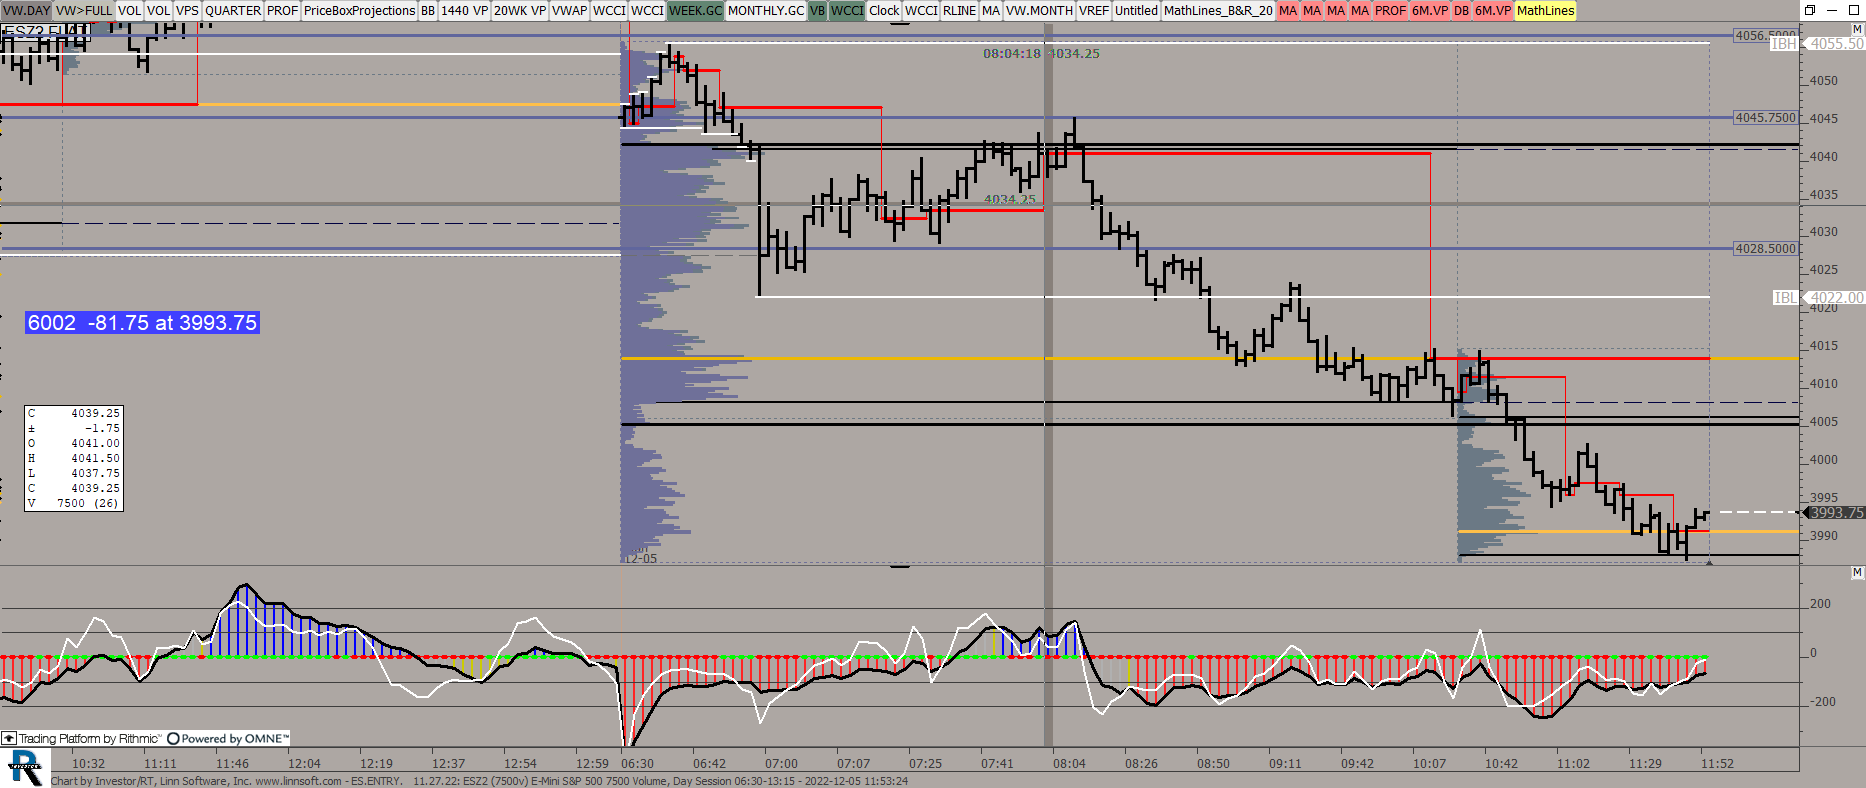
ESENTRY (ESZ2) ES42 [totalcount]
3 years 7 months ago
This chart was uploaded by Investor/RT 15.1.12 showing symbol: ESZ2. |
View |
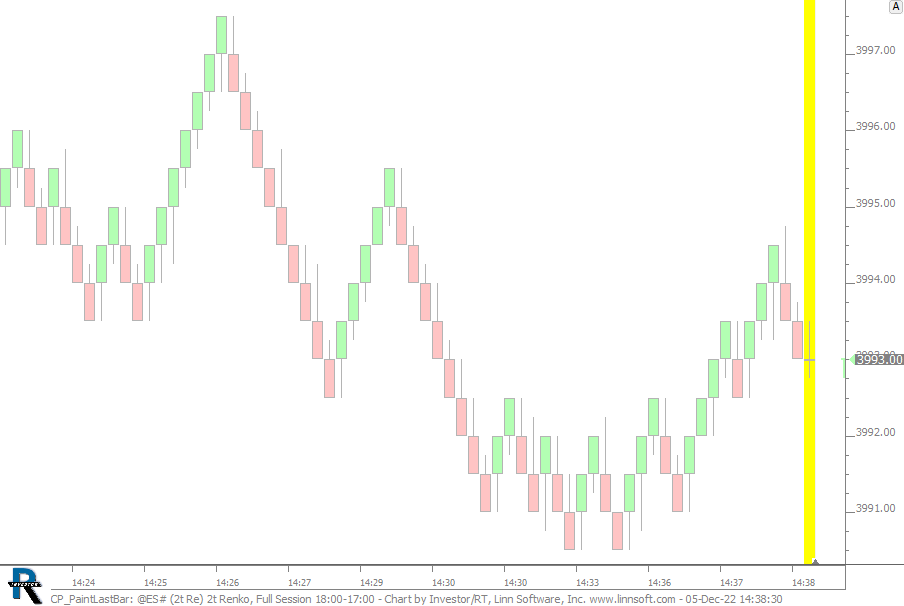 |
CP PaintLastBar (@ES#) cpayne [totalcount]
3 years 7 months ago
This chart was uploaded by Investor/RT 15.1.12 showing symbol: @ES#. |
View |
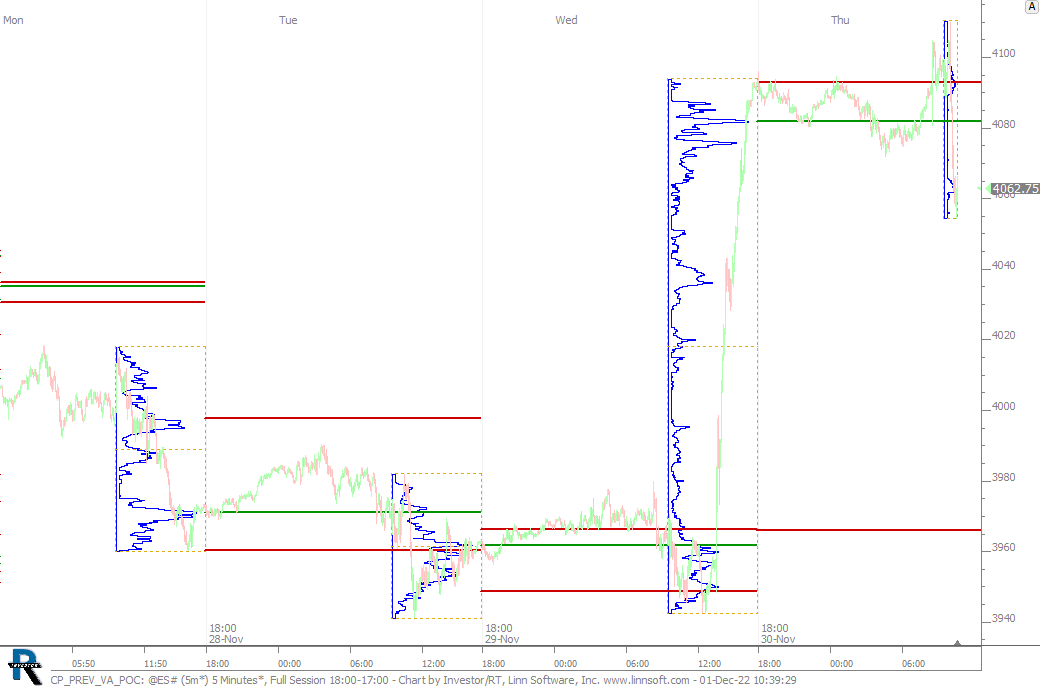 |
CP PREV VA POC (@ES#) cpayne [totalcount]
3 years 8 months ago
This chart was uploaded by Investor/RT 15.1.12 showing symbol: @ES#. |
View |
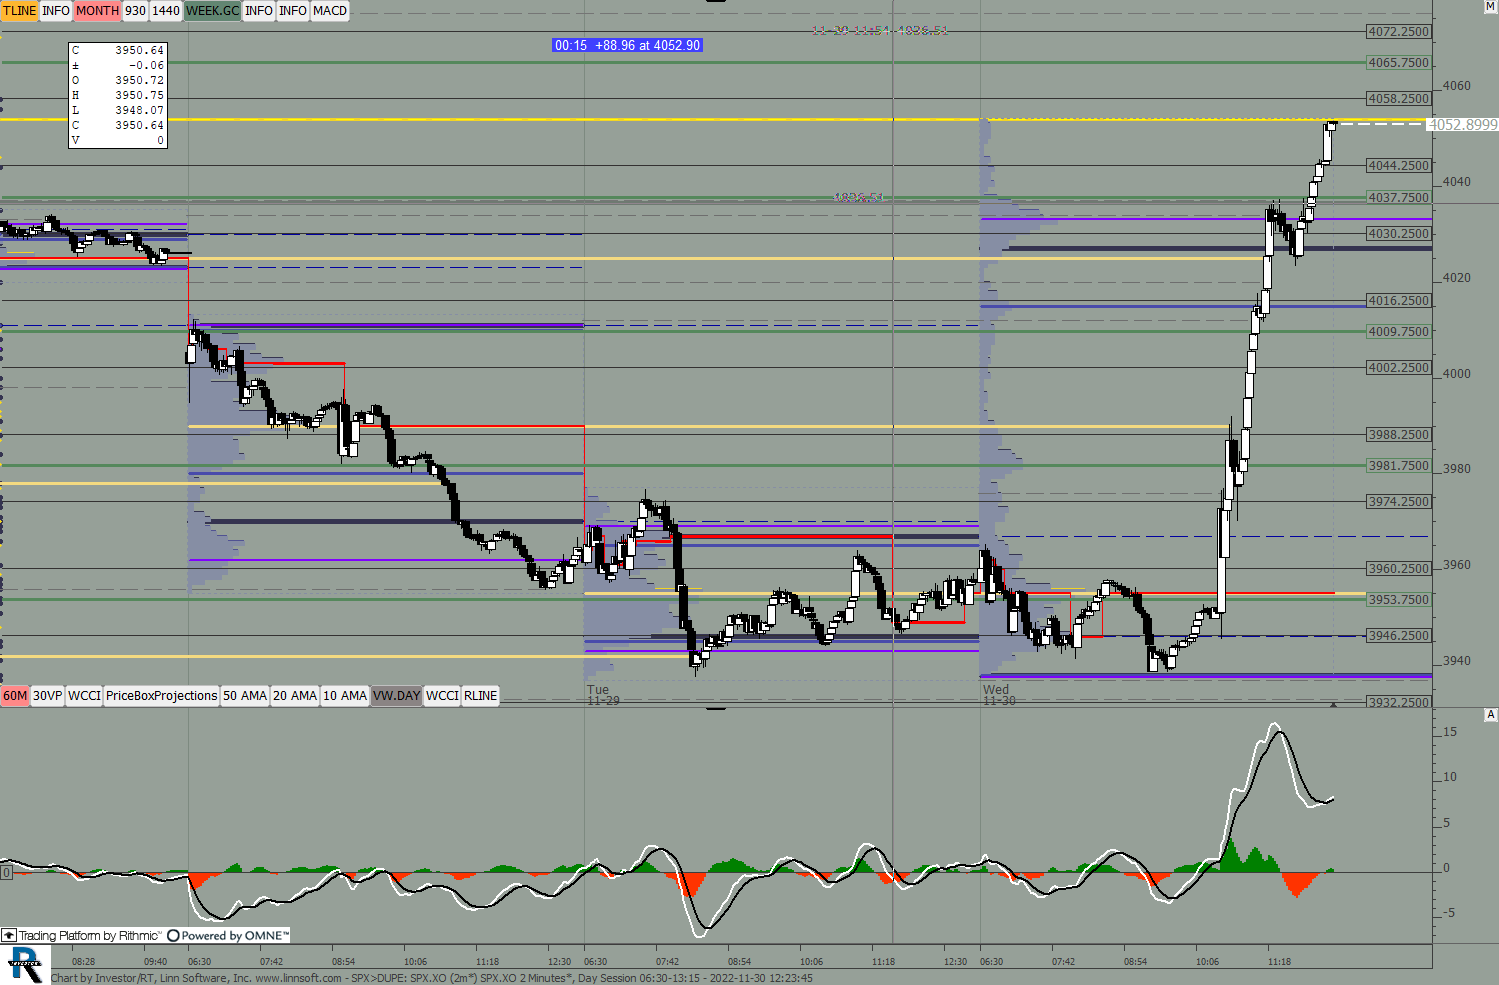 |
SPXDUPE (SPX.XO) ES42 [totalcount]
3 years 8 months ago
This chart was uploaded by Investor/RT 15.1.12 showing symbol: SPX.XO. |
View |
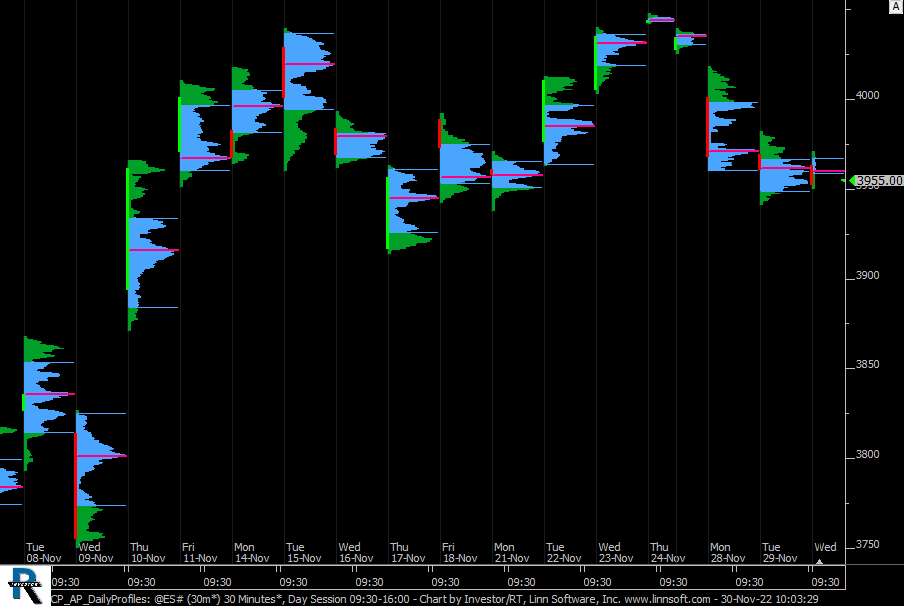 |
CP AP DailyProfiles (@ES#) cpayne [totalcount]
3 years 8 months ago
Daily Profiles - Simple. This chart was uploaded by Investor/RT 15.1.12 showing symbol: @ES#. |
View |
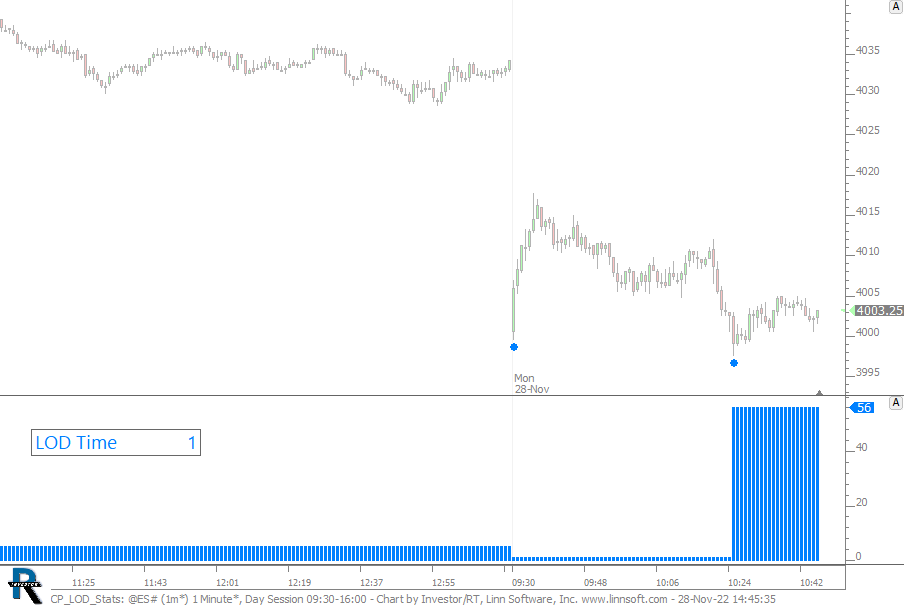 |
CP LOD Stats (@ES#) cpayne [totalcount]
3 years 8 months ago
Time of Day that LOD was put in... This chart was uploaded by Investor/RT 15.1.12 showing symbol: @ES#. |
View |
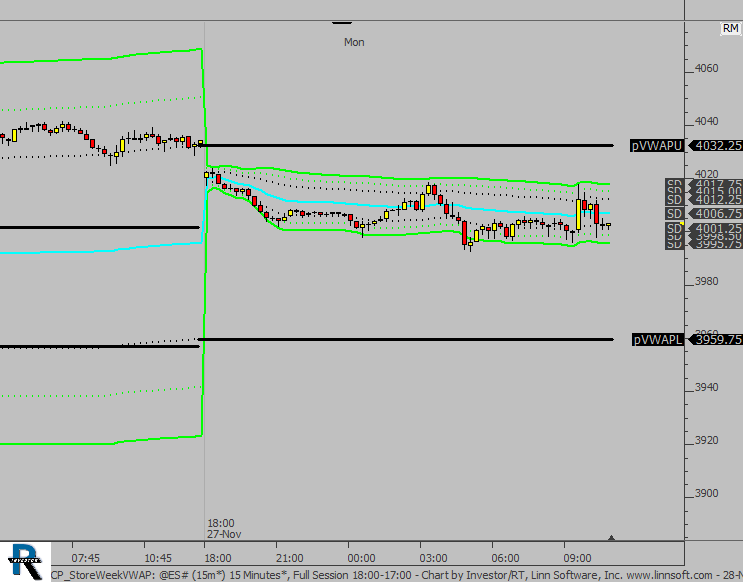 |
CP StoreWeekVWAP (@ES#) cpayne [totalcount]
3 years 8 months ago
Previous Weekly VWAPU. This chart was uploaded by Investor/RT 15.1.12 showing symbol: @ES#. |
View |
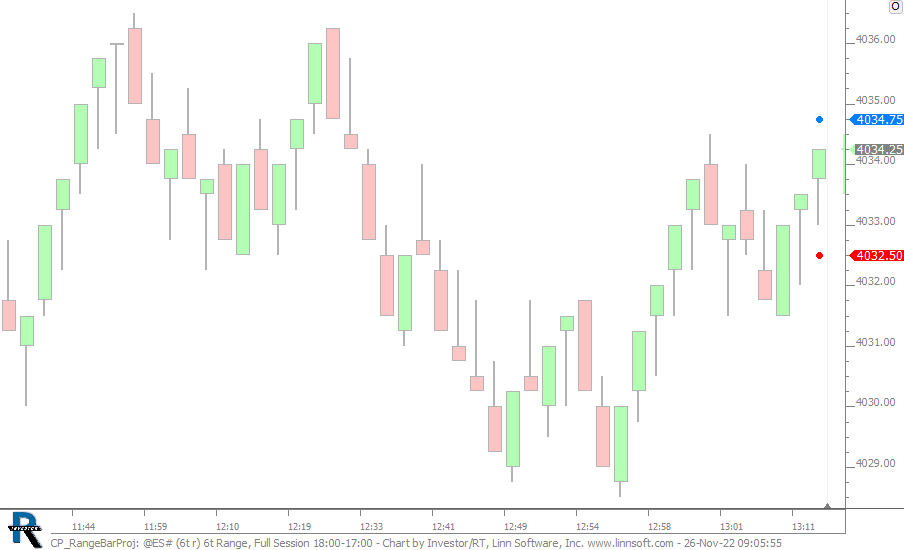 |
CP RangeBarProj (@ES#) cpayne [totalcount]
3 years 8 months ago
Projects open of next rangebar in both directions. This chart was uploaded by Investor/RT 15.1.12 showing symbol: @ES#. |
View |
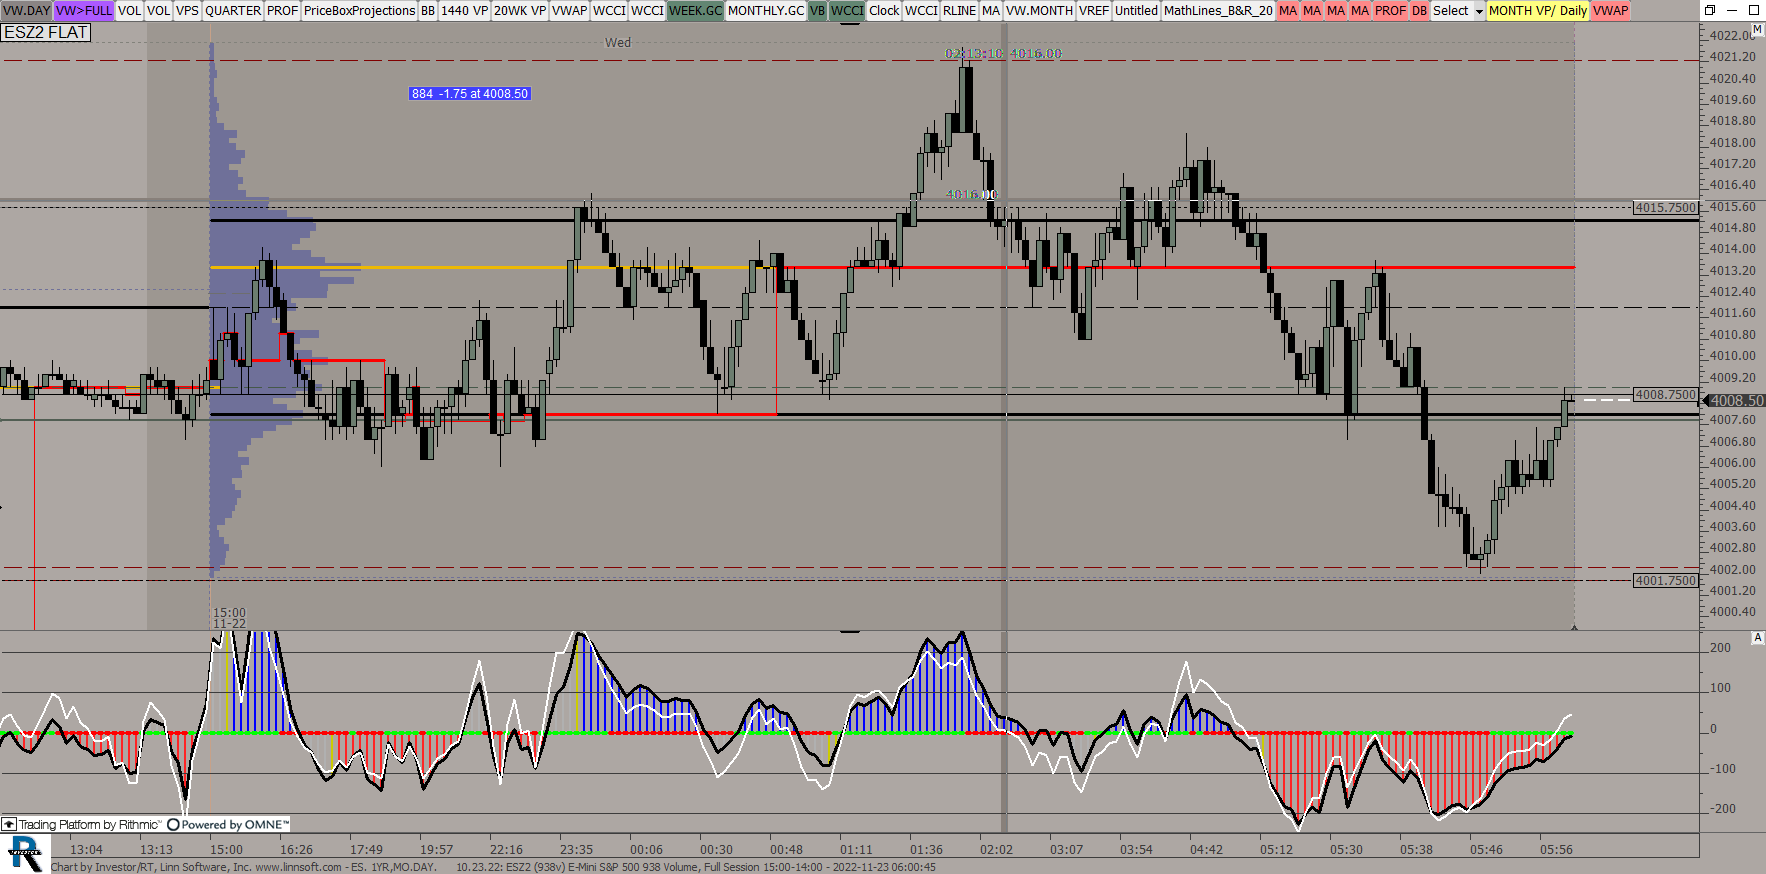 |
ES 1YRMODAY (ESZ2) ES42 [totalcount]
3 years 8 months ago
This chart was uploaded by Investor/RT 15.1.12 showing symbol: ESZ2. |
View |
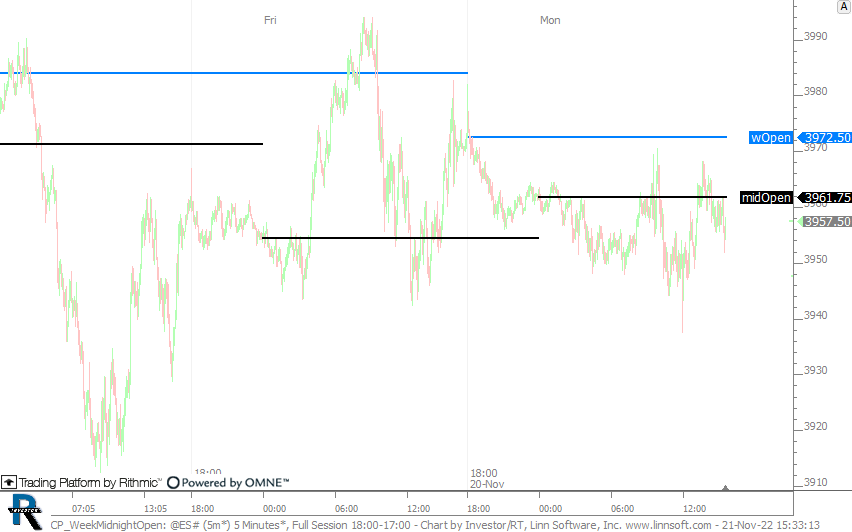 |
CP WeekMidnightOpen (@ES#) cpayne [totalcount]
3 years 8 months ago
Open of week, and midnight bar. This chart was uploaded by Investor/RT 15.1.12 showing symbol: @ES#. |
View |
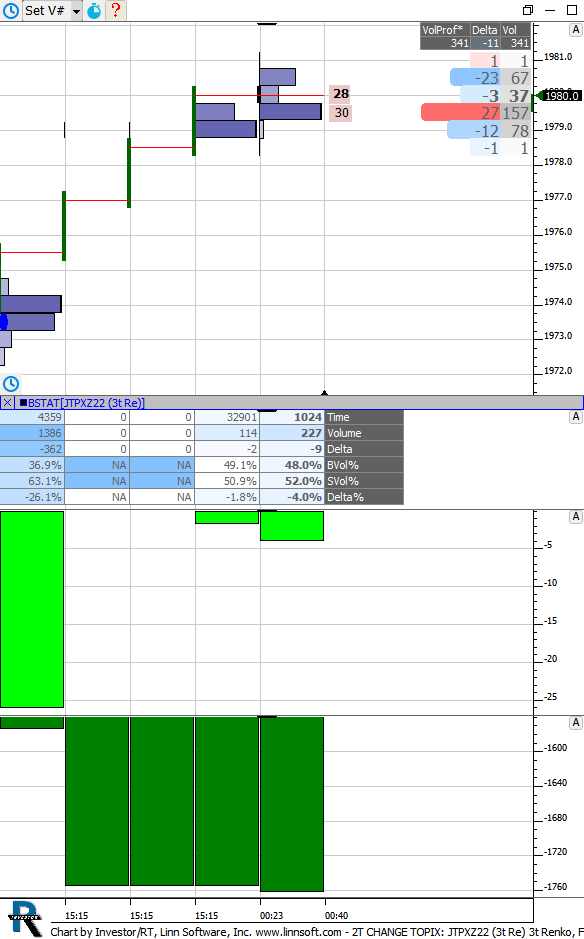 |
2T CHANGE TOPIX (JTPXZ22) Hitoshi Kosaki [totalcount]
3 years 8 months ago
This chart was uploaded by Investor/RT 14.5.4 showing symbol: JTPXZ22. |
View |
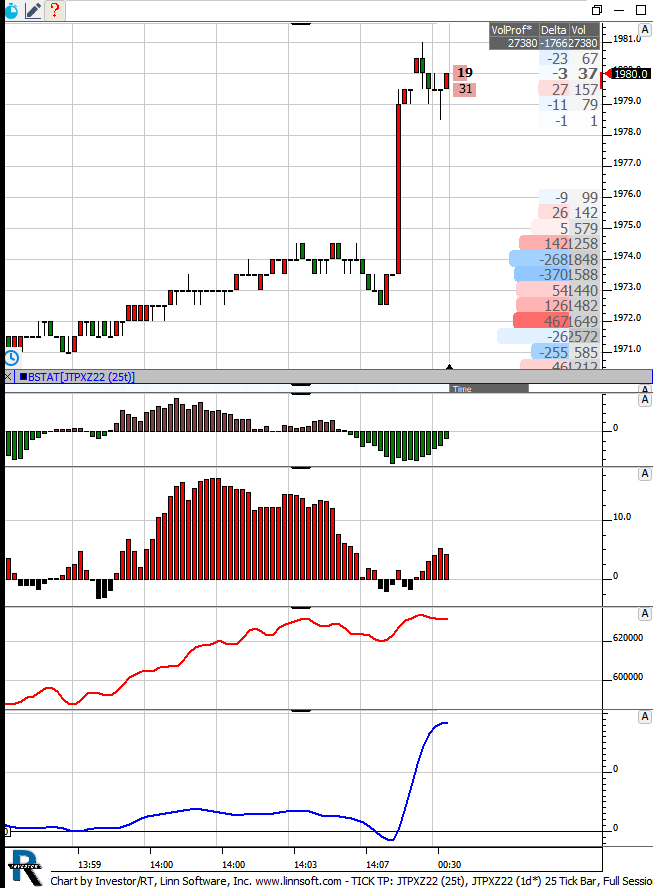 |
TICK TP (JTPXZ22) Hitoshi Kosaki [totalcount]
3 years 8 months ago
This chart was uploaded by Investor/RT 14.5.4 showing symbol: JTPXZ22. |
View |
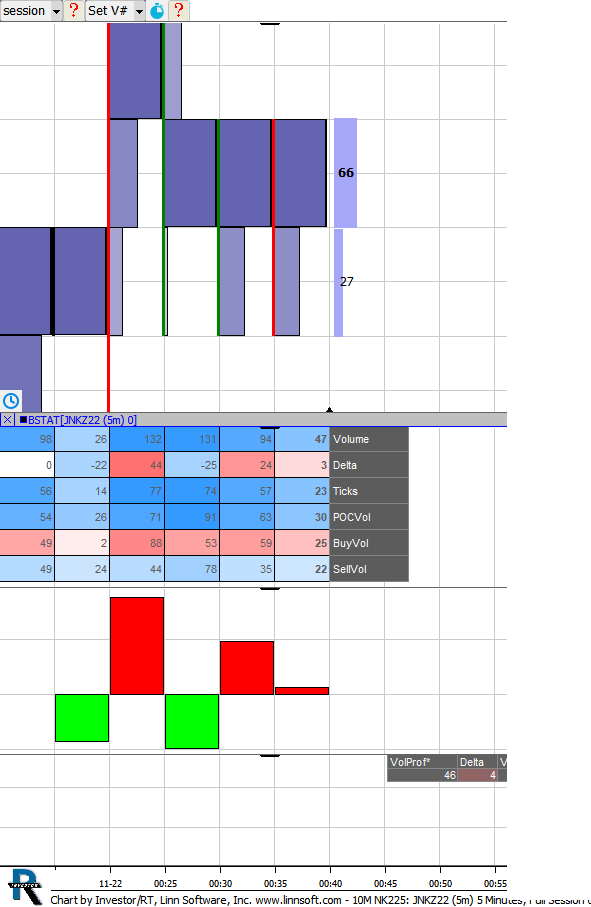 |
10M NK225 (JNKZ22) Hitoshi Kosaki [totalcount]
3 years 8 months ago
This chart was uploaded by Investor/RT 14.5.4 showing symbol: JNKZ22. |
View |
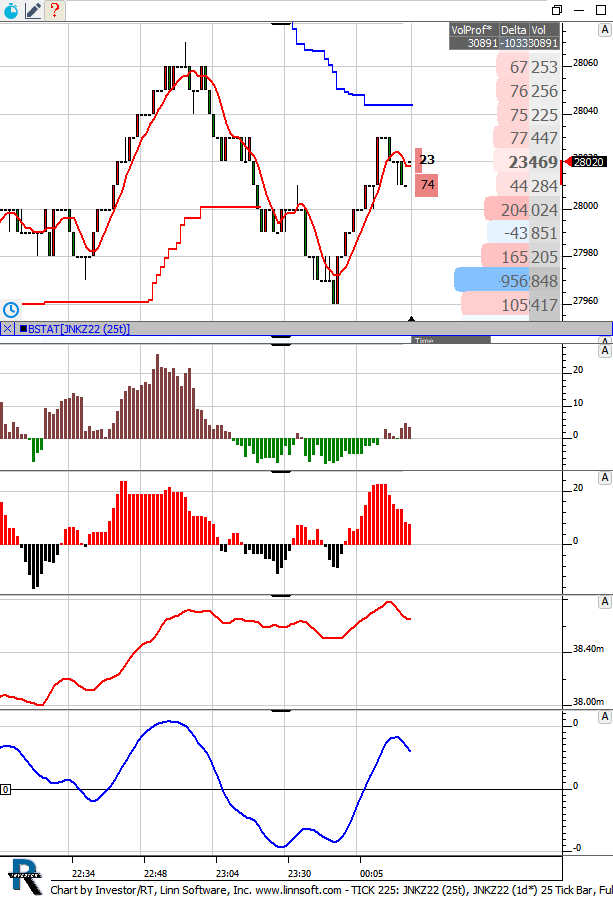 |
TICK 225 (JNKZ22) Hitoshi Kosaki [totalcount]
3 years 8 months ago
This chart was uploaded by Investor/RT 14.5.4 showing symbol: JNKZ22. |
View |
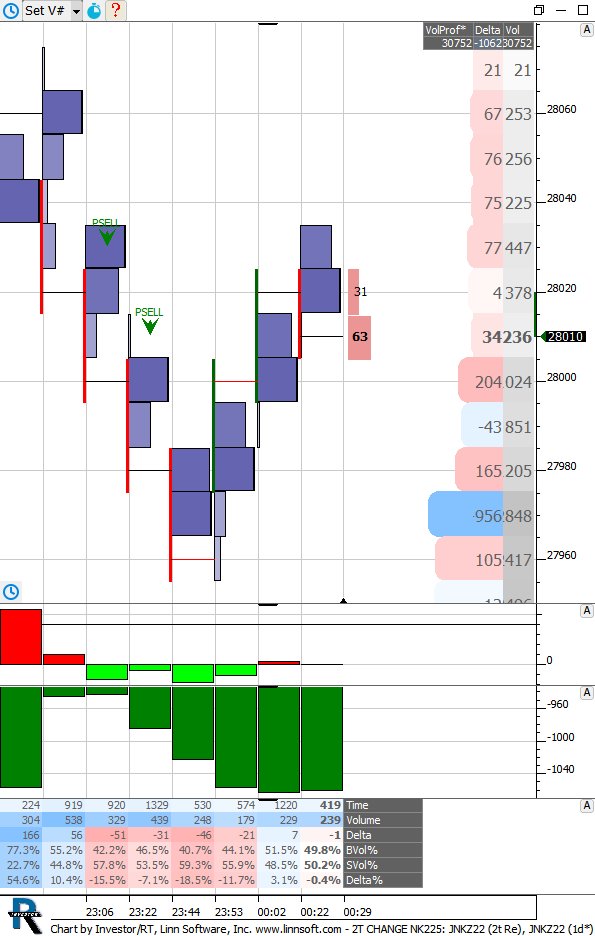 |
2T CHANGE NK225 (JNKZ22) Hitoshi Kosaki [totalcount]
3 years 8 months ago
This chart was uploaded by Investor/RT 14.5.4 showing symbol: JNKZ22. |
View |
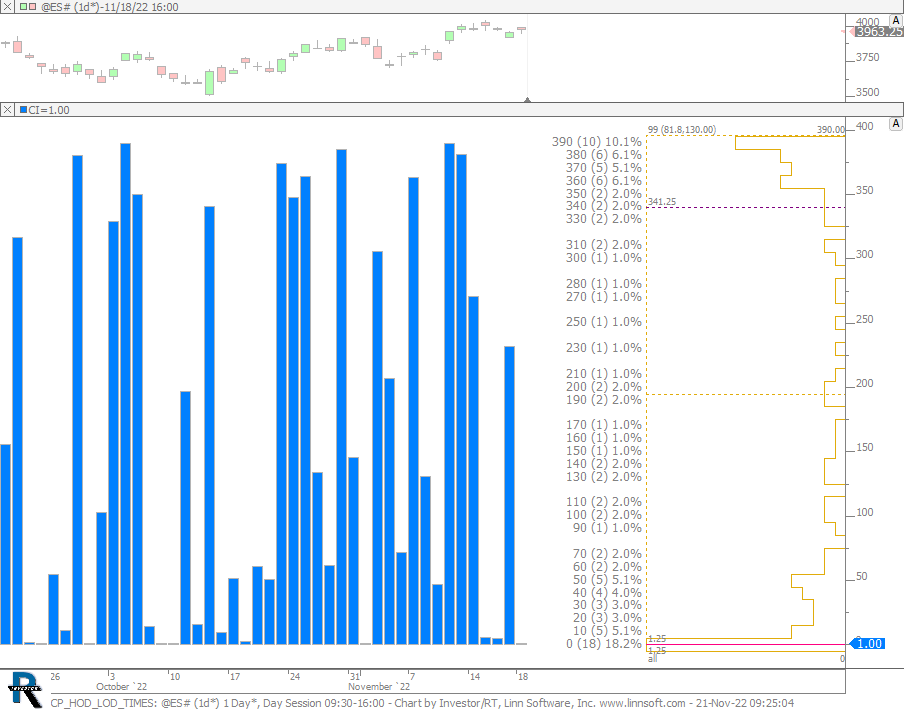 |
CP HOD LOD TIMES (@ES#) cpayne [totalcount]
3 years 8 months ago
This chart was uploaded by Investor/RT 15.1.12 showing symbol: @ES#. |
View |
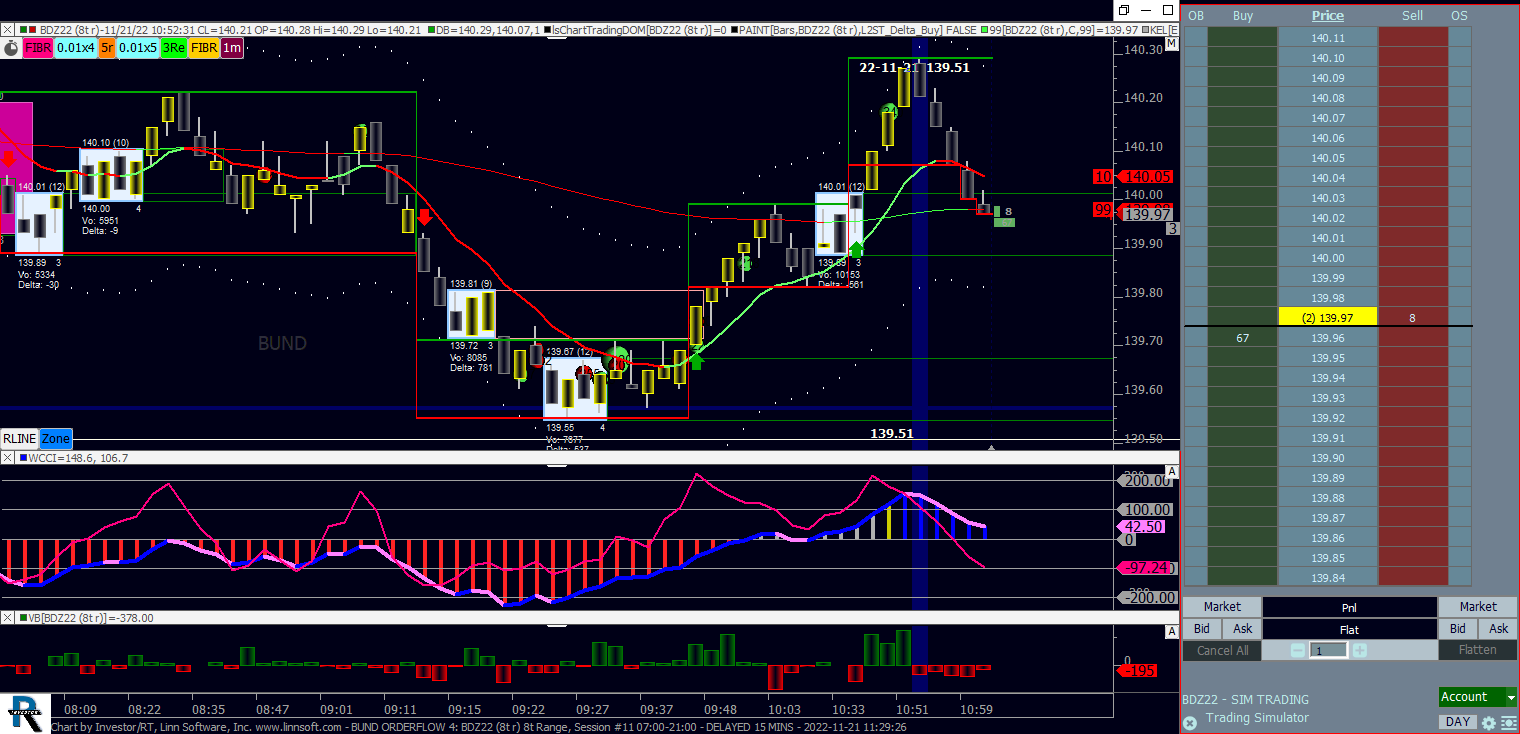 |
BUND ORDERFLOW 4 (BDZ22) joseph.cusworth [totalcount]
3 years 8 months ago
vision for tomorrow. Market opens and find buyers around the 94's, trades up and through the zipper to the 21's. Stalls there then carries on through to th 30's. |
View |
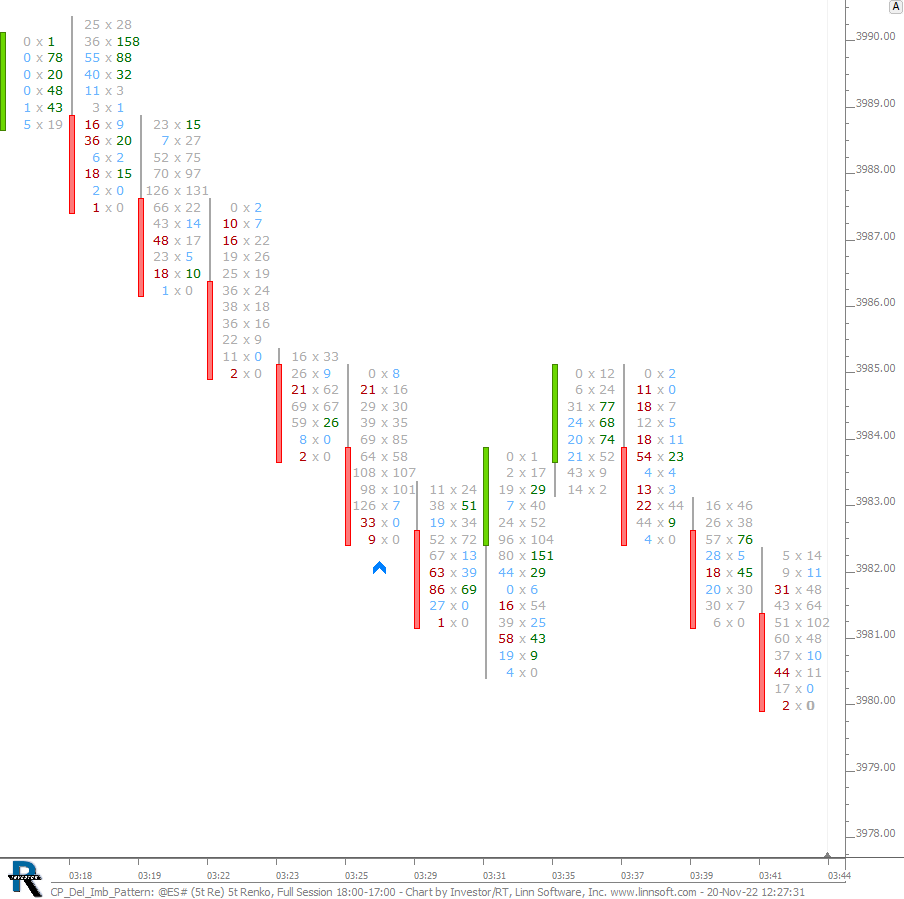 |
CP Del Imb Pattern (@ES#) cpayne [totalcount]
3 years 8 months ago
This chart was uploaded by Investor/RT 15.1.12 showing symbol: @ES#. |
View |
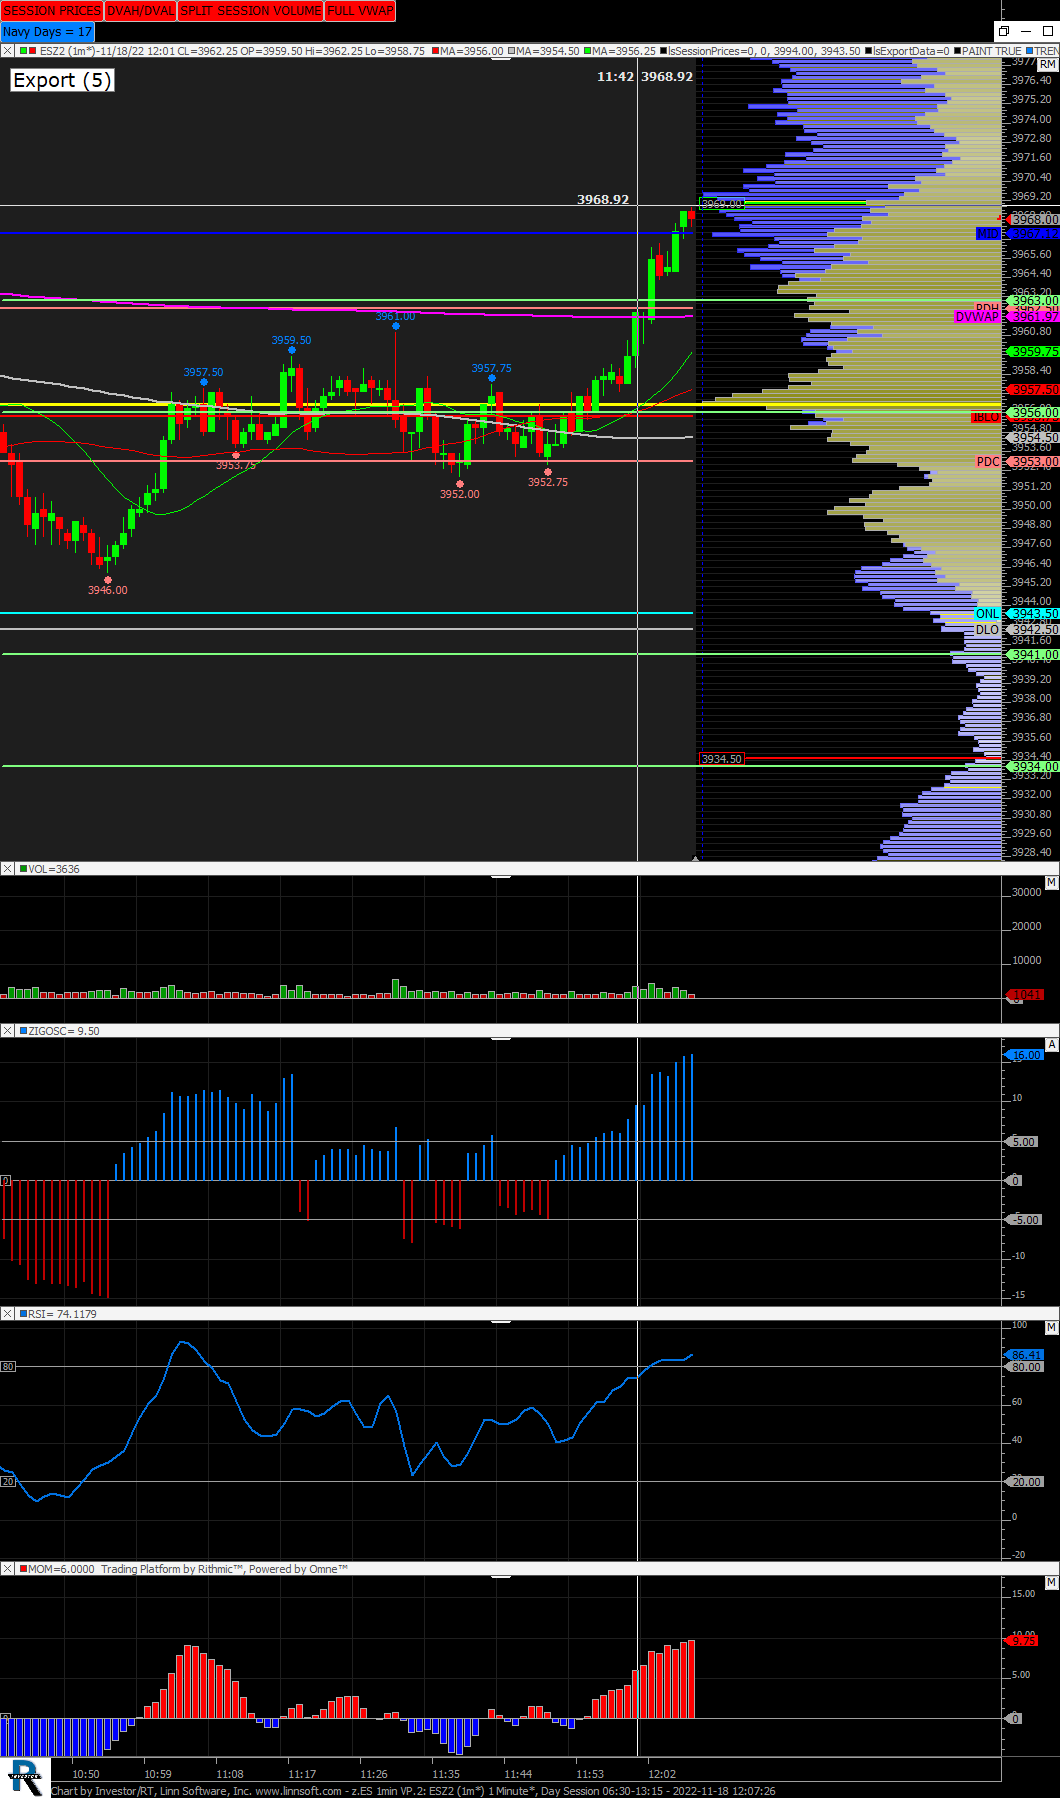 |
zES 1min VP2 (ESZ2) Martin Meier [totalcount]
3 years 8 months ago
Martin's z.ES 1min. This chart was uploaded by Investor/RT 15.1.12 showing symbol: ESZ2. |
View |
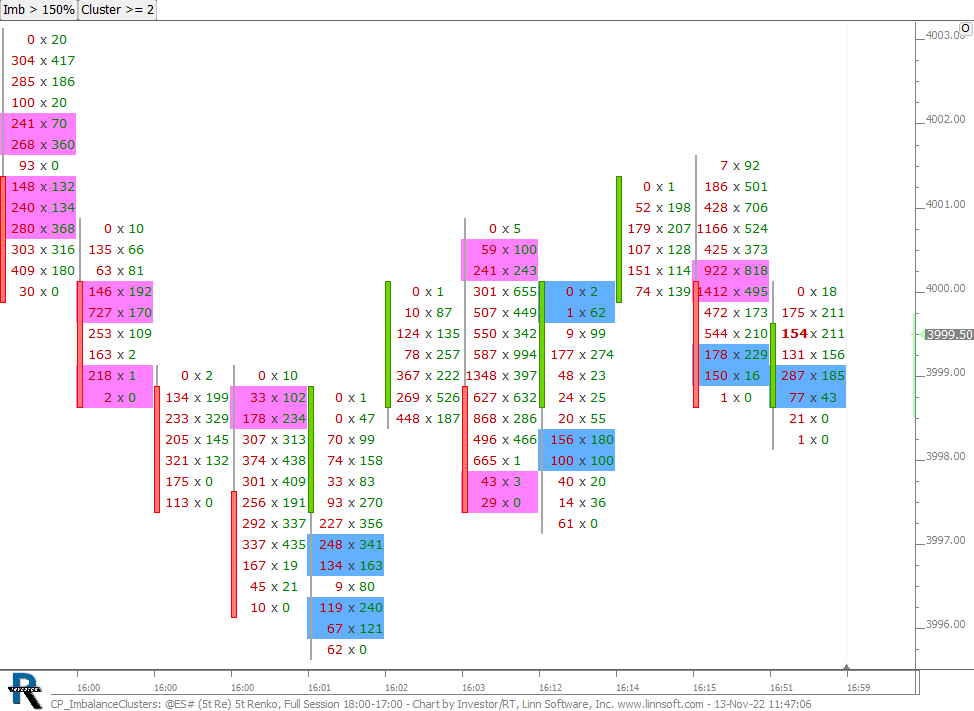 |
CP ImbalanceClusters (@ES#) cpayne [totalcount]
3 years 8 months ago
This chart was uploaded by Investor/RT 15.1.12 showing symbol: @ES#. |
View |
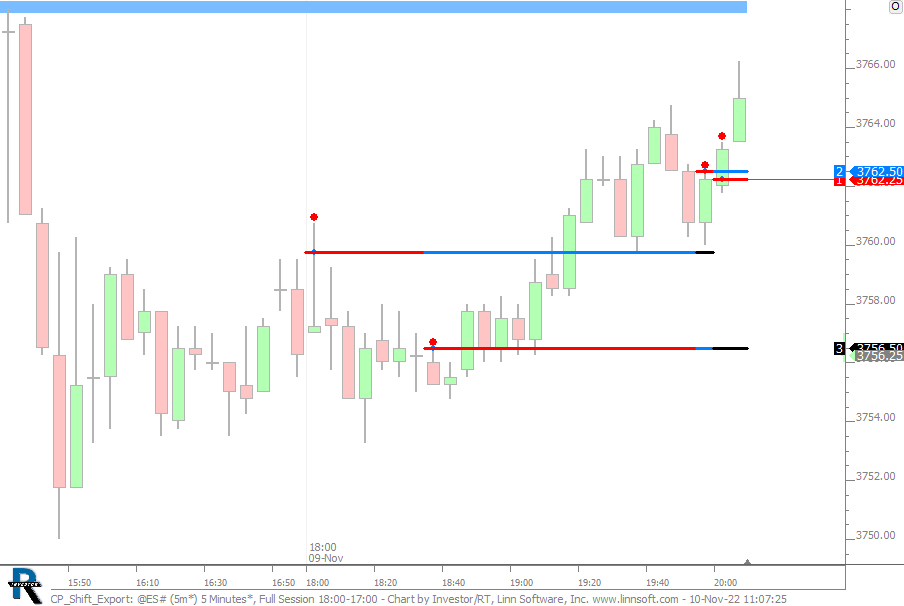 |
CP Shift Export (@ES#) cpayne [totalcount]
3 years 8 months ago
VPOC Shift Export. This chart was uploaded by Investor/RT 15.1.12 showing symbol: @ES#. |
View |
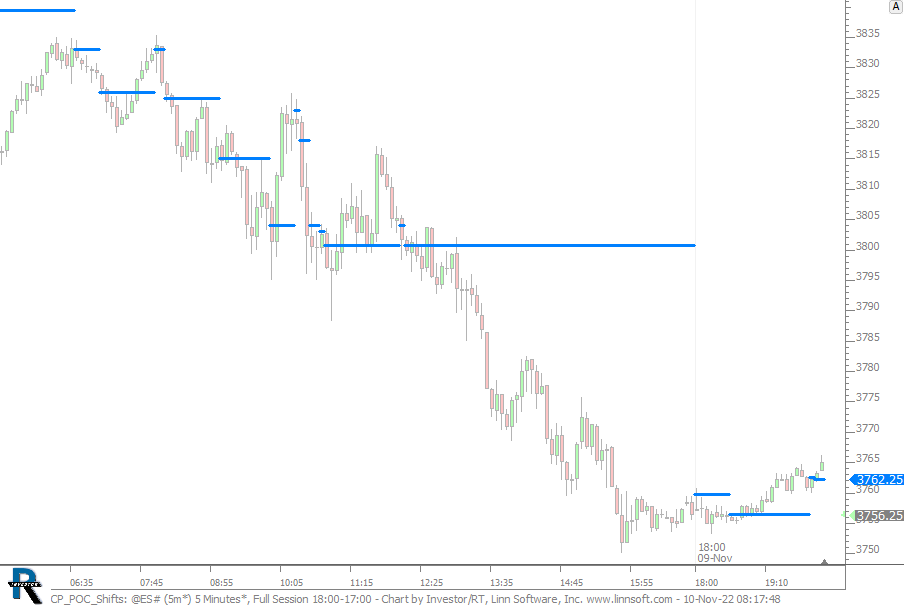 |
CP POC Shifts (@ES#) cpayne [totalcount]
3 years 8 months ago
Developing VPOC. This chart was uploaded by Investor/RT 15.1.12 showing symbol: @ES#. |
View |
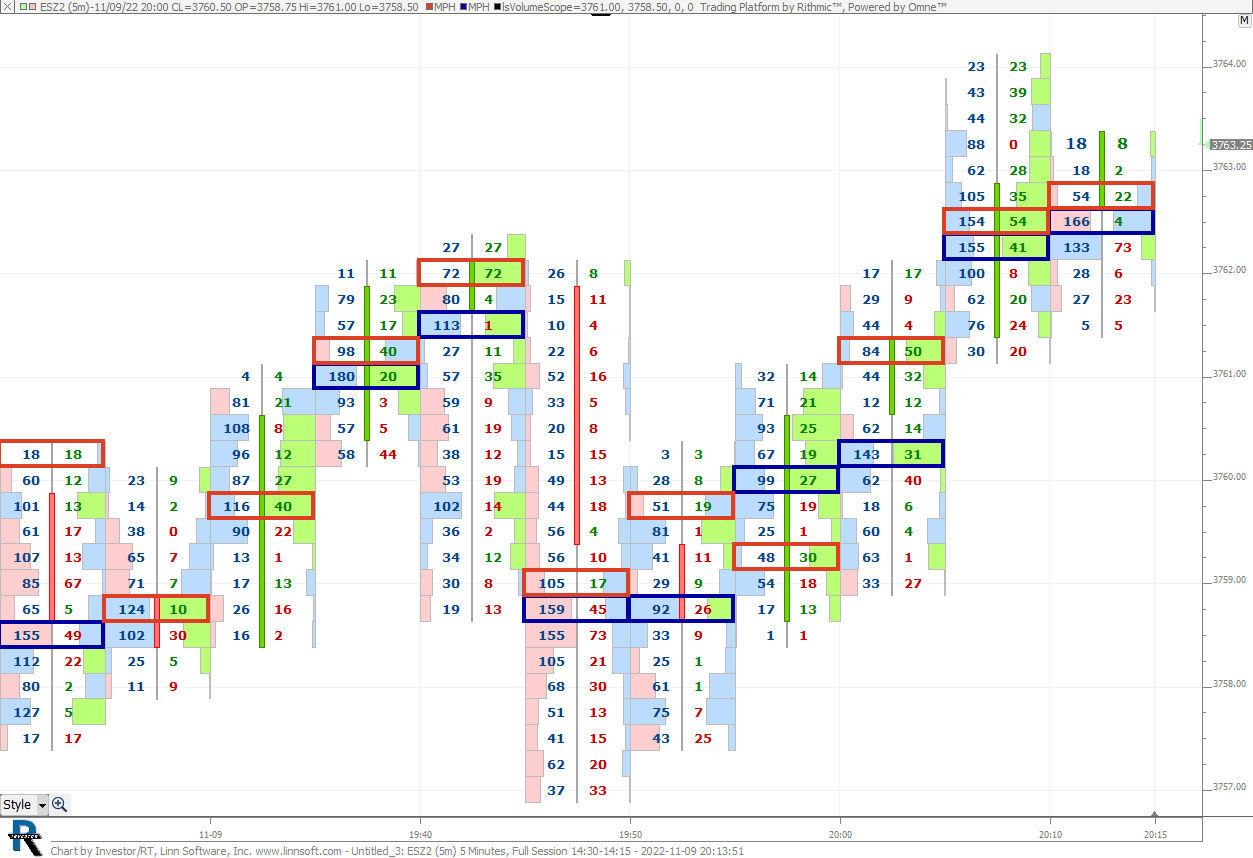 |
Untitled 3 (ESZ2) John Cavallo1 [totalcount]
3 years 8 months ago
Volume Delta_MPH highlight the wrong value. This chart was uploaded by Investor/RT 15.1.12 showing symbol: ESZ2. |
View |
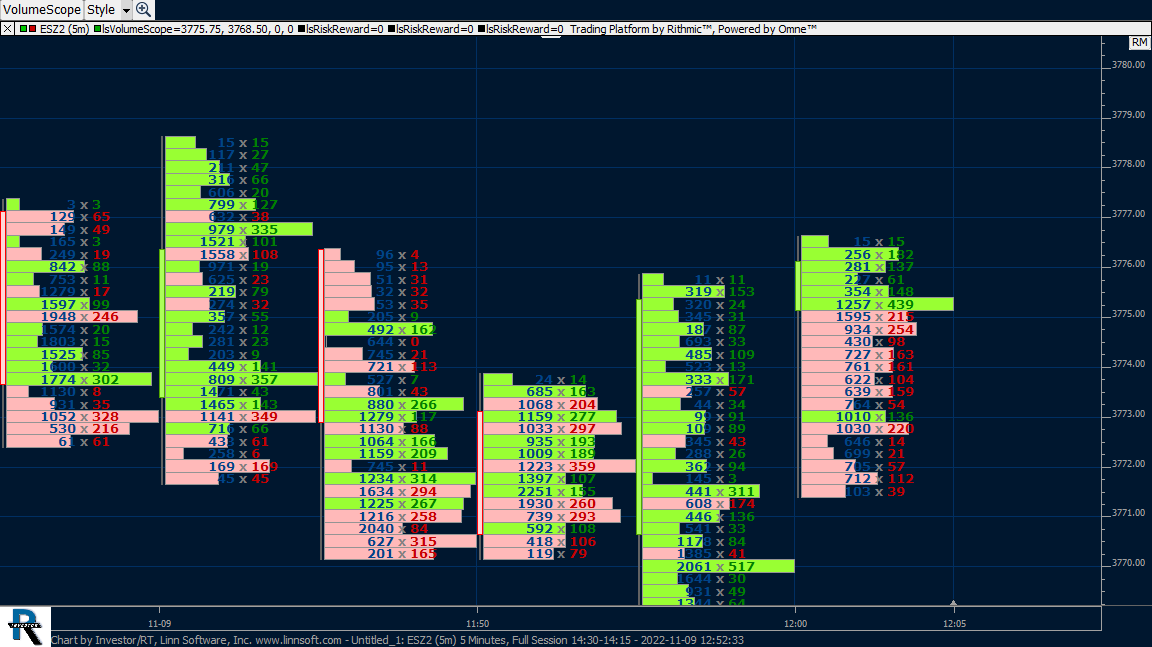 |
Untitled 1 (ESZ2) John Cavallo1 [totalcount]
3 years 8 months ago
This chart was uploaded by Investor/RT 15.1.12 showing symbol: ESZ2. |
View |
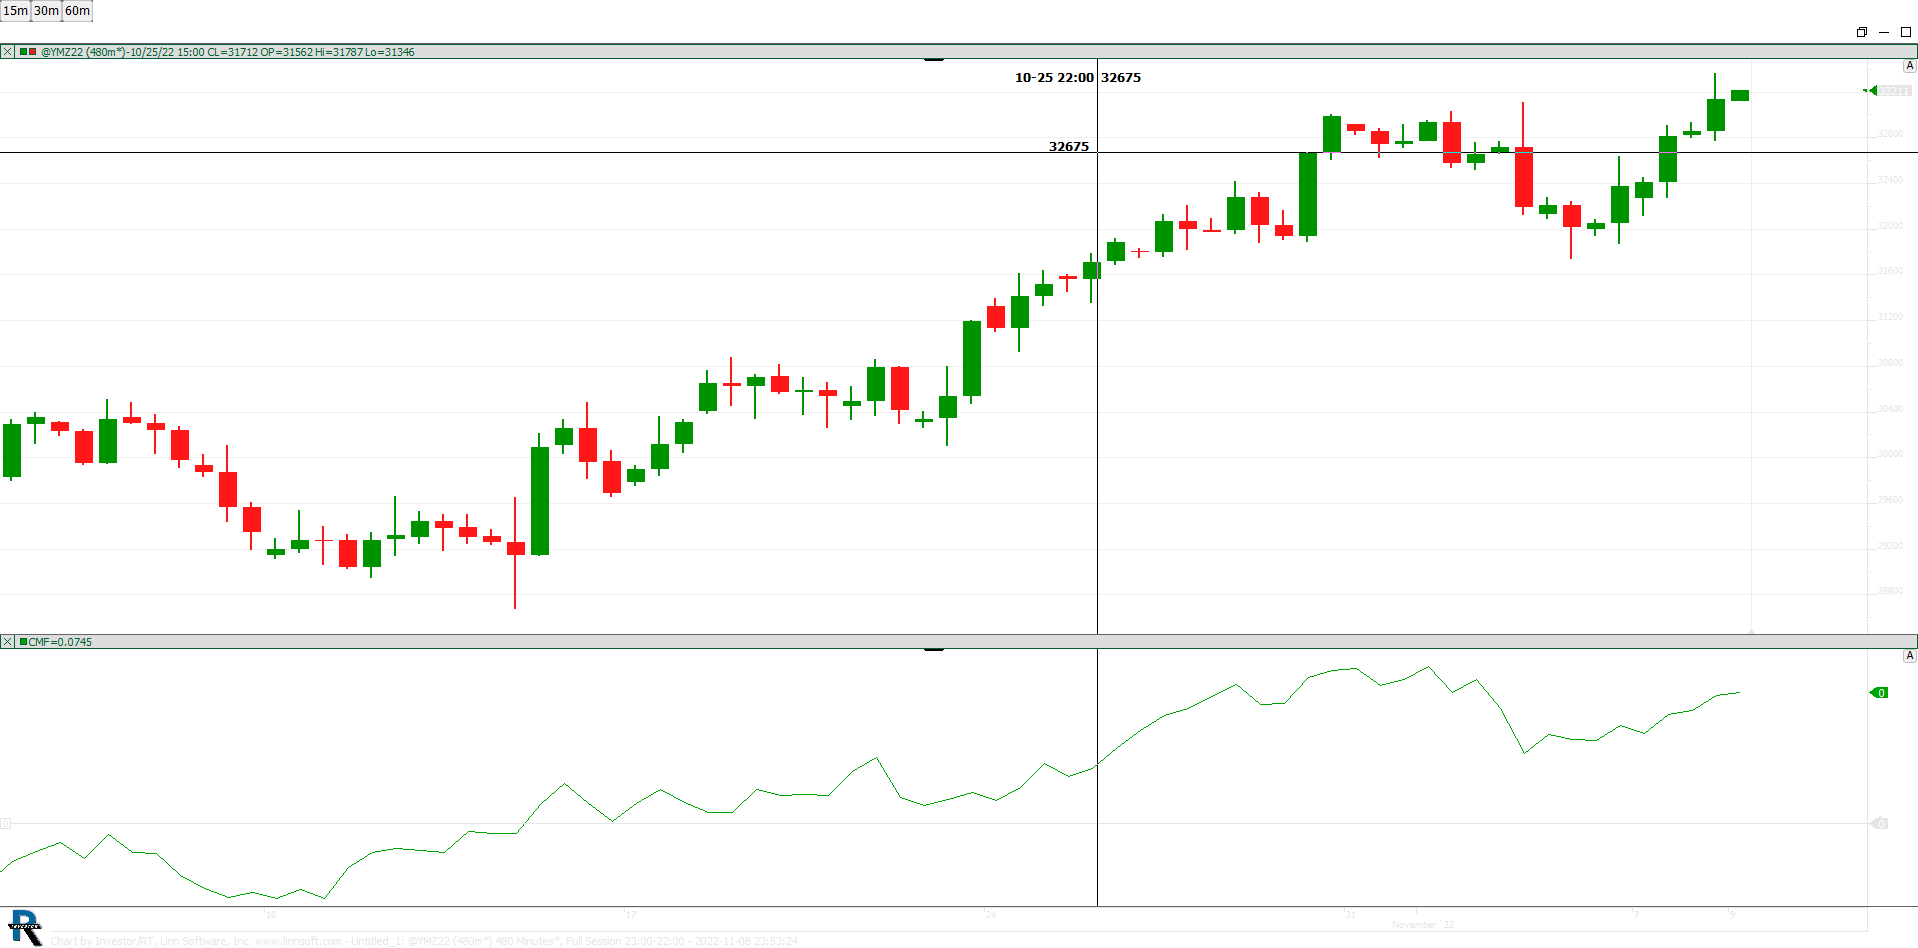 |
Untitled 1 (@YMZ22) pashaanwar177 [totalcount]
3 years 8 months ago
using chaikin money flow 40 period simple moving average 1. This chart was uploaded by Investor/RT 14.5.3 showing symbol: @YMZ22. |
View |