 |
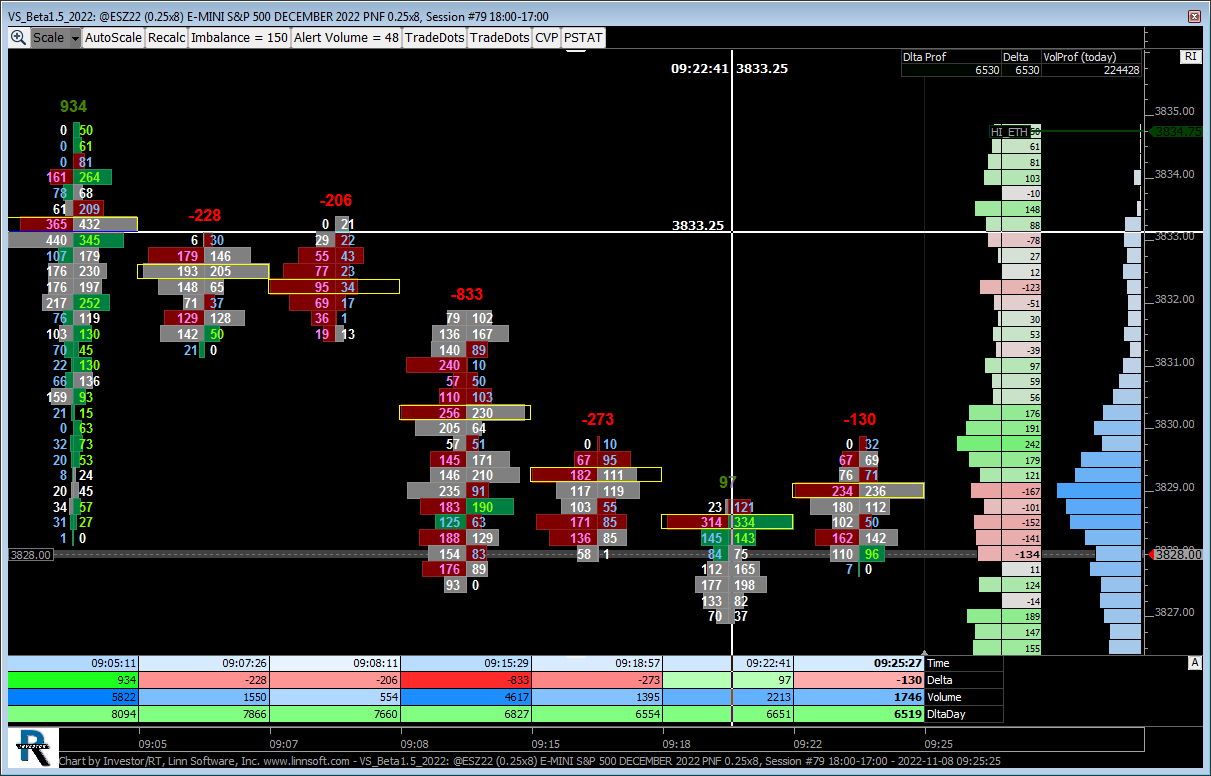
VS Beta15 (@ESZ22) jayski51369 [totalcount]
3 years 8 months ago
This chart was uploaded by Investor/RT 13.8.3 showing symbol: @ESZ22. |
View |
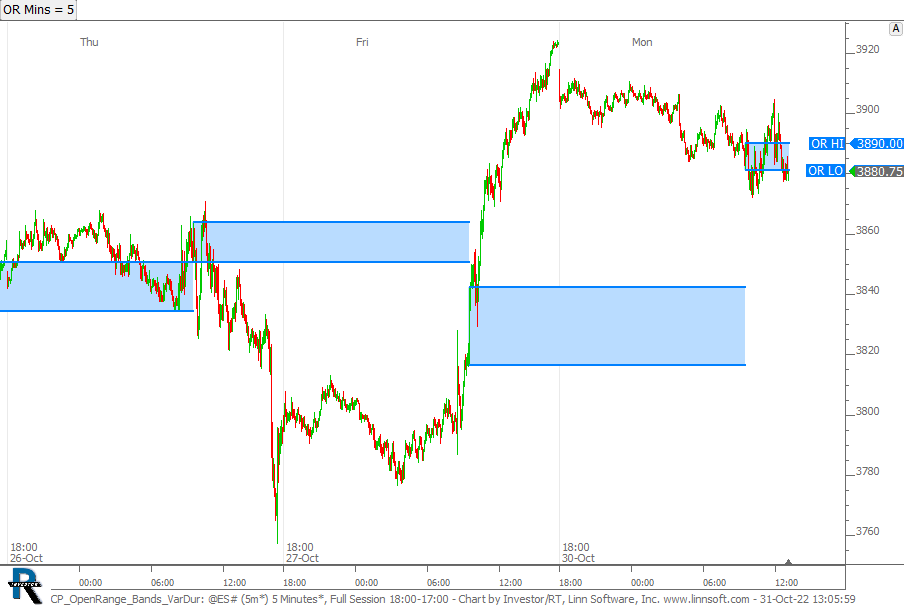 |
CP OpenRange Bands VarDur (@ES#) cpayne [totalcount]
3 years 9 months ago
Opening Range - Variable Durtion (via Button). Uses day session opening range and works on chart of any session, any symbol, and any periodicity....with Bands. |
View |
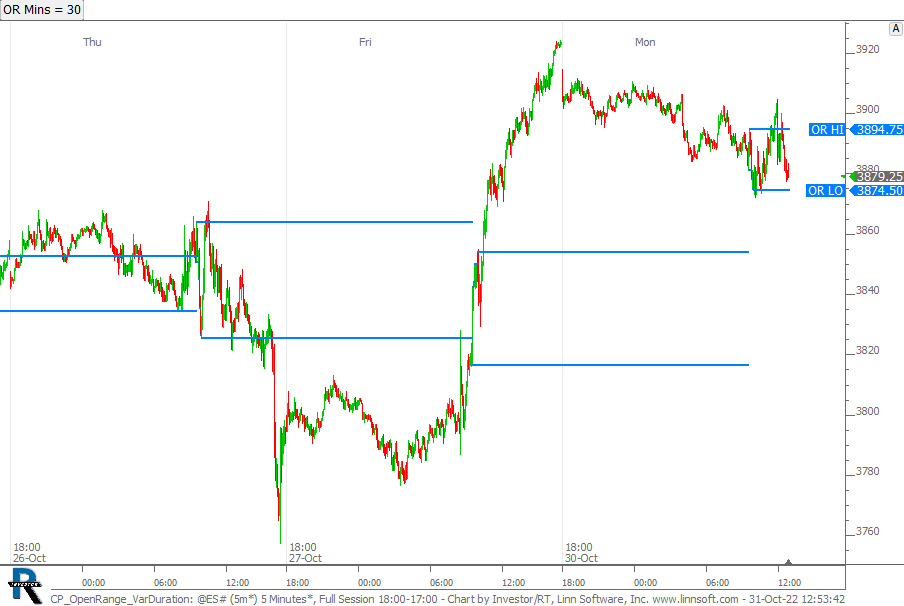 |
CP OpenRange VarDuration (@ES#) cpayne [totalcount]
3 years 9 months ago
Opening Range - Variable Durtion (via Button). Uses day session opening range and works on chart of any session, any symbol, and any periodicity. |
View |
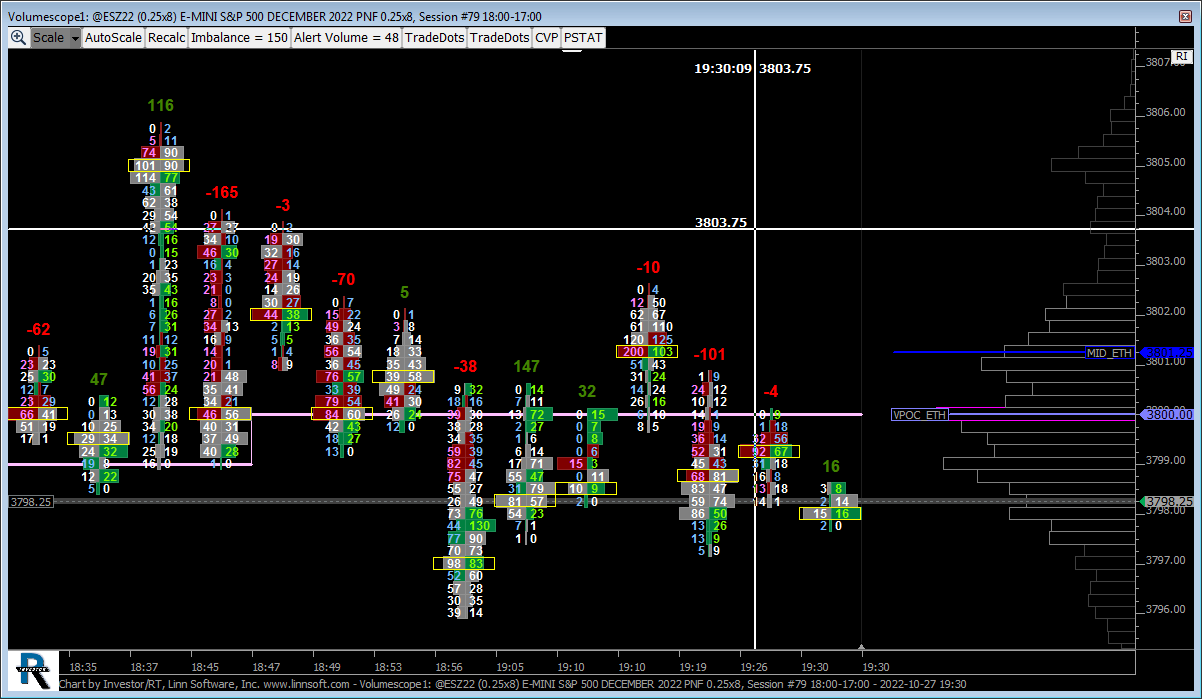 |
Volumescope (@ESZ22) jayski51369 [totalcount]
3 years 9 months ago
This chart was uploaded by Investor/RT 13.8.2 showing symbol: @ESZ22. |
View |
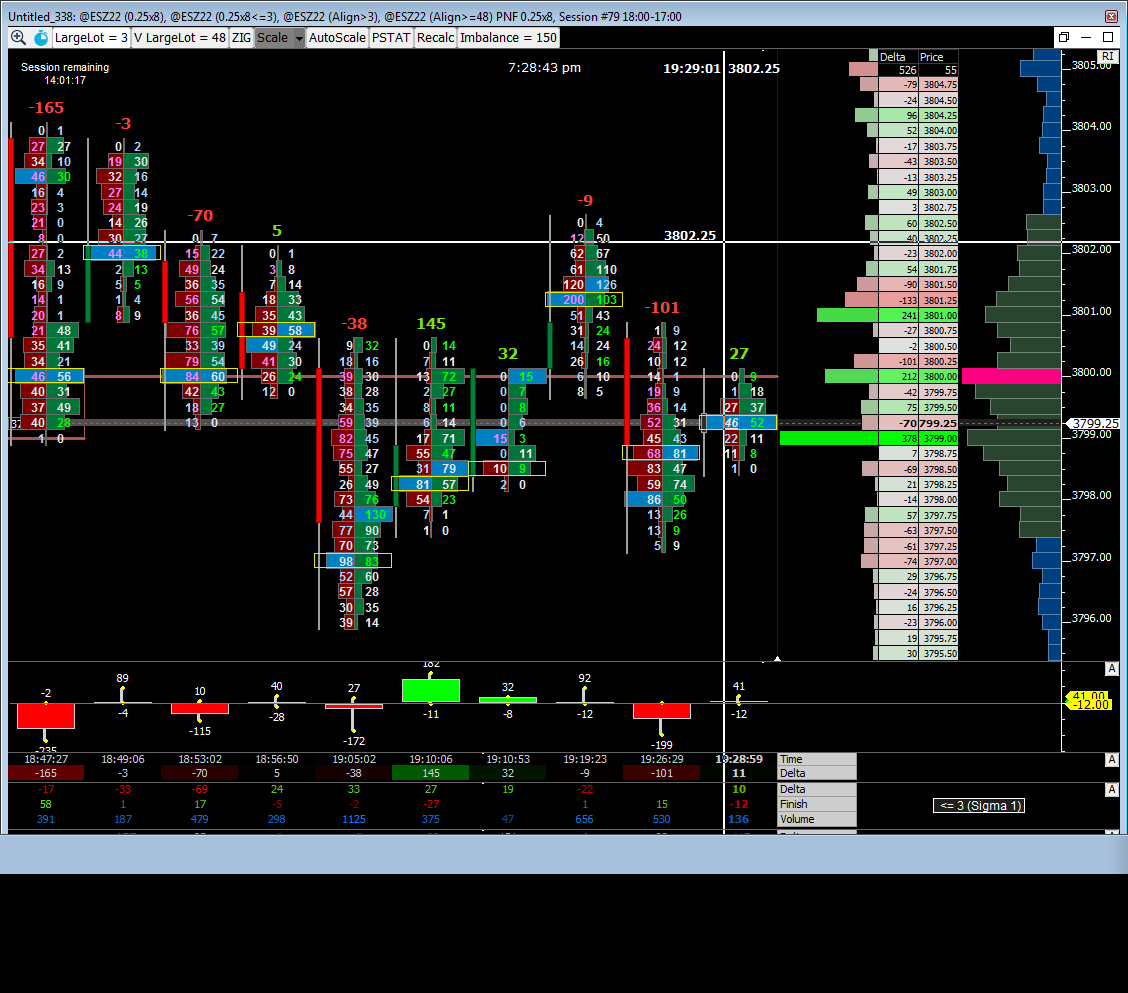 |
Untitled (@ESZ22) jayski51369 [totalcount]
3 years 9 months ago
This chart was uploaded by Investor/RT 13.8.2 showing symbol: @ESZ22. |
View |
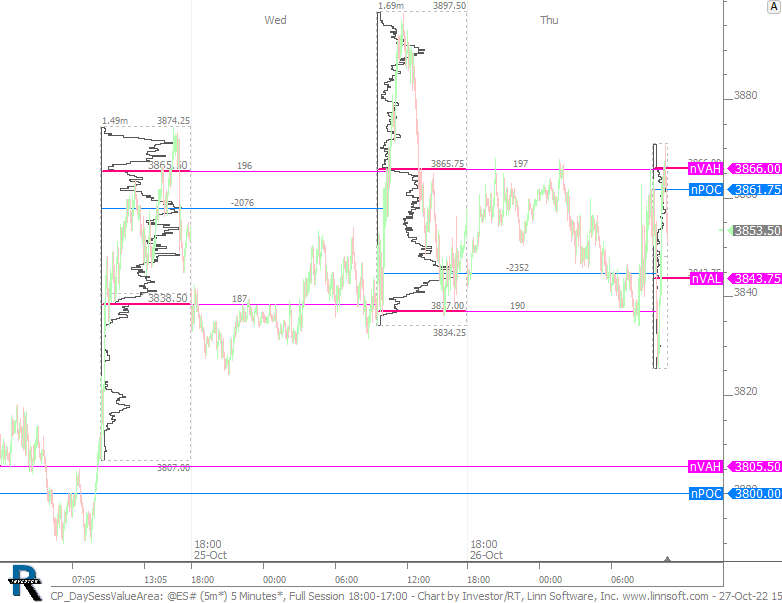 |
CP DaySessValueArea (@ES#) cpayne [totalcount]
3 years 9 months ago
Day Session Extended Naked POC, VAH, VAL on Full Session Chart using Profile Indicator. This chart was uploaded by Investor/RT 15.1.11 showing symbol: @ES#. |
View |
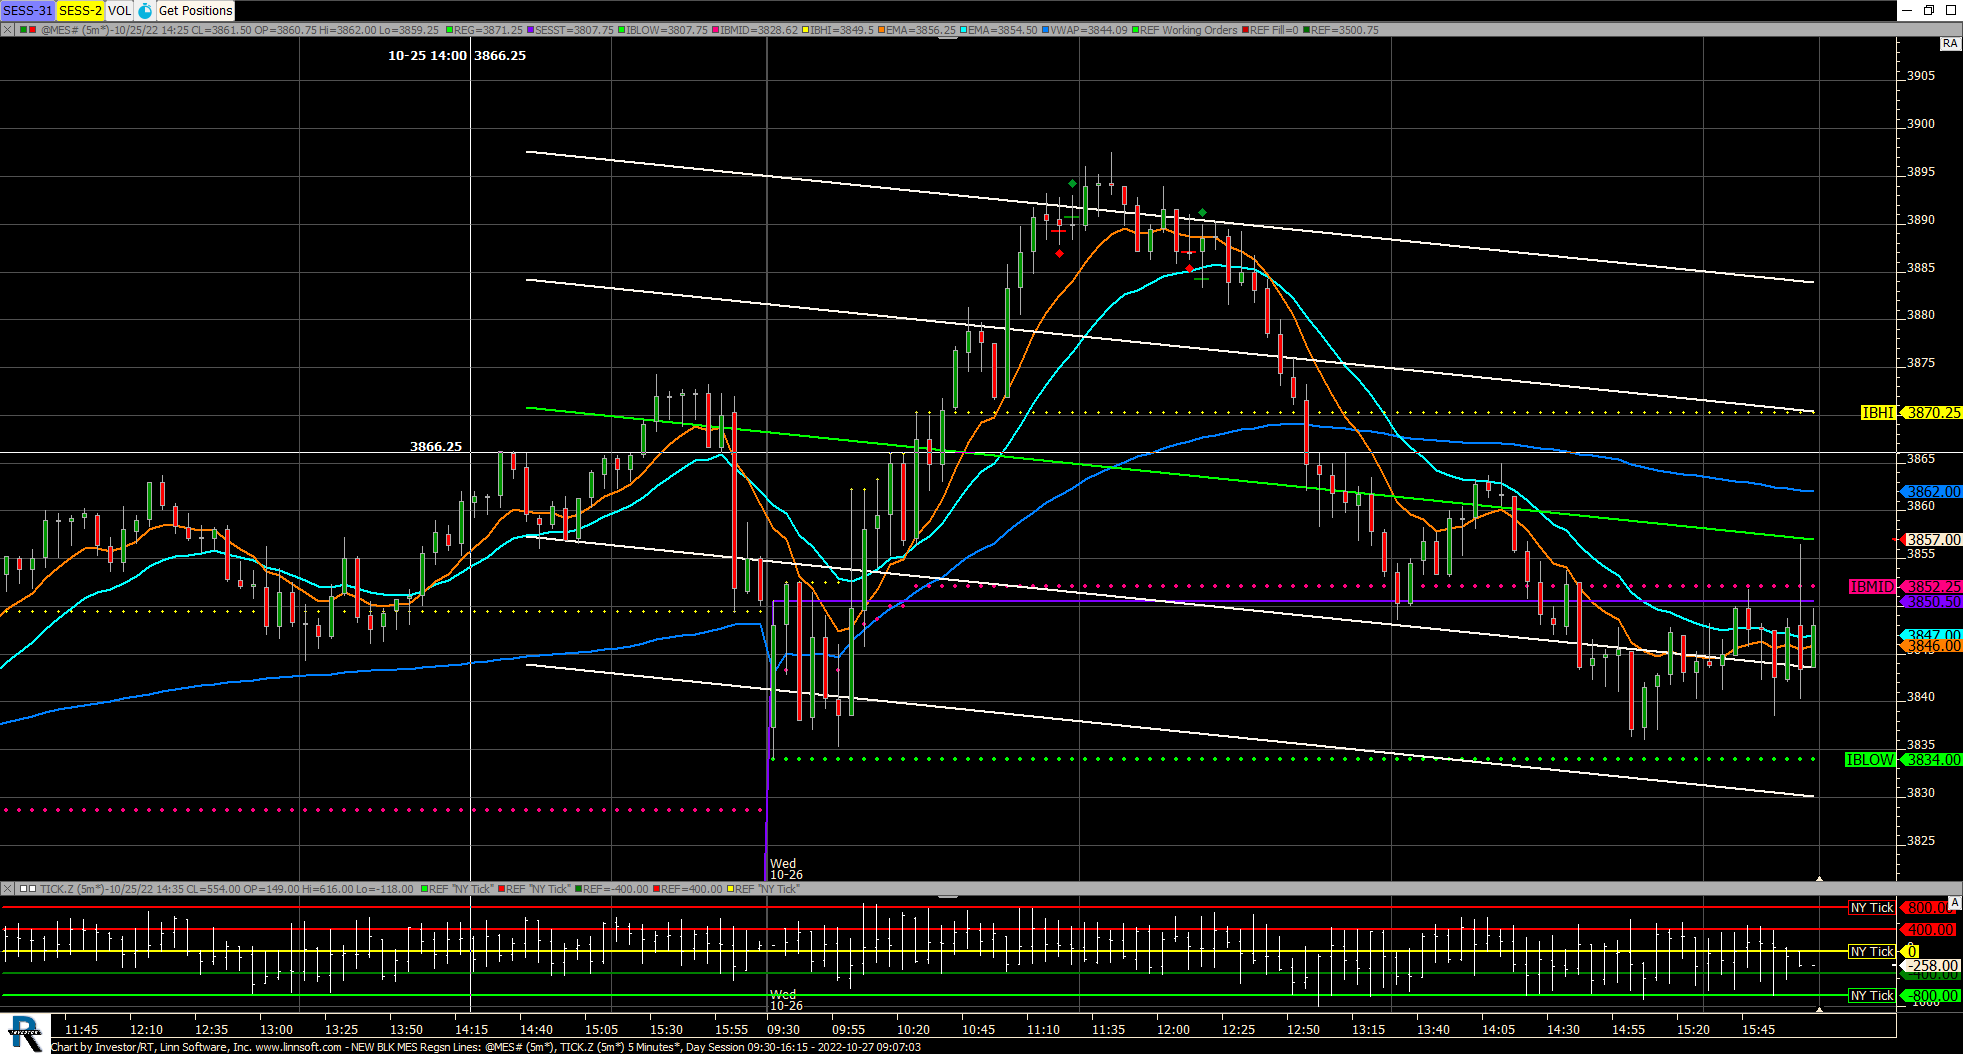 |
NEW BLK MES Regsn Lines (@MES#) Robert Wilkins [totalcount]
3 years 9 months ago
This chart was uploaded by Investor/RT 15.1.8 showing symbol: @MES#. |
View |
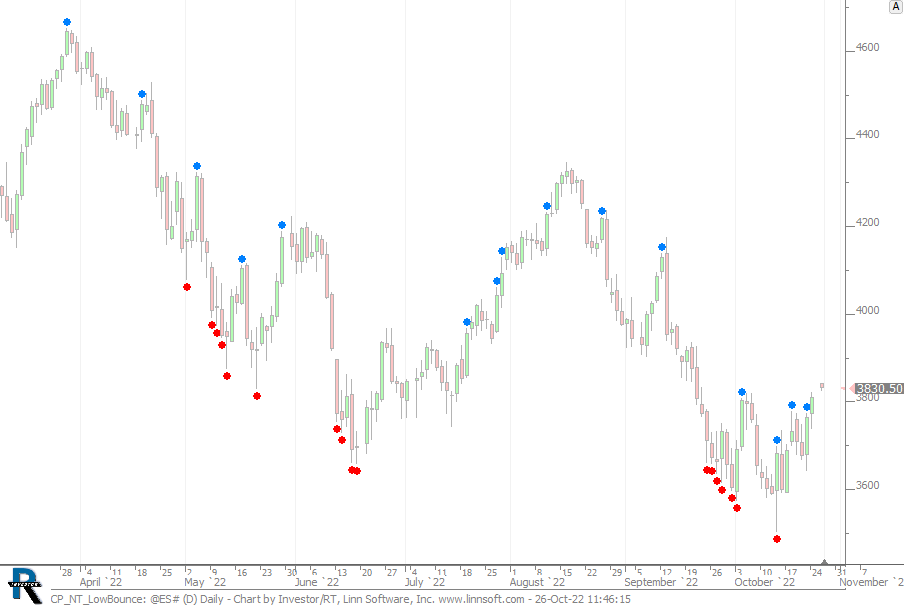 |
CP NT LowBounce (@ES#) cpayne [totalcount]
3 years 9 months ago
Bounced off 60 day low, then have 1 day increase in price of 1% with increase in volume. This chart was uploaded by Investor/RT 15.1.11 showing symbol: @ES#. |
View |
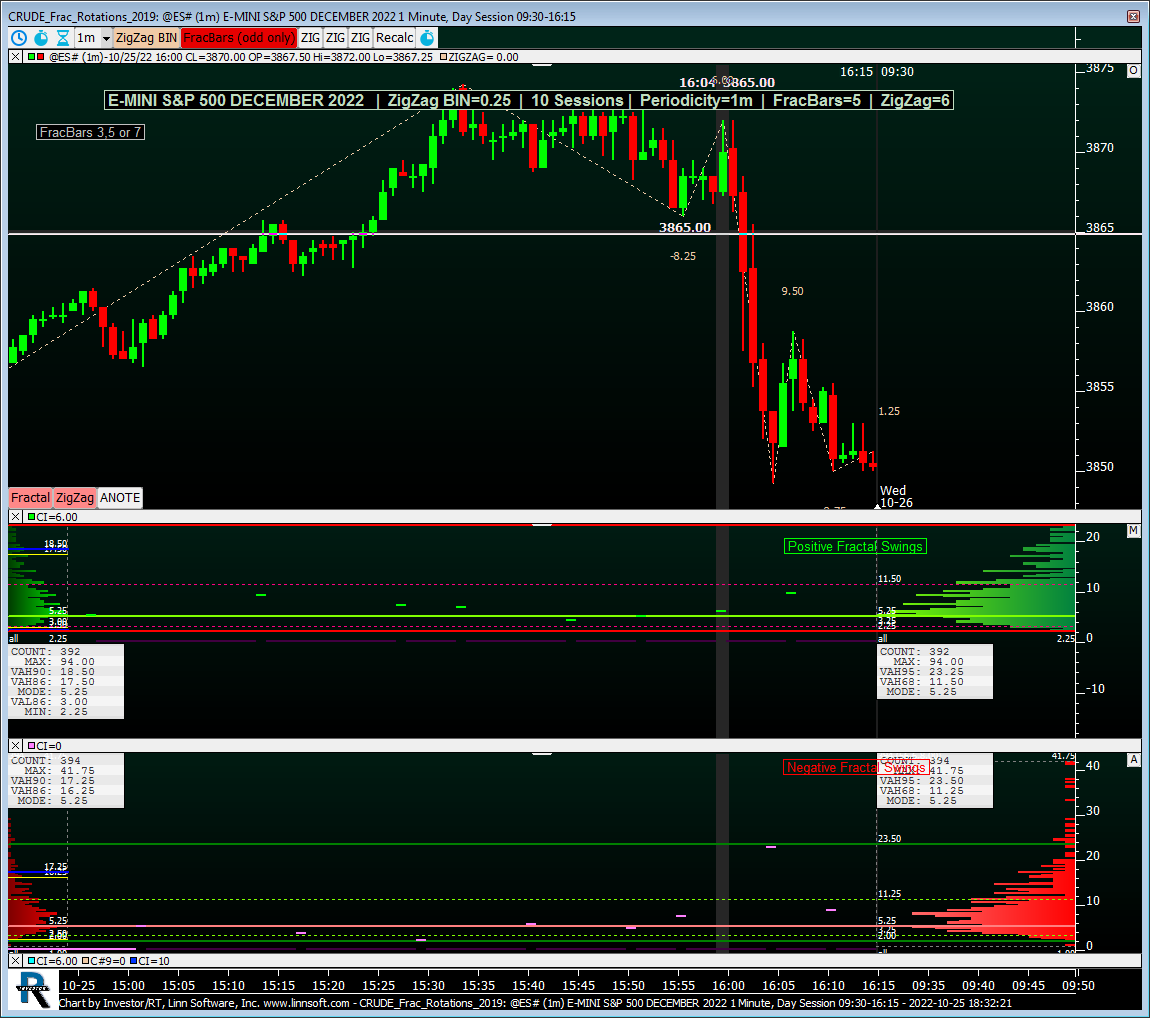 |
CRUDE Frac Rotations (@ES#) jayski51369 [totalcount]
3 years 9 months ago
This chart was uploaded by Investor/RT 13.8.2 showing symbol: @ES#. |
View |
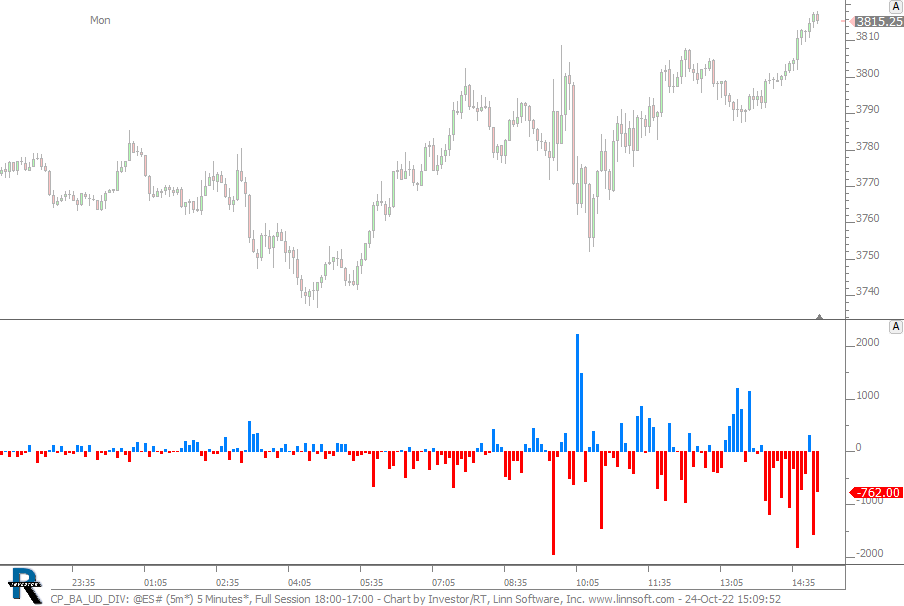 |
CP BA UD DIV (@ES#) cpayne [totalcount]
3 years 9 months ago
Difference between the Bid/Ask and Up/Down Delta. This chart was uploaded by Investor/RT 15.1.11 showing symbol: @ES#. |
View |
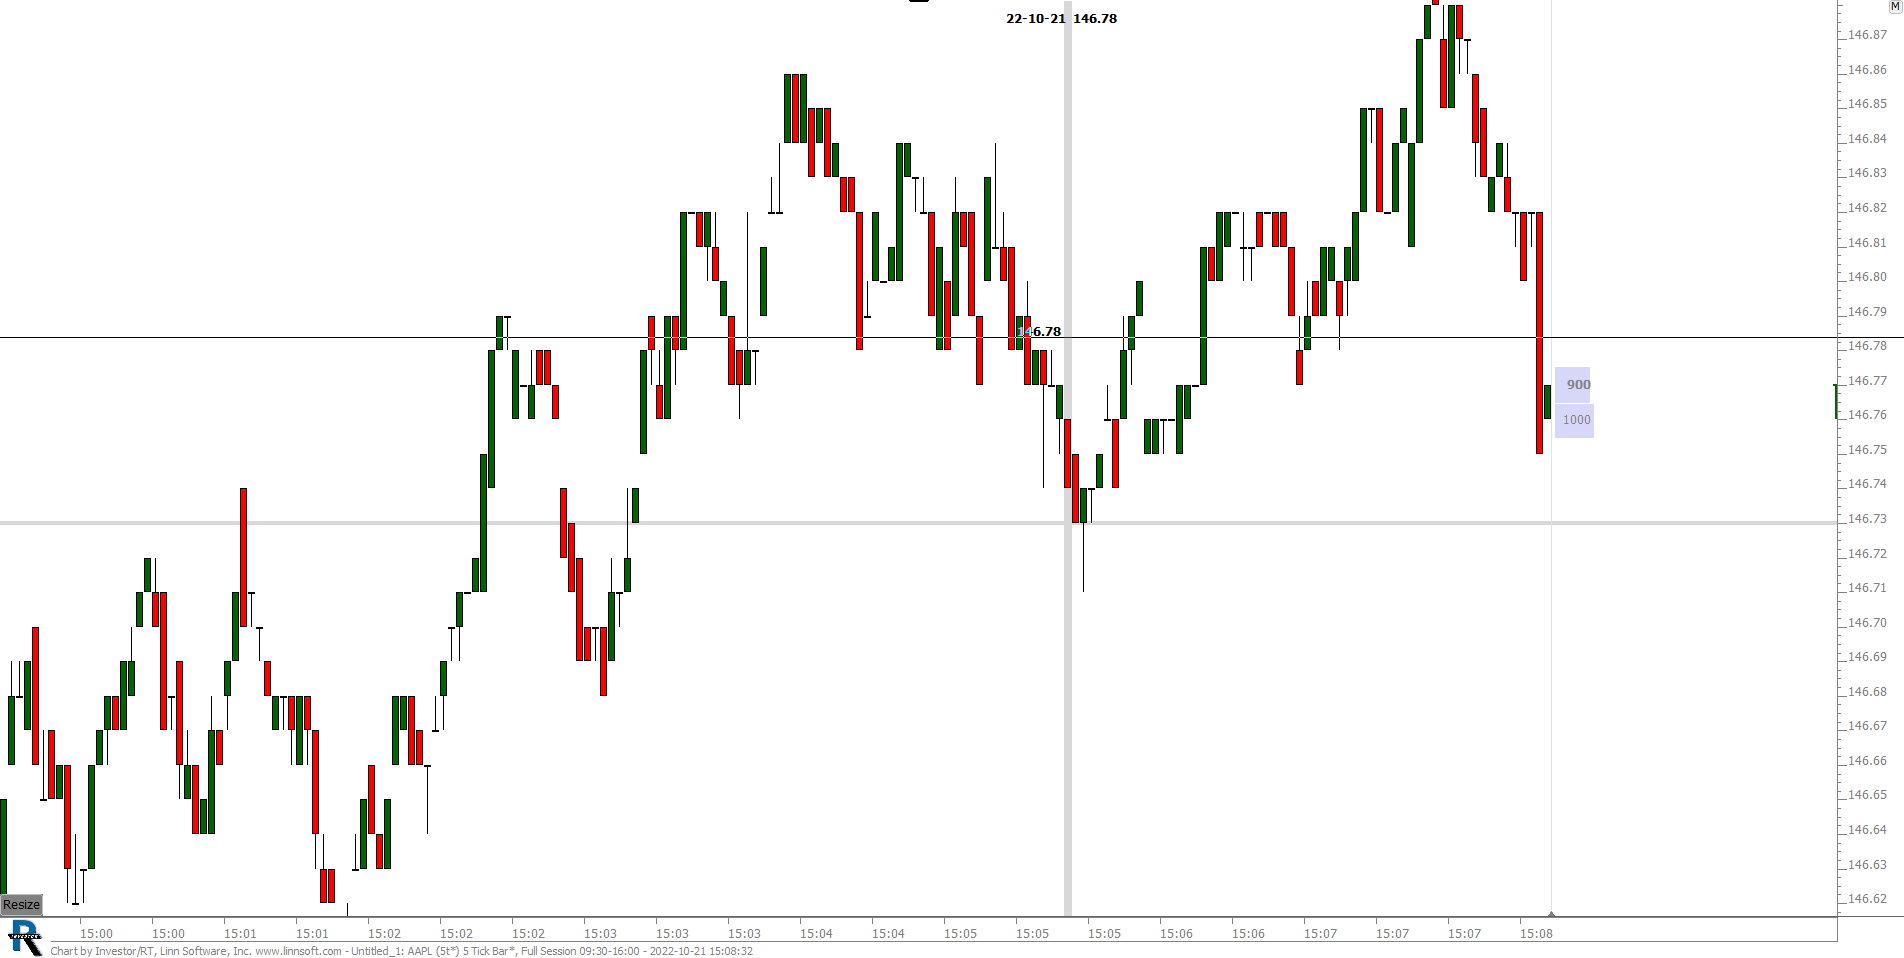 |
Untitled 1 (AAPL) Tod Kolas [totalcount]
3 years 9 months ago
This chart was uploaded by Investor/RT 13.8.2 showing symbol: AAPL. |
View |
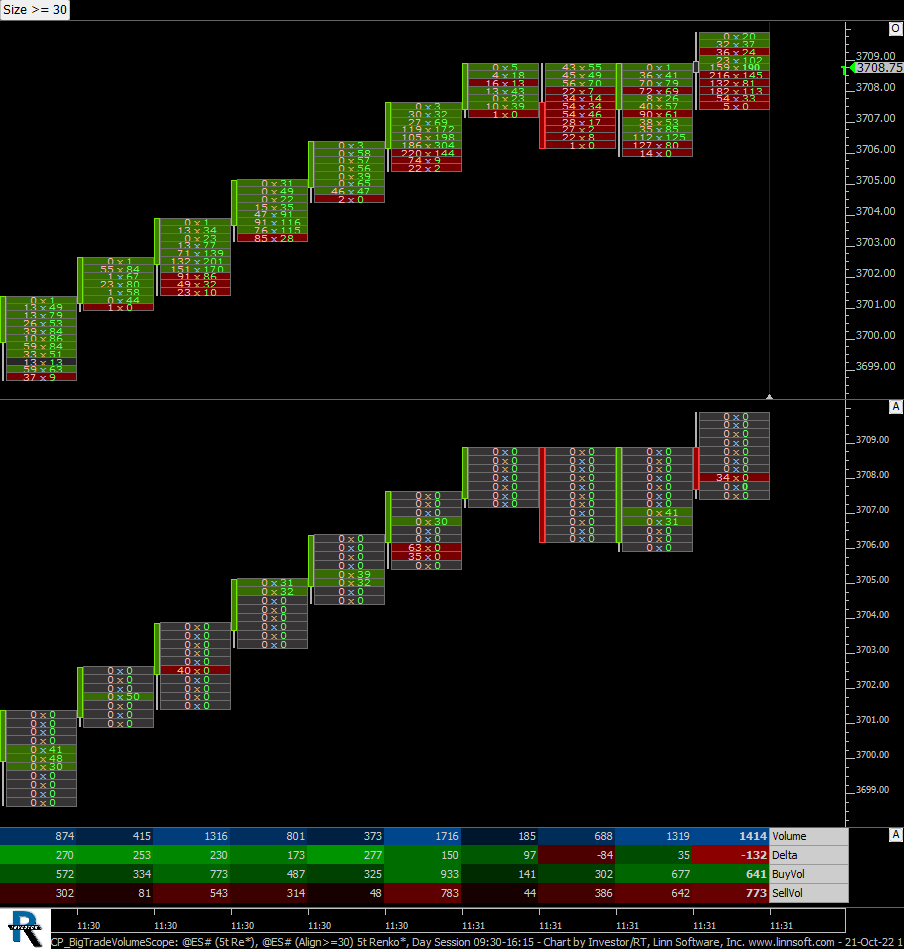 |
CP BigTradeVolumeScope (@ES#) cpayne [totalcount]
3 years 9 months ago
Big Trade Volumem Scope. This chart was uploaded by Investor/RT 15.1.11 showing symbol: @ES#. |
View |
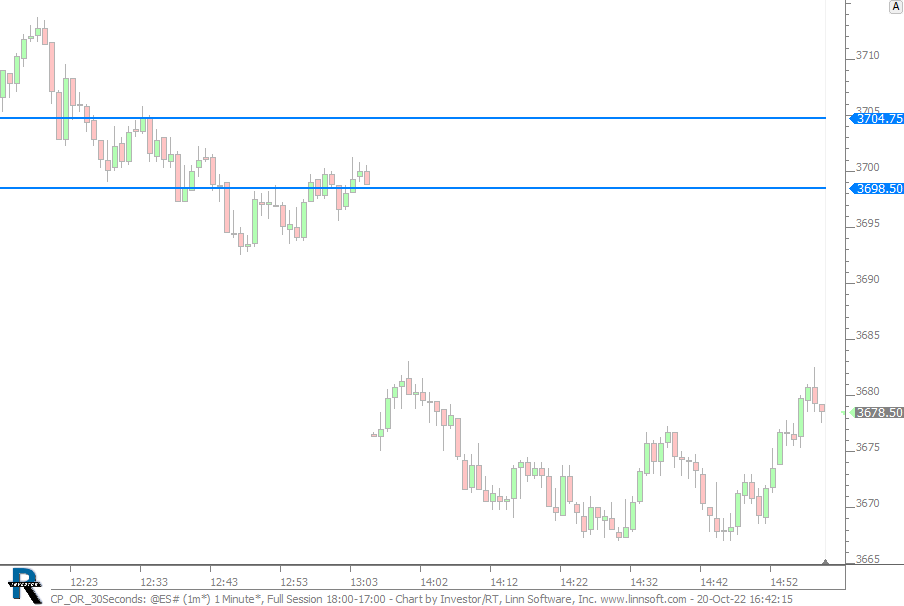 |
CP OR 30Seconds (@ES#) cpayne [totalcount]
3 years 9 months ago
30 second day session opening range. This chart was uploaded by Investor/RT 15.1.11 showing symbol: @ES#. |
View |
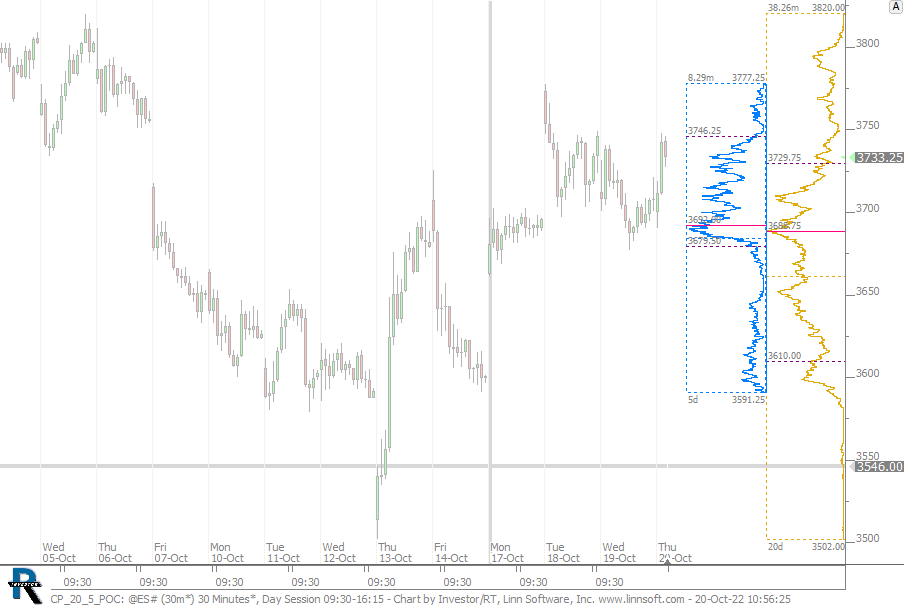 |
CP 20 5 POC (@ES#) cpayne [totalcount]
3 years 9 months ago
20 and 5 day profiles with POC. This chart was uploaded by Investor/RT 15.1.11 showing symbol: @ES#. |
View |
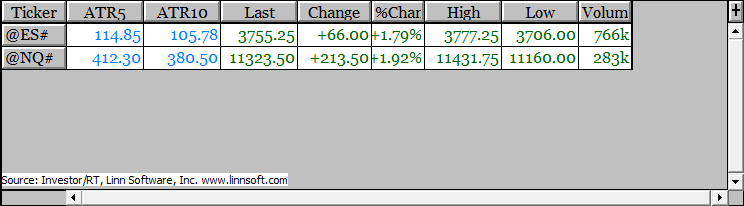 |
CP ATR QuotePage cpayne [totalcount]
3 years 9 months ago
Quotepage with ATR 5 and 10. This chart was uploaded by Investor/RT 15.1.11. |
View |
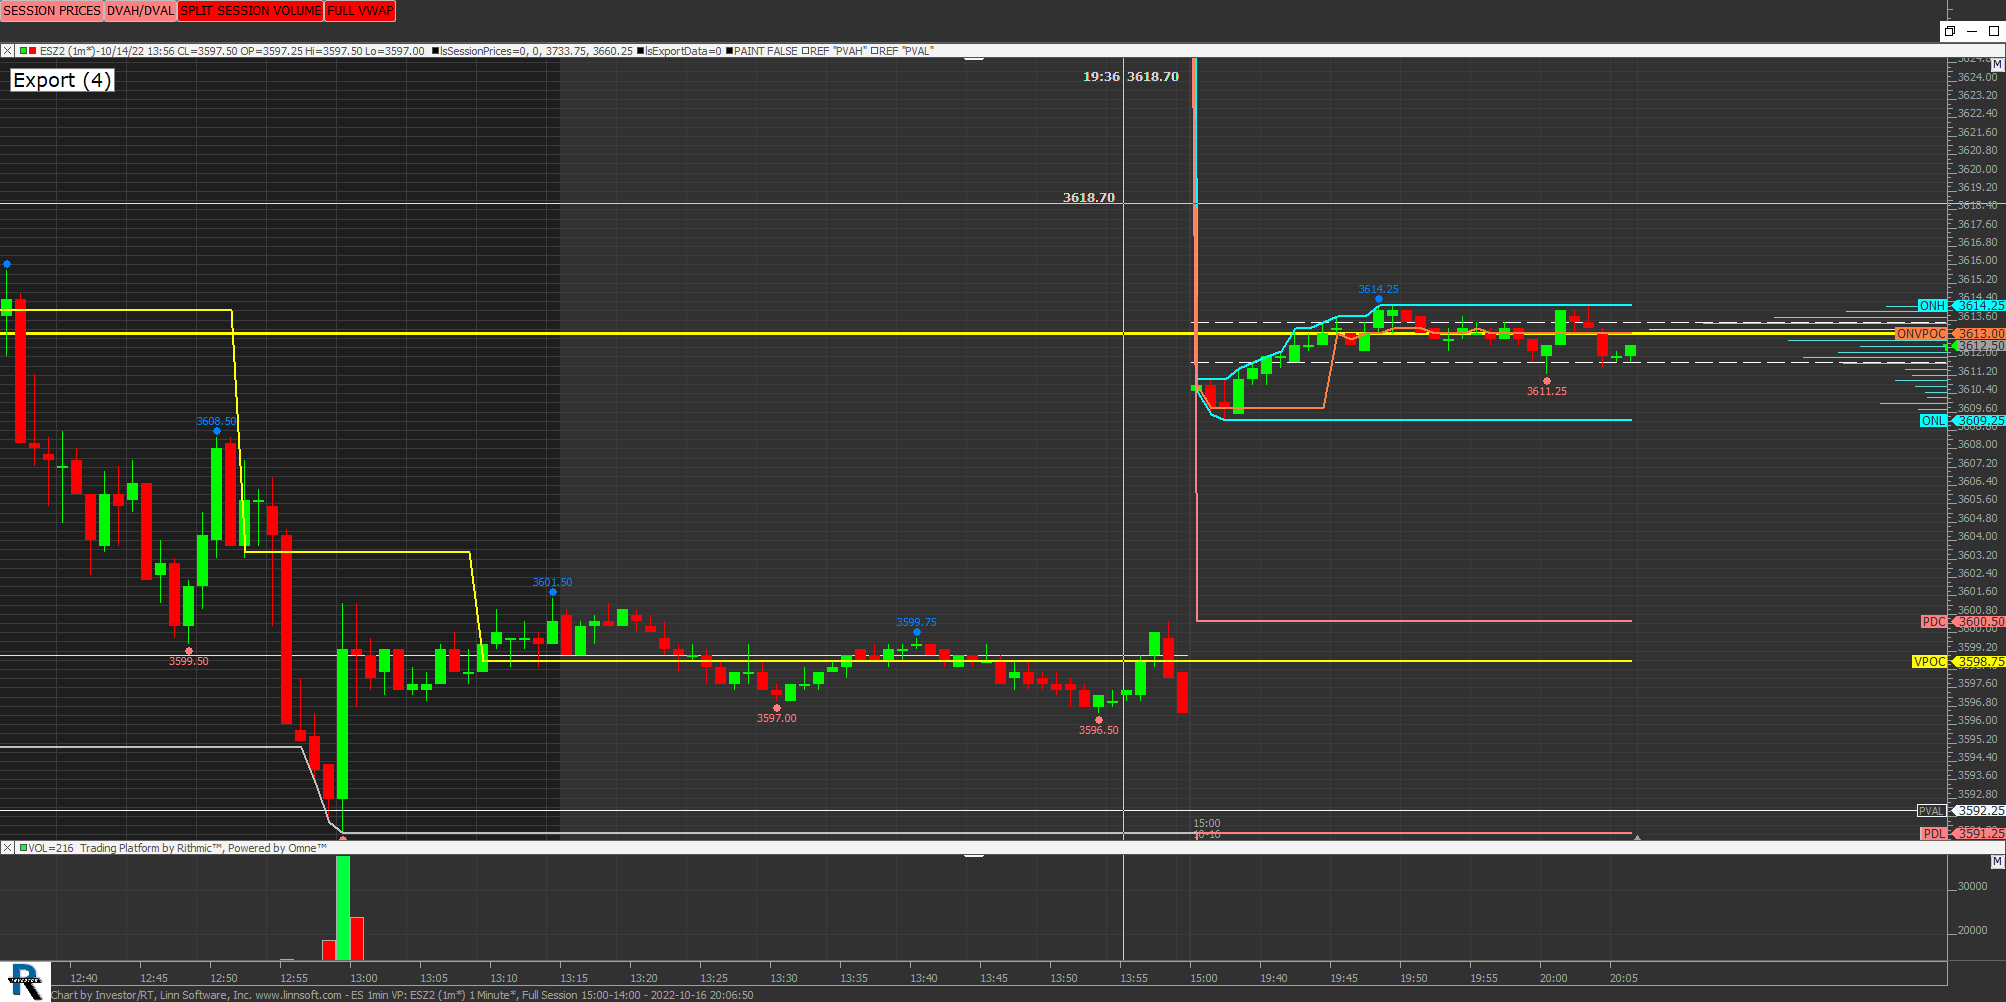 |
ES 1min VP (ESZ2) Dustin Sorenson [totalcount]
3 years 9 months ago
1min. This chart was uploaded by Investor/RT 15.1.9 showing symbol: ESZ2. |
View |
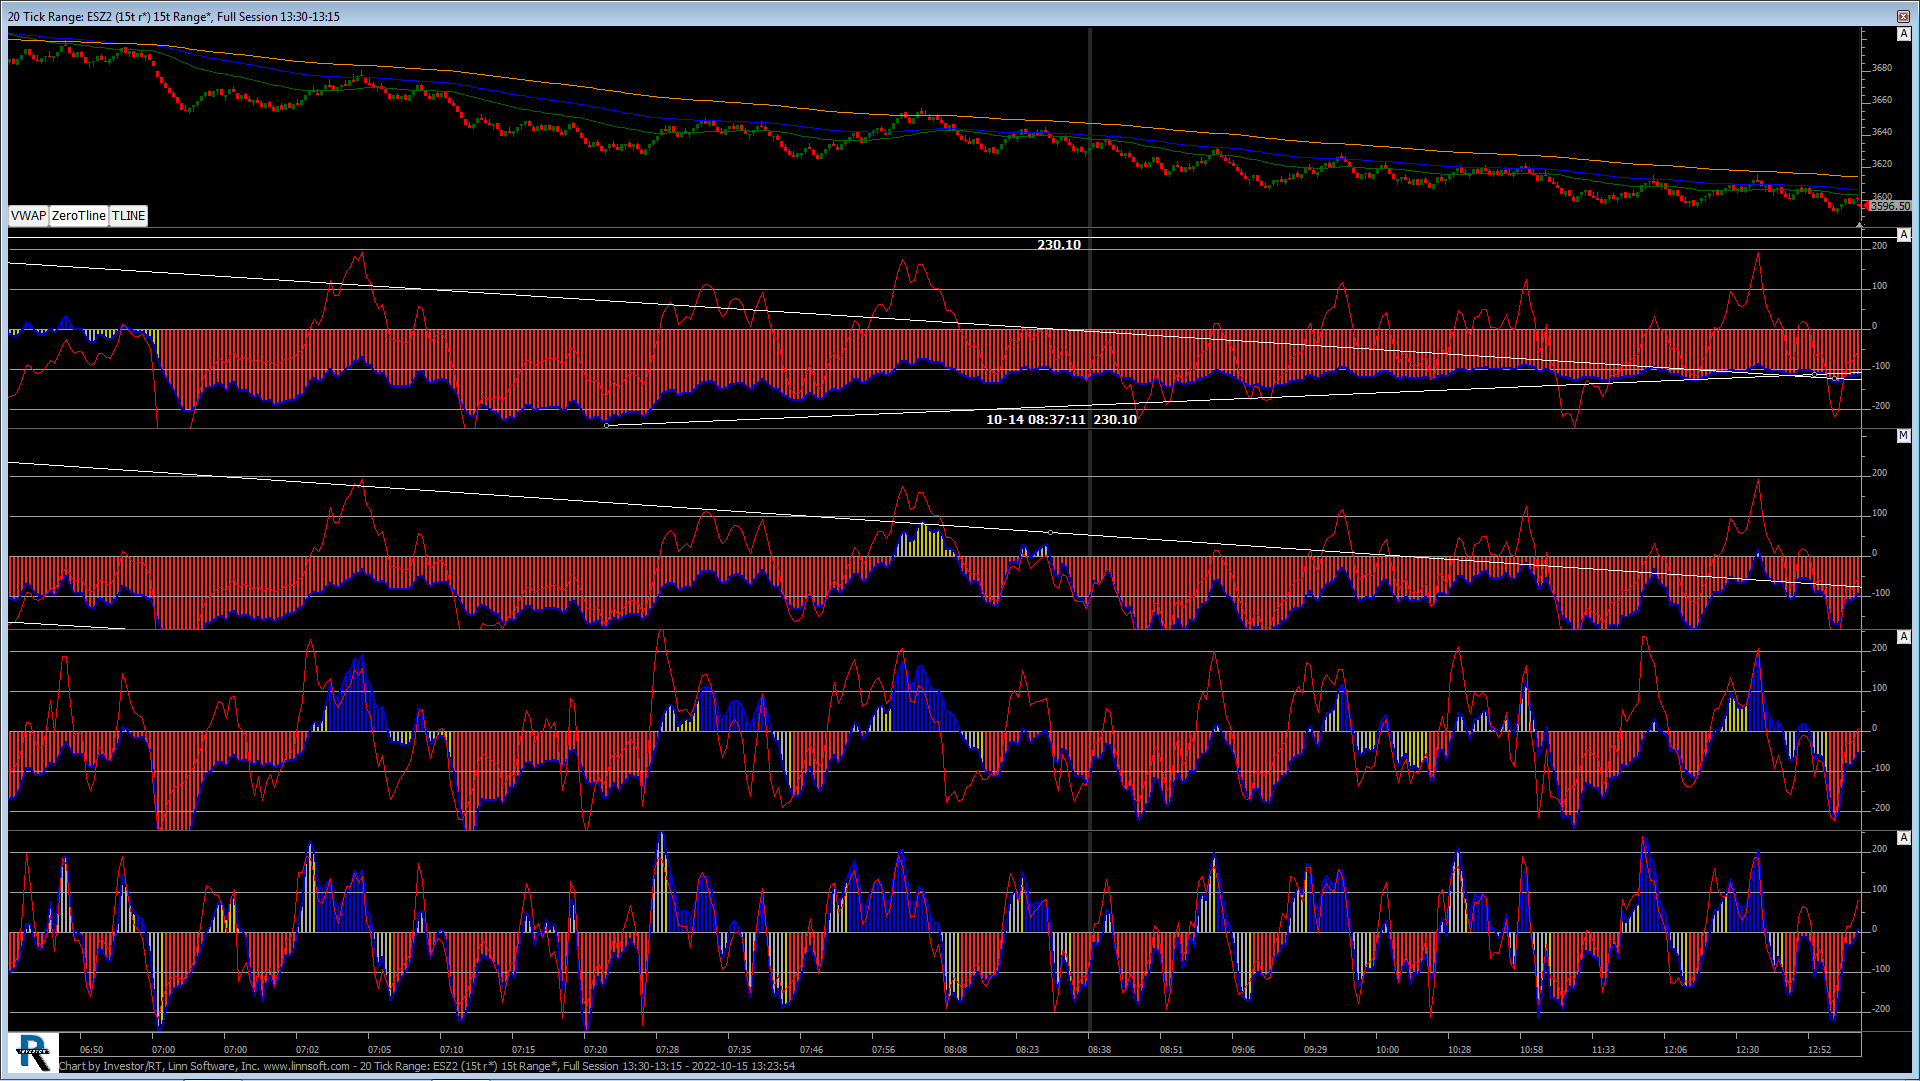 |
20 Tick Range (ESZ2) duffytrader [totalcount]
3 years 9 months ago
This chart was uploaded by Investor/RT 14.5.2 showing symbol: ESZ2. |
View |
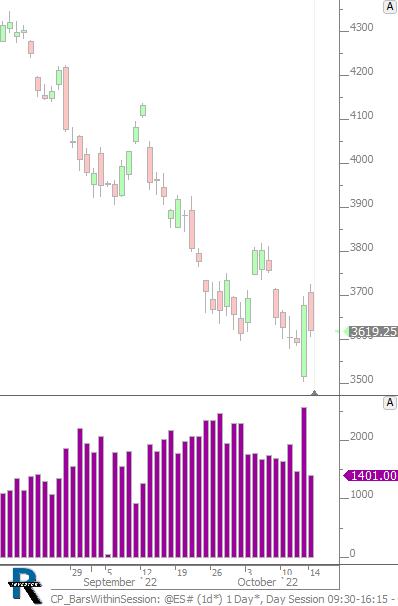 |
CP BarsWithinSession (@ES#) cpayne [totalcount]
3 years 9 months ago
This chart was uploaded by Investor/RT 15.1.11 showing symbol: @ES#. |
View |
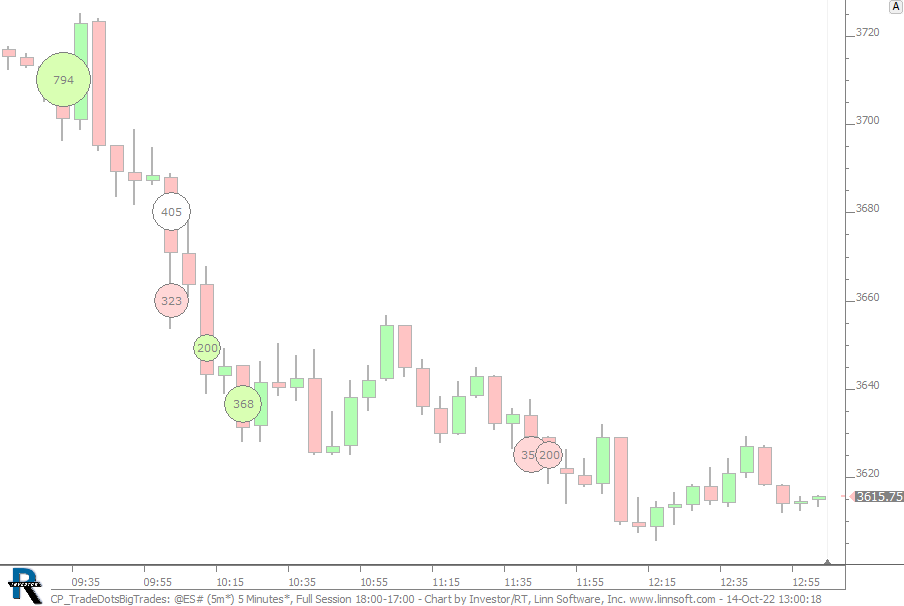 |
CP TradeDotsBigTrades (@ES#) cpayne [totalcount]
3 years 9 months ago
This chart was uploaded by Investor/RT 15.1.11 showing symbol: @ES#. |
View |
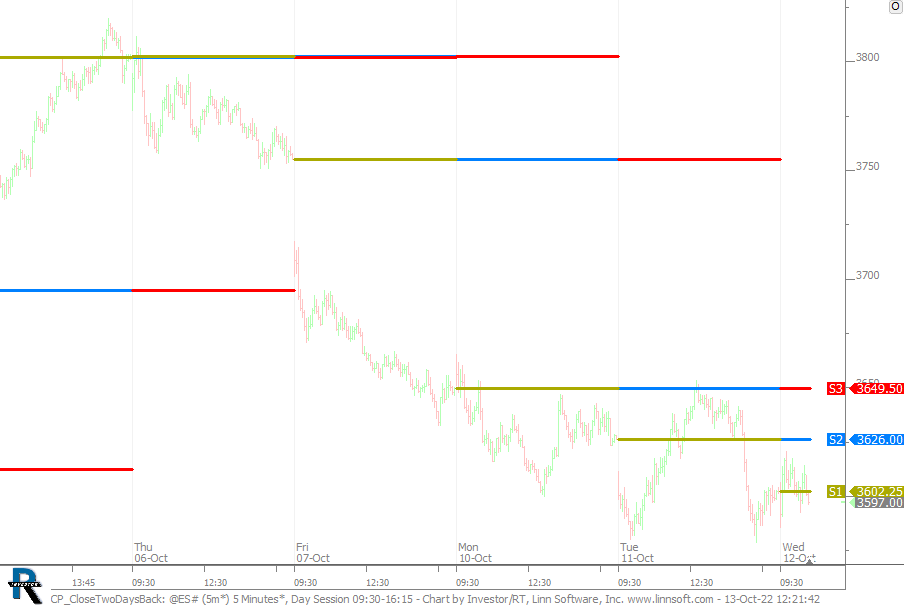 |
CP CloseTwoDaysBack (@ES#) cpayne [totalcount]
3 years 9 months ago
Close 1 (gold), 2 (blue) and 3 (red) days back. This chart was uploaded by Investor/RT 15.1.11 showing symbol: @ES#. |
View |
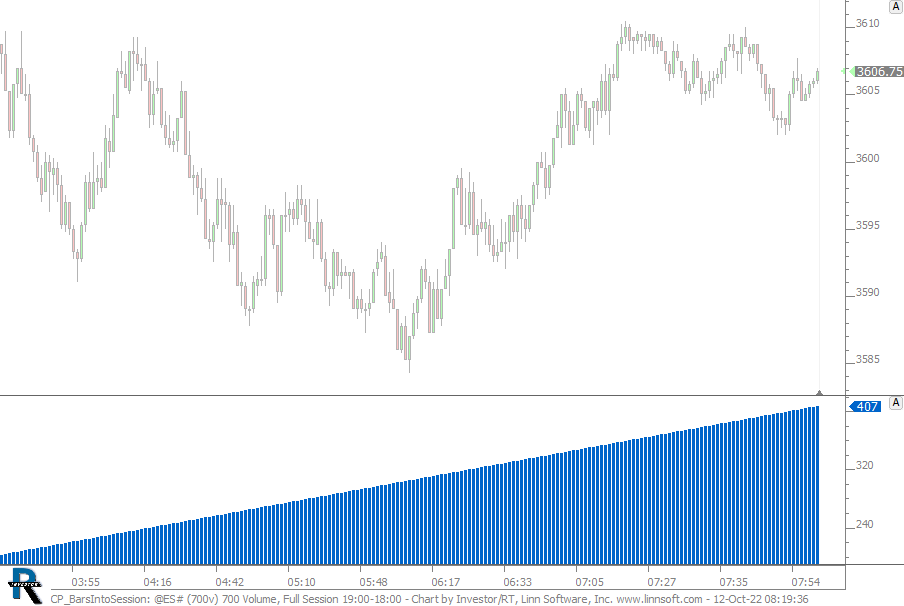 |
CP BarsIntoSession (@ES#) cpayne [totalcount]
3 years 9 months ago
Chart Displays Bars Into Session in Annotation. To move to another chart, drag the Position Indicator (blue histogram) to the scale at bottom of target chart. |
View |
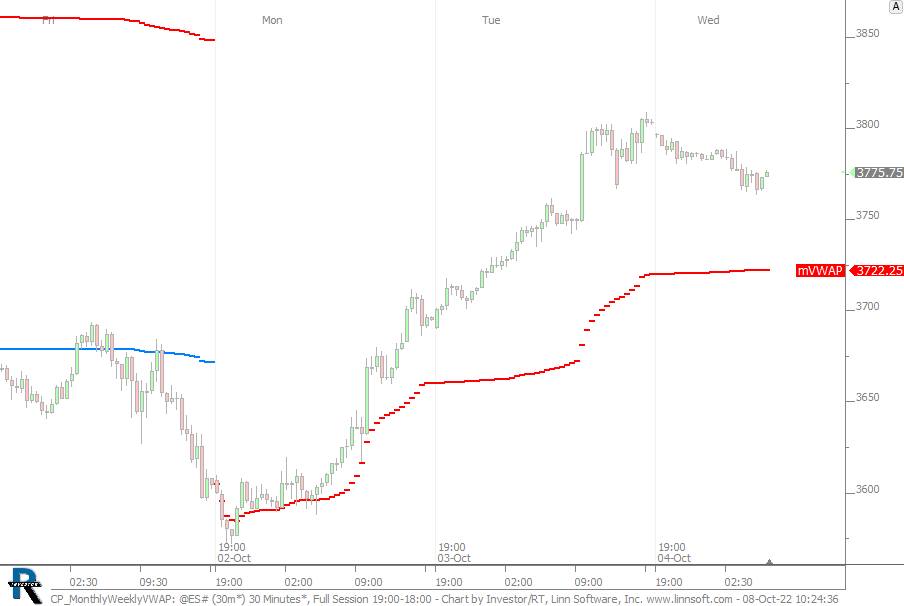 |
CP MonthlyWeeklyVWAP (@ES#) cpayne [totalcount]
3 years 9 months ago
Monthly (red) and weekly (blue) VWAP. This chart was uploaded by Investor/RT 15.1.11 showing symbol: @ES#. |
View |
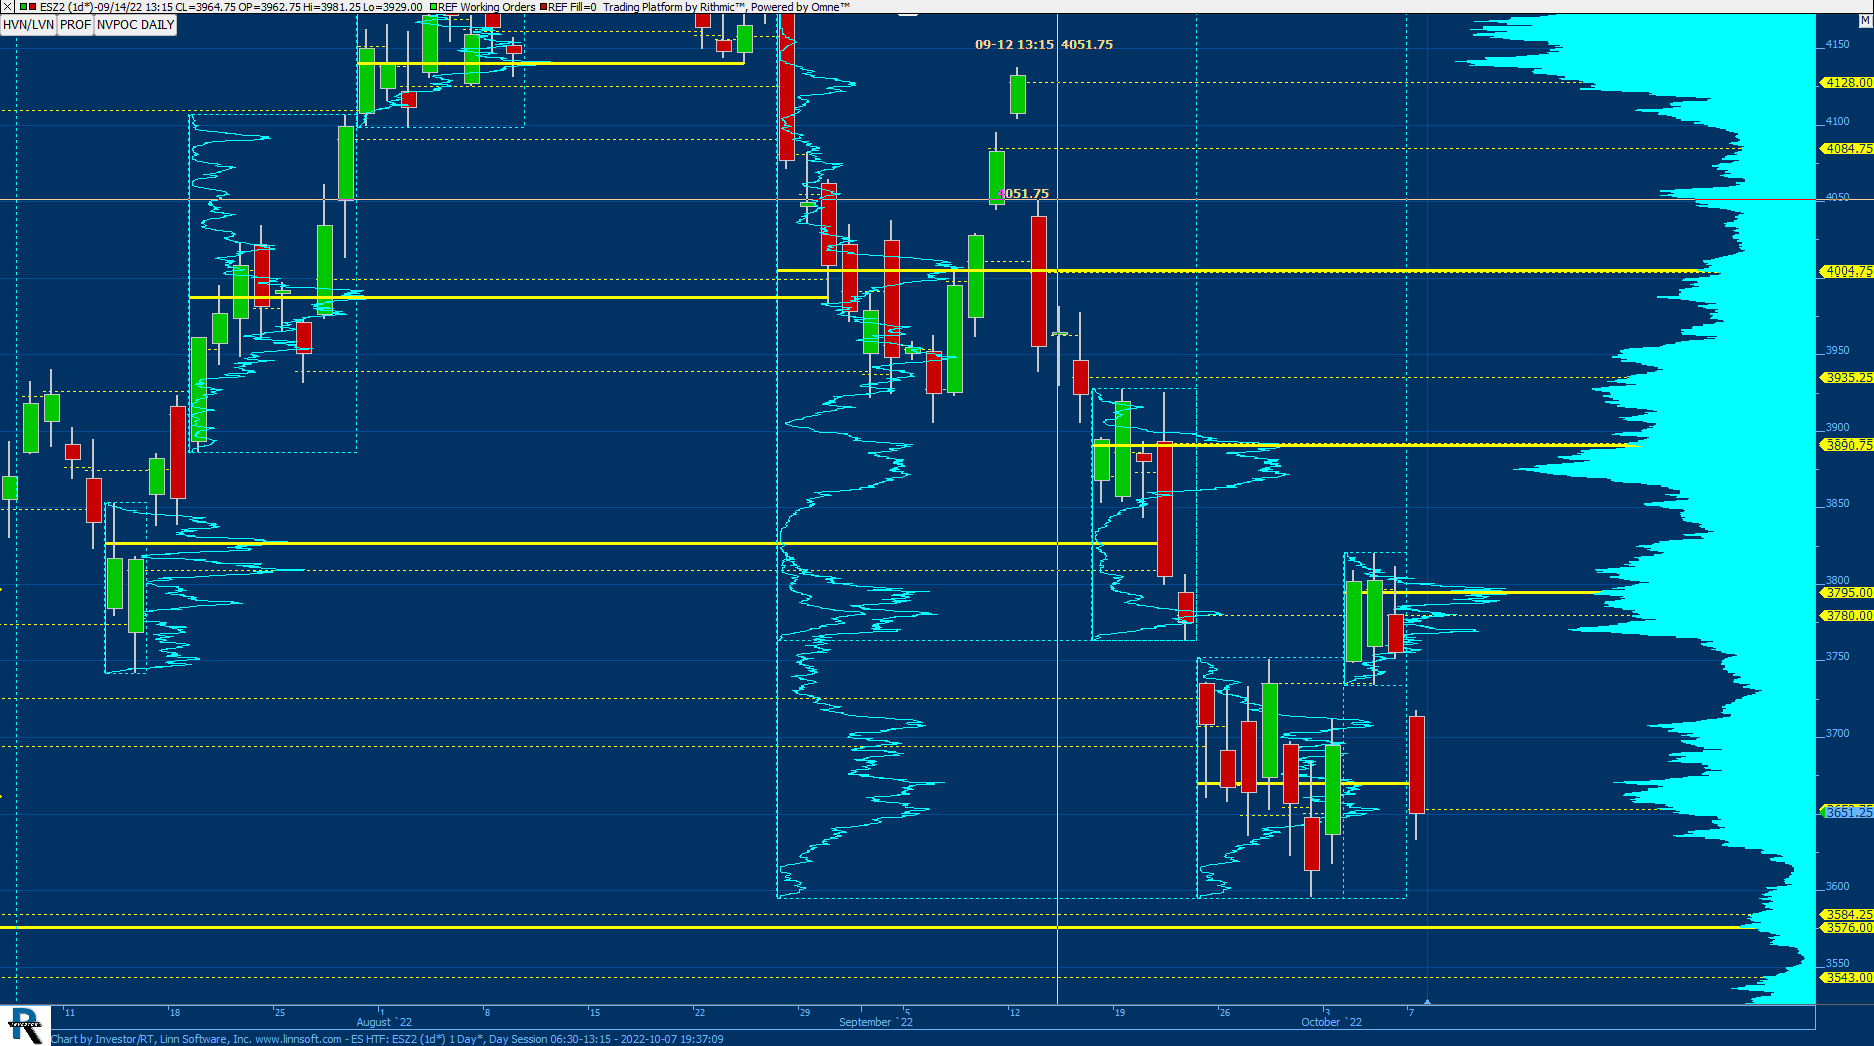 |
ES HTF (ESZ2) Dustin Sorenson [totalcount]
3 years 9 months ago
HTF Composite. This chart was uploaded by Investor/RT 15.1.9 showing symbol: ESZ2. |
View |
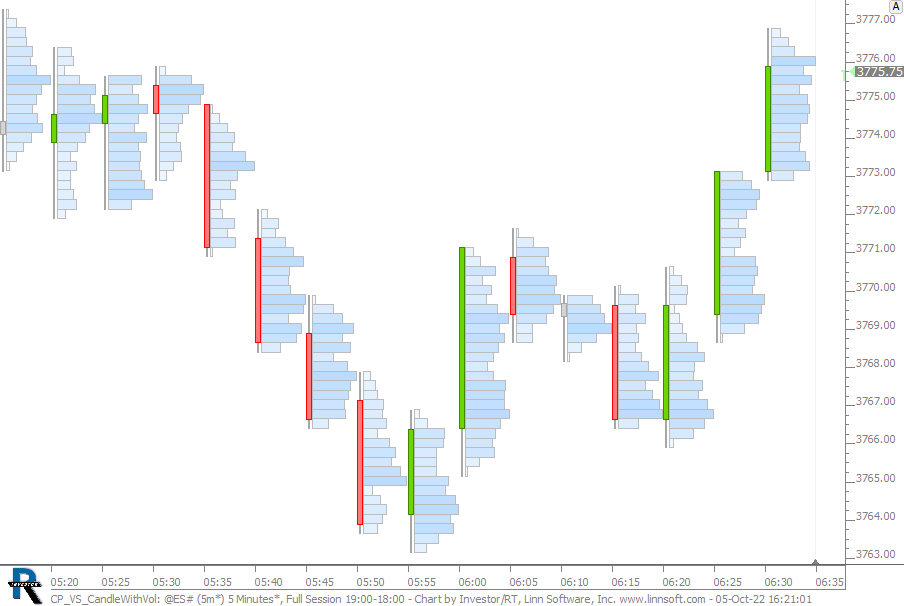 |
CP VS CandleWithVol (@ES#) cpayne [totalcount]
3 years 9 months ago
This chart was uploaded by Investor/RT 15.1.11 showing symbol: @ES#. |
View |
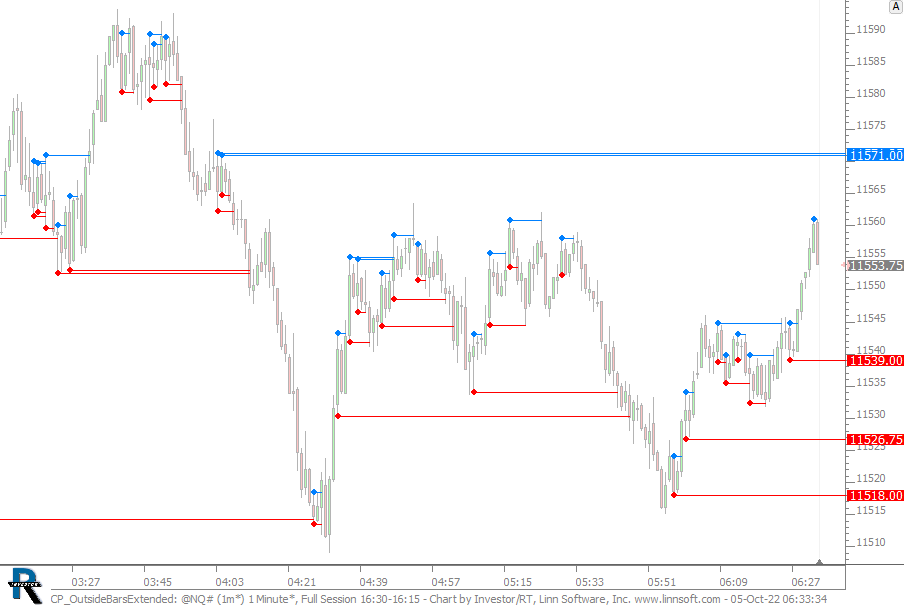 |
CP OutsideBarsExtended (@NQ#) cpayne [totalcount]
3 years 9 months ago
This chart was uploaded by Investor/RT 15.1.11 showing symbol: @NQ#. |
View |