 |
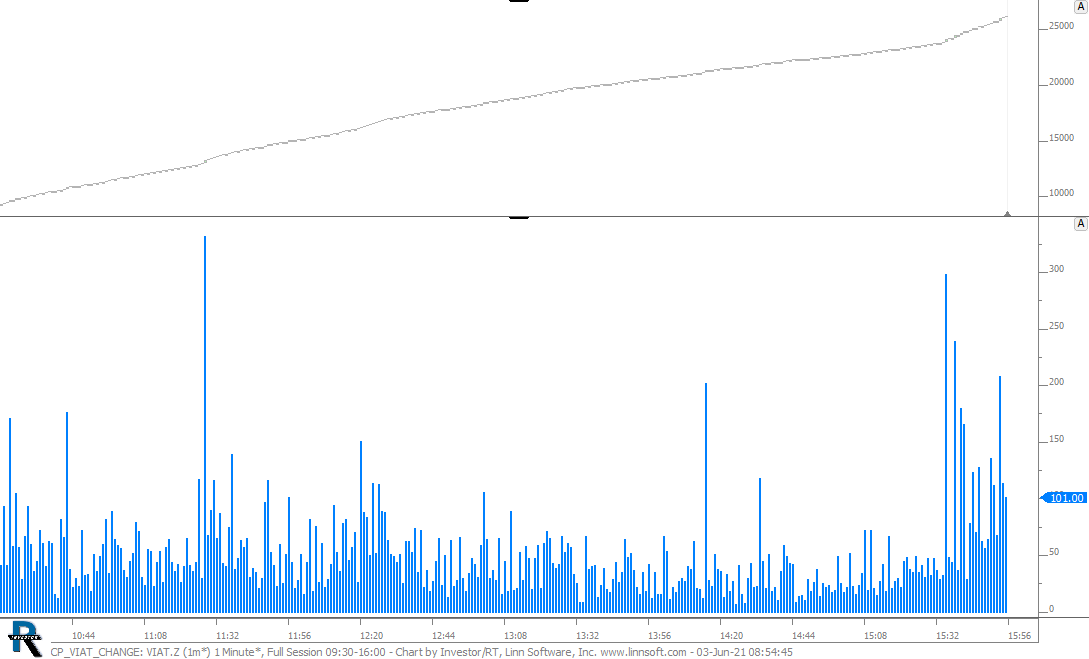
CP VIAT CHANGE (VIAT.Z) cpayne [totalcount]
5 years 1 month ago
This chart was uploaded by Investor/RT 14.2.7 showing symbol: VIAT.Z. |
View |
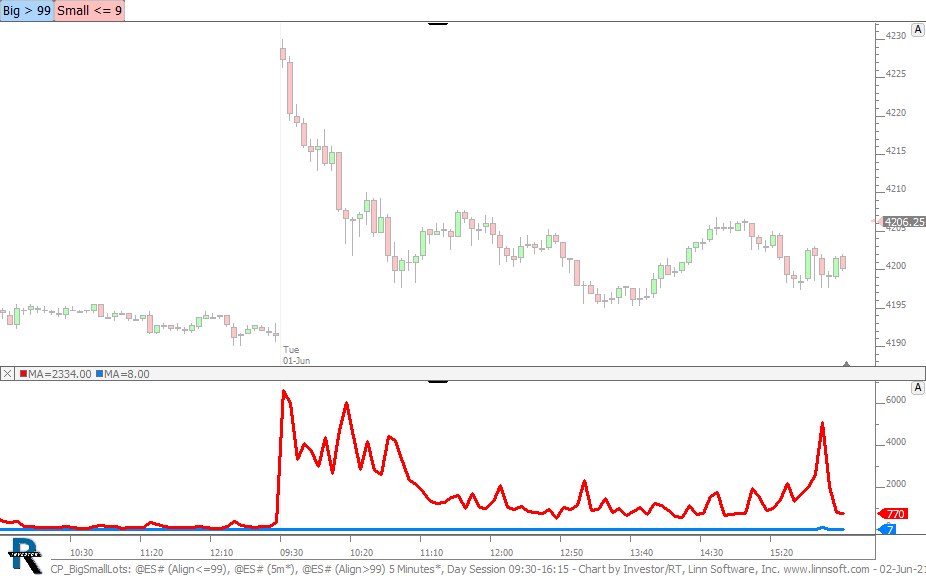 |
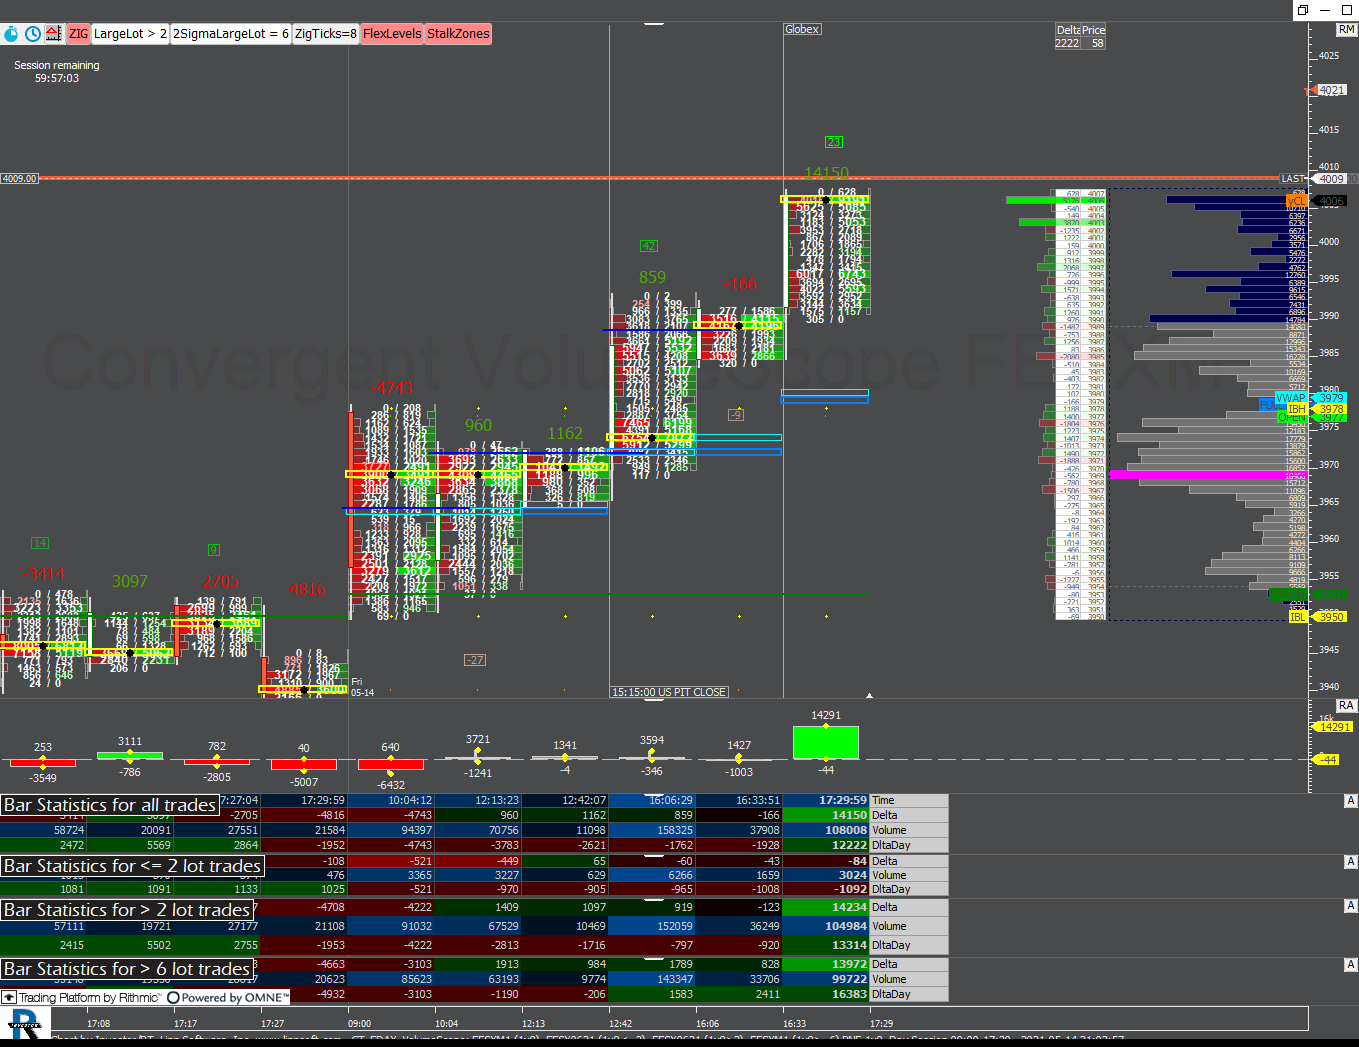
CP BigSmallLots (@ES#) cpayne [totalcount]
5 years 1 month ago
Big Trades vs Small Trades. This chart was uploaded by Investor/RT 14.2.7 showing symbol: @ES#. |
View |
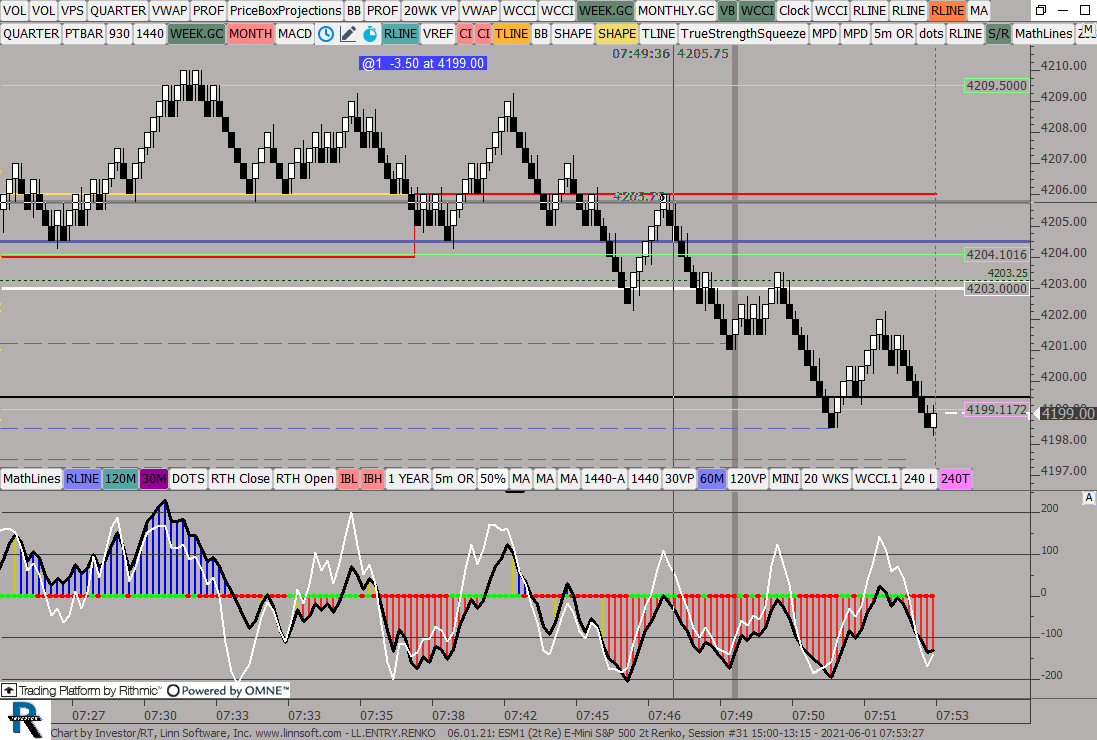 |
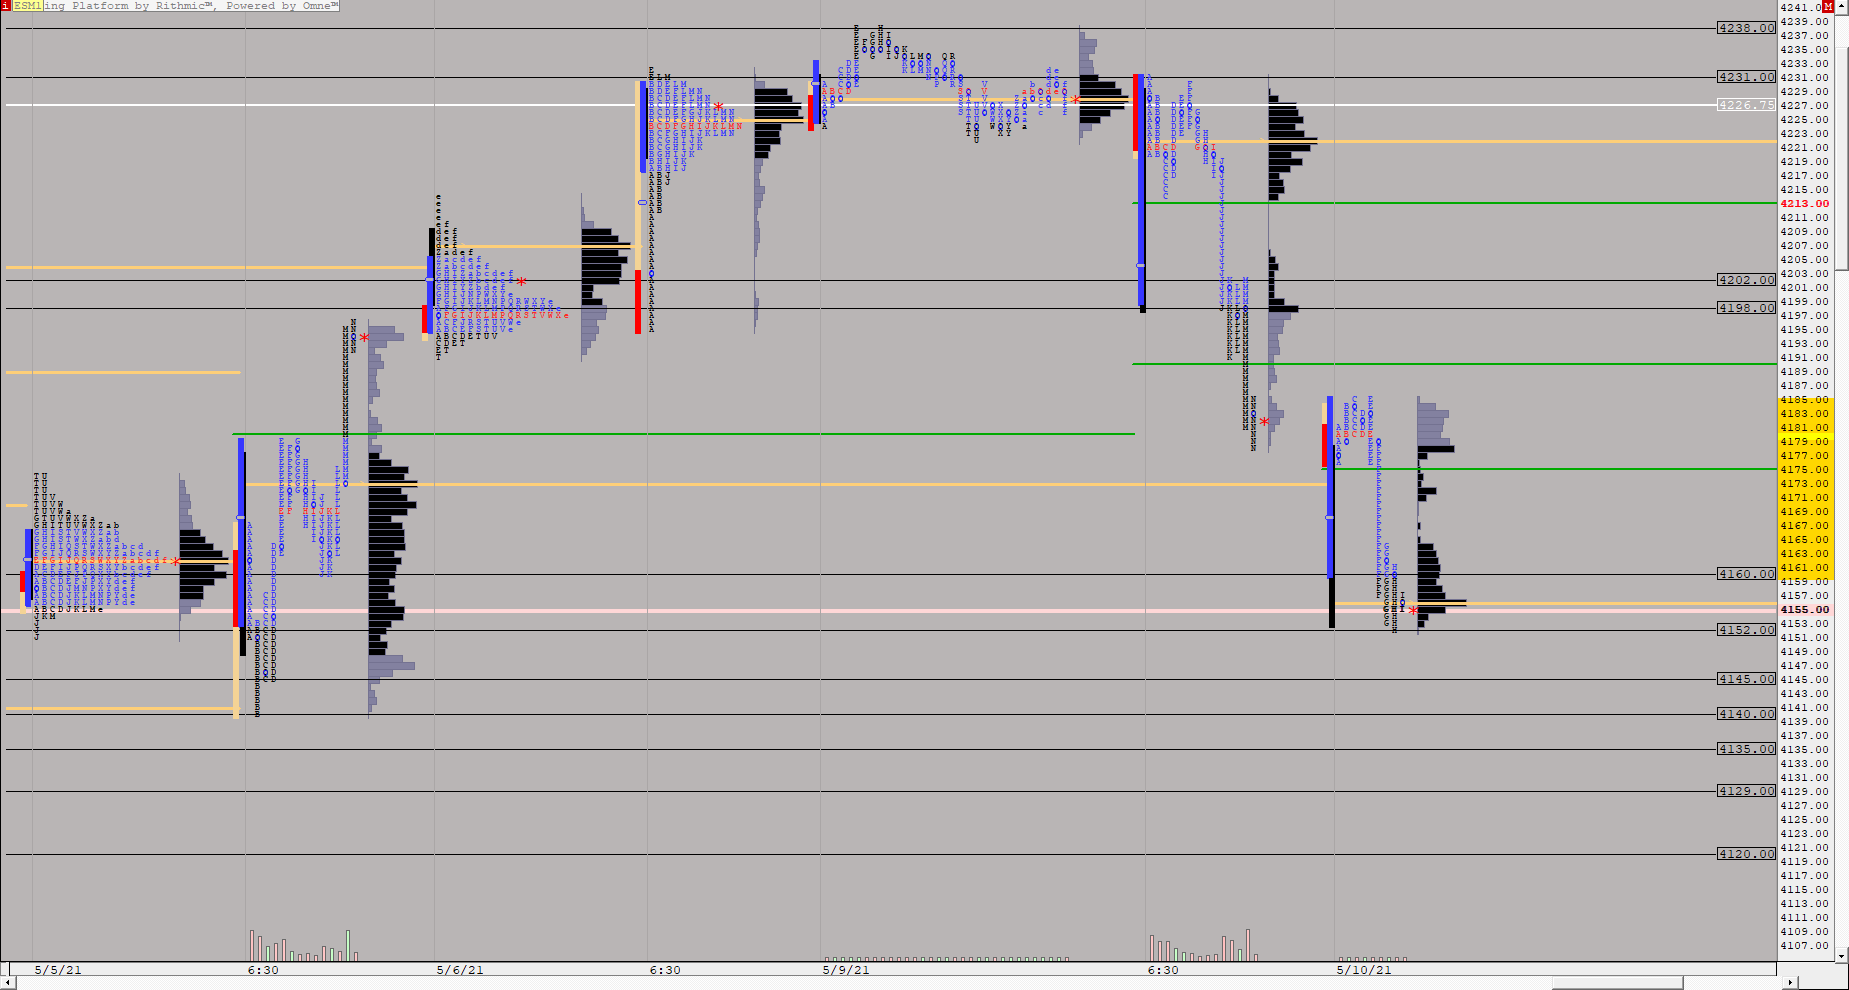
LLENTRYRENKO (ESM1) ES42 [totalcount]
5 years 1 month ago
This chart was uploaded by Investor/RT 14.2.6 showing symbol: ESM1. |
View |
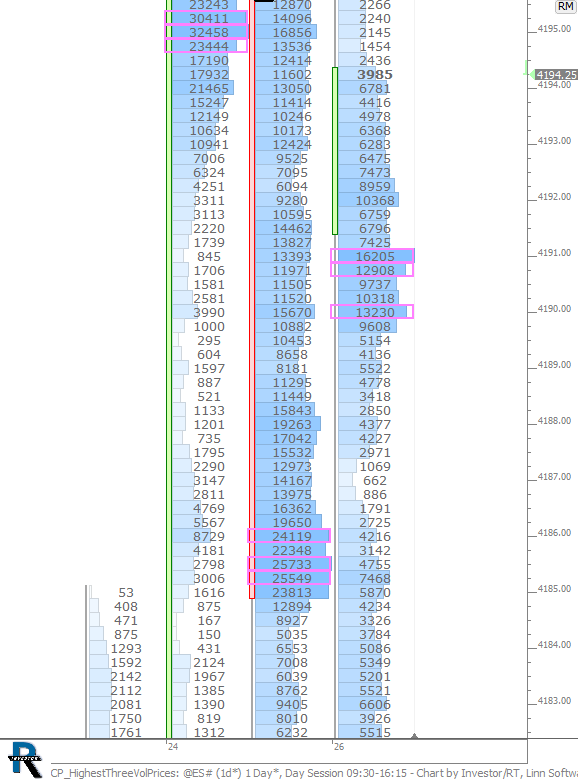 |
CP HighestThreeVolPrices (@ES#) cpayne [totalcount]
5 years 2 months ago
This chart was uploaded by Investor/RT 14.2.7 showing symbol: @ES#. |
View |
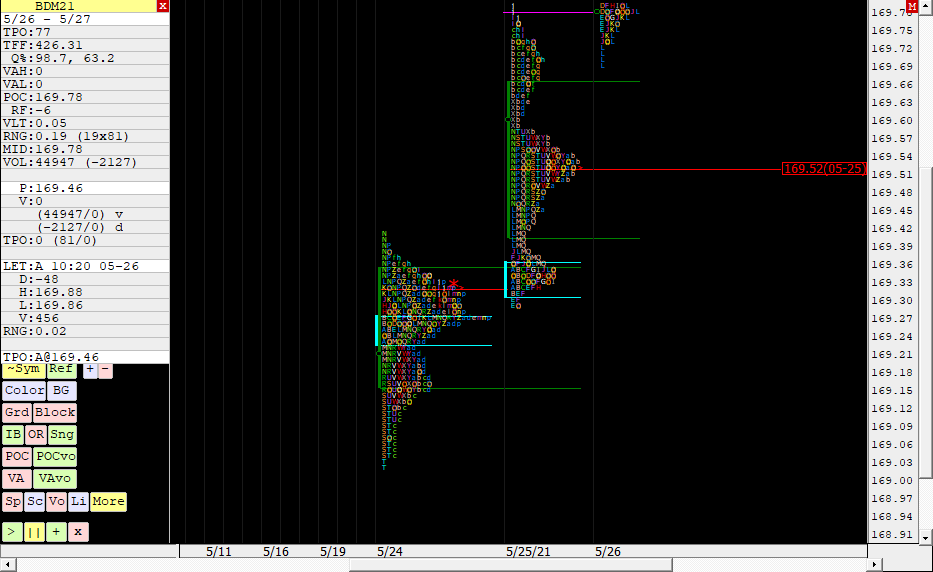 |
BDM21 TPO 8 (BDM21) adman47474 [totalcount]
5 years 2 months ago
Bund TPO chart only showing 3 days. This chart was uploaded by Investor/RT 14.2.6 showing symbol: BDM21. |
View |
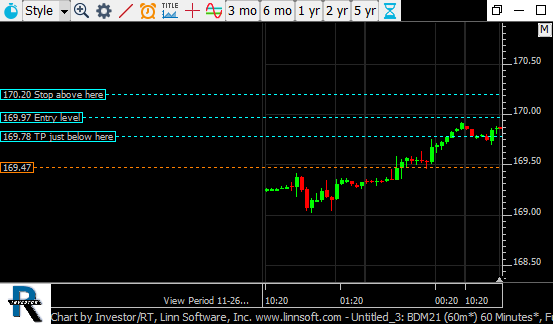 |
Untitled 3 (BDM21) adman47474 [totalcount]
5 years 2 months ago
Bund 1H chart incomplete. This chart was uploaded by Investor/RT 14.2.6 showing symbol: BDM21. |
View |
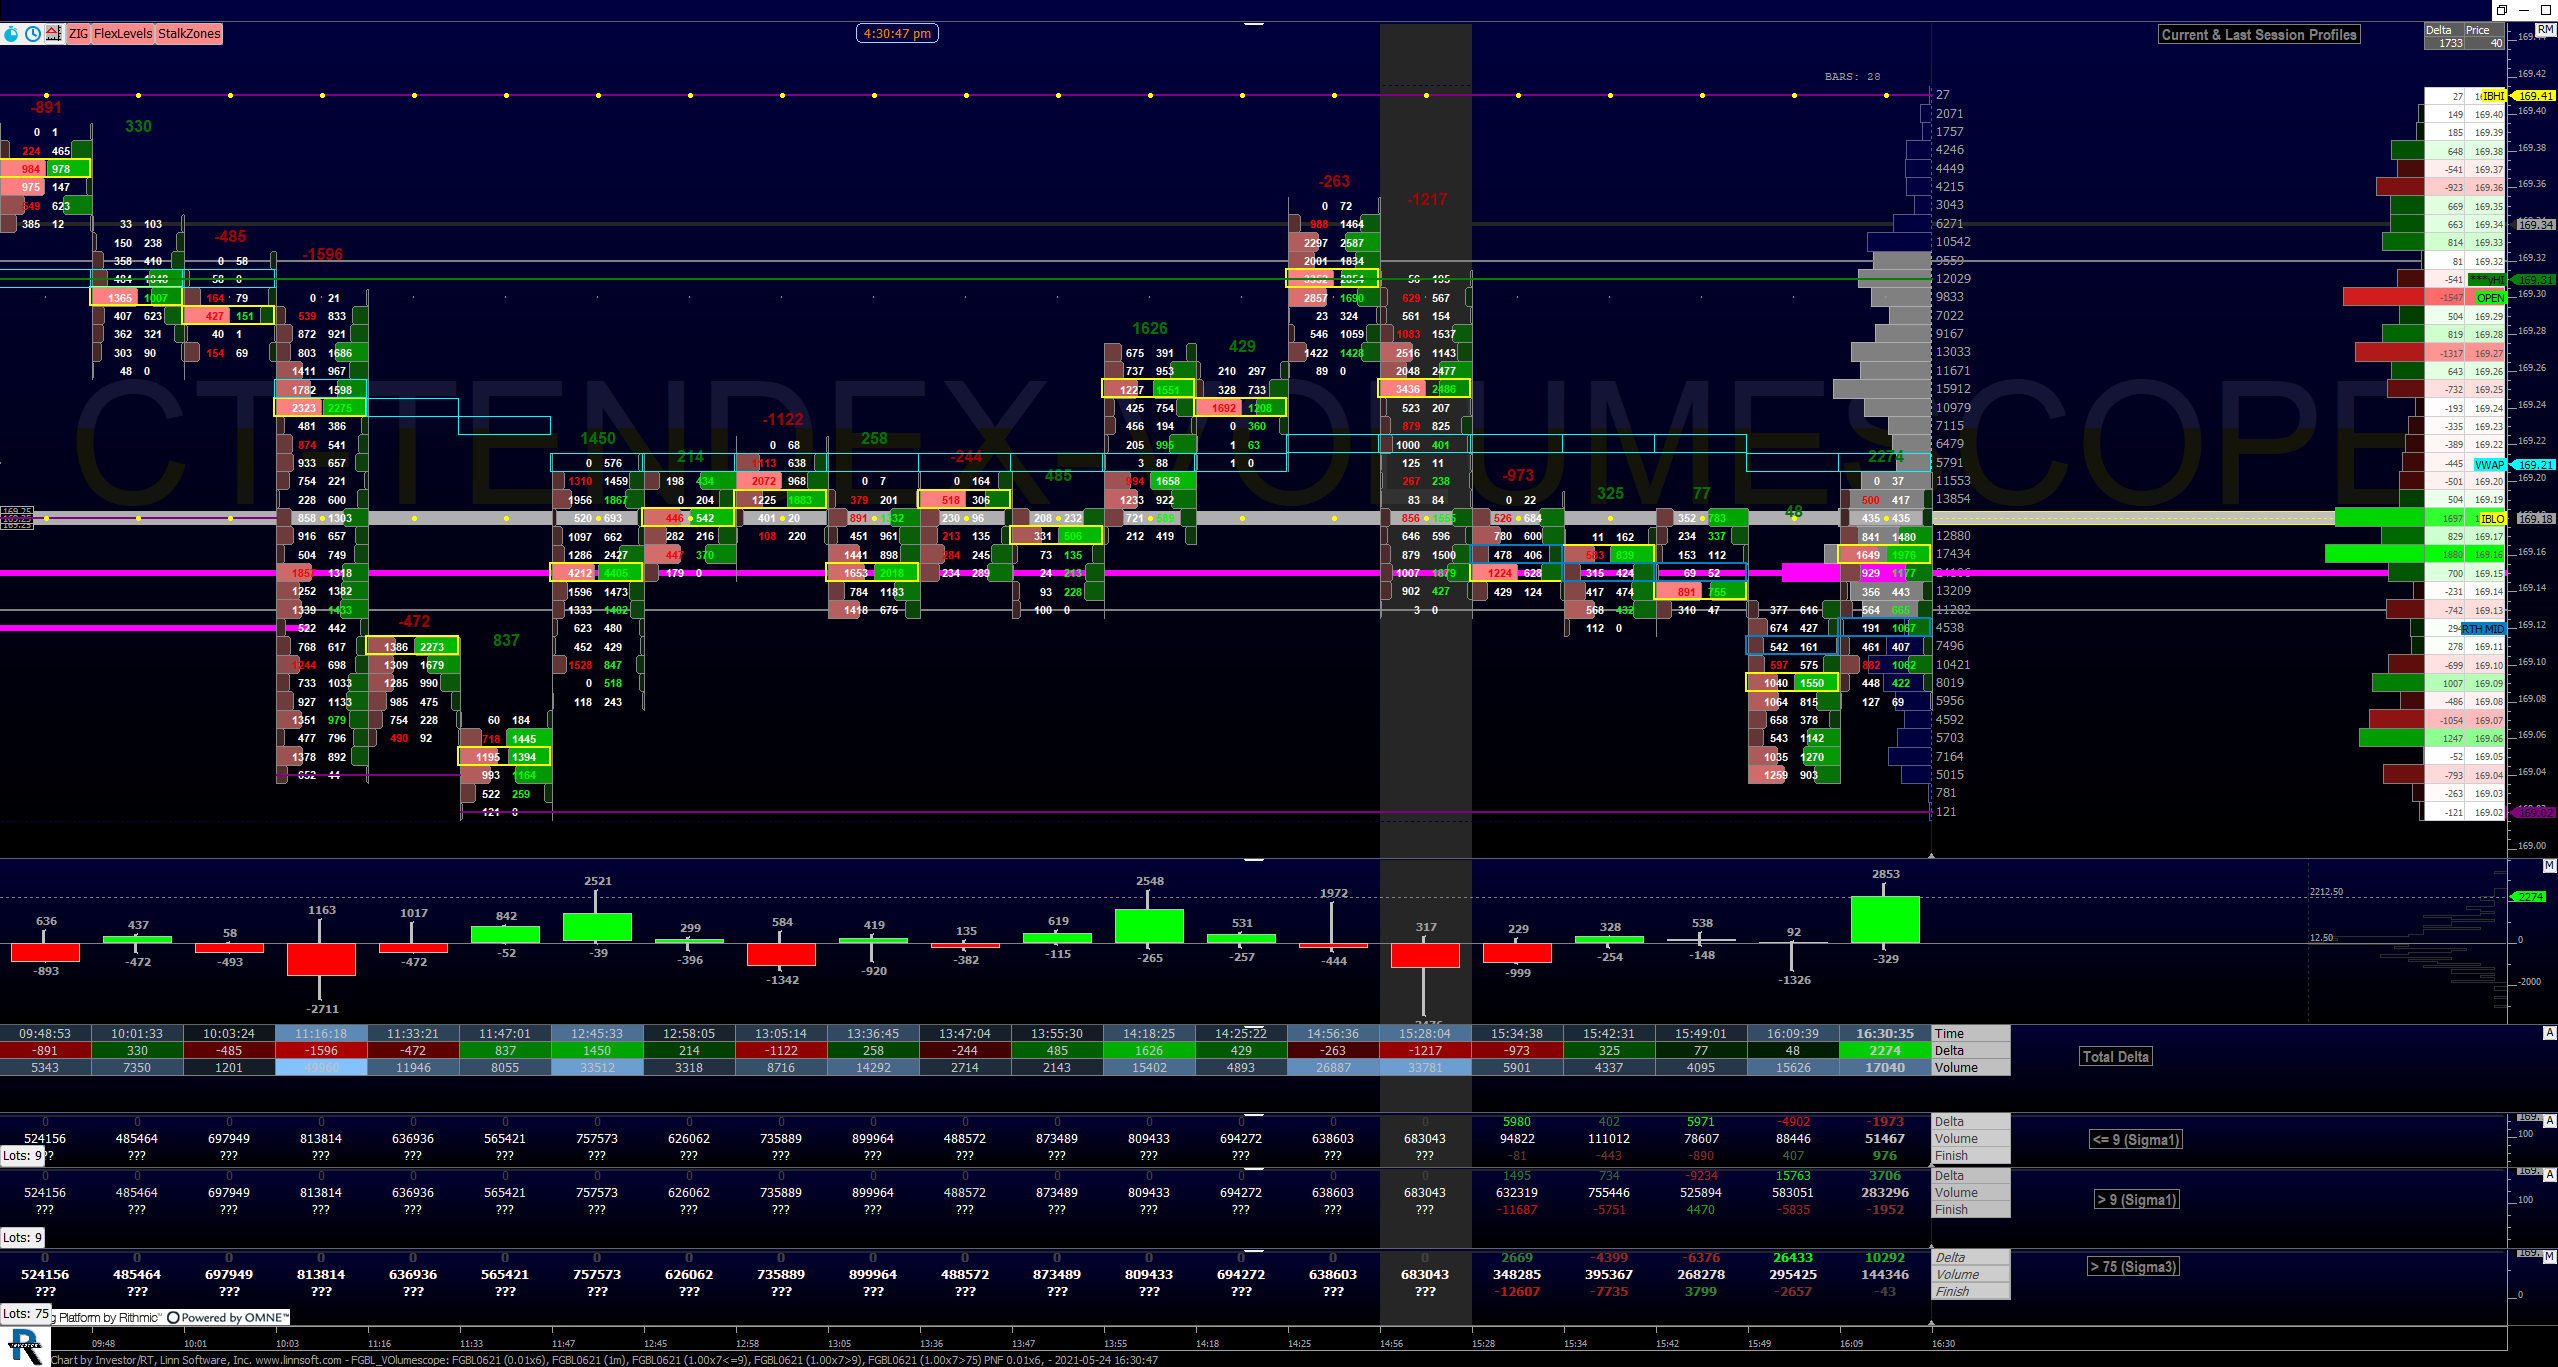 |
FGBL VOlumescope (FGBL0621) joakim millegard [totalcount]
5 years 2 months ago
volumescope- strange statistic 1. This chart was uploaded by Investor/RT 14.2.6 showing symbol: FGBL0621. |
View |
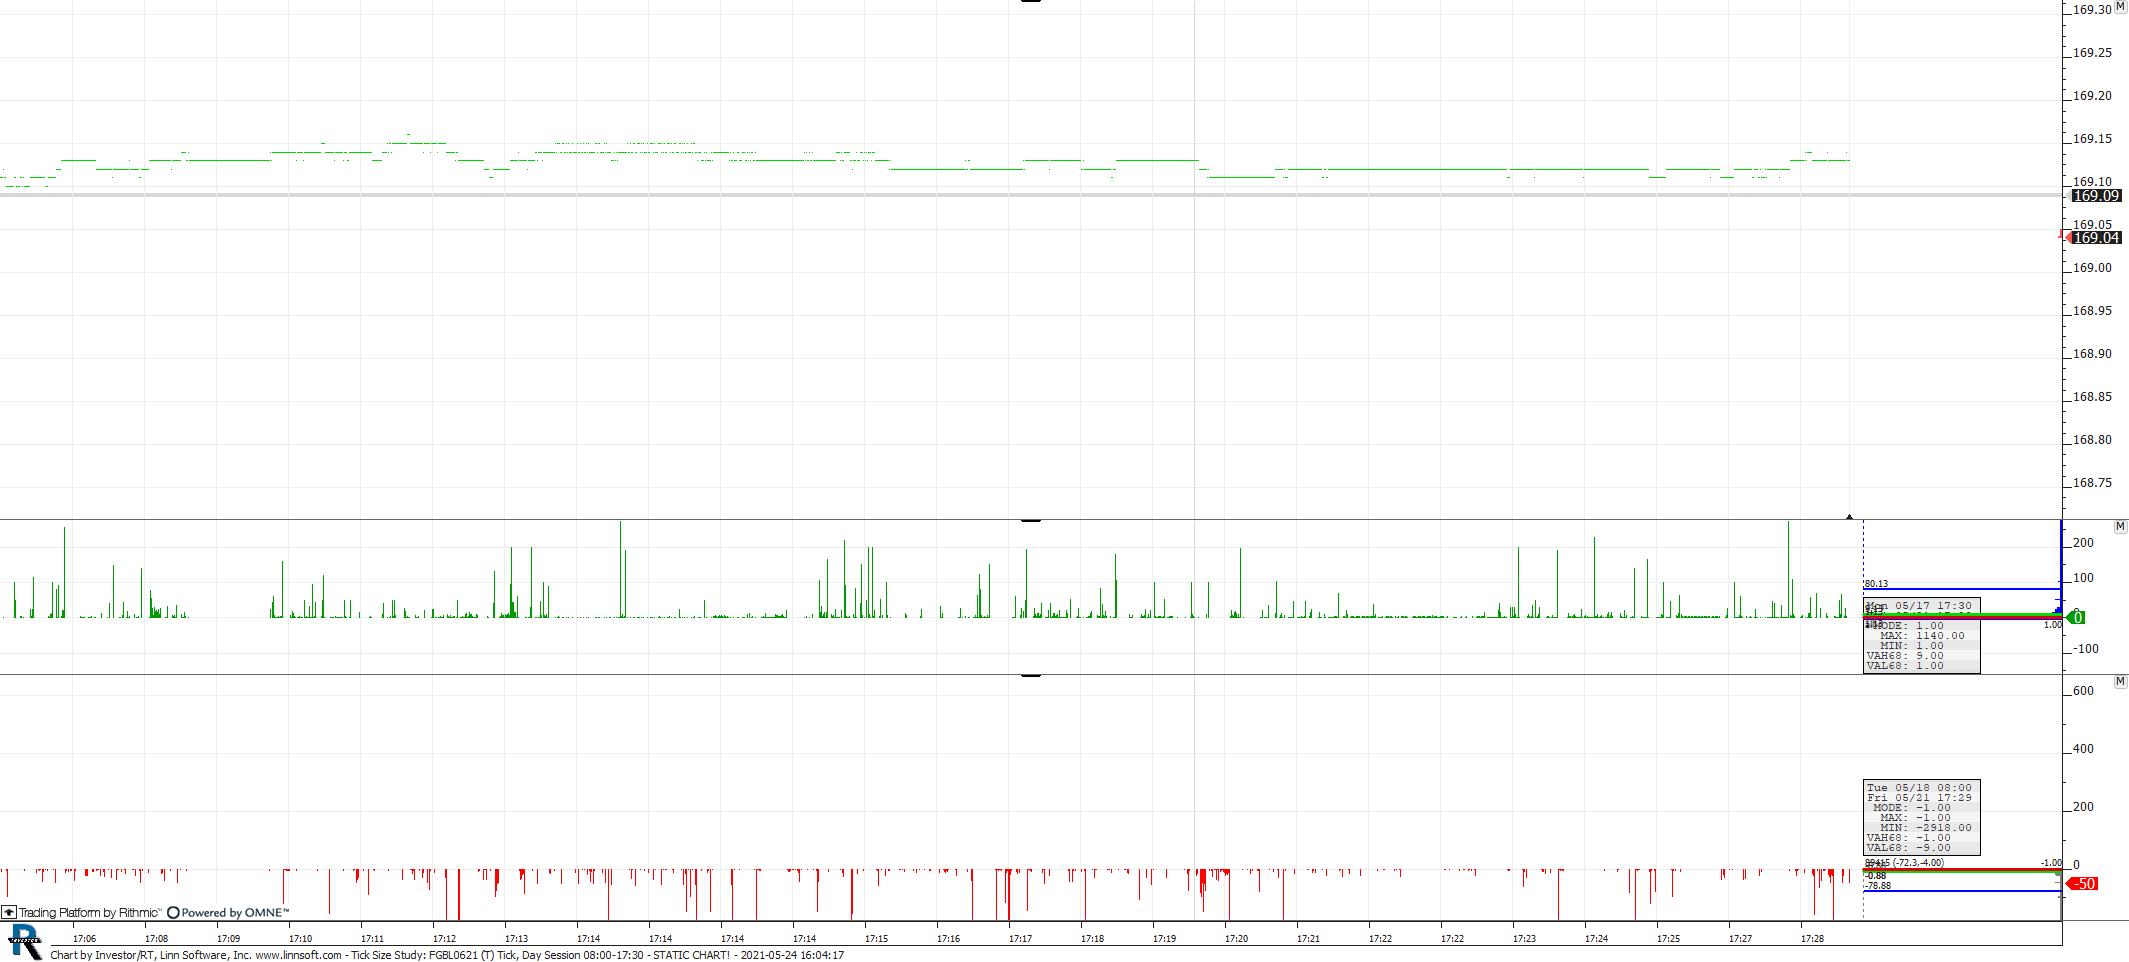 |
Tick Size Study (FGBL0621) joakim millegard [totalcount]
5 years 2 months ago
ticksizestudy. This chart was uploaded by Investor/RT 14.2.6 showing symbol: FGBL0621. |
View |
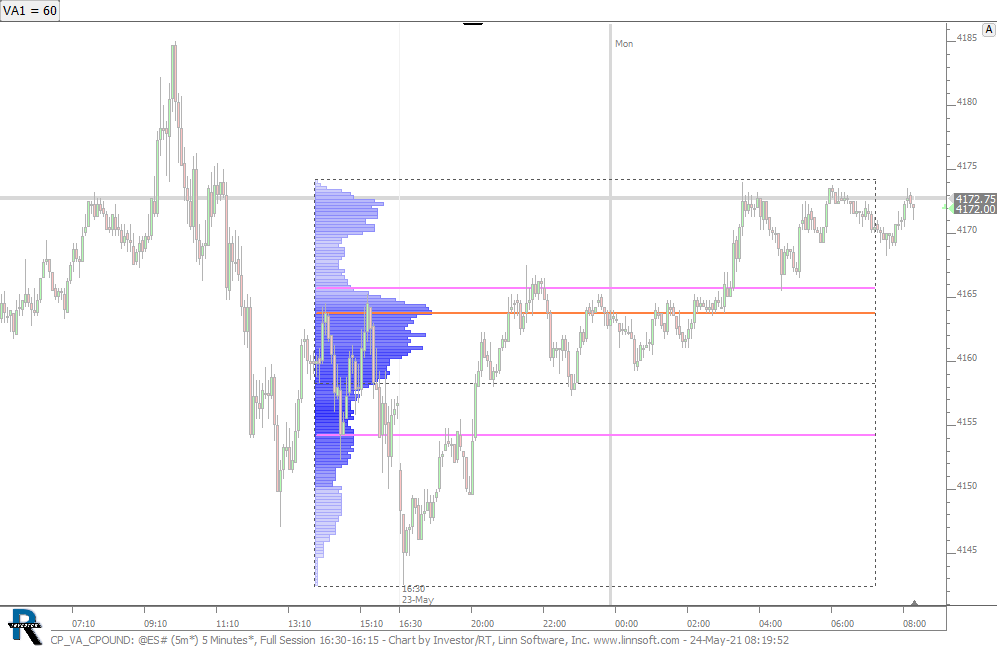 |
CP VA CPOUND (@ES#) cpayne [totalcount]
5 years 2 months ago
This chart was uploaded by Investor/RT 14.2.7 showing symbol: @ES#. |
View |
 |
24H TPO Chart (ESM1) ES42 [totalcount]
5 years 2 months ago
This chart was uploaded by Investor/RT 14.2.6 showing symbol: ESM1. |
View |
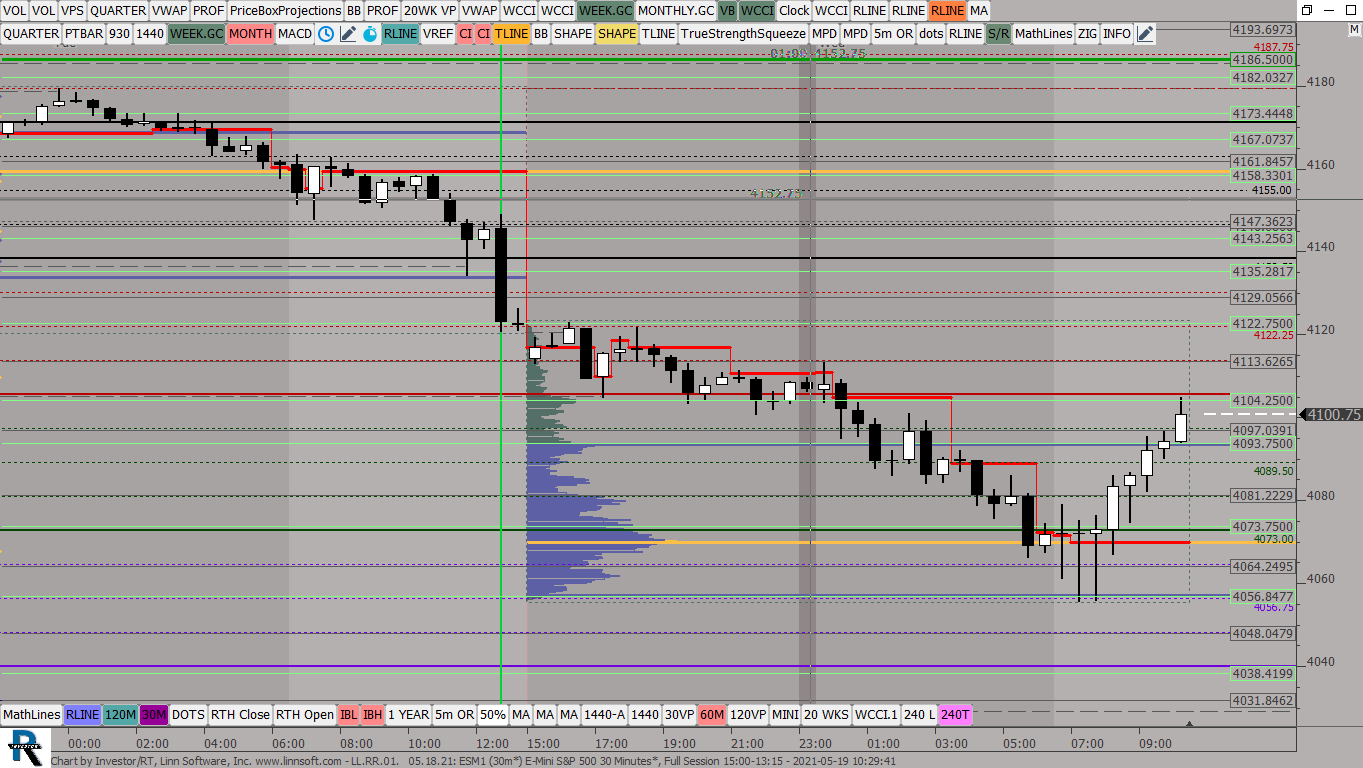 |
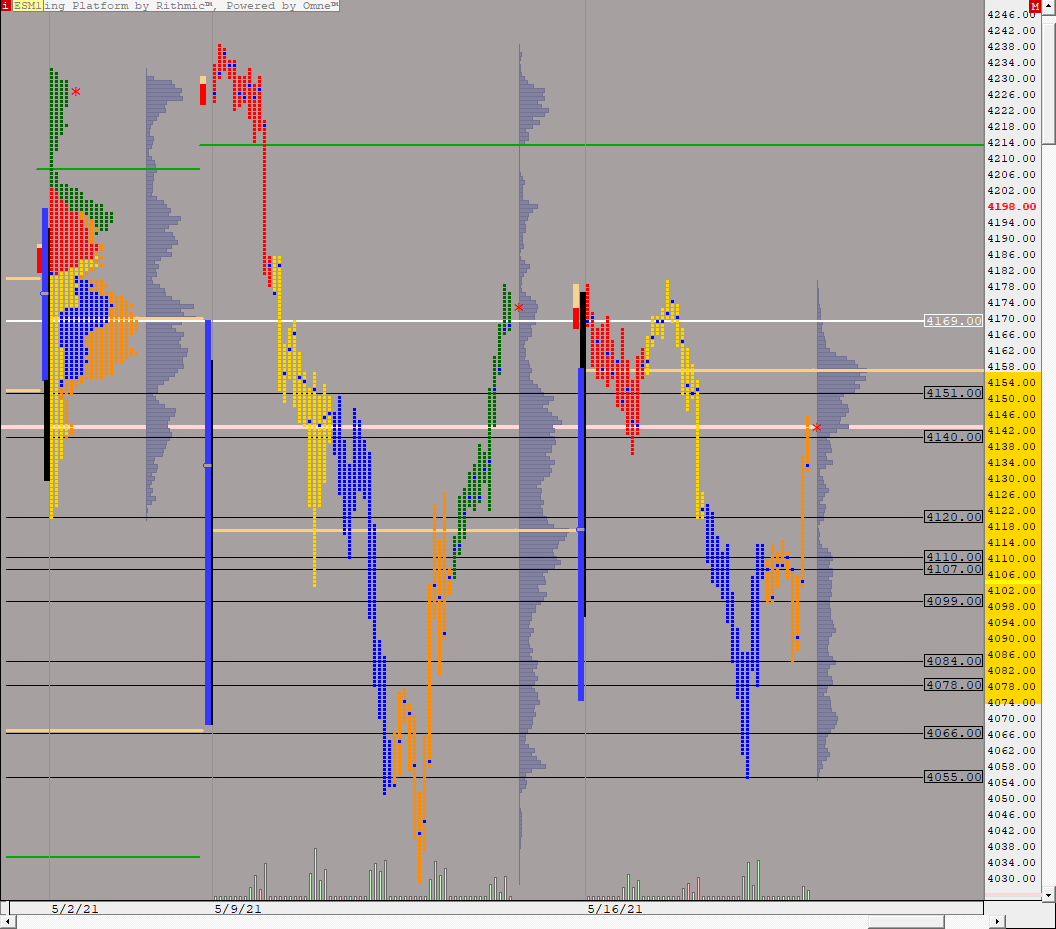
LLRR01 (ESM1) ES42 [totalcount]
5 years 2 months ago
This chart was uploaded by Investor/RT 14.2.6 showing symbol: ESM1. |
View |
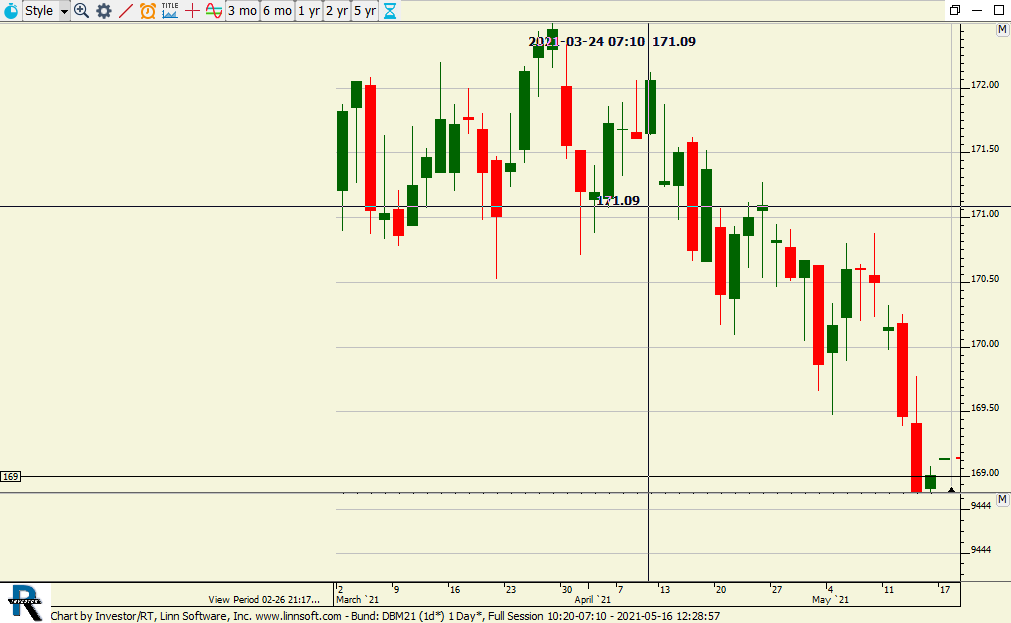 |
Bund (DBM21) adman47474 [totalcount]
5 years 2 months ago
Bund no real time data. This chart was uploaded by Investor/RT 14.2.6 showing symbol: DBM21. |
View |
 |
CT FDAX VolumeScope (FESXM1) joakim millegard [totalcount]
5 years 2 months ago
volumescope- notupdating. This chart was uploaded by Investor/RT 14.2.6 showing symbol: FESXM1. |
View |
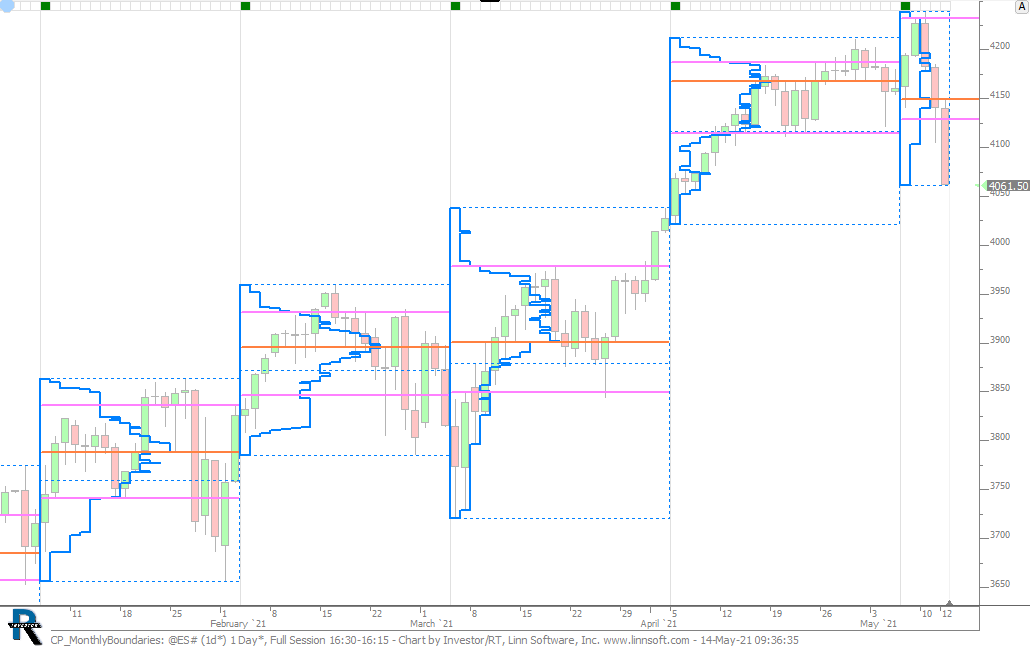 |
CP MonthlyBoundaries (@ES#) cpayne [totalcount]
5 years 2 months ago
Monthly profiles linked to boundaries. This chart was uploaded by Investor/RT 14.2.7 showing symbol: @ES#. |
View |
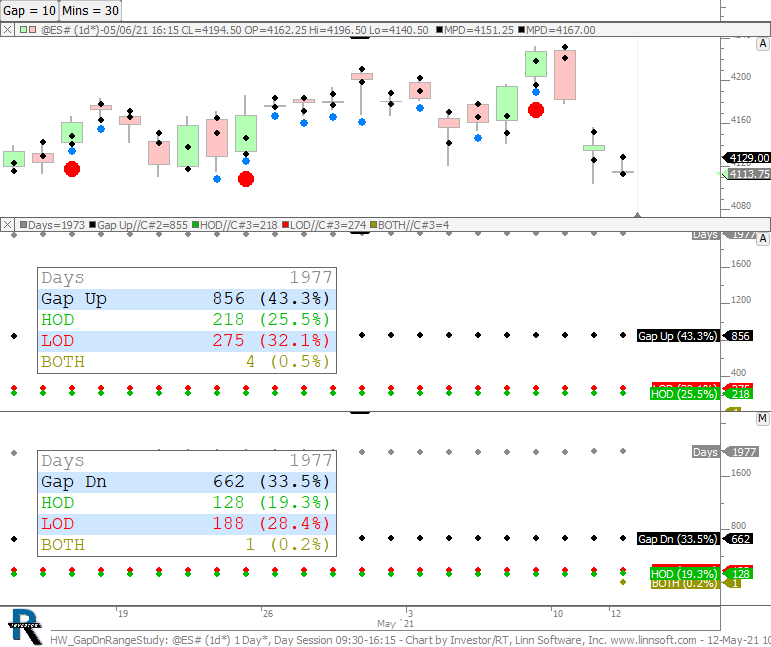 |
HW GapDnRangeStudy (@ES#) cpayne [totalcount]
5 years 2 months ago
Gap Up and Gap Down Days. How often is the HOD and LOD created in first X minutes on days that gap up or down. Gap (in ticks) and X Minutes both controlled by buttons at top. |
View |
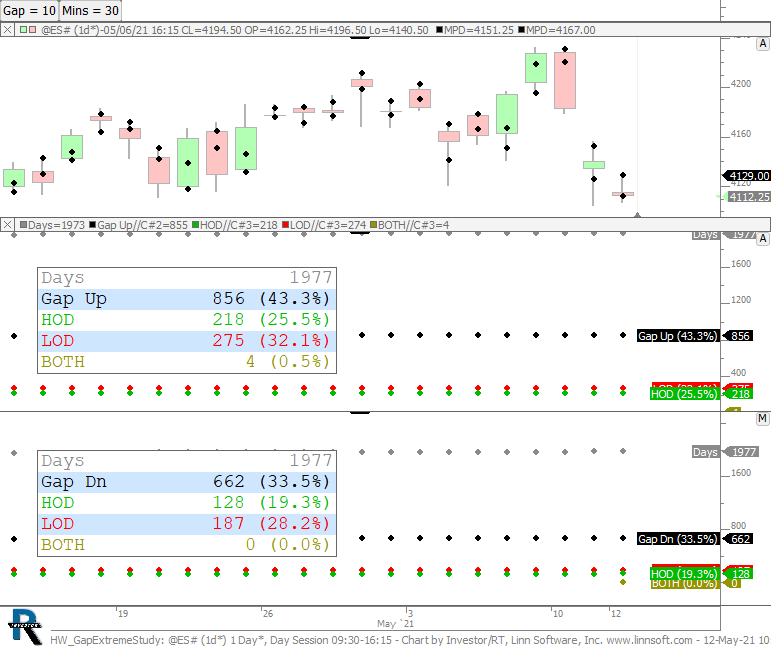 |
HW GapExtremeStudy (@ES#) cpayne [totalcount]
5 years 2 months ago
Gap Up and Gap Down Days. How often is the HOD and LOD created in first X minutes on days that gap up or down. Gap (in ticks) and X Minutes both controlled by buttons at top. |
View |
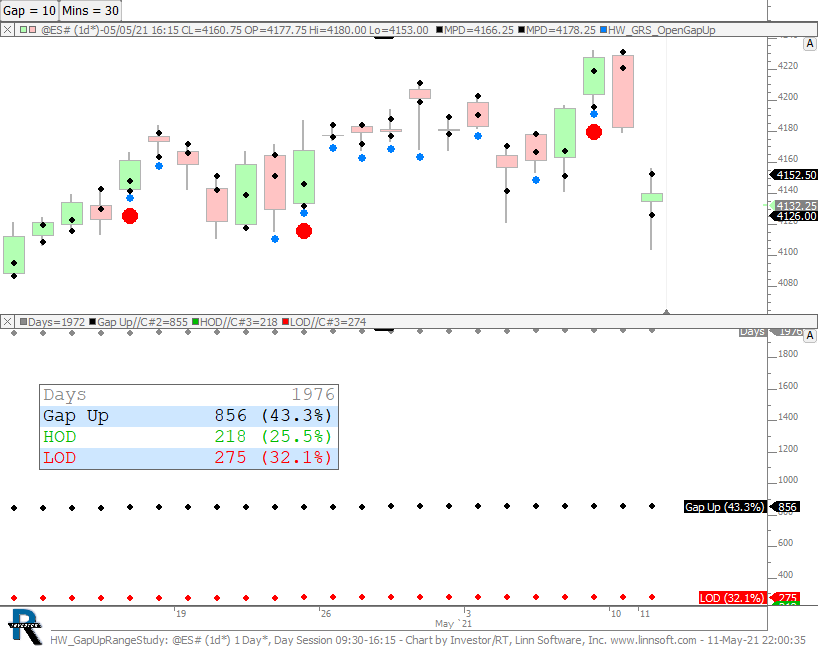 |
HW GapUpRangeStudy (@ES#) cpayne [totalcount]
5 years 2 months ago
This chart was uploaded by Investor/RT 14.2.6 showing symbol: @ES#. |
View |
 |
ESTPO 1POINT (ESM1) ES42 [totalcount]
5 years 2 months ago
Daily Profiles, 1 point ticks. This chart was uploaded by Investor/RT 14.2.6 showing symbol: ESM1. |
View |
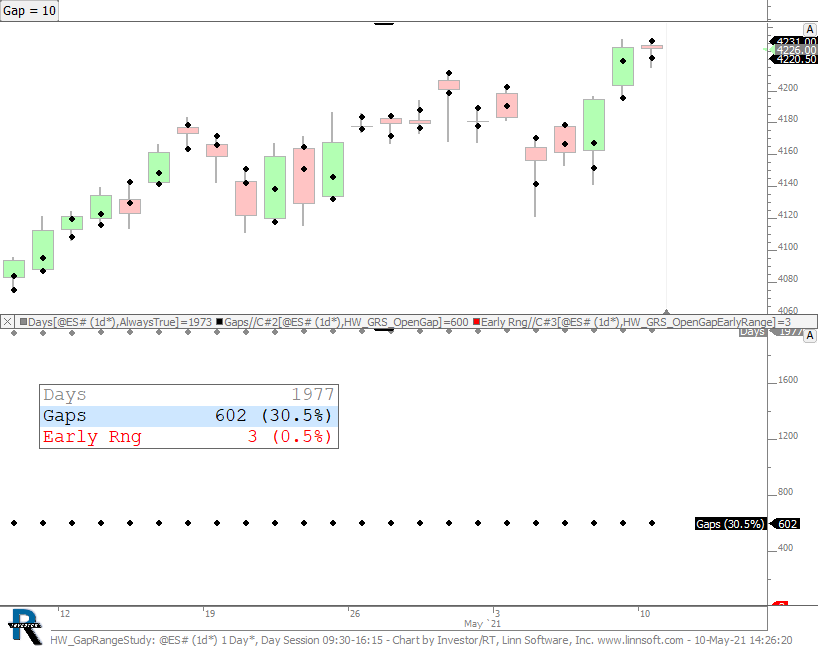 |
HW GapRangeStudy (@ES#) cpayne [totalcount]
5 years 2 months ago
Homework - Open Gap days and how often they result in range being established in first 30 minutes. This chart was uploaded by Investor/RT 14.2.6 showing symbol: @ES#. |
View |
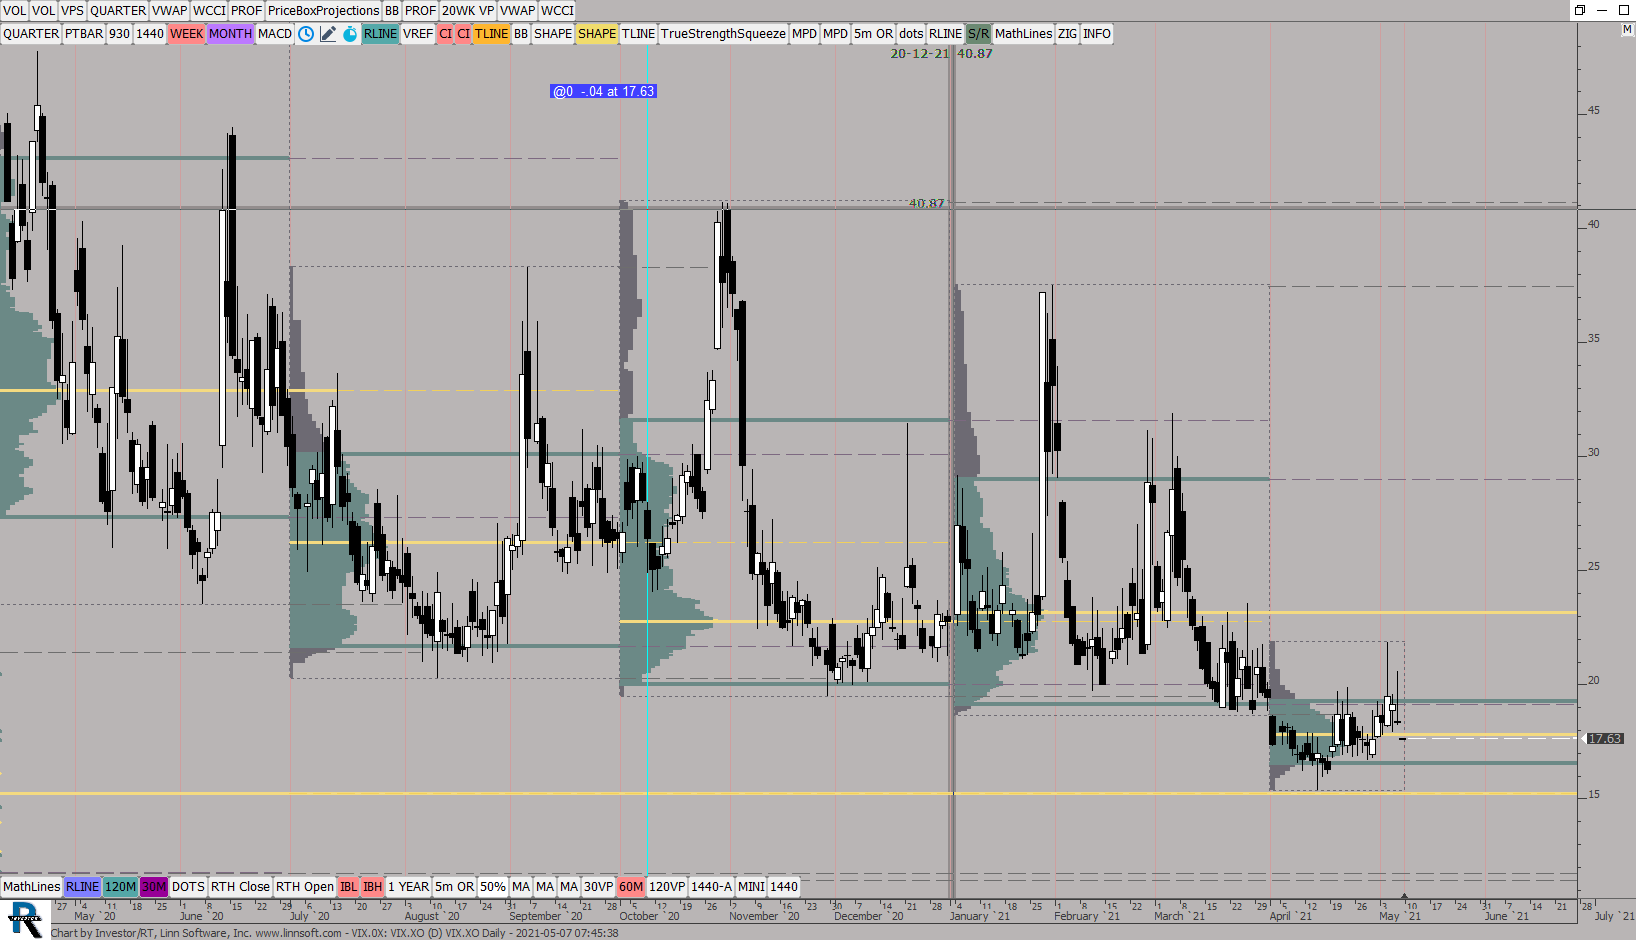 |
VIX0X (VIX.XO) ES42 [totalcount]
5 years 2 months ago
This chart was uploaded by Investor/RT 14.2.6 showing symbol: VIX.XO. |
View |
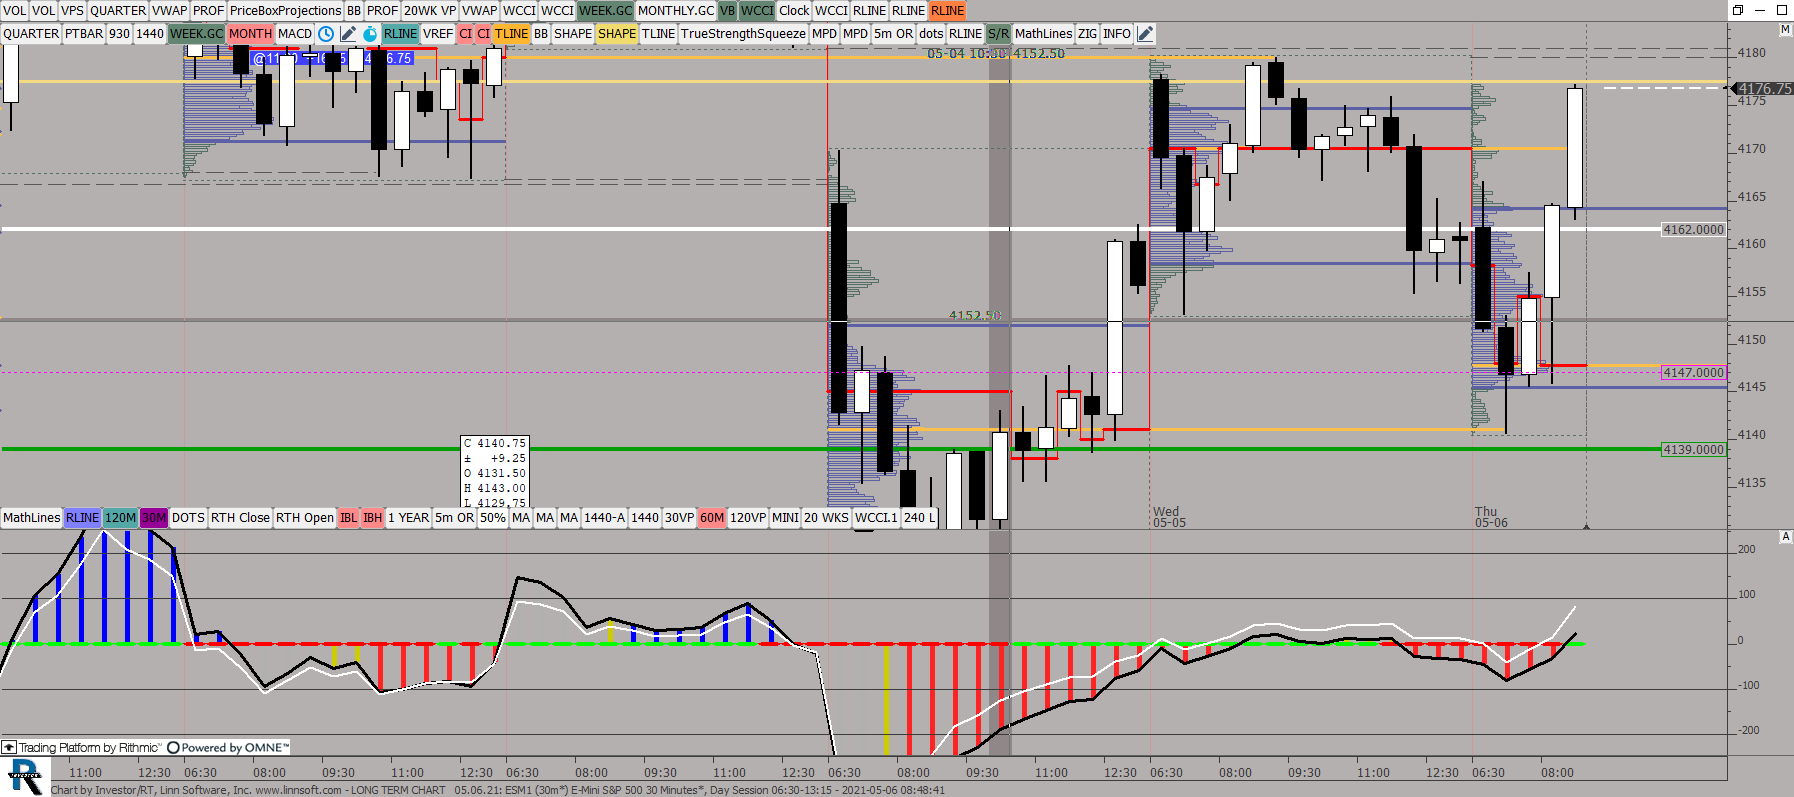 |
LONG TERM CHART (ESM1) ES42 [totalcount]
5 years 2 months ago
This chart was uploaded by Investor/RT 14.2.6 showing symbol: ESM1. |
View |
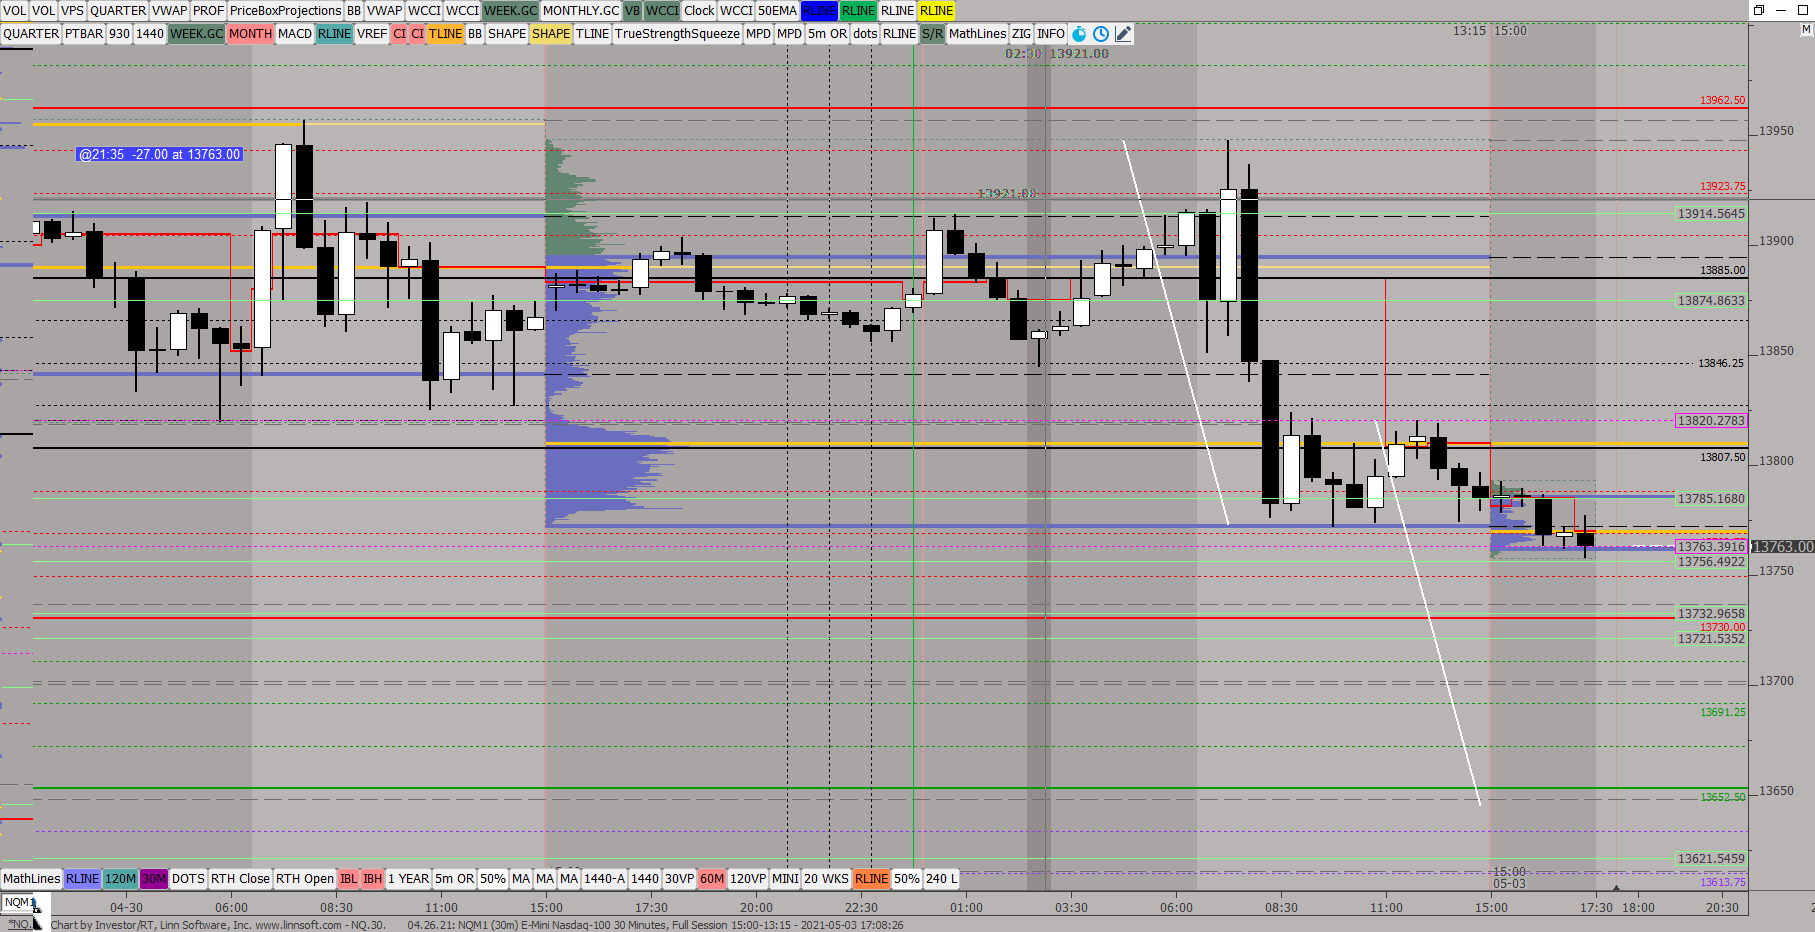 |
NQ30 (NQM1) ES42 [totalcount]
5 years 2 months ago
This chart was uploaded by Investor/RT 14.2.6 showing symbol: NQM1. |
View |
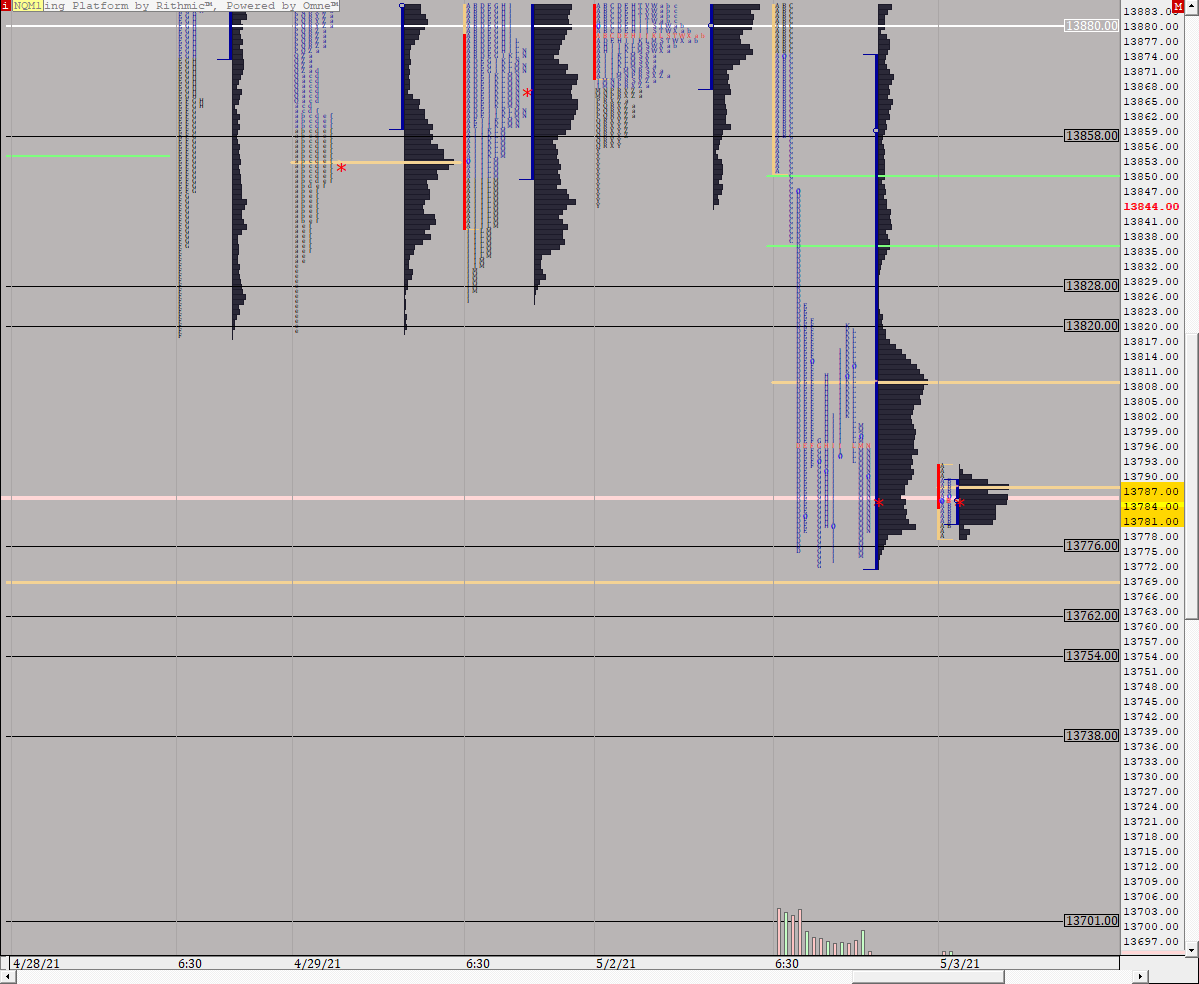 |
TPO NQ (NQM1) ES42 [totalcount]
5 years 2 months ago
This chart was uploaded by Investor/RT 14.2.6 showing symbol: NQM1. |
View |
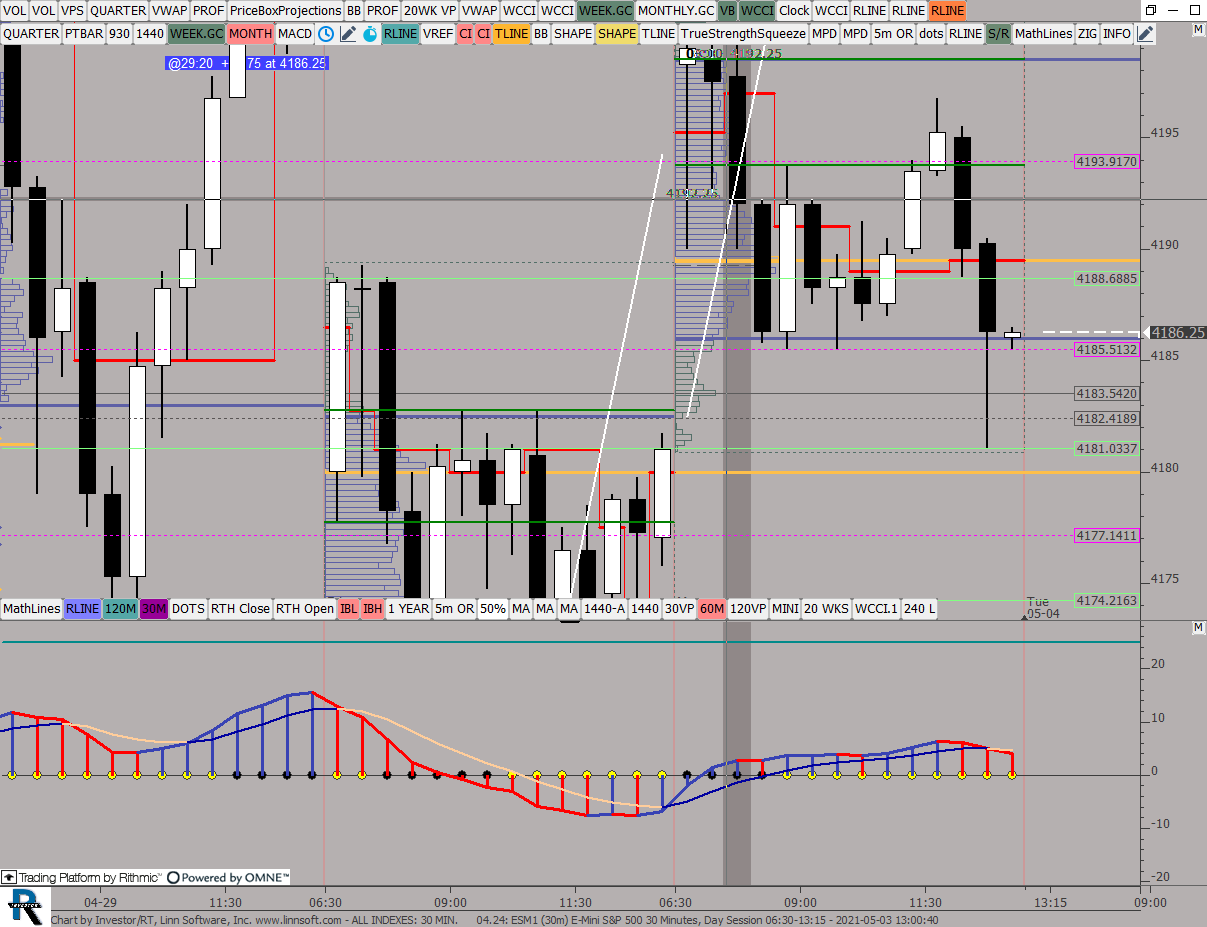 |
ALL INDEXES 30 MIN (ESM1) ES42 [totalcount]
5 years 2 months ago
This chart was uploaded by Investor/RT 14.2.6 showing symbol: ESM1. |
View |
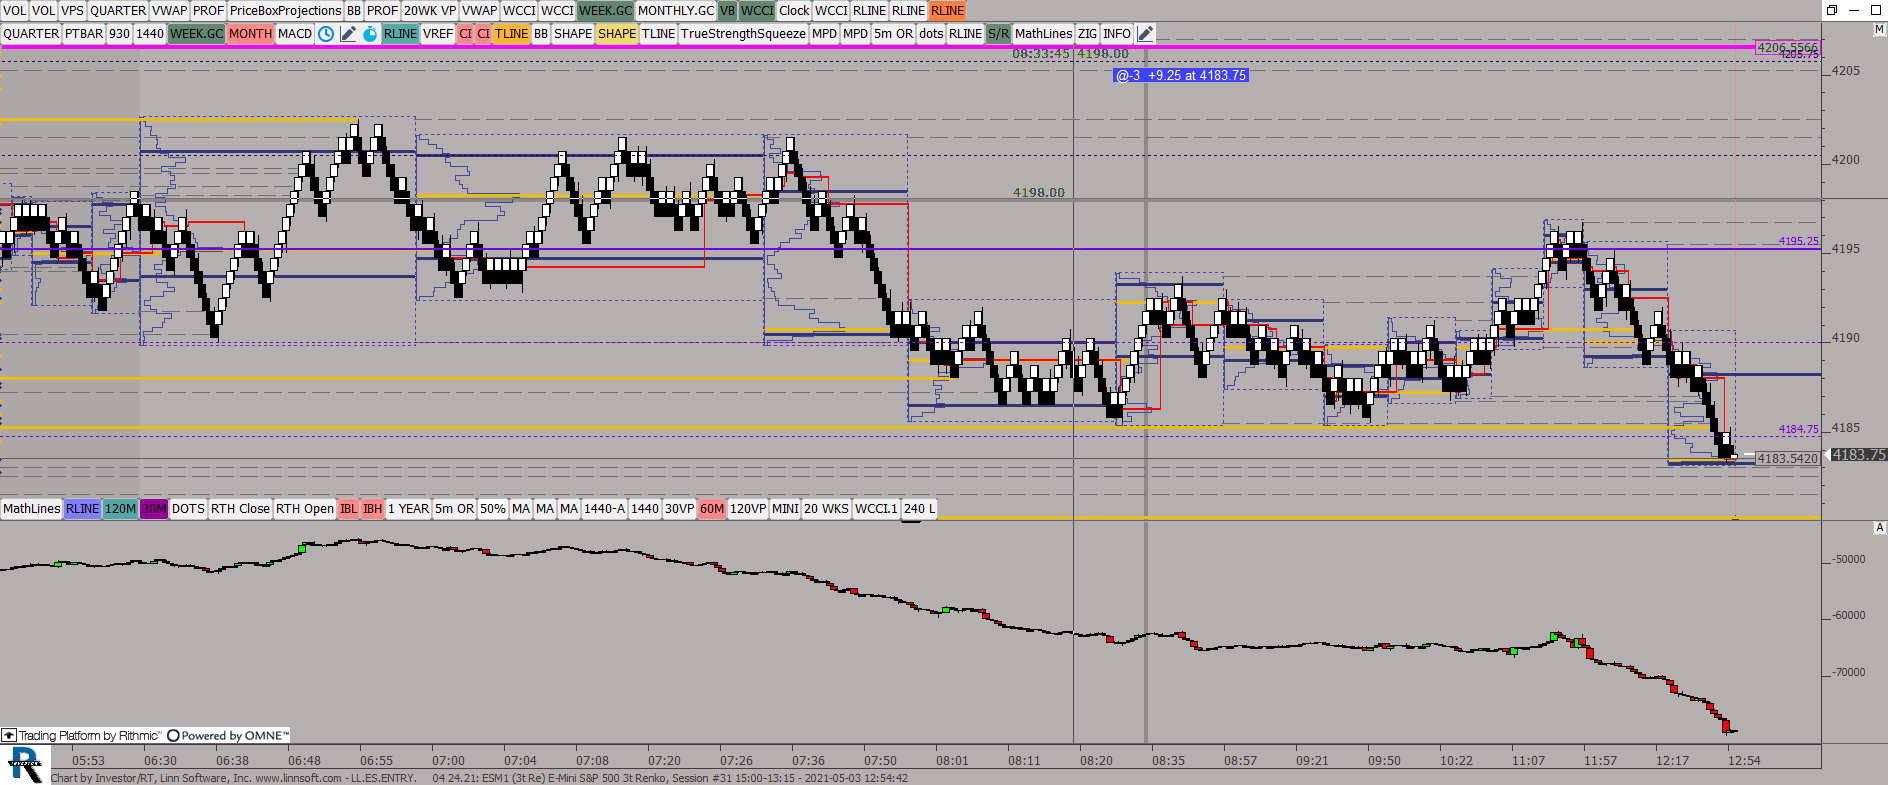 |
LLESENTRY 04 (ESM1) ES42 [totalcount]
5 years 2 months ago
This chart was uploaded by Investor/RT 14.2.6 showing symbol: ESM1. |
View |