 |
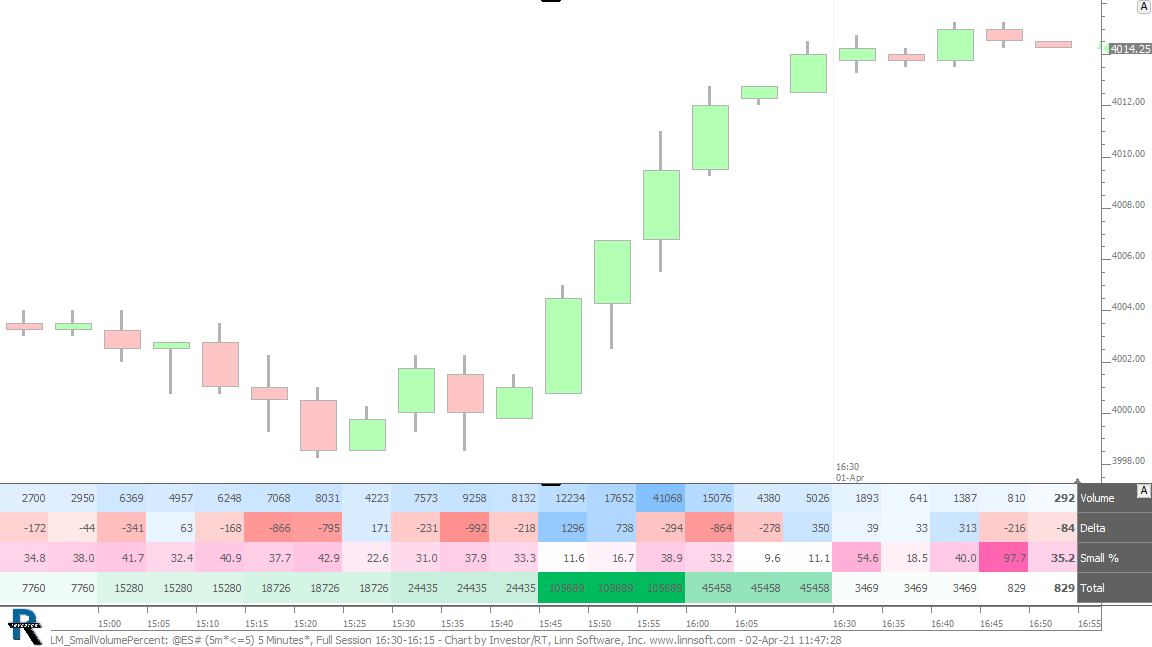
LM SmallVolumePercent (@ES#) cpayne [totalcount]
5 years 3 months ago
This chart was uploaded by Investor/RT 14.2.6 showing symbol: @ES#. |
View |
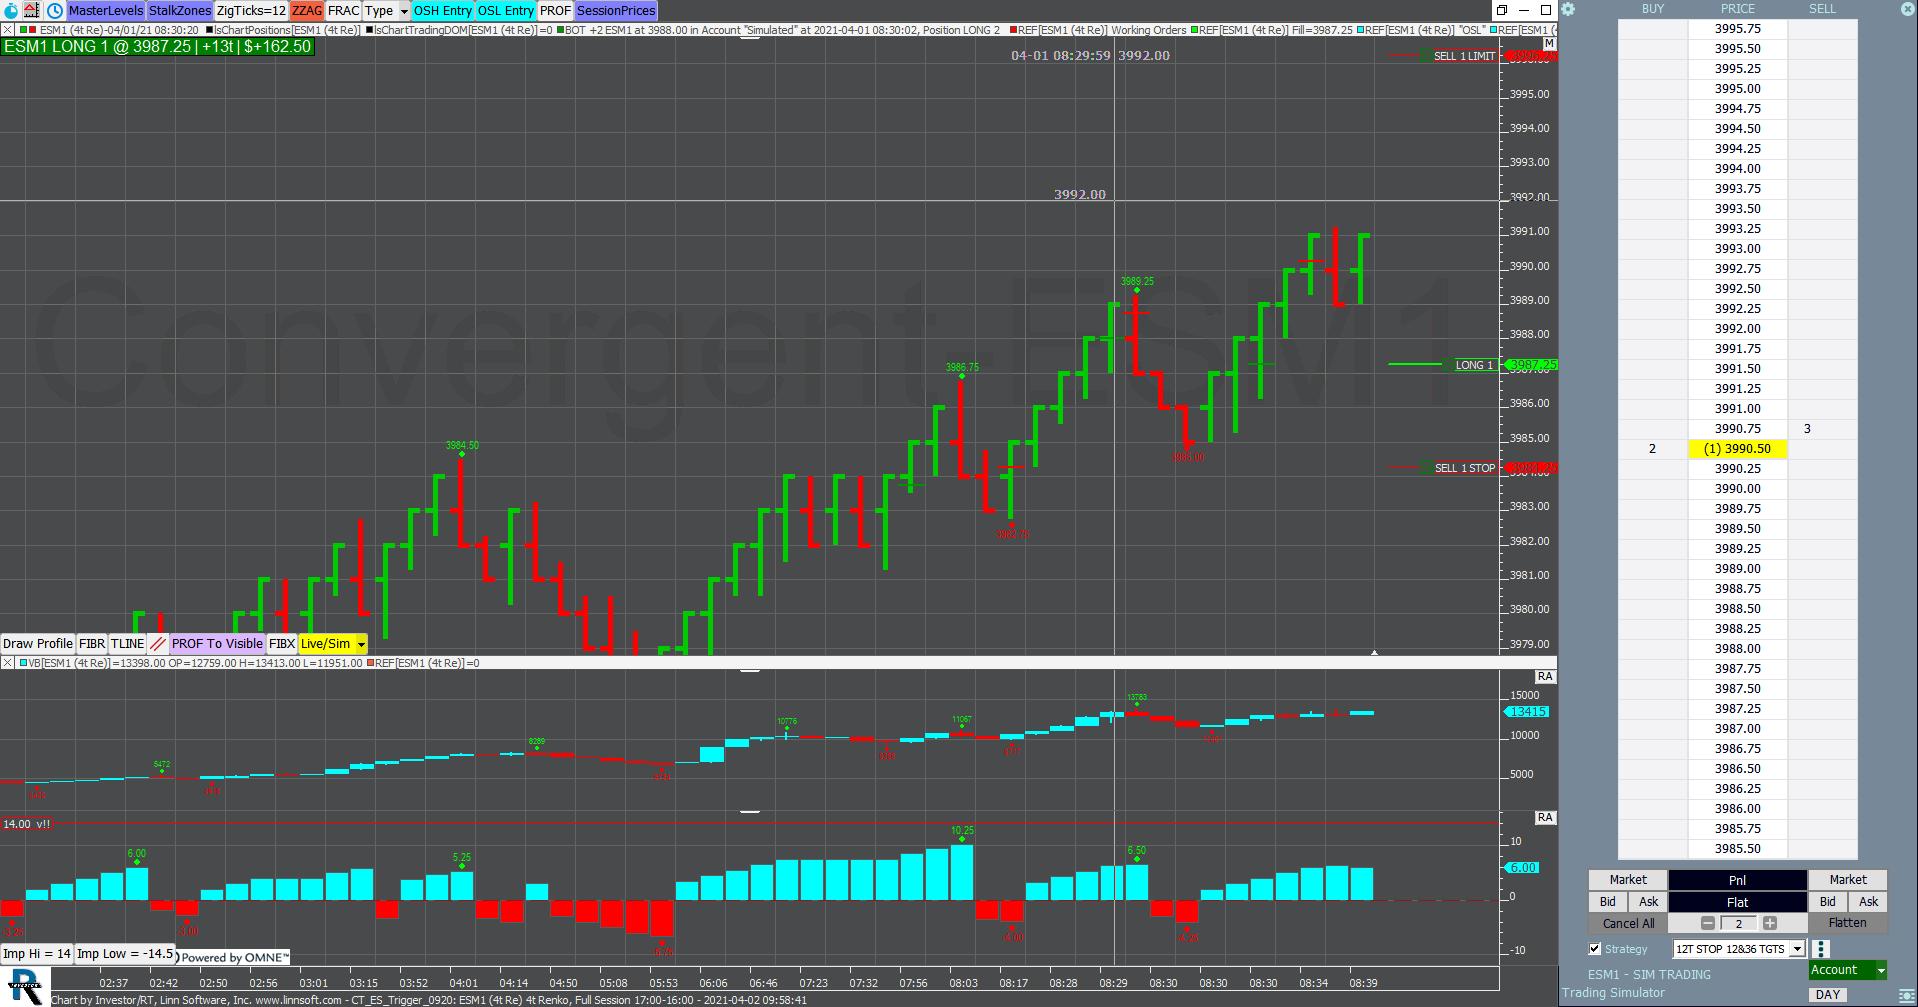 |
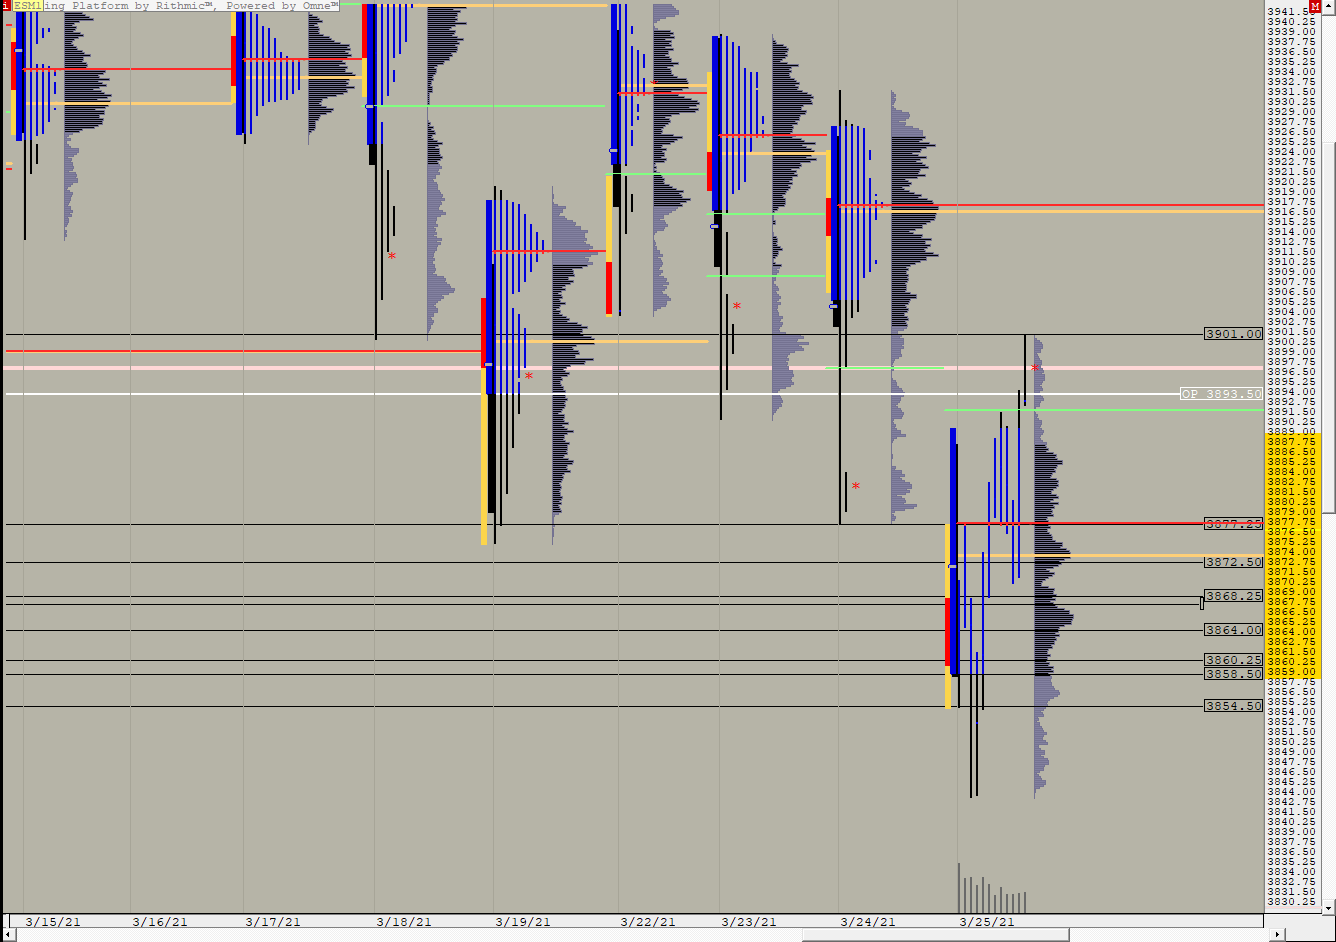
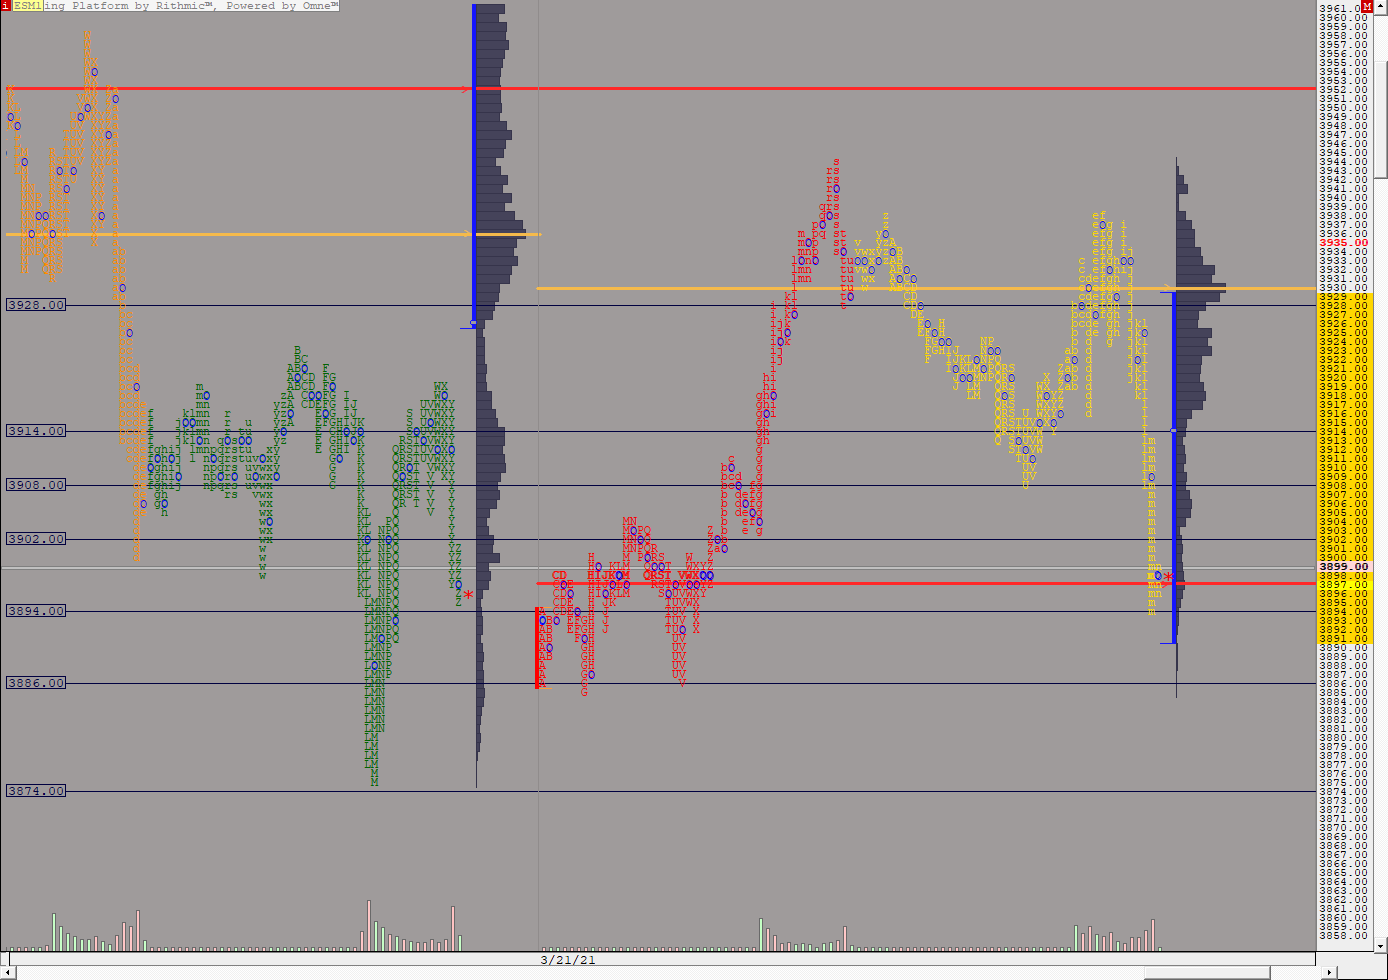
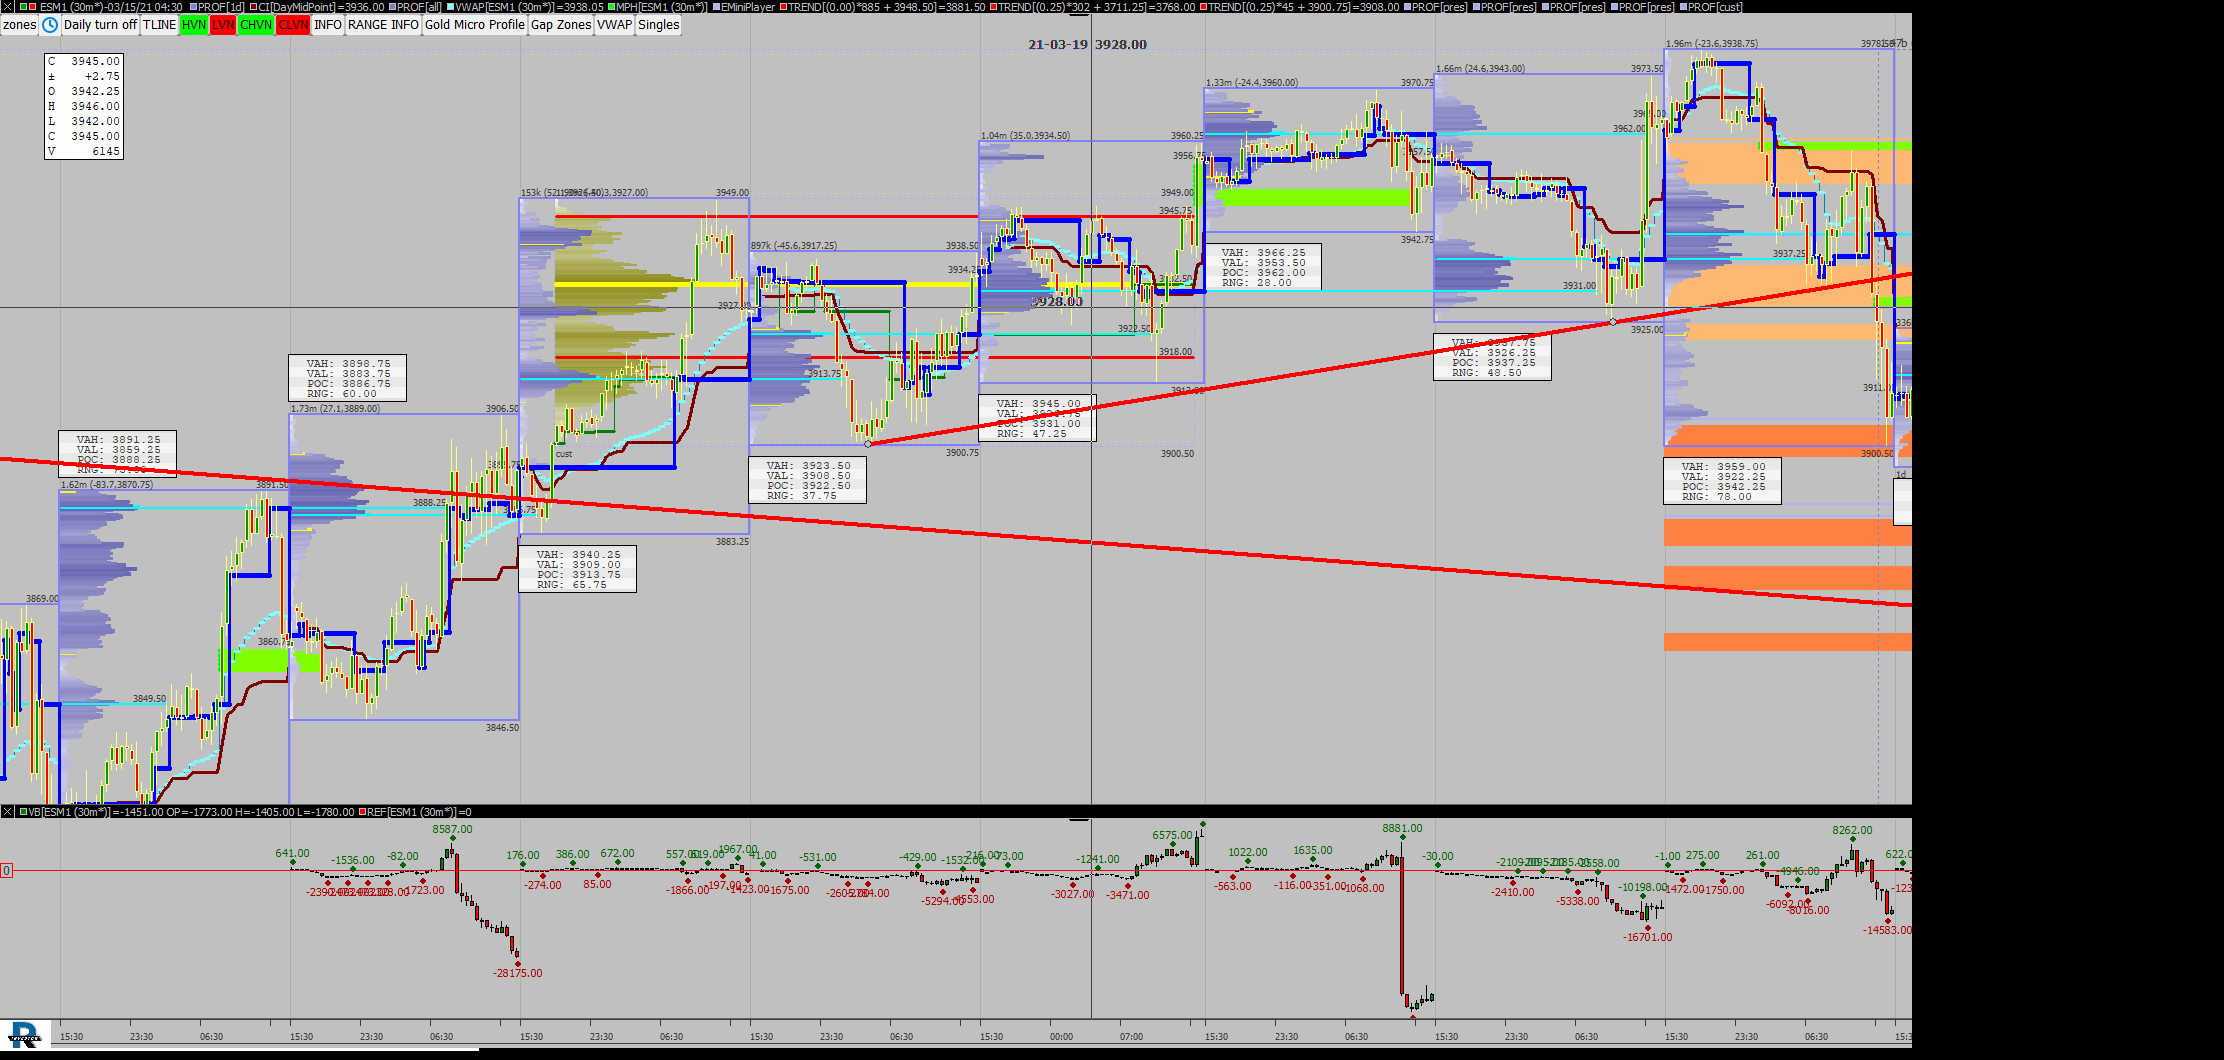
CT ES Trigger 0920 (ESM1) Robert Smith [totalcount]
5 years 3 months ago
no, or little, volume profile beyond 3/11. This chart was uploaded by Investor/RT 14.2.5 showing symbol: ESM1. |
View |
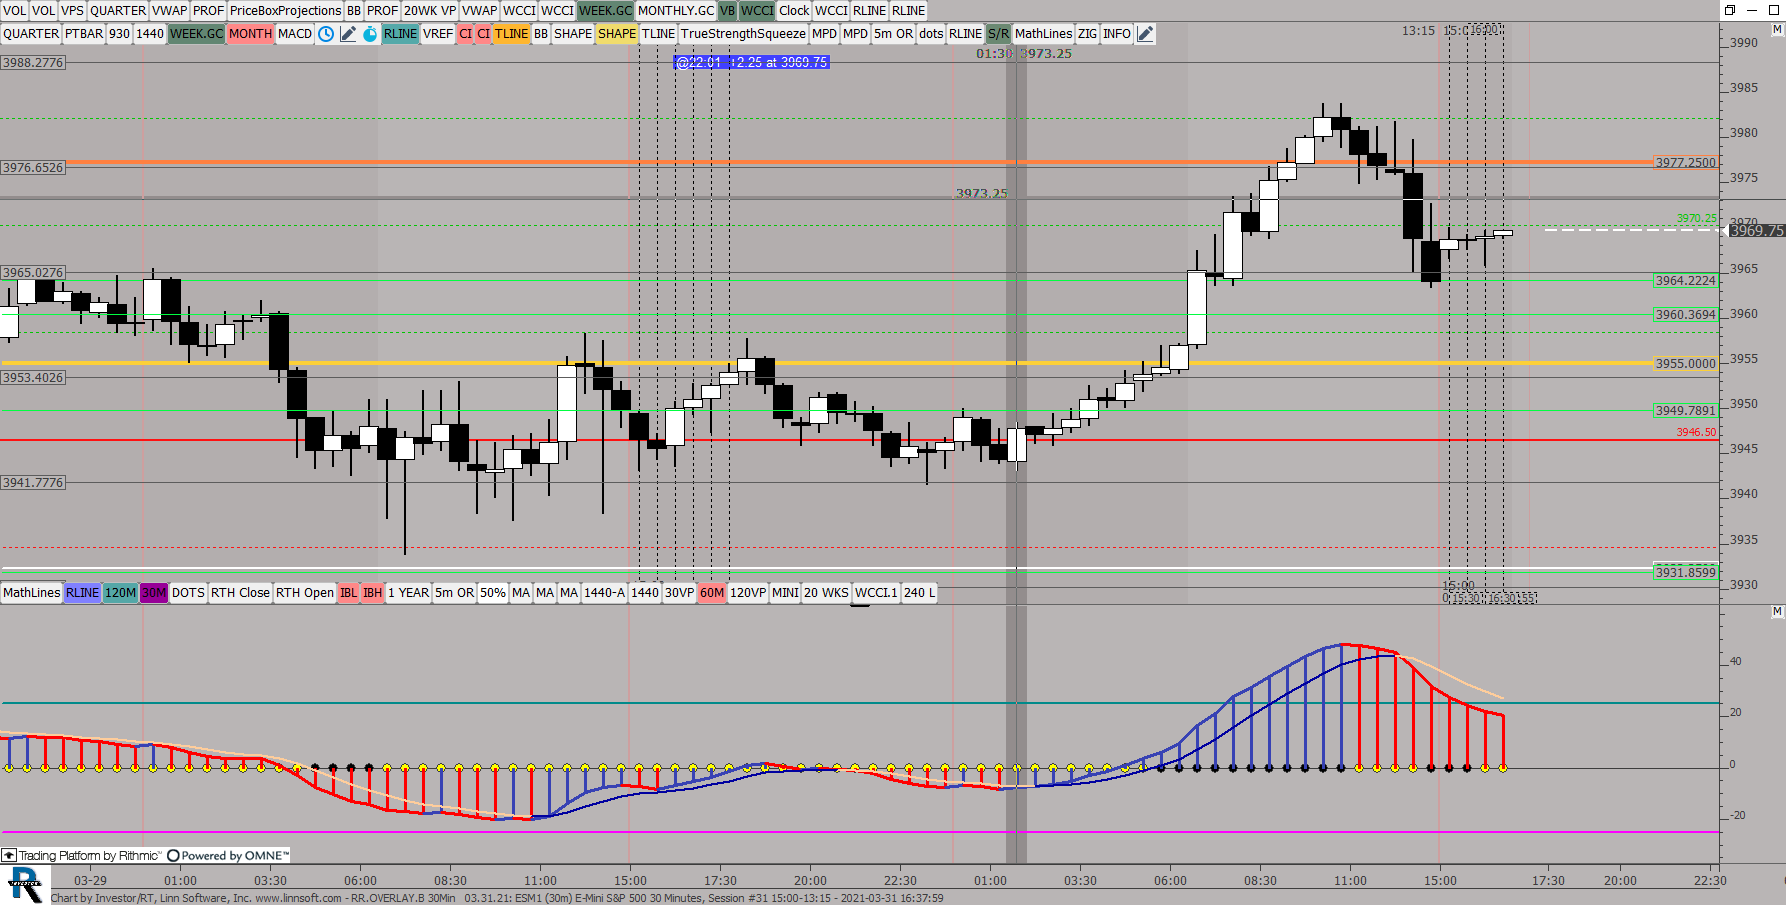 |
RROVERLAYB 30Min (ESM1) ES42 [totalcount]
5 years 4 months ago
This chart was uploaded by Investor/RT 14.2.5 showing symbol: ESM1. |
View |
 |
RROVERLAY240 (ESM1) ES42 [totalcount]
5 years 4 months ago
This chart was uploaded by Investor/RT 14.2.5 showing symbol: ESM1. |
View |
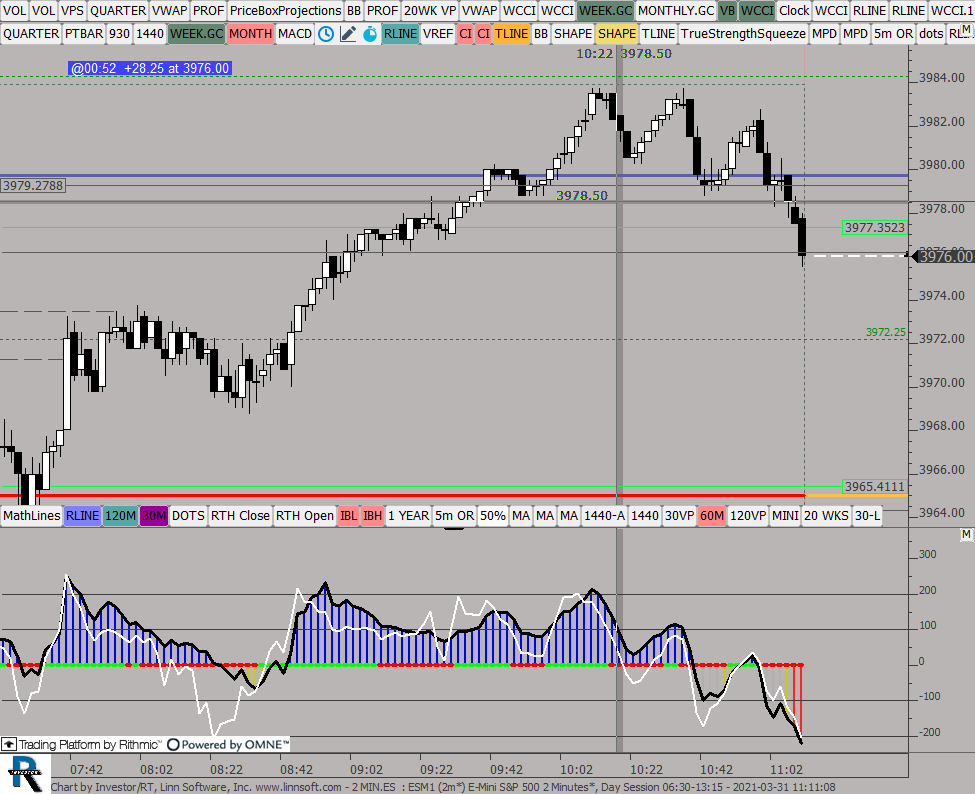 |
2 MINES (ESM1) ES42 [totalcount]
5 years 4 months ago
This chart was uploaded by Investor/RT 14.2.5 showing symbol: ESM1. |
View |
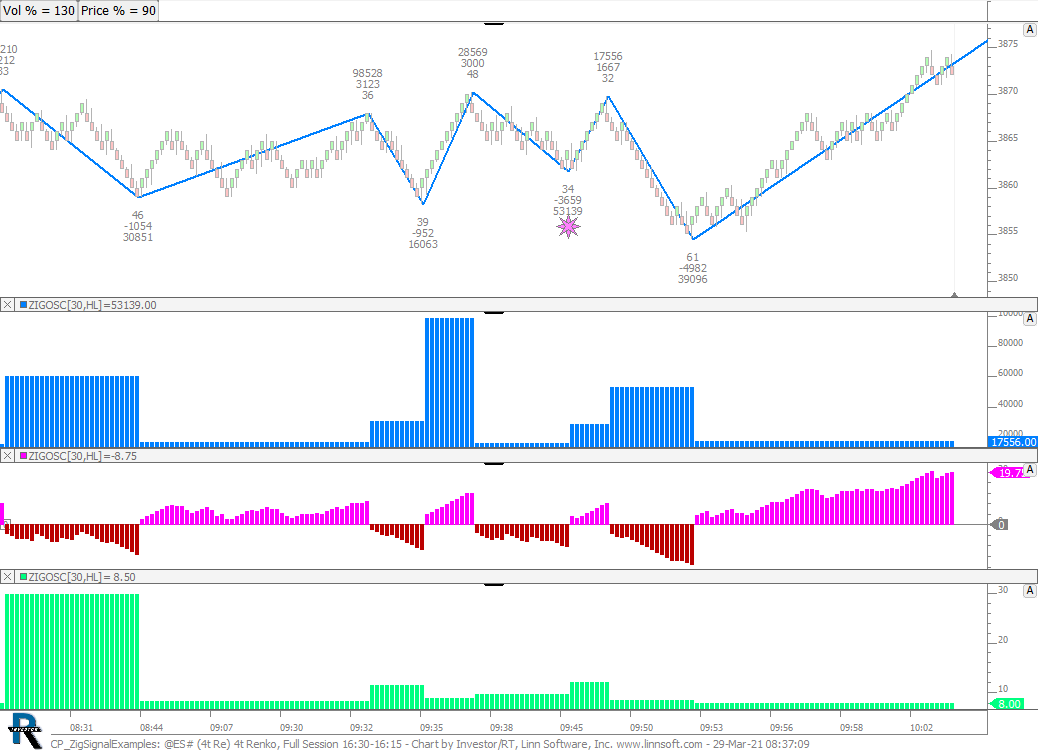 |
CP ZigSignalExamples (@ES#) cpayne [totalcount]
5 years 4 months ago
This chart was uploaded by Investor/RT 14.2.6 showing symbol: @ES#. |
View |
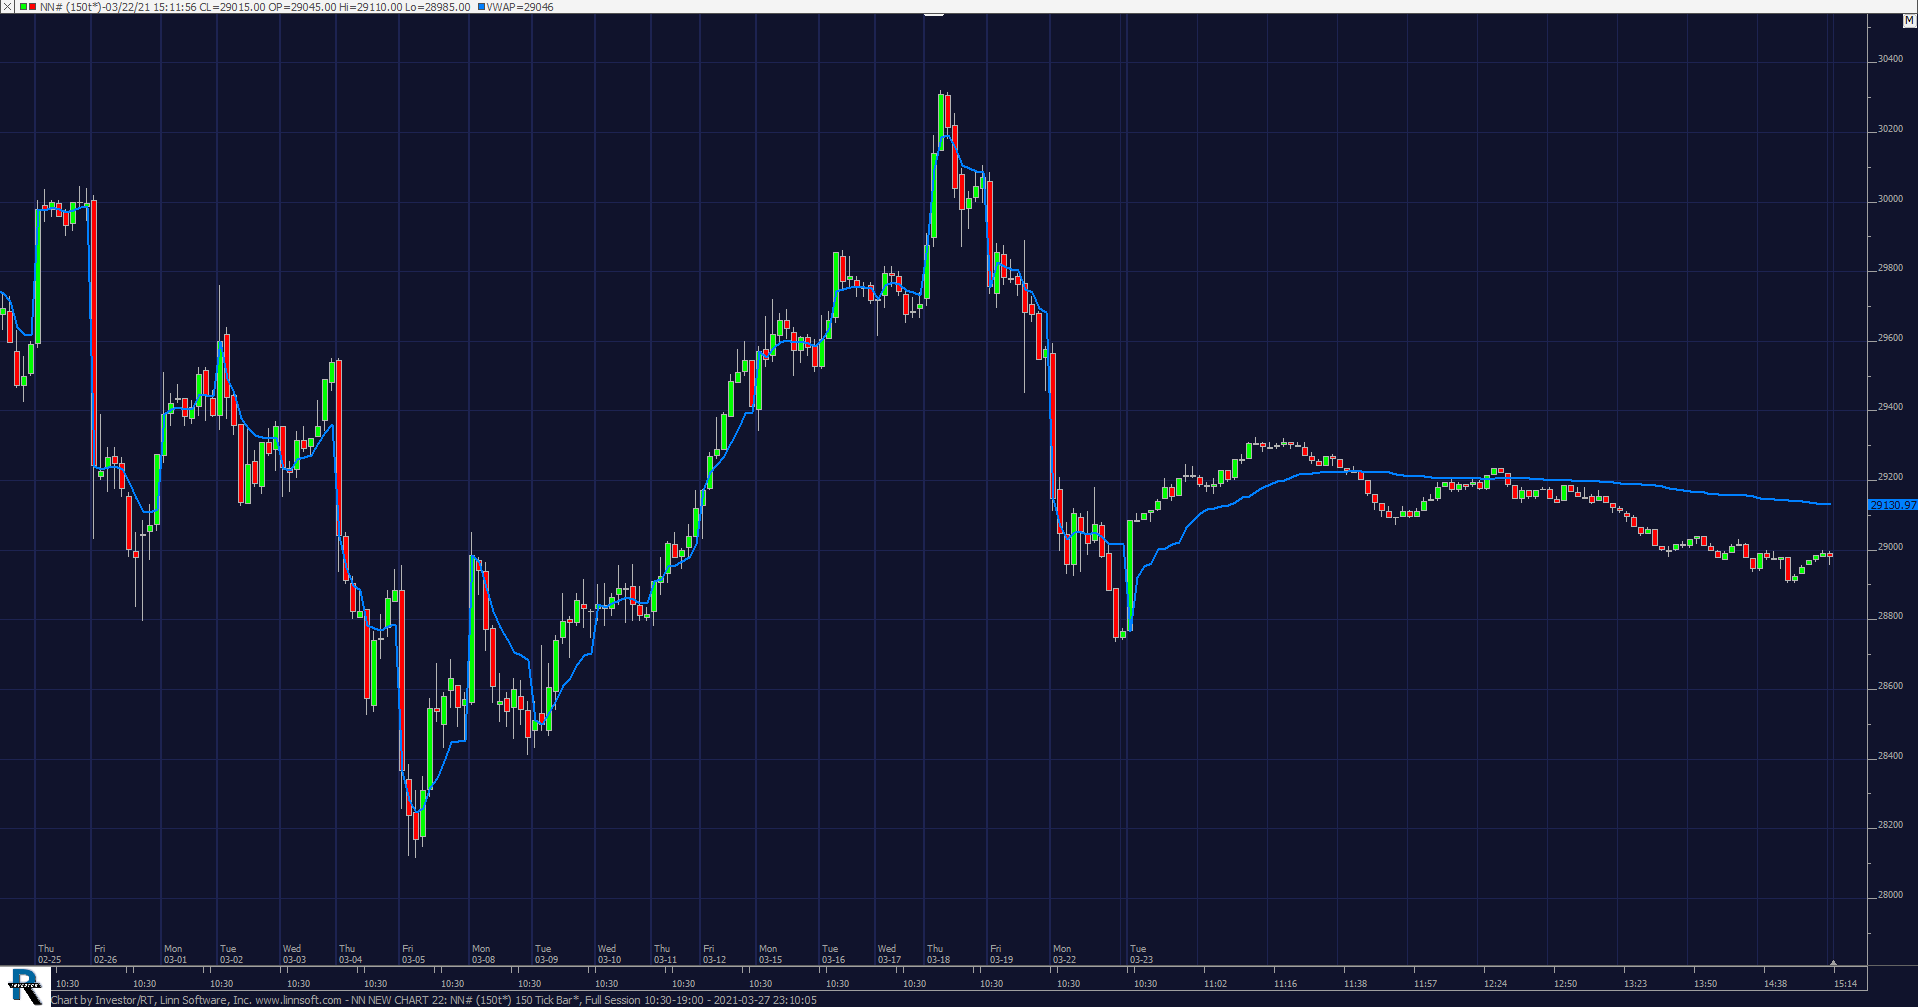 |
NN NEW CHART 22 (NN#) malcom imad [totalcount]
5 years 4 months ago
This chart was uploaded by Investor/RT 14.2.5 showing symbol: NN#. |
View |
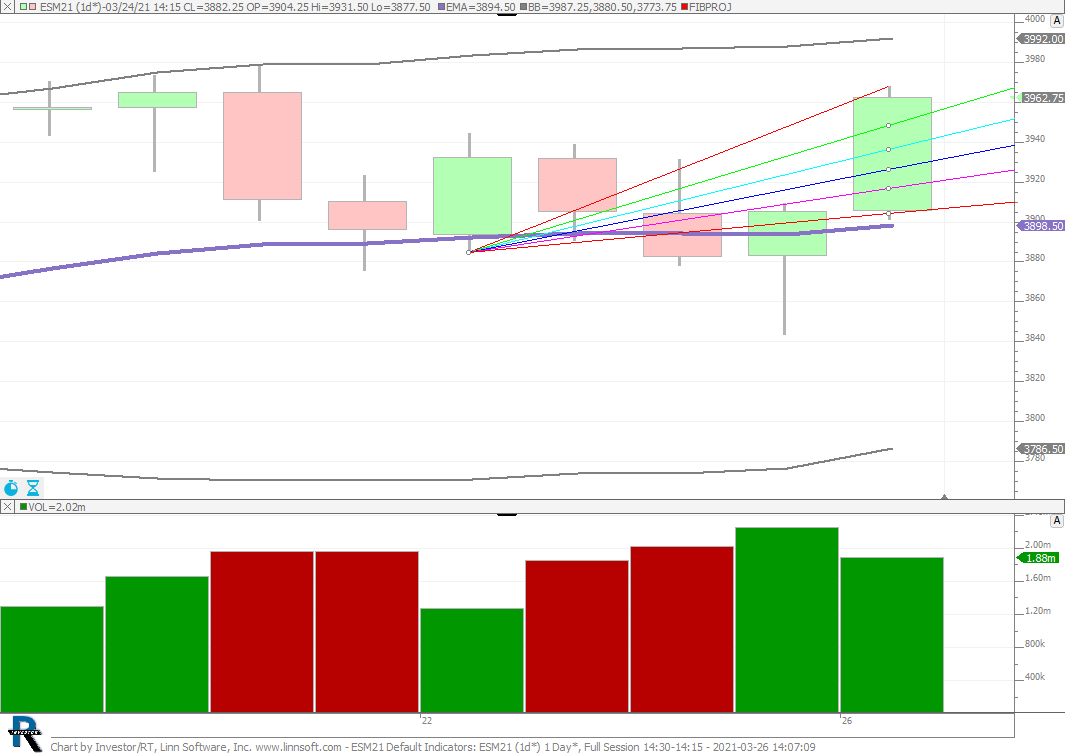 |
ESM21 Default Indicators (ESM21) garydwavra [totalcount]
5 years 4 months ago
This chart was uploaded by Investor/RT 14.2.5 showing symbol: ESM21. |
View |
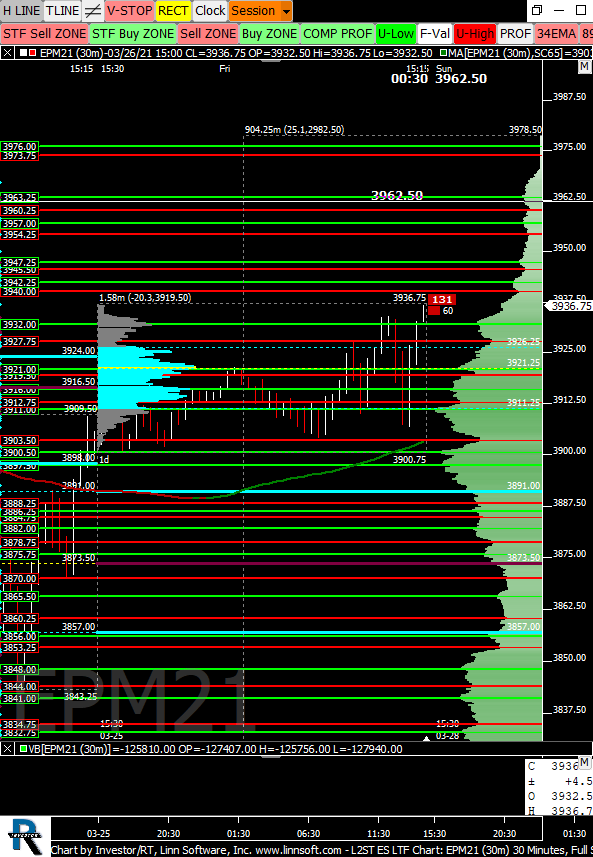 |
L2ST ES LTF Chart (EPM21) ds1111 [totalcount]
5 years 4 months ago
30 min candlestick chart. This chart was uploaded by Investor/RT 13.7.10 showing symbol: EPM21. |
View |
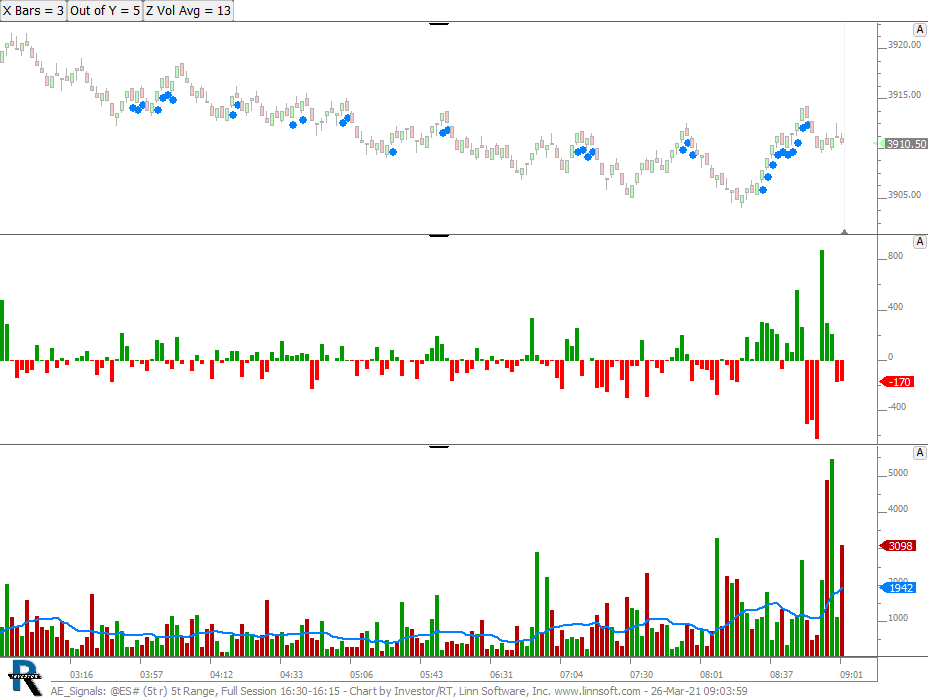 |
AE Signals (@ES#) cpayne [totalcount]
5 years 4 months ago
This chart was uploaded by Investor/RT 14.2.6 showing symbol: @ES#. |
View |
 |
ESTPORTH (ESM1) ES42 [totalcount]
5 years 4 months ago
This chart was uploaded by Investor/RT 14.2.5 showing symbol: ESM1. |
View |
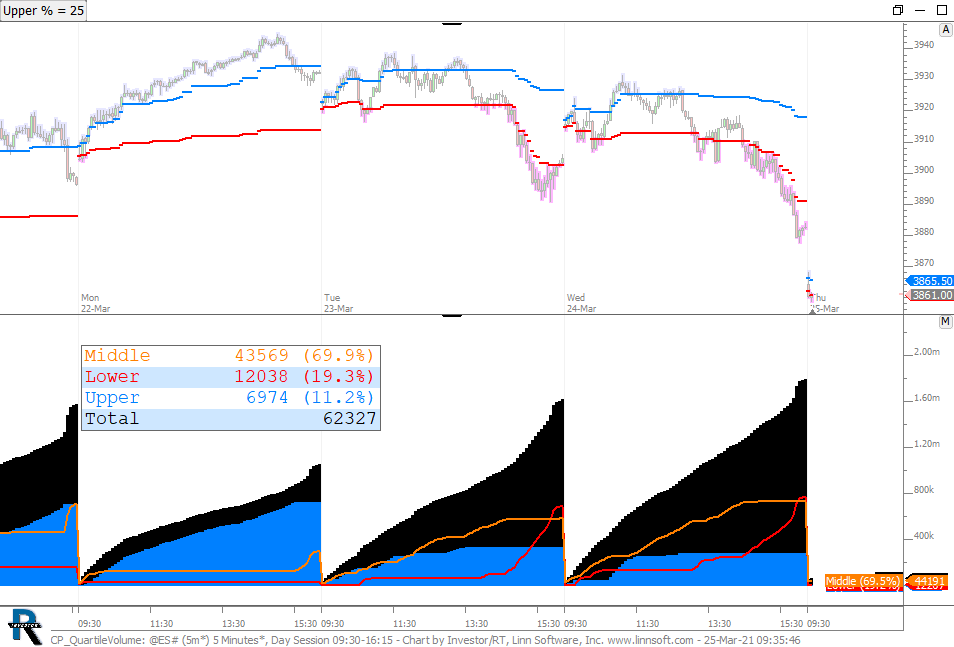 |
CP QuartileVolume (@ES#) cpayne [totalcount]
5 years 4 months ago
Volume of Upper Quartile Prices. This chart was uploaded by Investor/RT 14.2.6 showing symbol: @ES#. |
View |
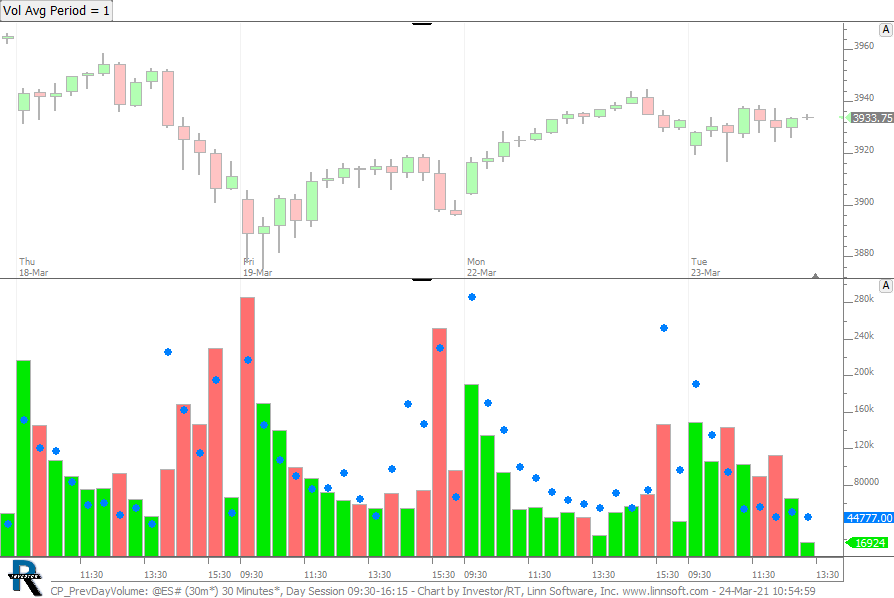 |
CP PrevDayVolume (@ES#) cpayne [totalcount]
5 years 4 months ago
Shows previous days volume on current session. Use button to change bars to the average of previous days at that time. |
View |
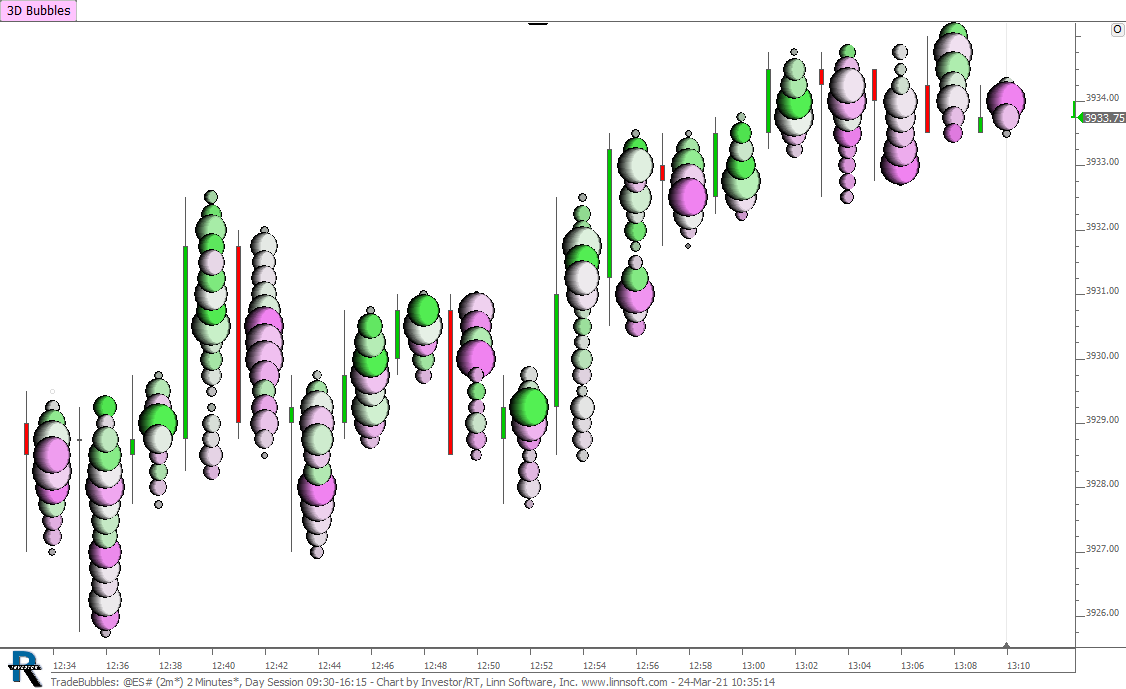 |
TradeBubbles (@ES#) cpayne [totalcount]
5 years 4 months ago
TradeBubbles. This chart was uploaded by Investor/RT 14.2.6 showing symbol: @ES#. |
View |
 |
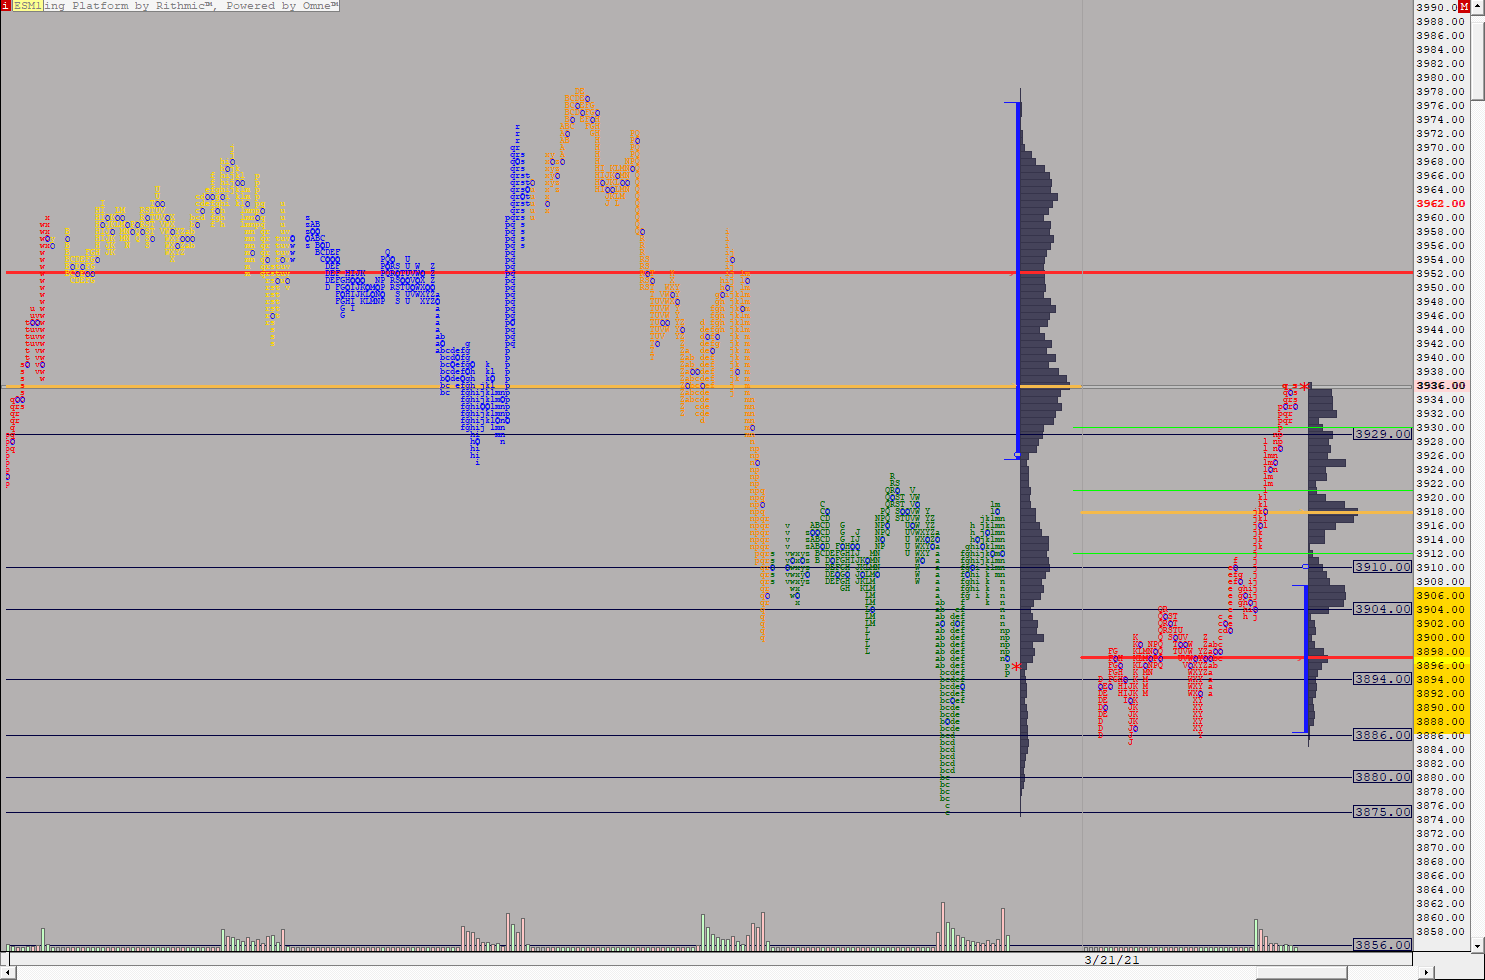
ESWEEKLYTPOGLOBEX (ESM1) ES42 [totalcount]
5 years 4 months ago
This chart was uploaded by Investor/RT 14.2.5 showing symbol: ESM1. |
View |
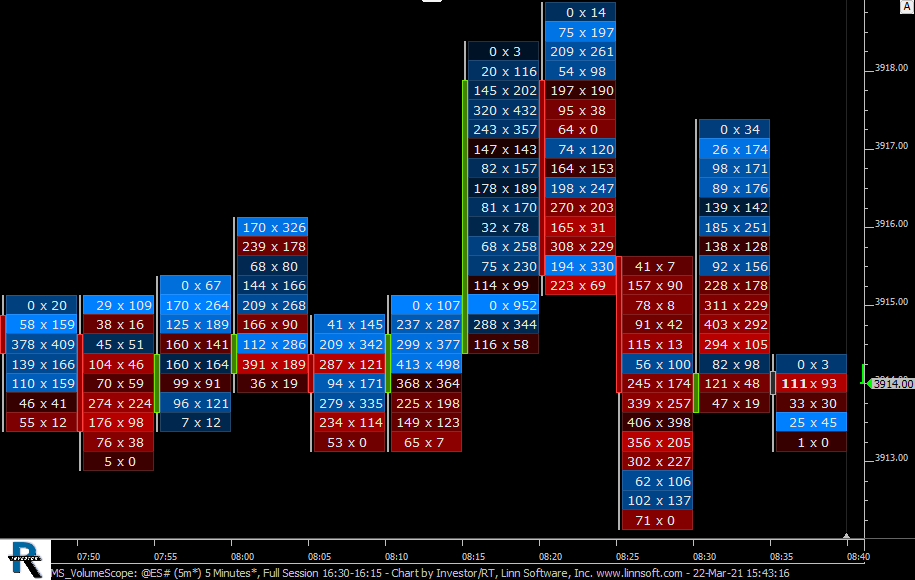 |
MS VolumeScope (@ES#) cpayne [totalcount]
5 years 4 months ago
This chart was uploaded by Investor/RT 14.2.6 showing symbol: @ES#. |
View |
 |
WEEKLYTPORTH (ESM1) ES42 [totalcount]
5 years 4 months ago
This chart was uploaded by Investor/RT 14.2.5 showing symbol: ESM1. |
View |
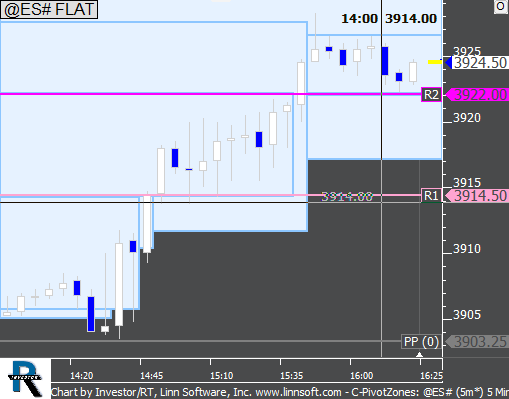 |
C PivotZones (@ES#) Herbert Ritsch [totalcount]
5 years 4 months ago
This chart was uploaded by Investor/RT 14.2.5 showing symbol: @ES#. |
View |
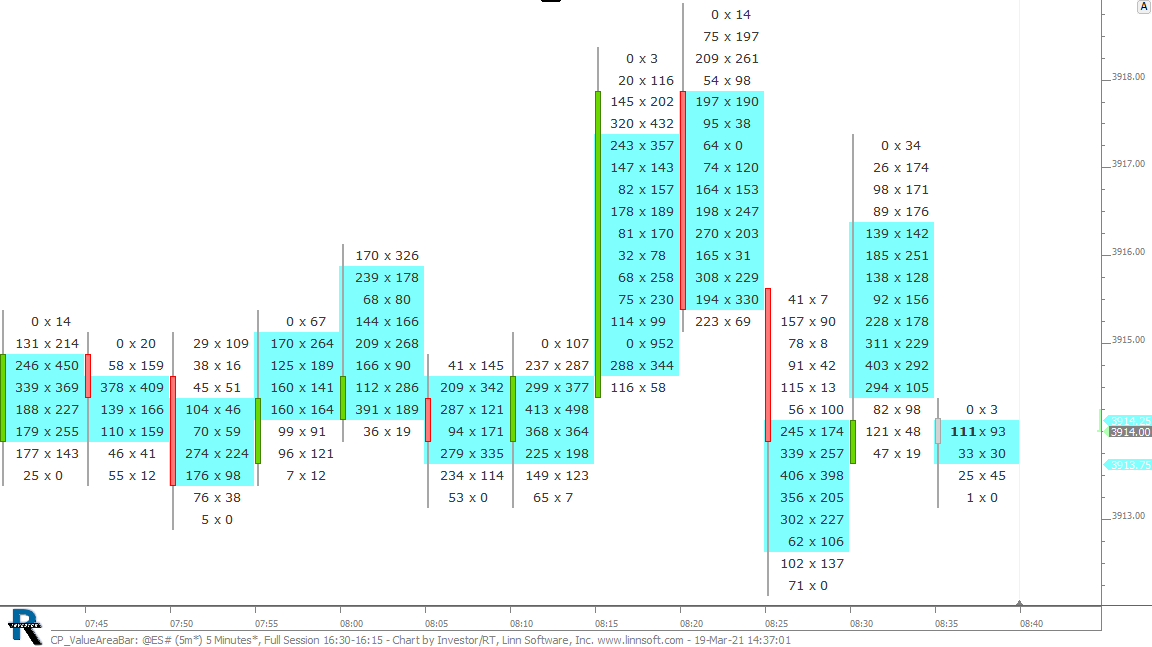 |
CP ValueAreaBar (@ES#) cpayne [totalcount]
5 years 4 months ago
Value Area of Bar highlighted with Bands Indicator. This chart was uploaded by Investor/RT 14.2.6 showing symbol: @ES#. |
View |
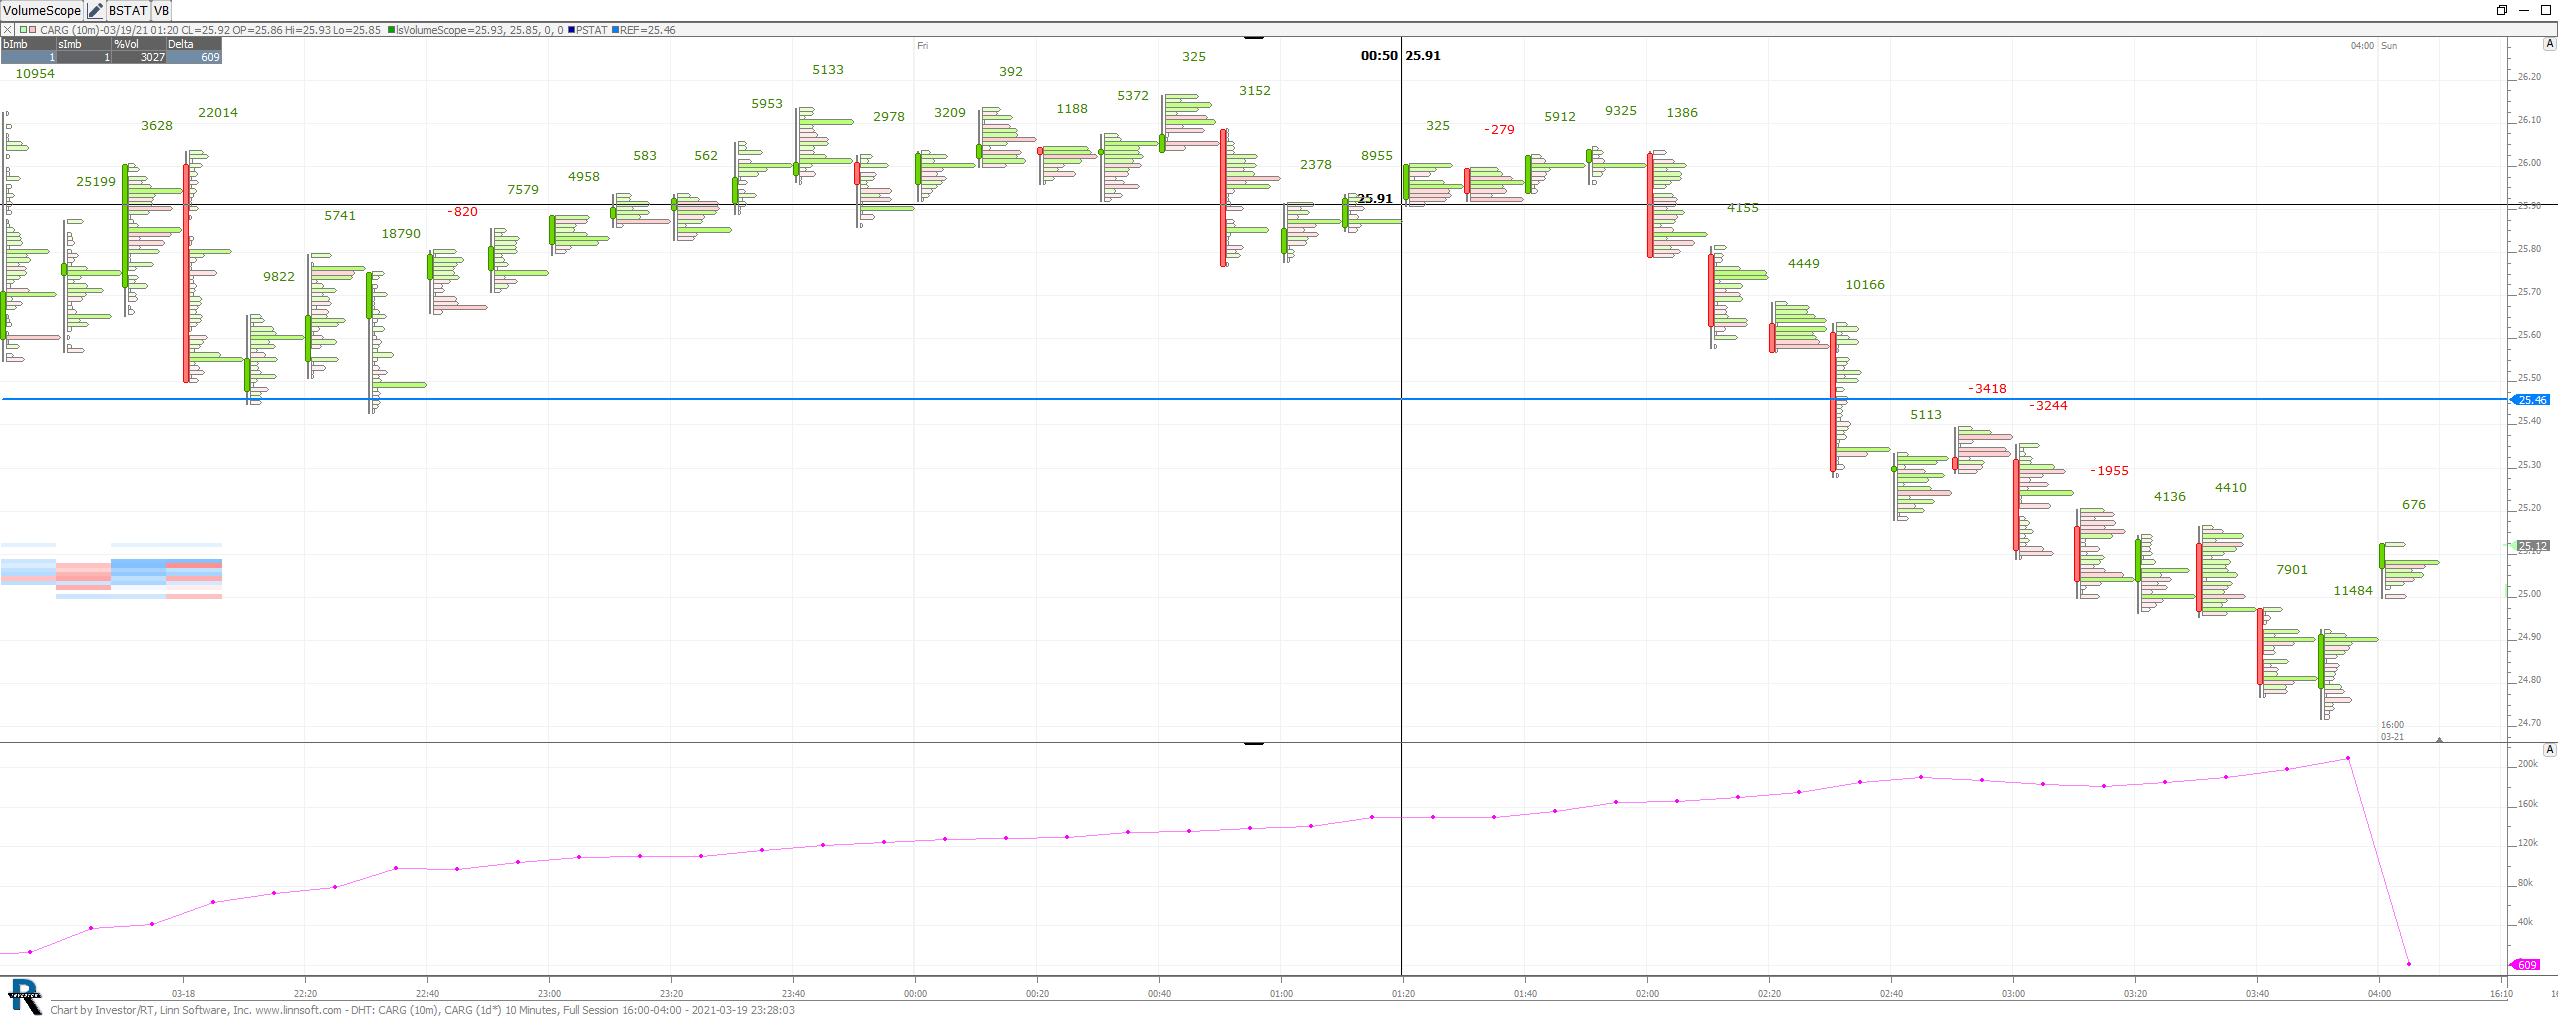 |
DHT (CARG) Anson Lim [totalcount]
5 years 4 months ago
weird session issue. This chart was uploaded by Investor/RT 14.2.5 showing symbol: CARG. |
View |
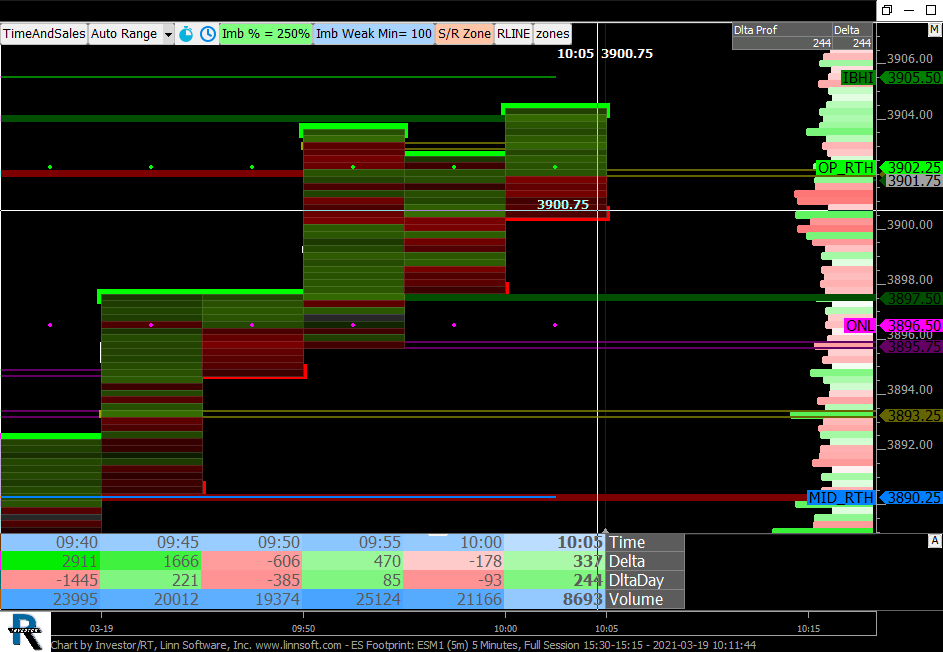 |
ES Footprint (ESM1) scottz46 [totalcount]
5 years 4 months ago
This chart was uploaded by Investor/RT 14.2.5 showing symbol: ESM1. |
View |
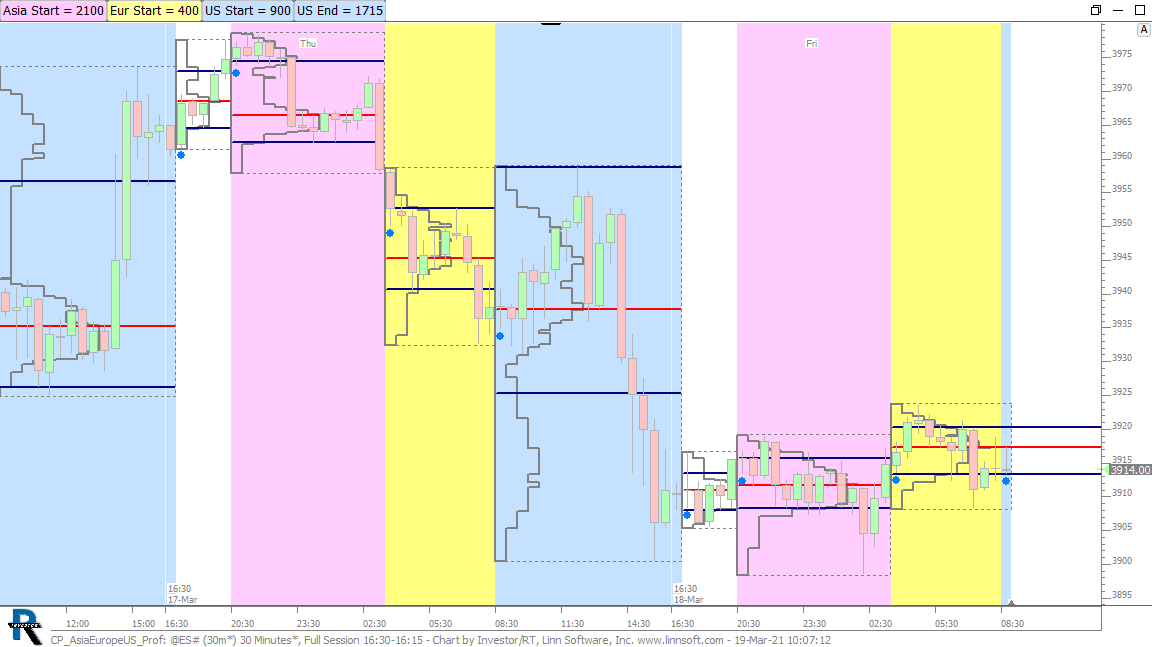 |
CP AsiaEuropeUS Prof (@ES#) cpayne [totalcount]
5 years 4 months ago
Asia, Europe, and US Profiles. This chart was uploaded by Investor/RT 14.2.6 showing symbol: @ES#. |
View |
 |
ES Micro Composite Main (ESM1) scottz46 [totalcount]
5 years 4 months ago
This chart was uploaded by Investor/RT 14.2.5 showing symbol: ESM1. |
View |
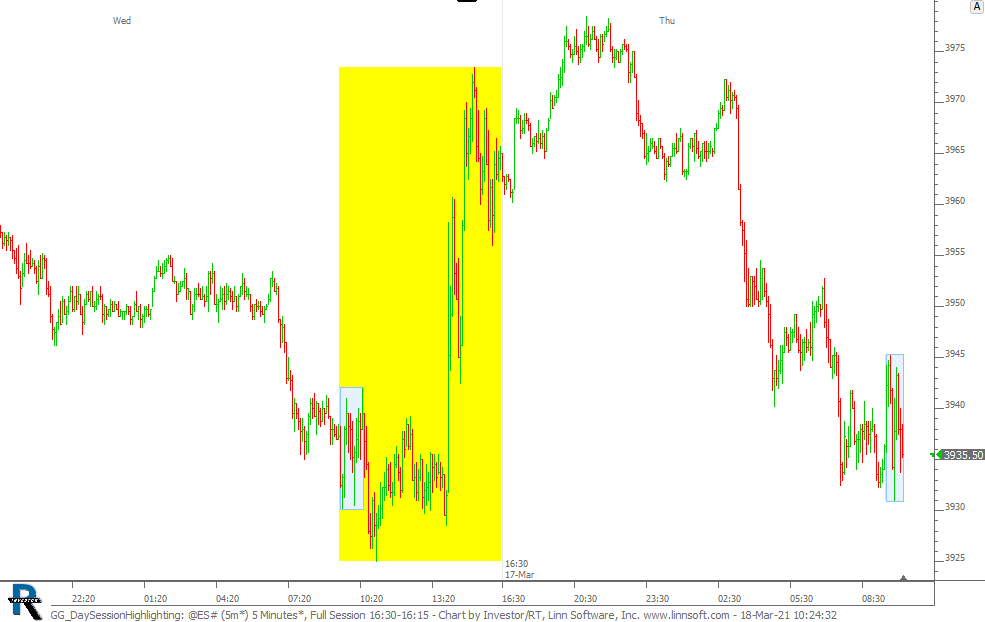 |
GG DaySessionHighlighting (@ES#) cpayne [totalcount]
5 years 4 months ago
This chart was uploaded by Investor/RT 14.2.6 showing symbol: @ES#. |
View |
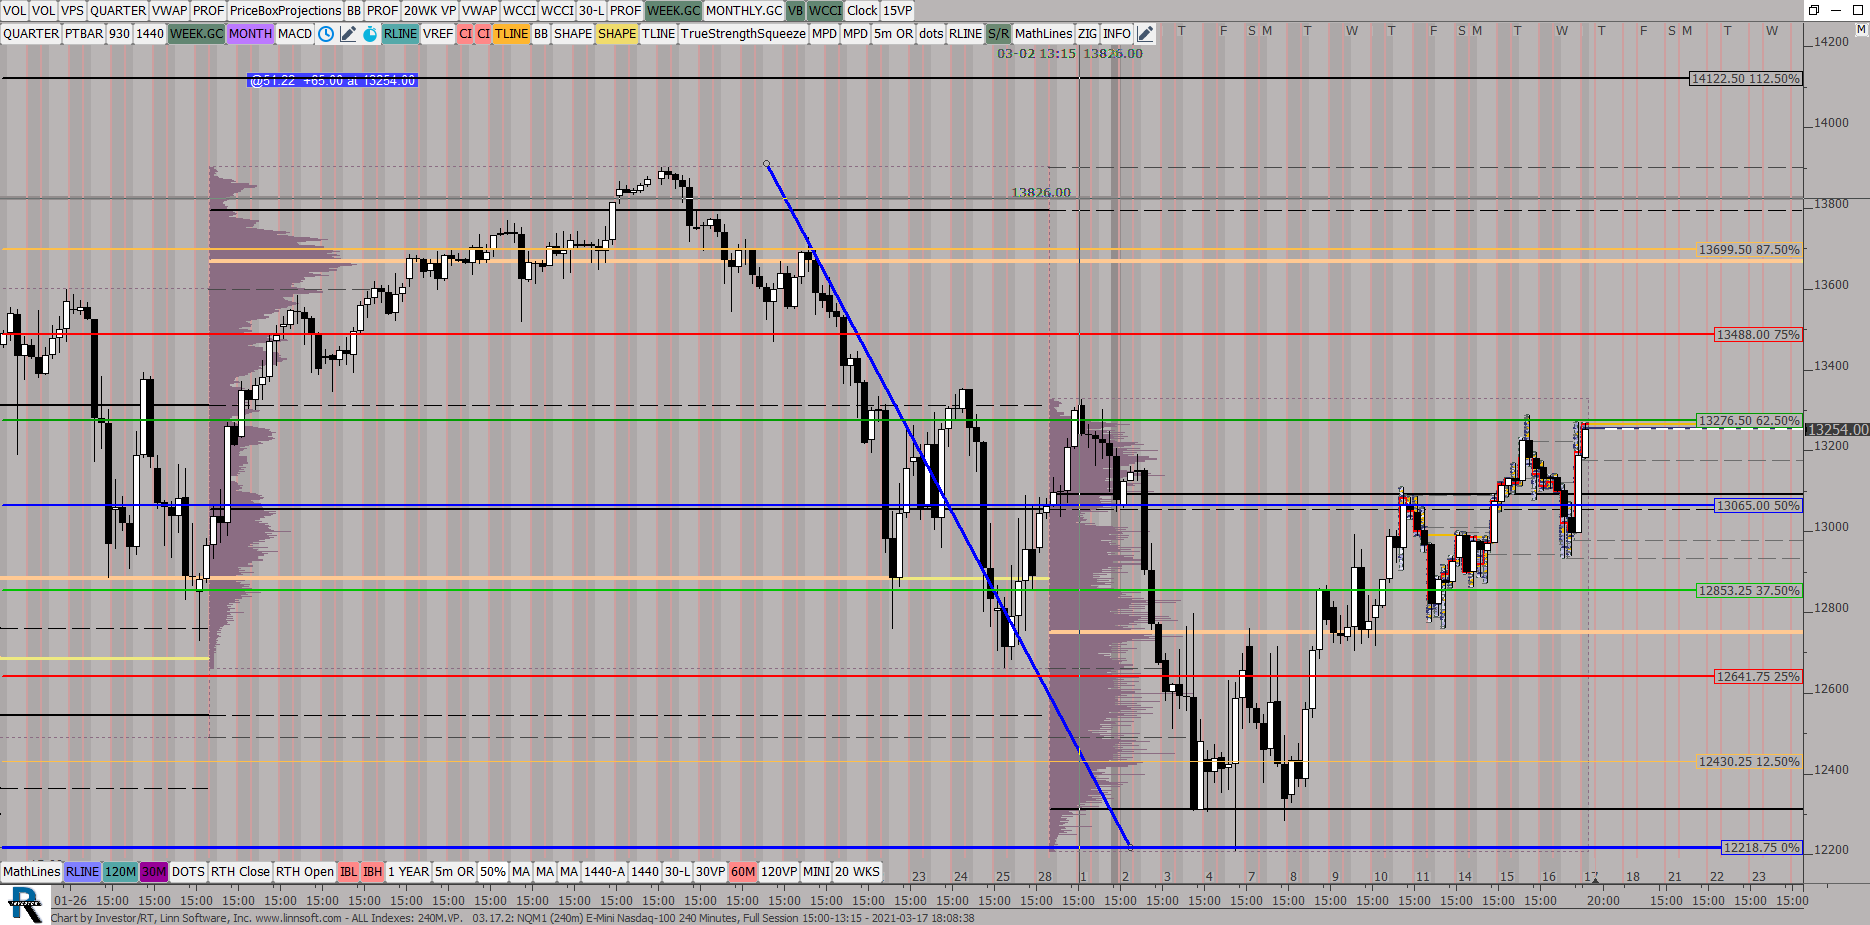 |
ALL Indexes 240MVP (NQM1) ES42 [totalcount]
5 years 4 months ago
240 MIN CANDLES. This chart was uploaded by Investor/RT 14.2.5 showing symbol: NQM1. |
View |