 |
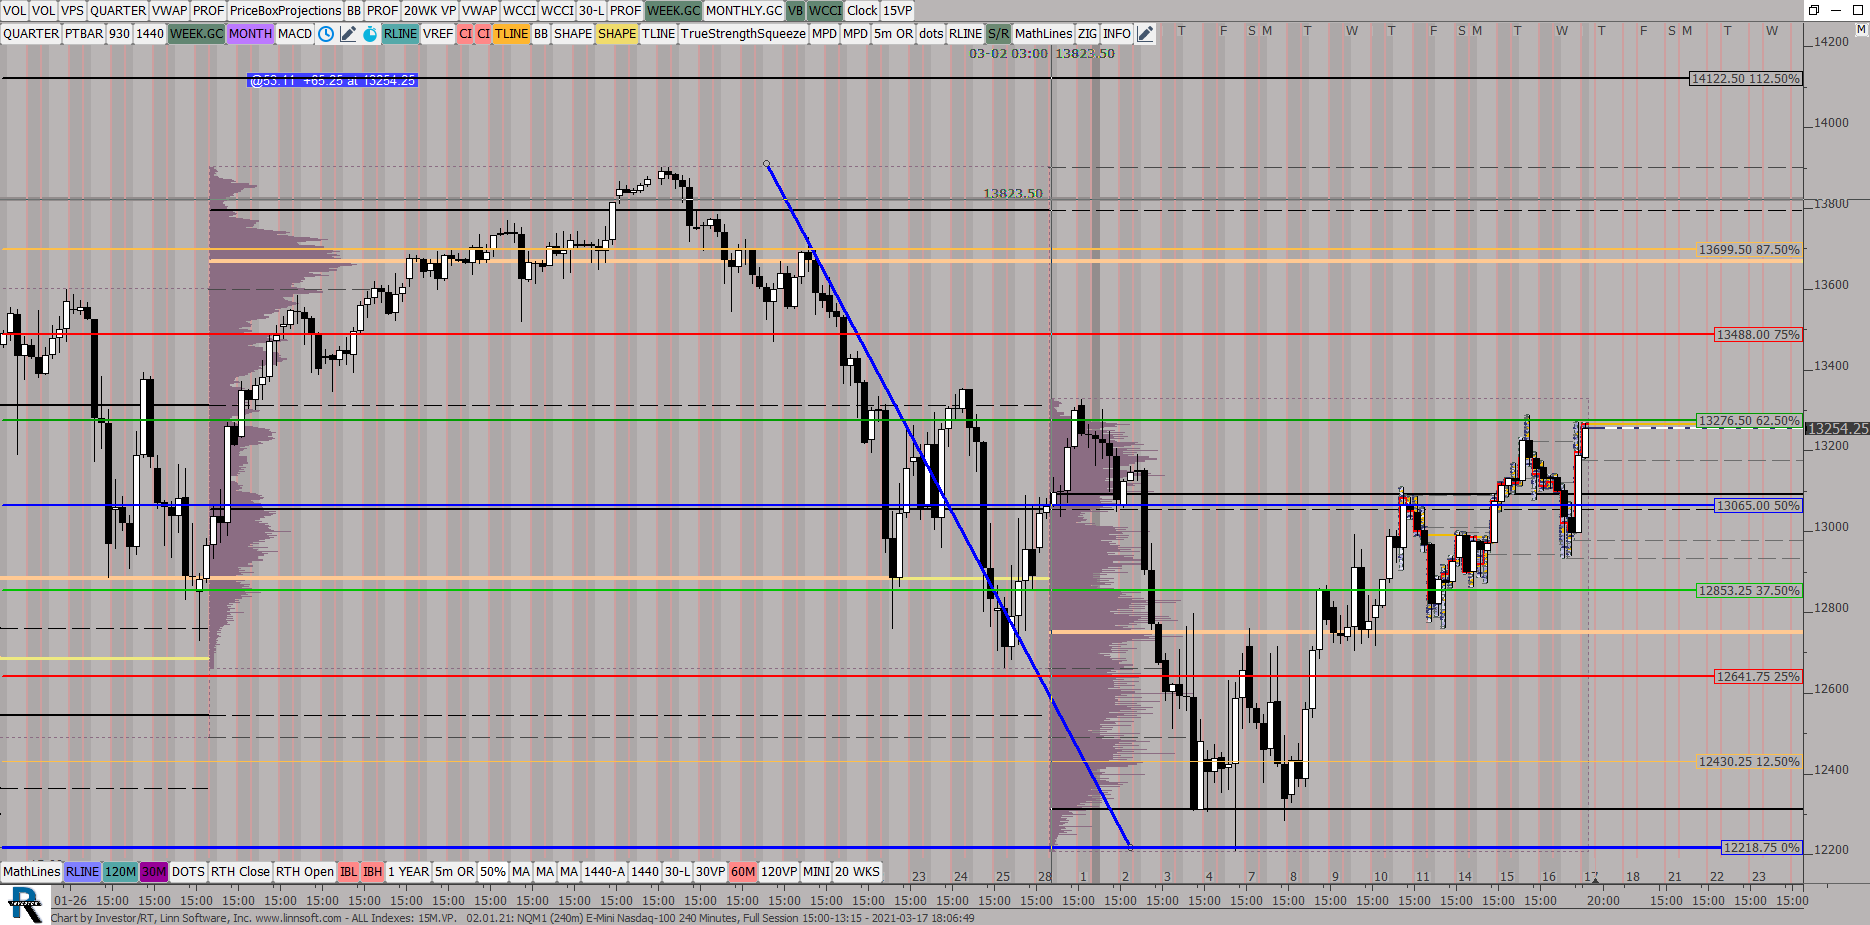
ALL Indexes 15MVP (NQM1) ES42 [totalcount]
5 years 4 months ago
240 MIN CANDLES. This chart was uploaded by Investor/RT 14.2.5 showing symbol: NQM1. |
View |
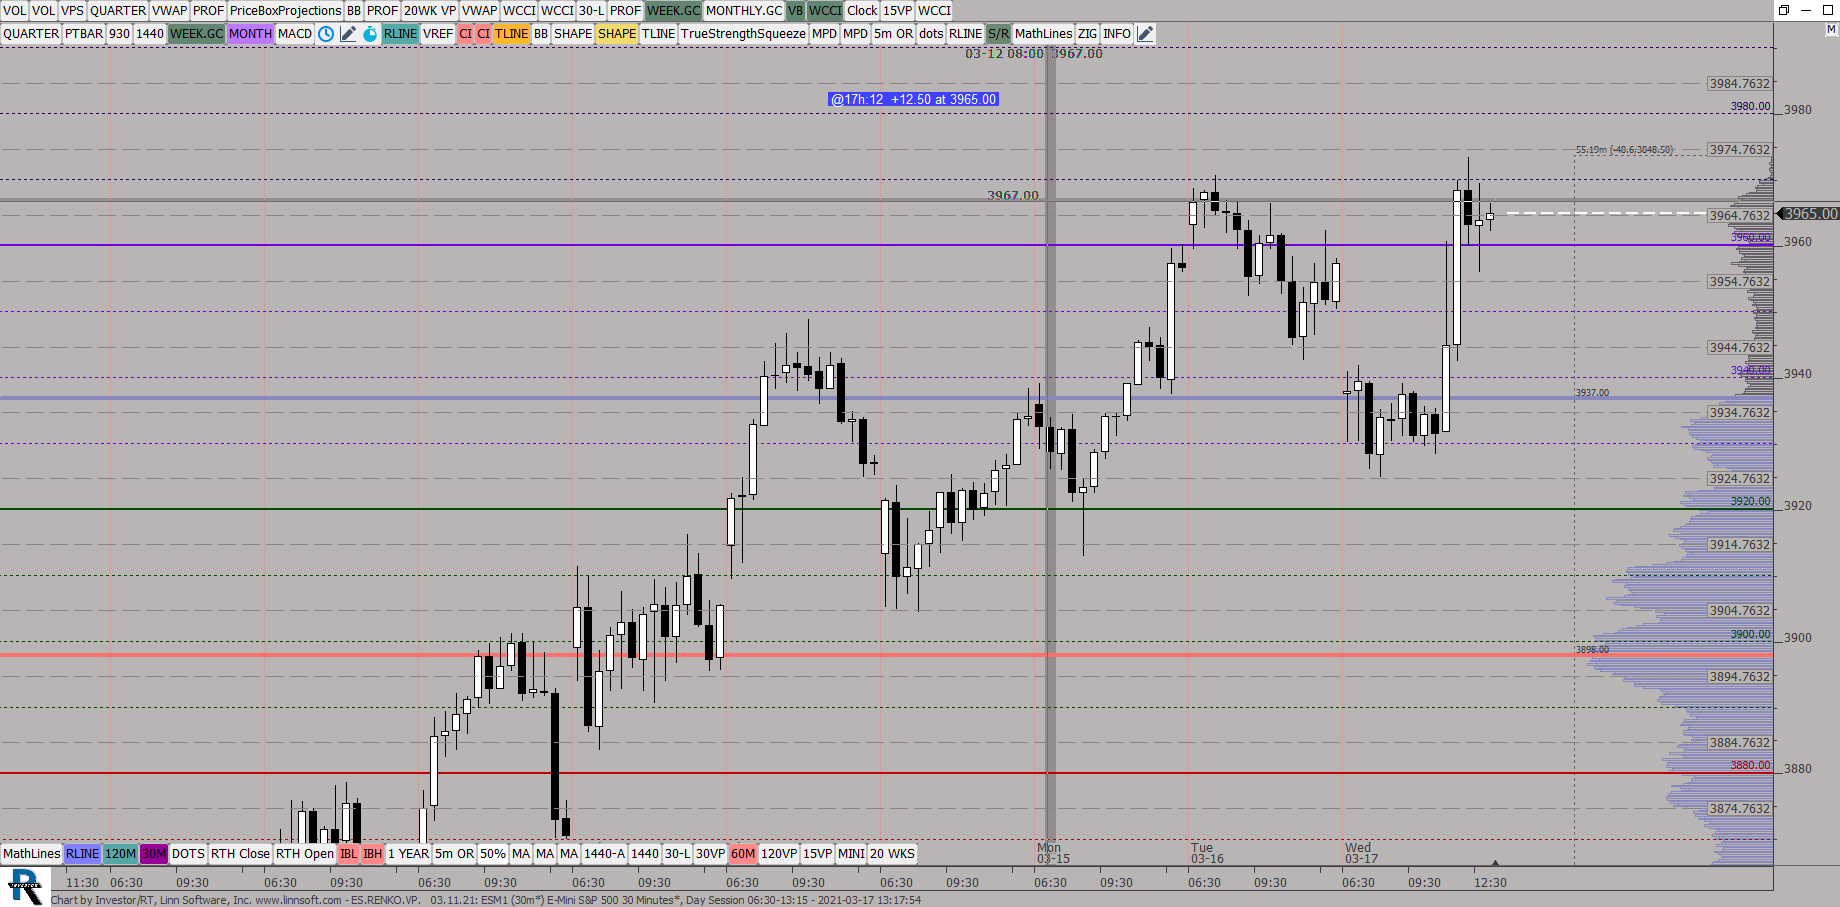 |
ESRENKOVP (ESM1) ES42 [totalcount]
5 years 4 months ago
This chart was uploaded by Investor/RT 14.2.5 showing symbol: ESM1. |
View |
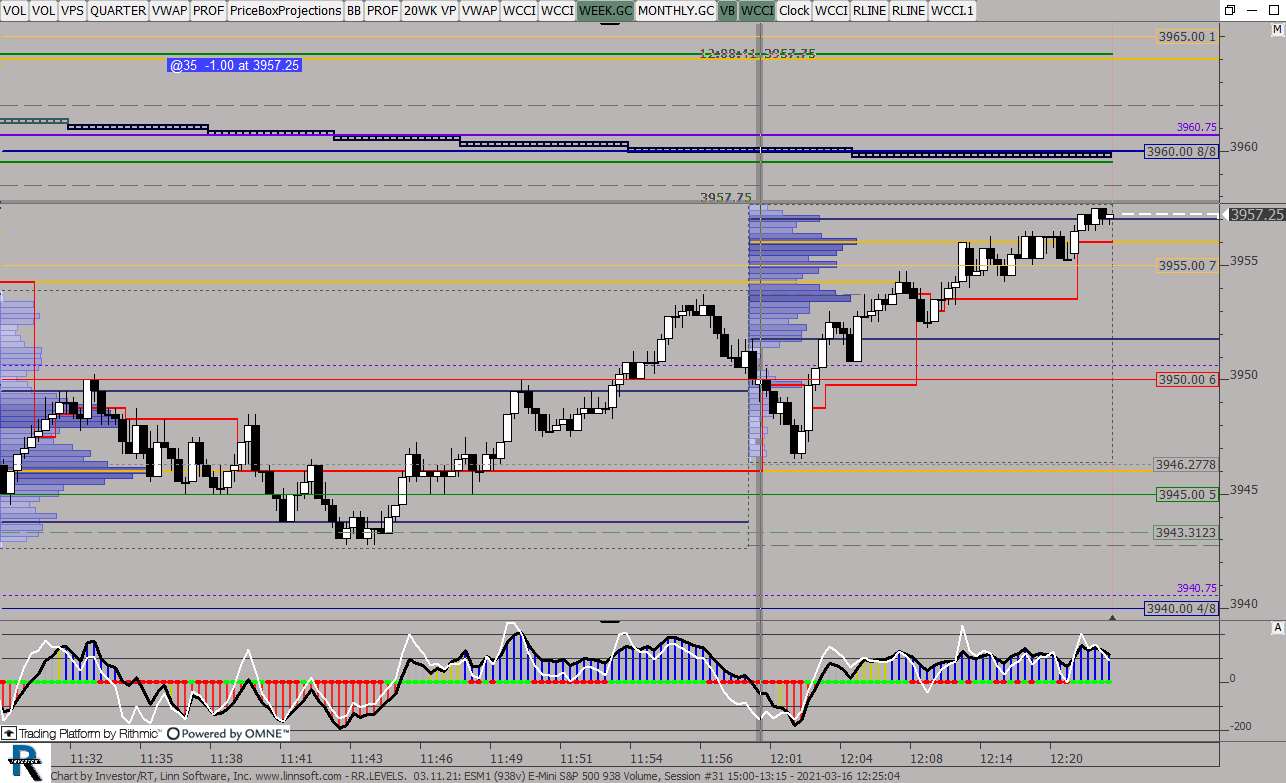 |
RRLEVELS (ESM1) ES42 [totalcount]
5 years 4 months ago
This chart was uploaded by Investor/RT 14.2.5 showing symbol: ESM1. |
View |
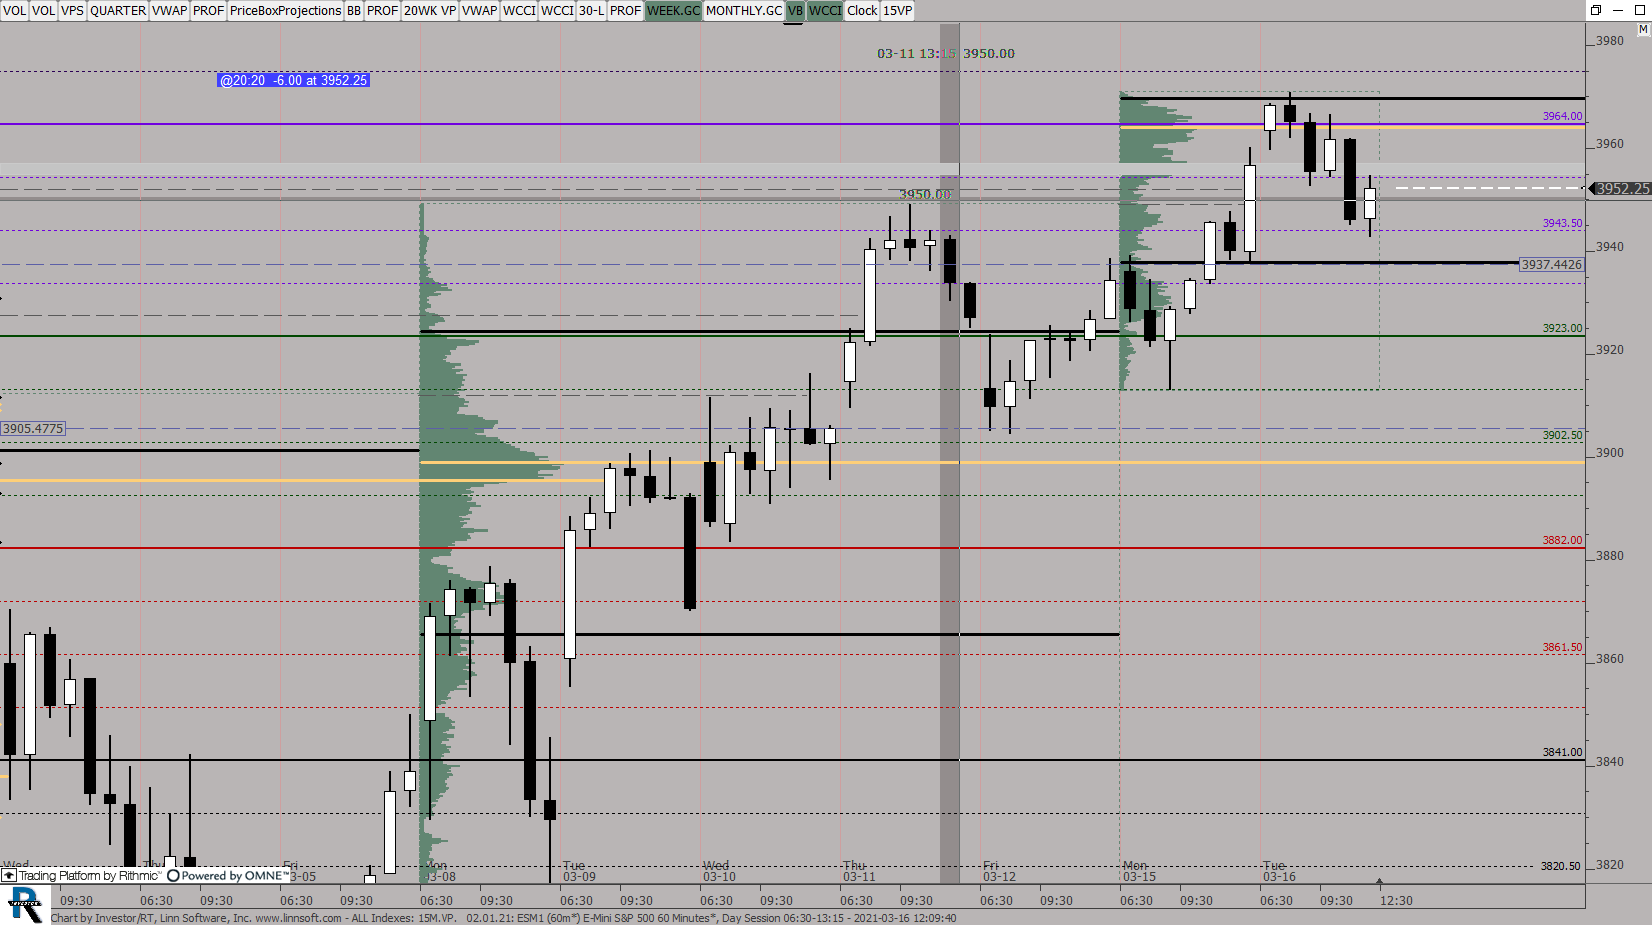 |
ALL Indexes 15MVP (ESM1) ES42 [totalcount]
5 years 4 months ago
This chart was uploaded by Investor/RT 14.2.5 showing symbol: ESM1. |
View |
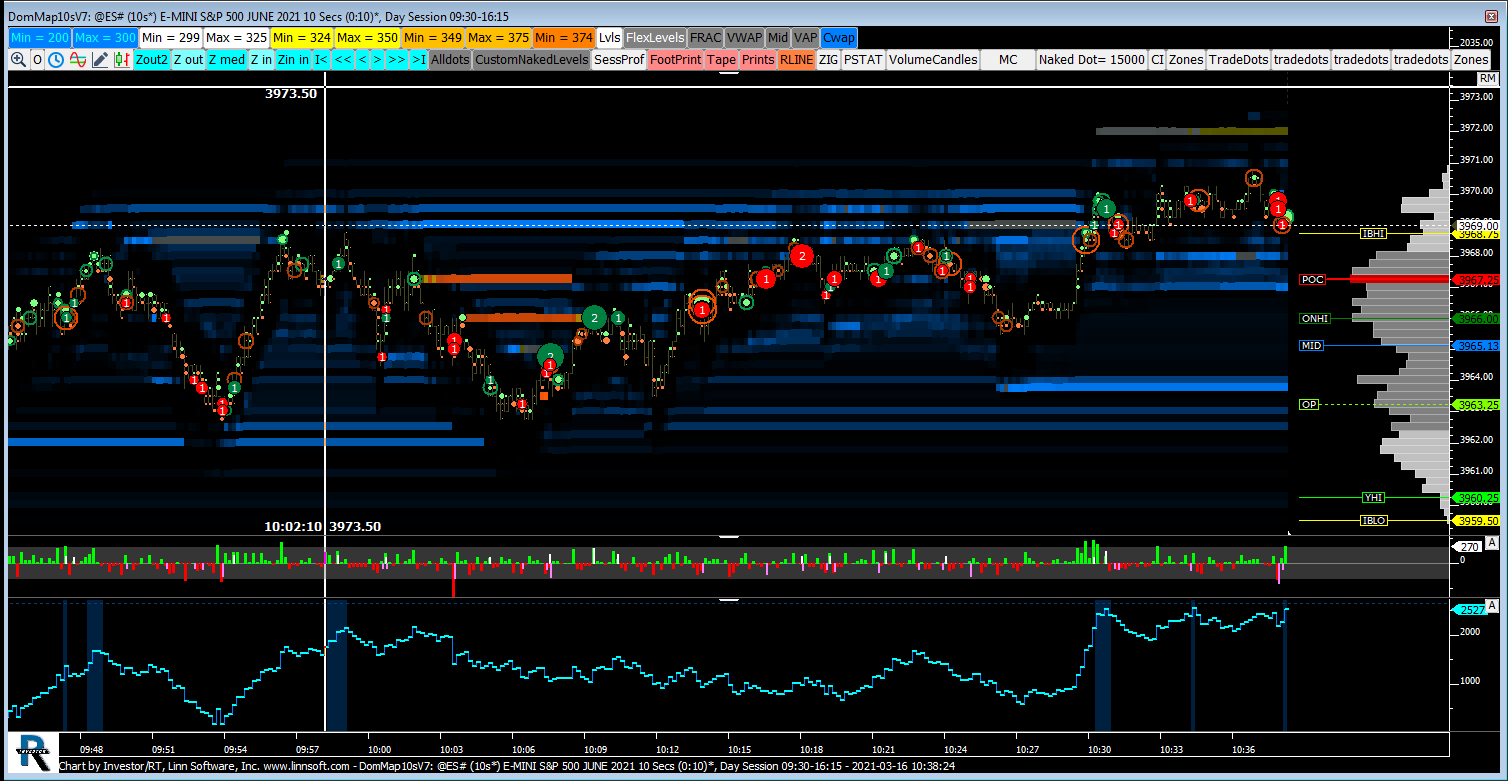 |
DomMap10sV (@ES#) jayski51369 [totalcount]
5 years 4 months ago
This chart was uploaded by Investor/RT 13.7.10 showing symbol: @ES#. |
View |
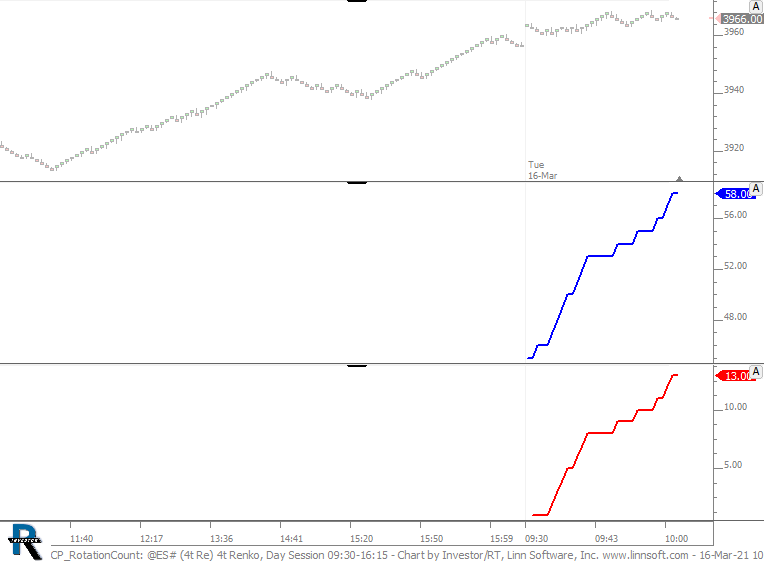 |
CP RotationCount (@ES#) cpayne [totalcount]
5 years 4 months ago
This chart was uploaded by Investor/RT 14.2.6 showing symbol: @ES#. |
View |
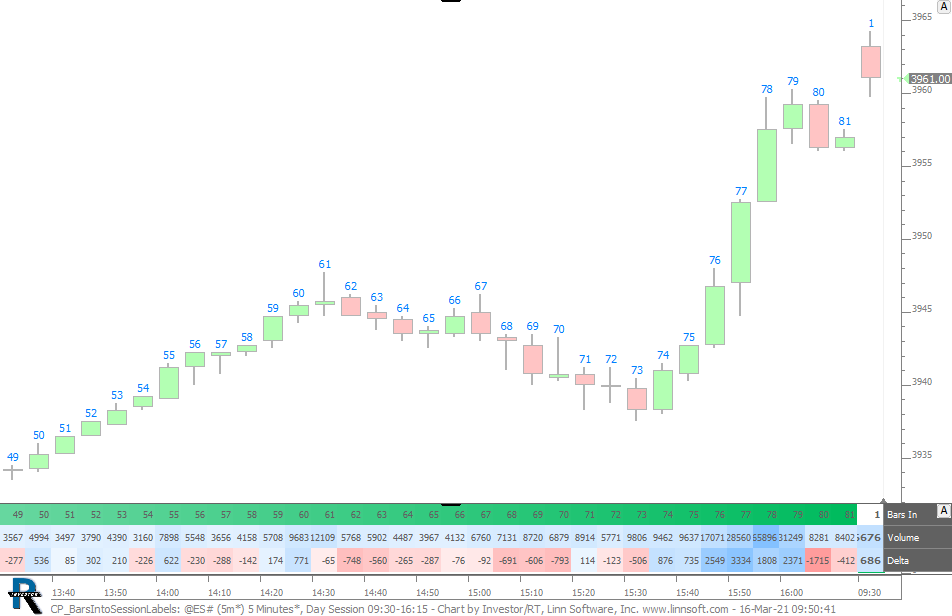 |
CP BarsIntoSessionLabels (@ES#) cpayne [totalcount]
5 years 4 months ago
Show Bars Into Session as Text as either Signal Marker labels or Bar Statistics. This chart was uploaded by Investor/RT 14.2.6 showing symbol: @ES#. |
View |
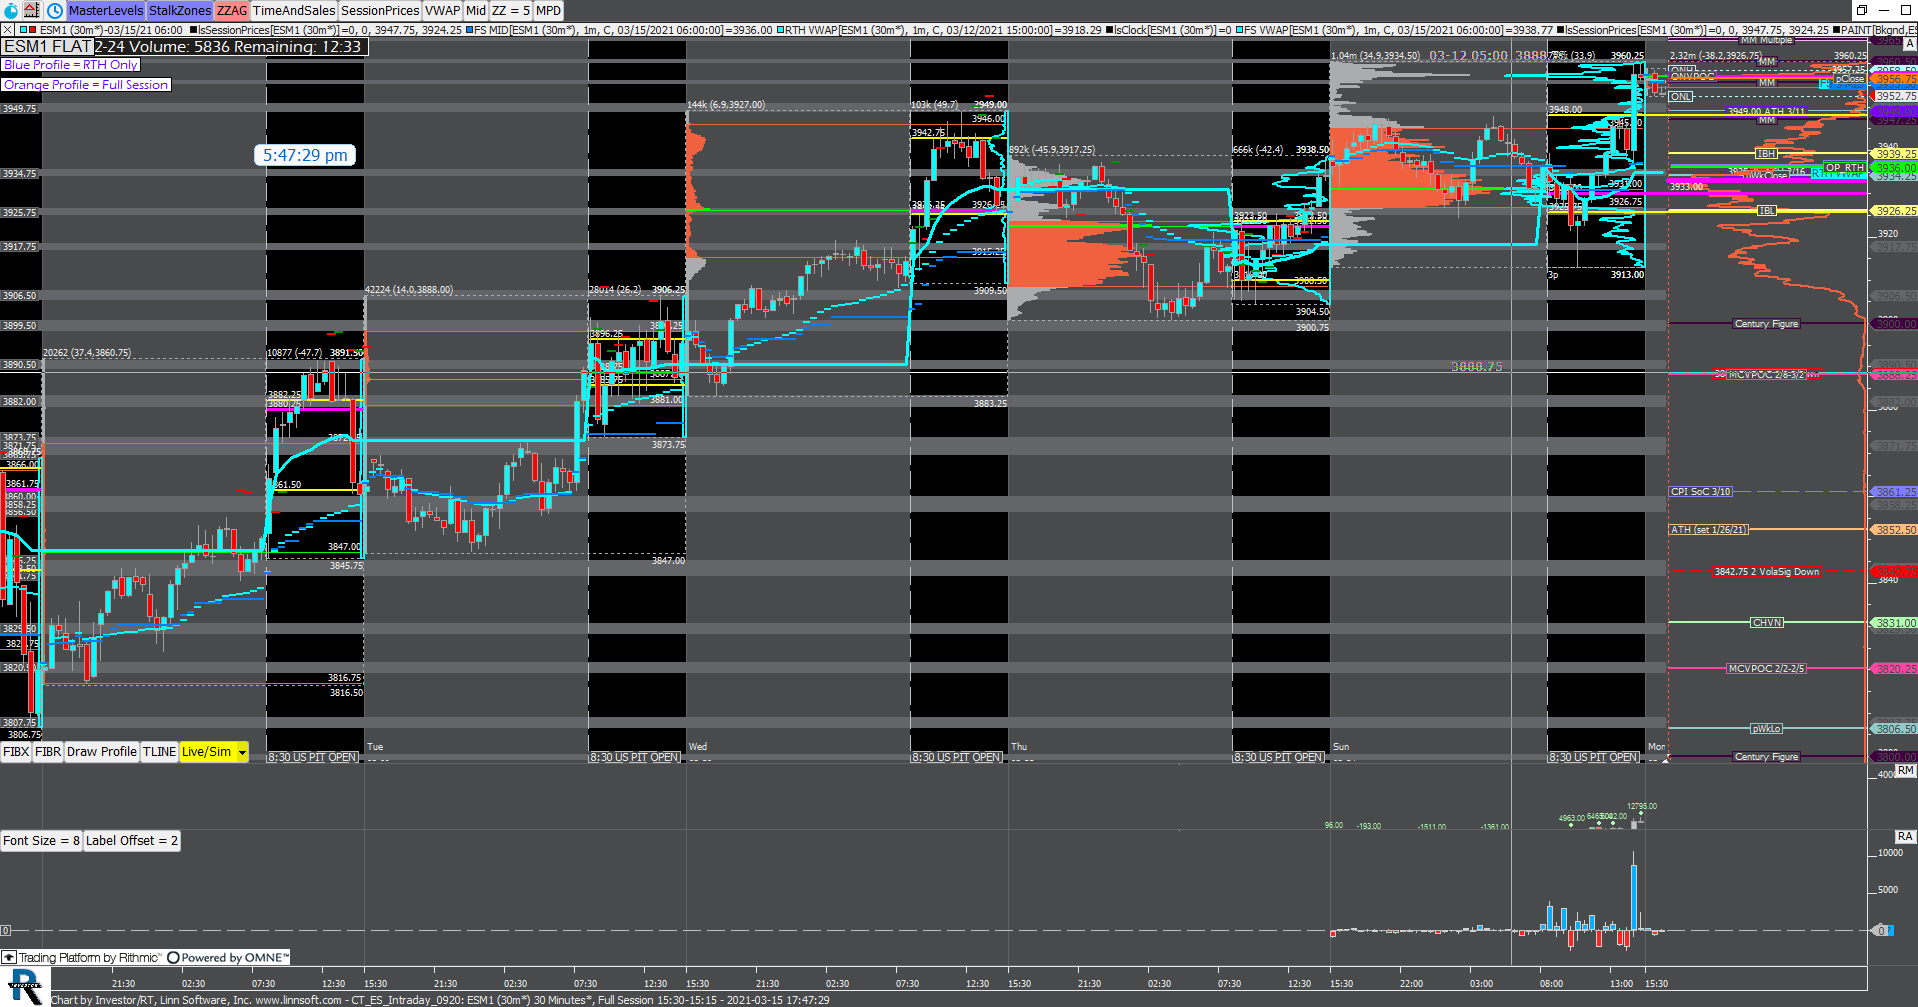 |
CT ES Intraday 0920 (ESM1) Robert Smith [totalcount]
5 years 4 months ago
no, or little, volume profile beyond 3/11. This chart was uploaded by Investor/RT 14.2.5 showing symbol: ESM1. |
View |
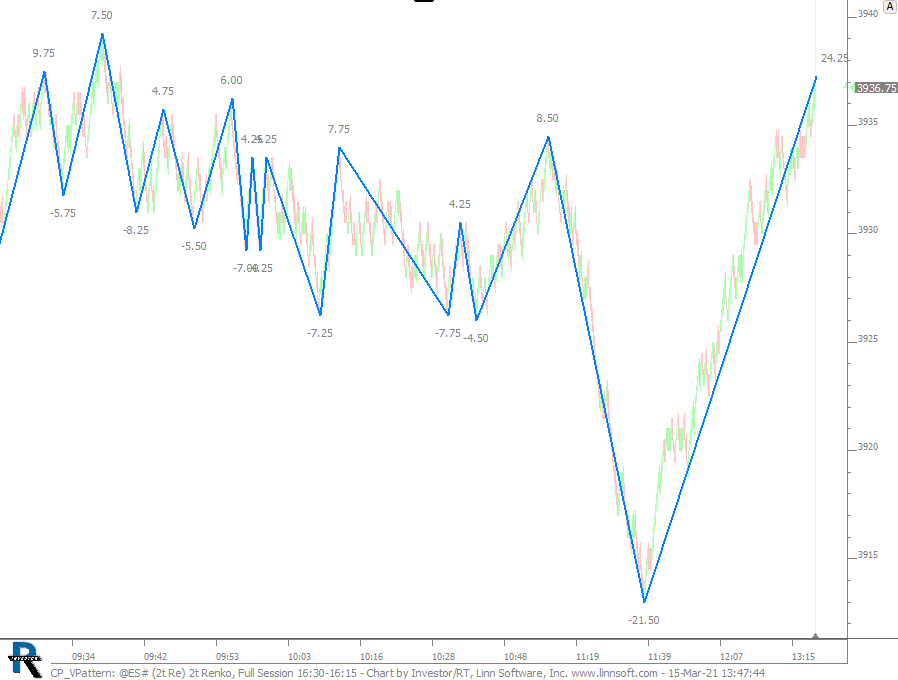 |
CP VPattern (@ES#) cpayne [totalcount]
5 years 4 months ago
This chart was uploaded by Investor/RT 14.2.6 showing symbol: @ES#. |
View |
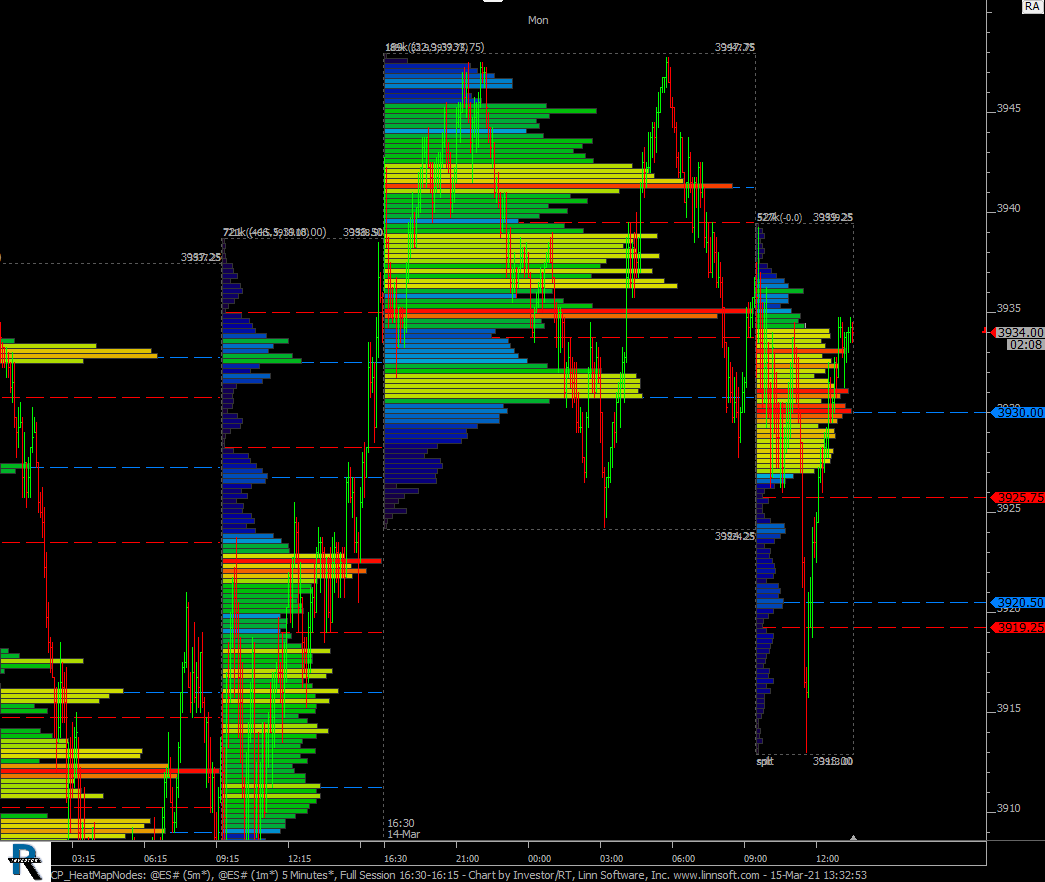 |
CP HeatMapNodes (@ES#) cpayne [totalcount]
5 years 4 months ago
This chart was uploaded by Investor/RT 14.2.6 showing symbol: @ES#. |
View |
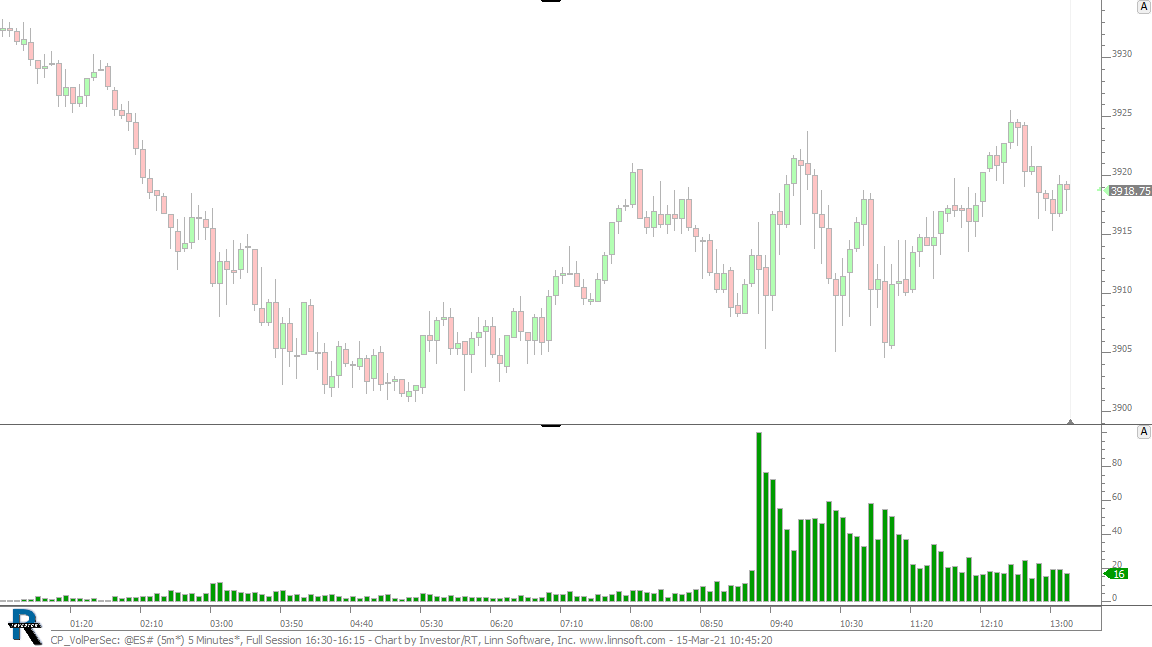 |
CP VolPerSec (@ES#) cpayne [totalcount]
5 years 4 months ago
Volume Per Second with Volume Breakdown. This chart was uploaded by Investor/RT 14.2.6 showing symbol: @ES#. |
View |
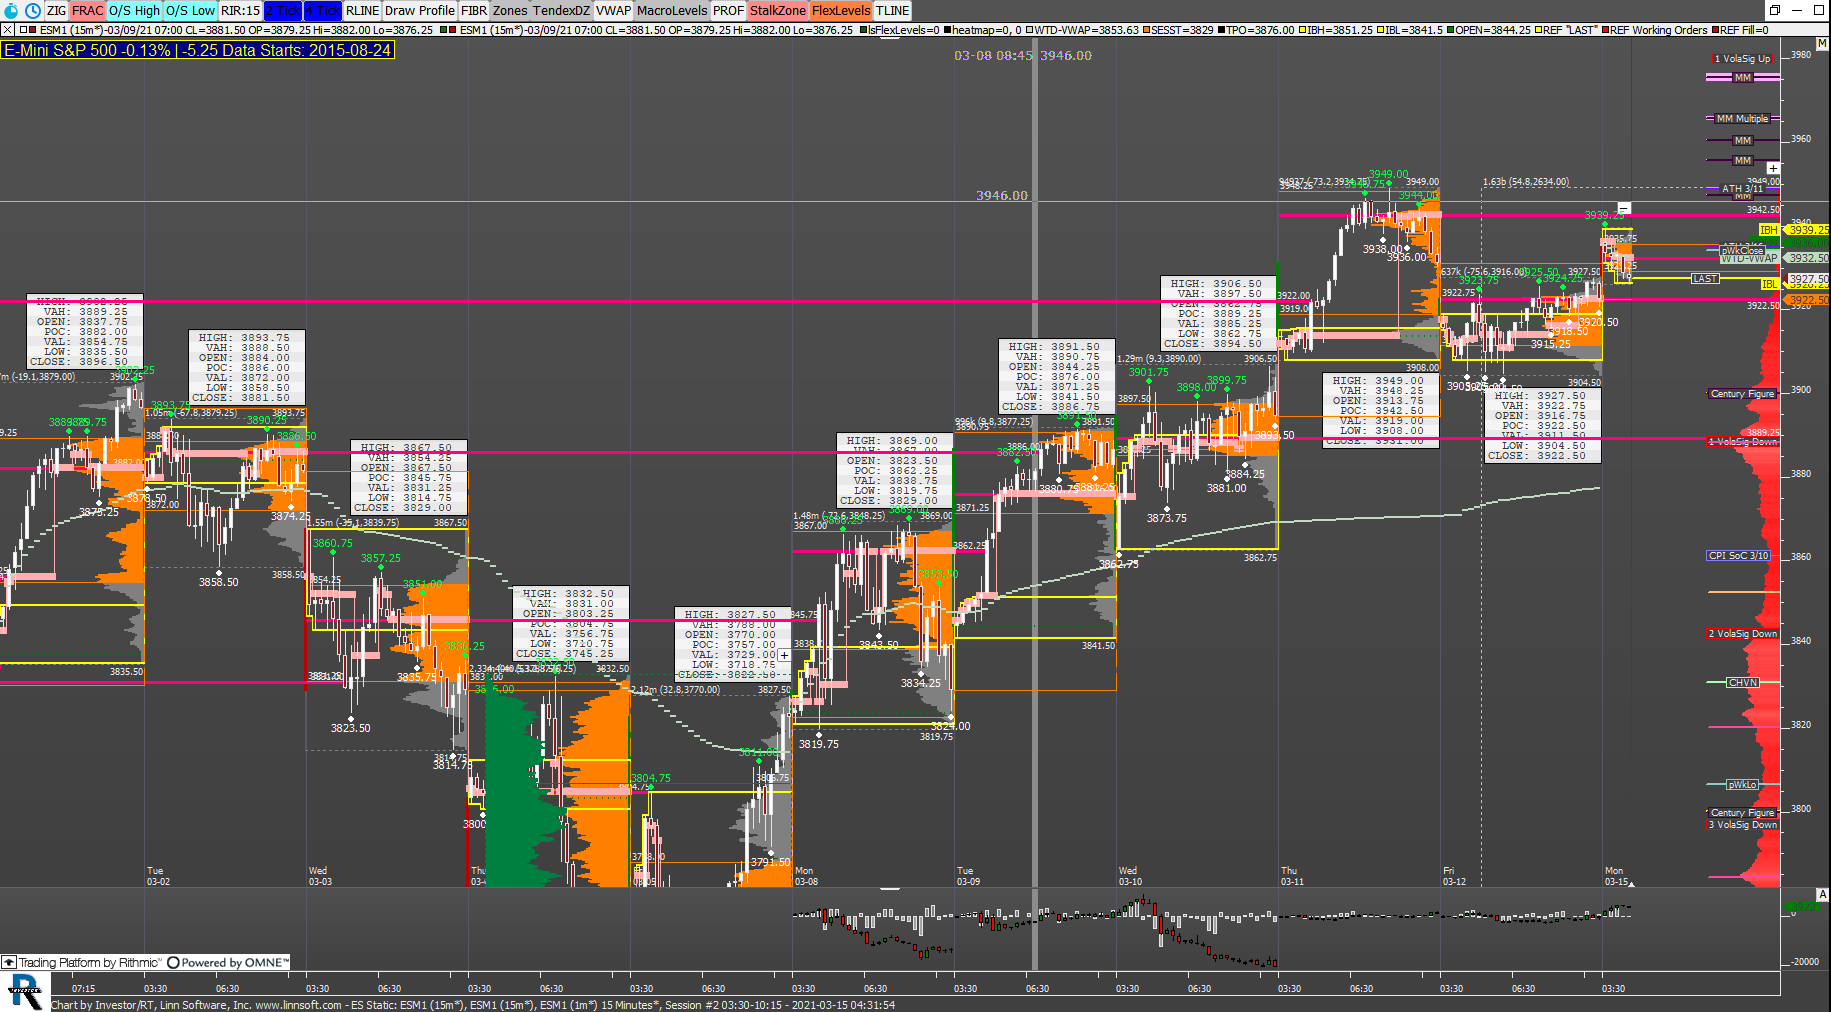 |
ES Static (ESM1) dbierwert [totalcount]
5 years 4 months ago
This chart was uploaded by Investor/RT 14.2.5 showing symbol: ESM1. |
View |
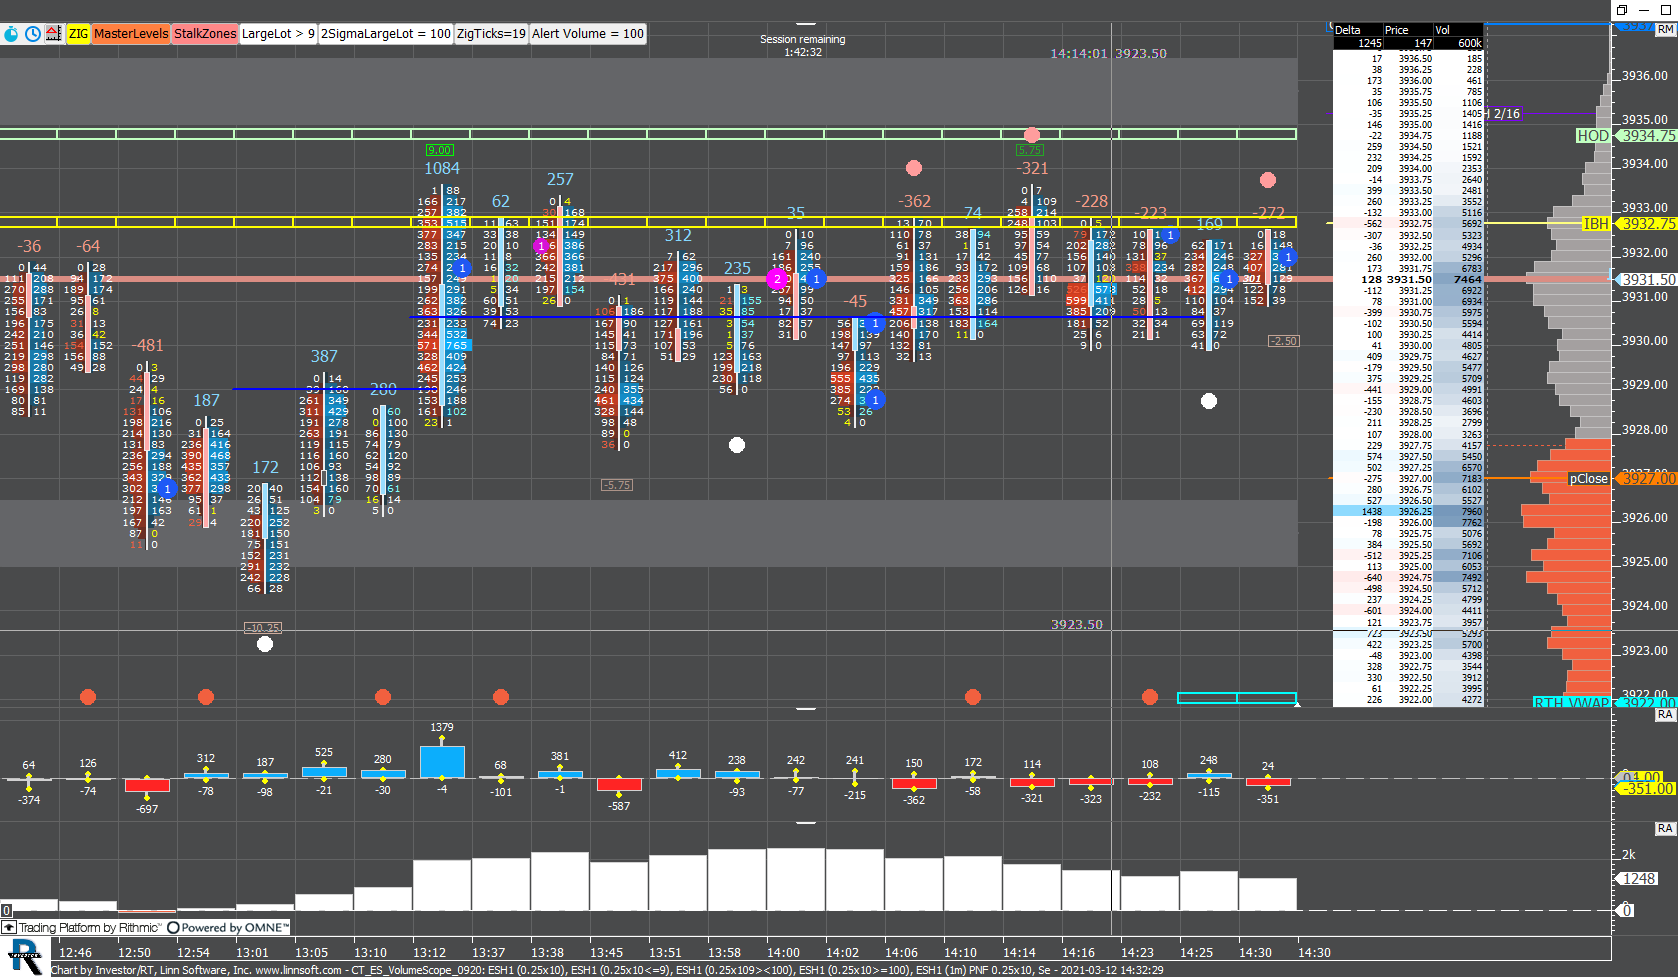 |
CT ES VolumeScope 0920 (ESH1) Ninja0527 [totalcount]
5 years 4 months ago
This chart was uploaded by Investor/RT 14.2.6 showing symbol: ESH1. |
View |
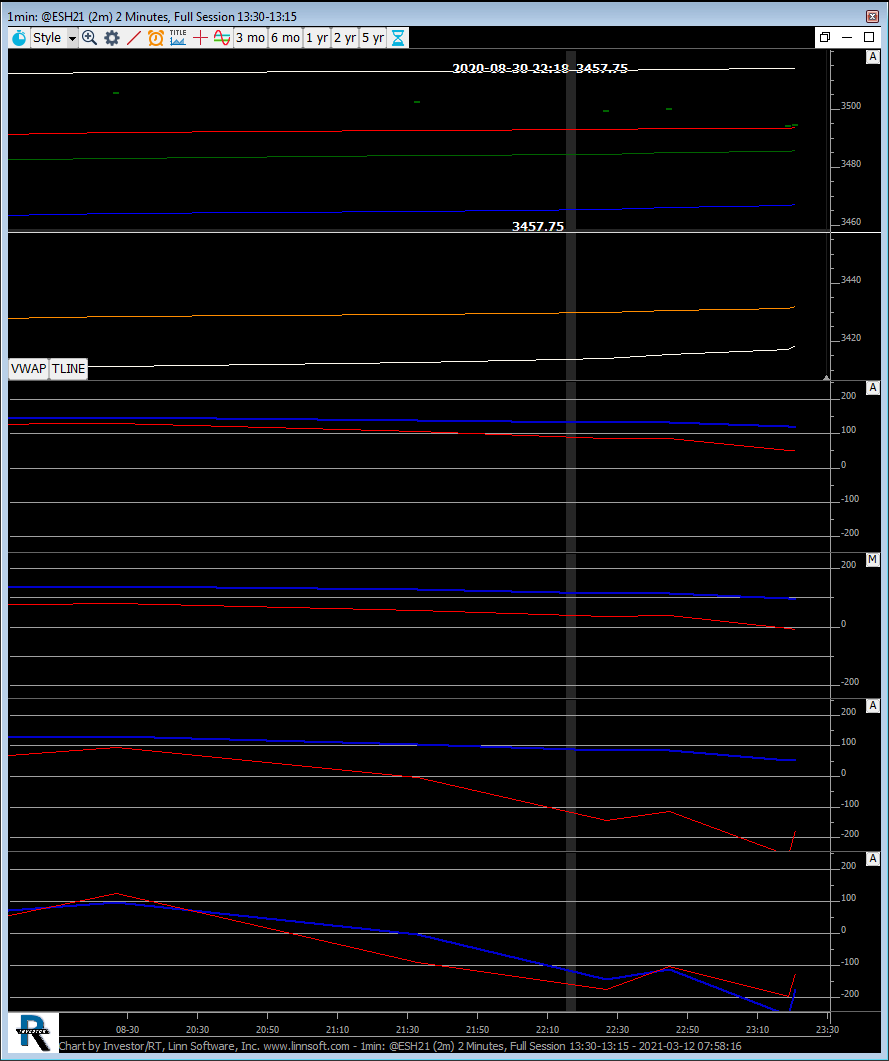 |
1min (@ESH21) duffytrader [totalcount]
5 years 4 months ago
This chart was uploaded by Investor/RT 14.2.5 showing symbol: @ESH21. |
View |
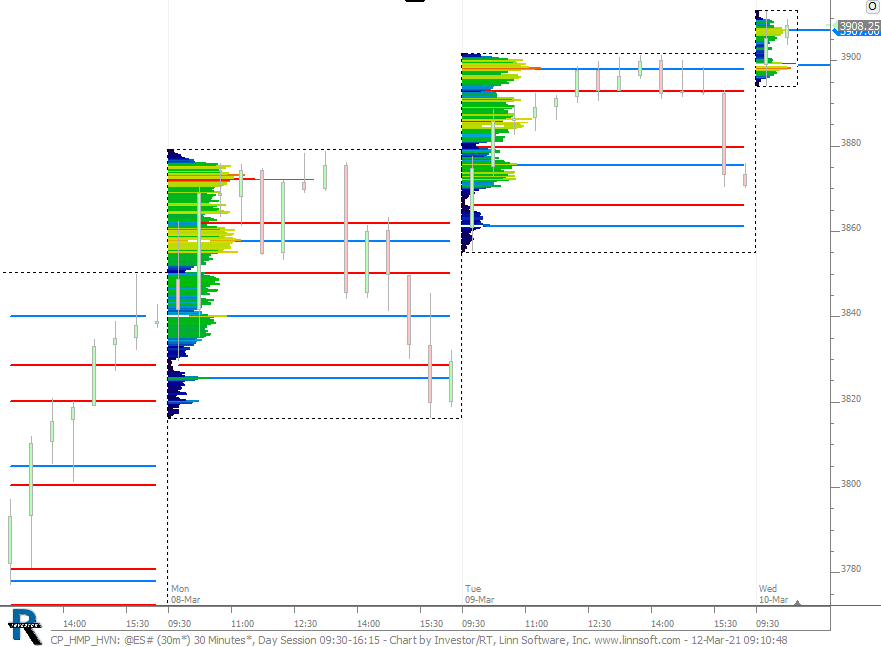 |
CP HMP HVN (@ES#) cpayne [totalcount]
5 years 4 months ago
This chart was uploaded by Investor/RT 14.2.6 showing symbol: @ES#. |
View |
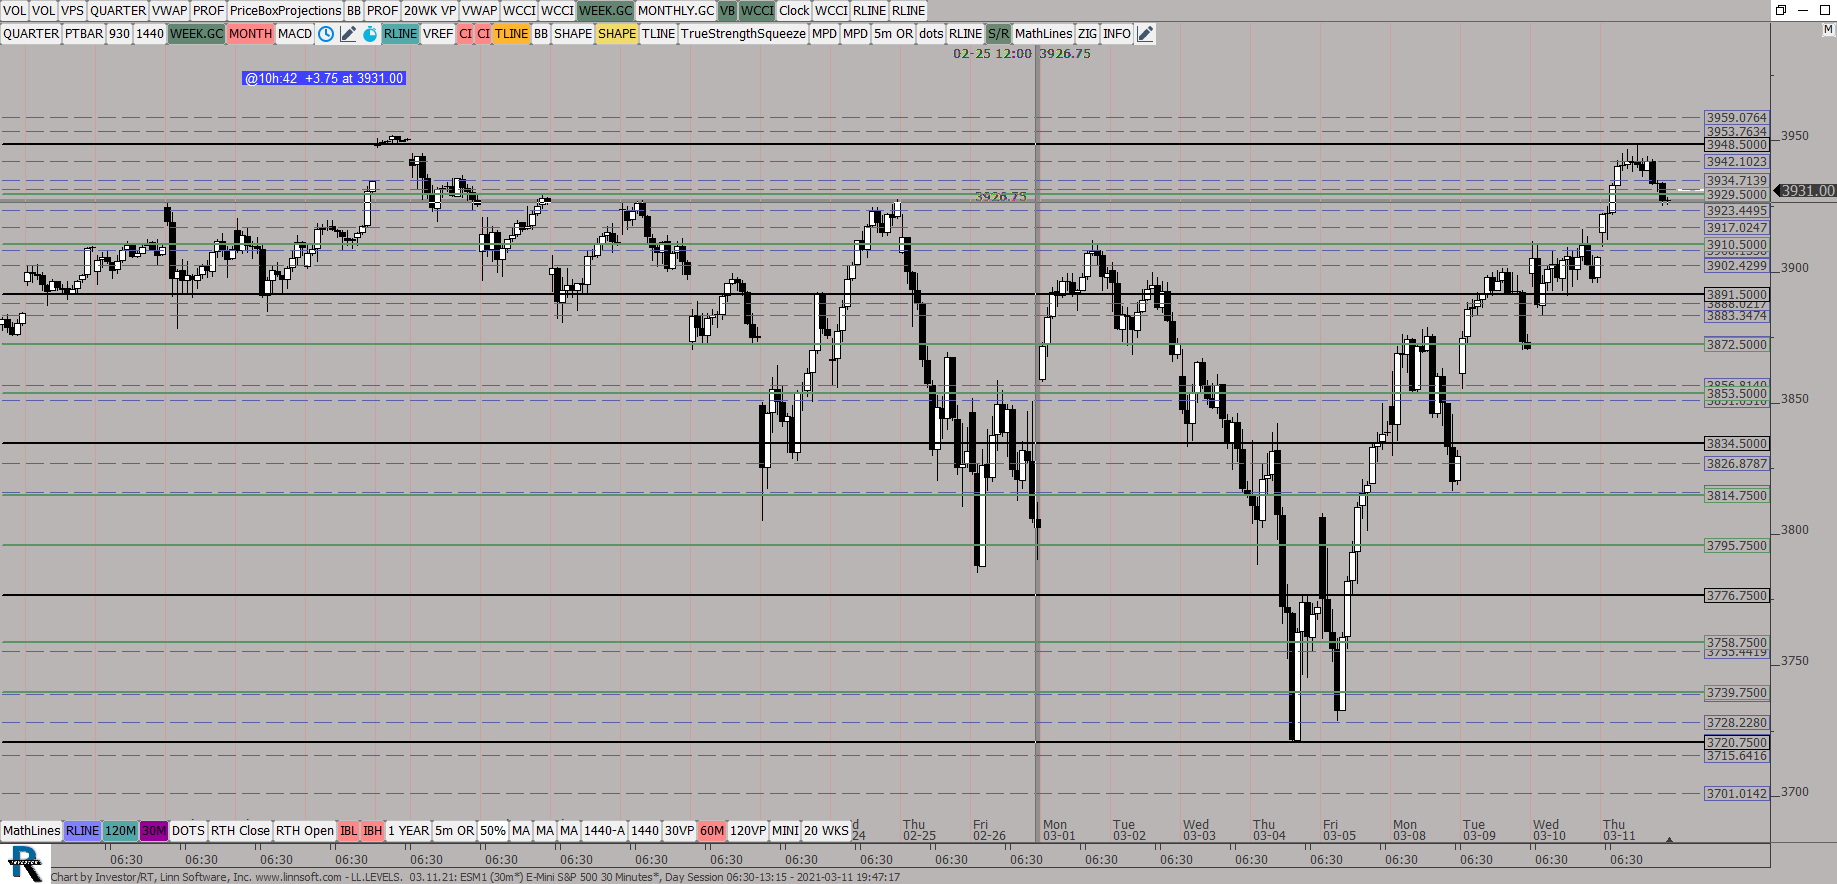 |
LLLEVELS (ESM1) ES42 [totalcount]
5 years 4 months ago
This chart was uploaded by Investor/RT 14.2.5 showing symbol: ESM1. |
View |
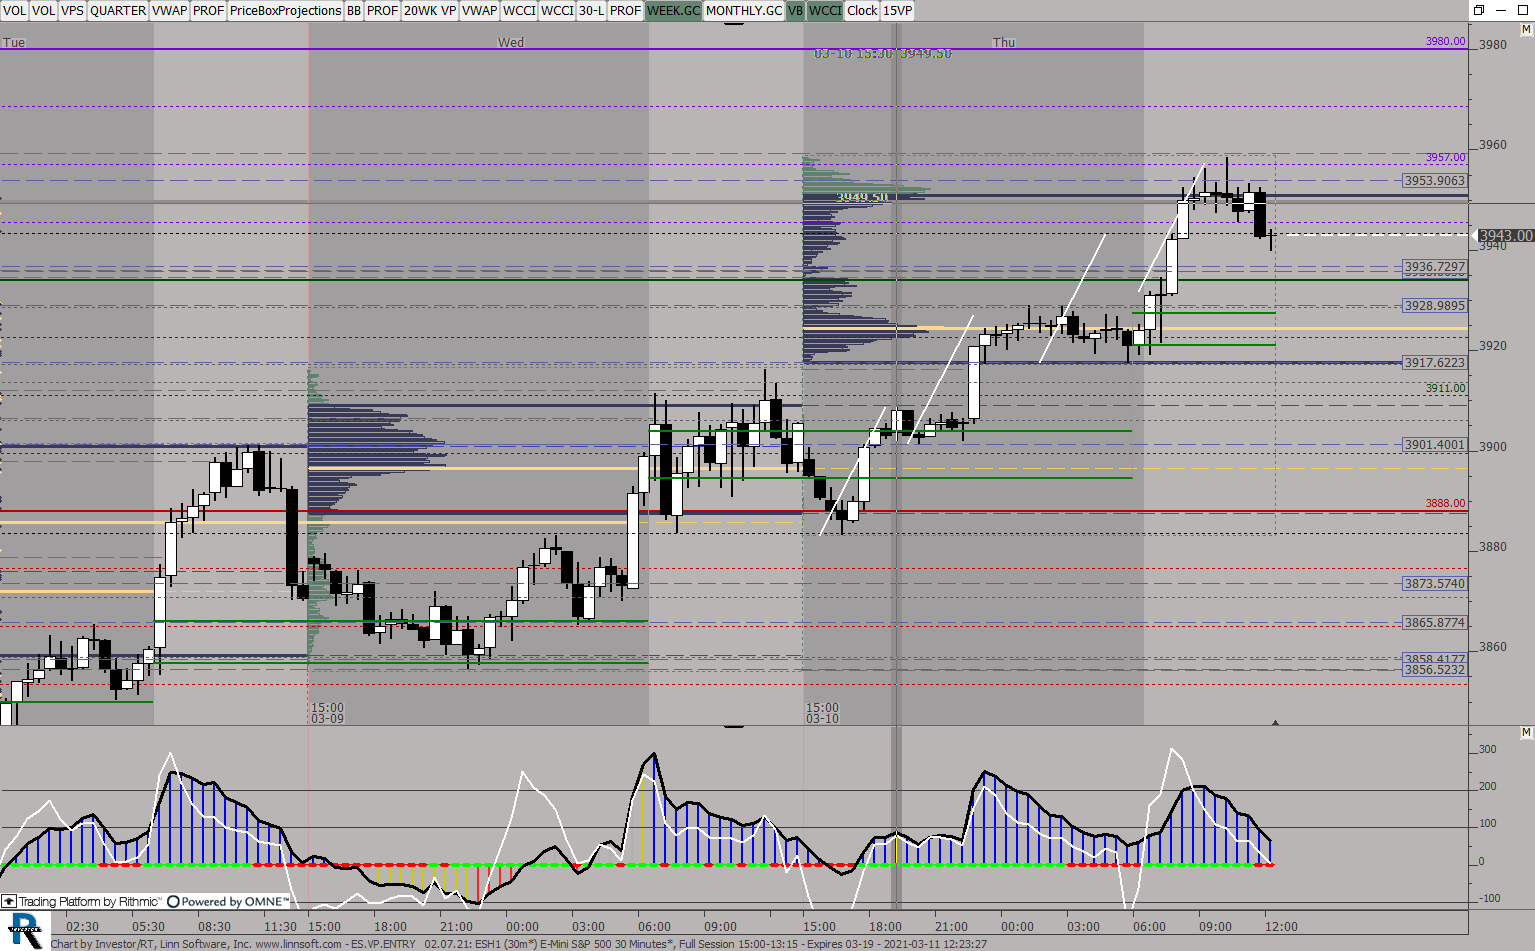 |
ESVPENTRY (ESH1) ES42 [totalcount]
5 years 4 months ago
This chart was uploaded by Investor/RT 14.2.5 showing symbol: ESH1. |
View |
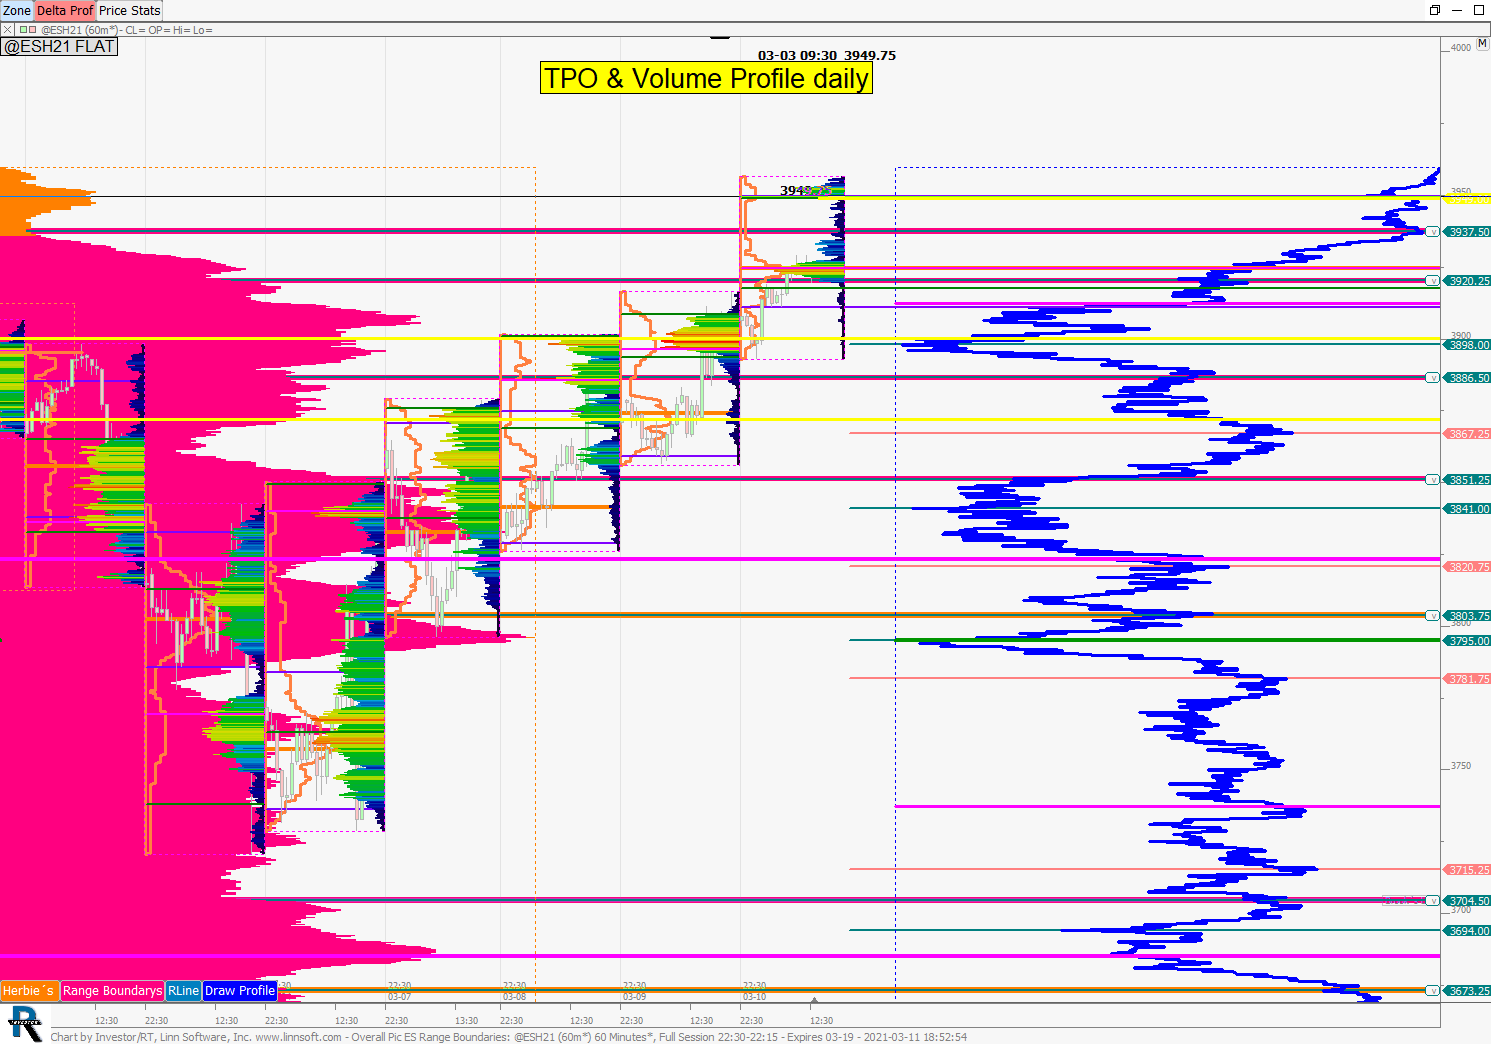 |
Overall Pic ES Range Boundaries (@ESH21) Herbert Ritsch [totalcount]
5 years 4 months ago
Hello this is the chart where I plotted the IB Europe, got this pane form FT71 best regards, herbert PS: I am sending the other chart in a seperate email. |
View |
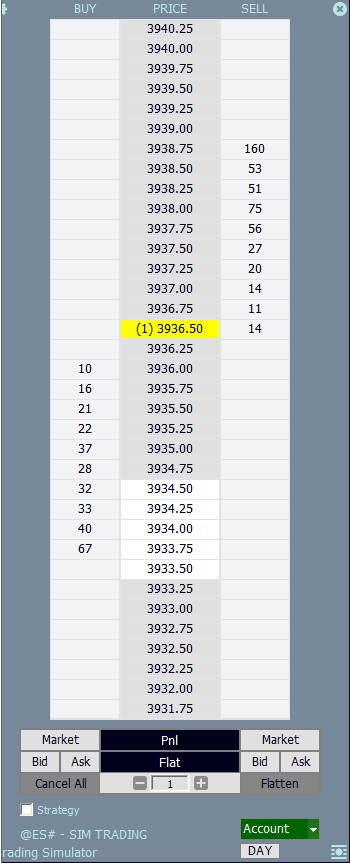 |
ES TradingDOM (@ES#) william-linn [totalcount]
5 years 4 months ago
Sample DOM Only Chart Window. This chart was uploaded by Investor/RT 14.2.6 showing symbol: @ES#. |
View |
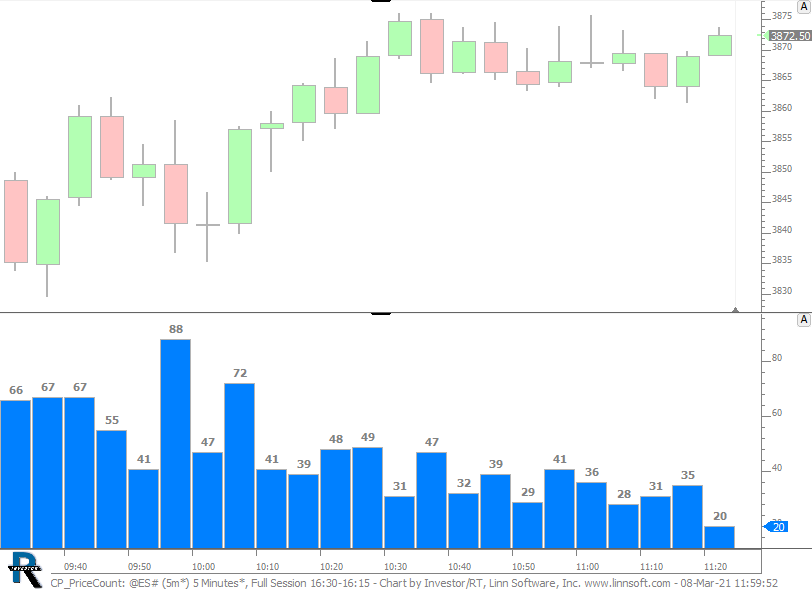 |
CP PriceCount (@ES#) cpayne [totalcount]
5 years 4 months ago
Labels range of each bar in ticks. This chart was uploaded by Investor/RT 14.2.6 showing symbol: @ES#. |
View |
 |
CP PriceCount (@ES#) cpayne [totalcount]
5 years 4 months ago
Labels range of each bar in ticks. This chart was uploaded by Investor/RT 14.2.6 showing symbol: @ES#. |
View |
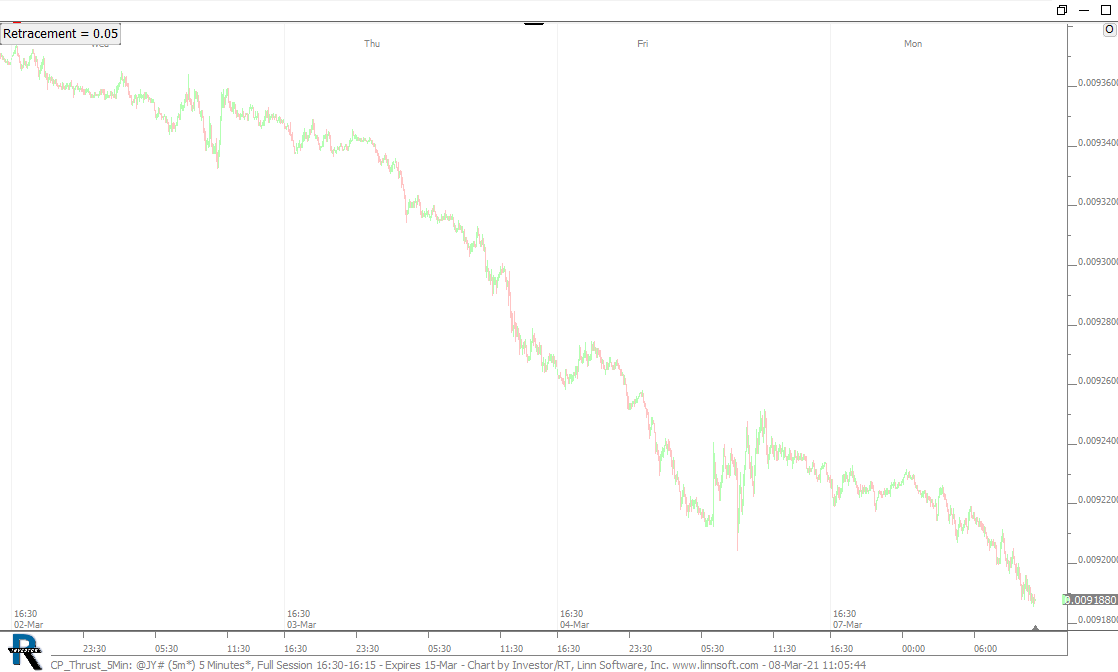 |
CP Thrust 5Min (@JY#) cpayne [totalcount]
5 years 4 months ago
This chart was uploaded by Investor/RT 14.2.6 showing symbol: @JY#. |
View |
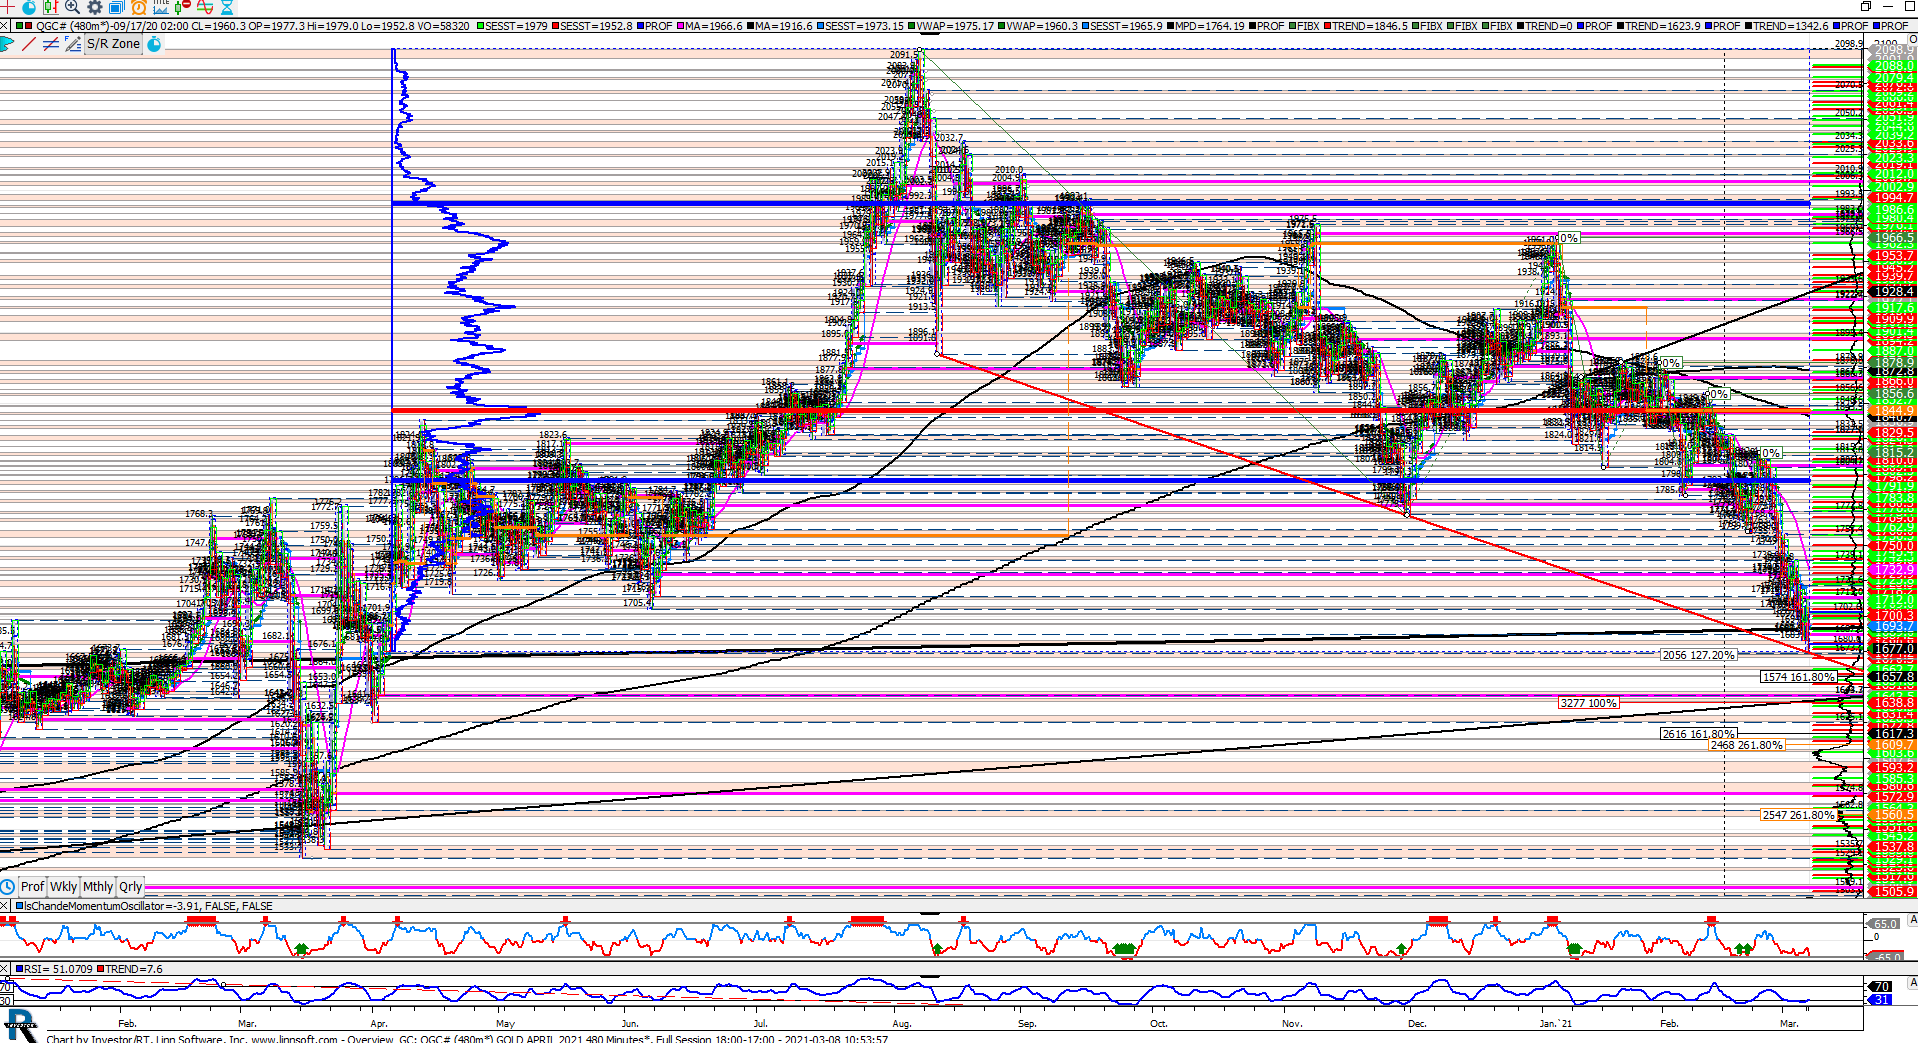 |
Overview GC (QGC#) npettinato [totalcount]
5 years 4 months ago
This chart was uploaded by Investor/RT 14.1.10 showing symbol: QGC#. |
View |
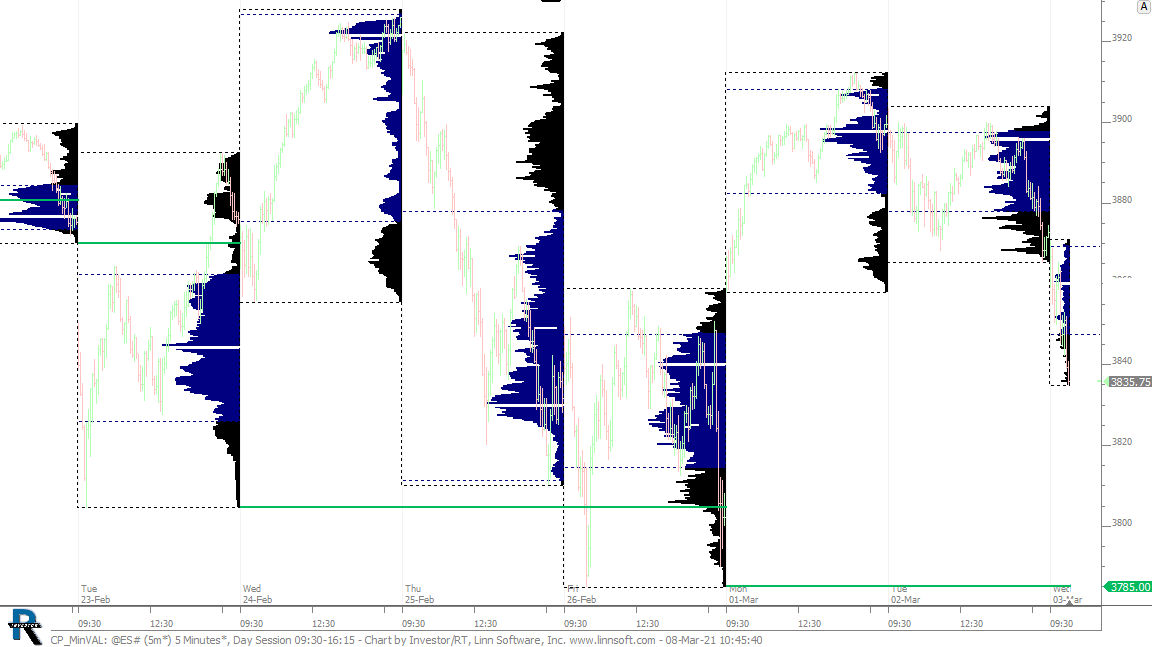 |
CP MinVAL (@ES#) cpayne [totalcount]
5 years 4 months ago
Min VAL of last 5 profiles. This chart was uploaded by Investor/RT 14.2.6 showing symbol: @ES#. |
View |
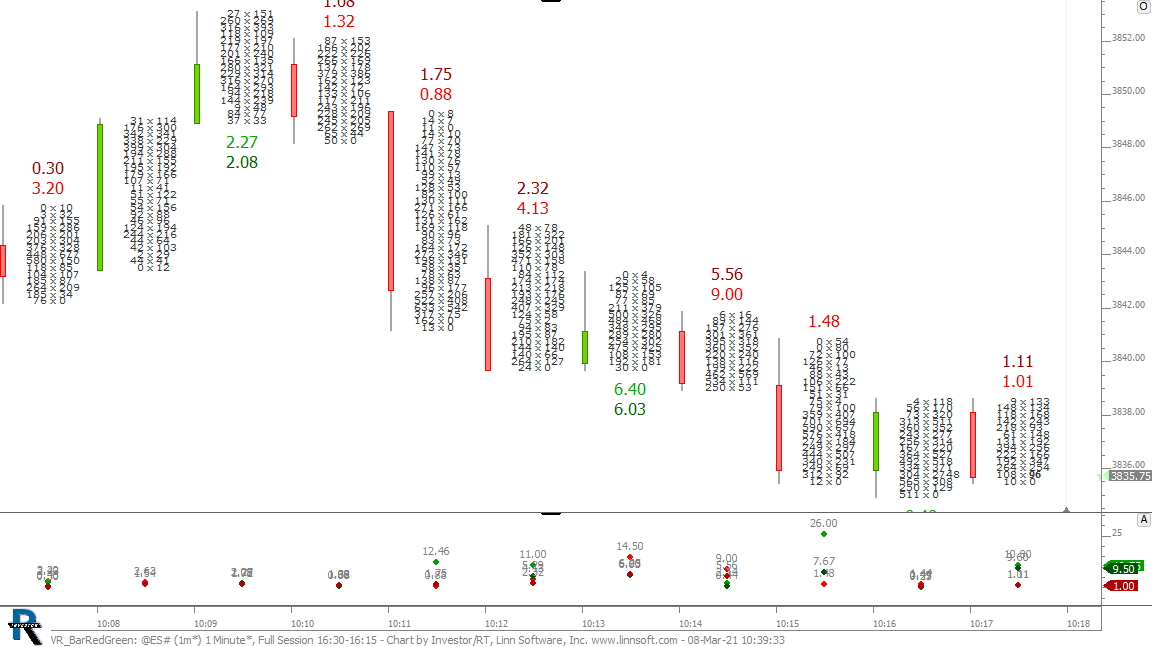 |
VR BarRedGreen (@ES#) cpayne [totalcount]
5 years 4 months ago
This chart was uploaded by Investor/RT 14.2.6 showing symbol: @ES#. |
View |