 |
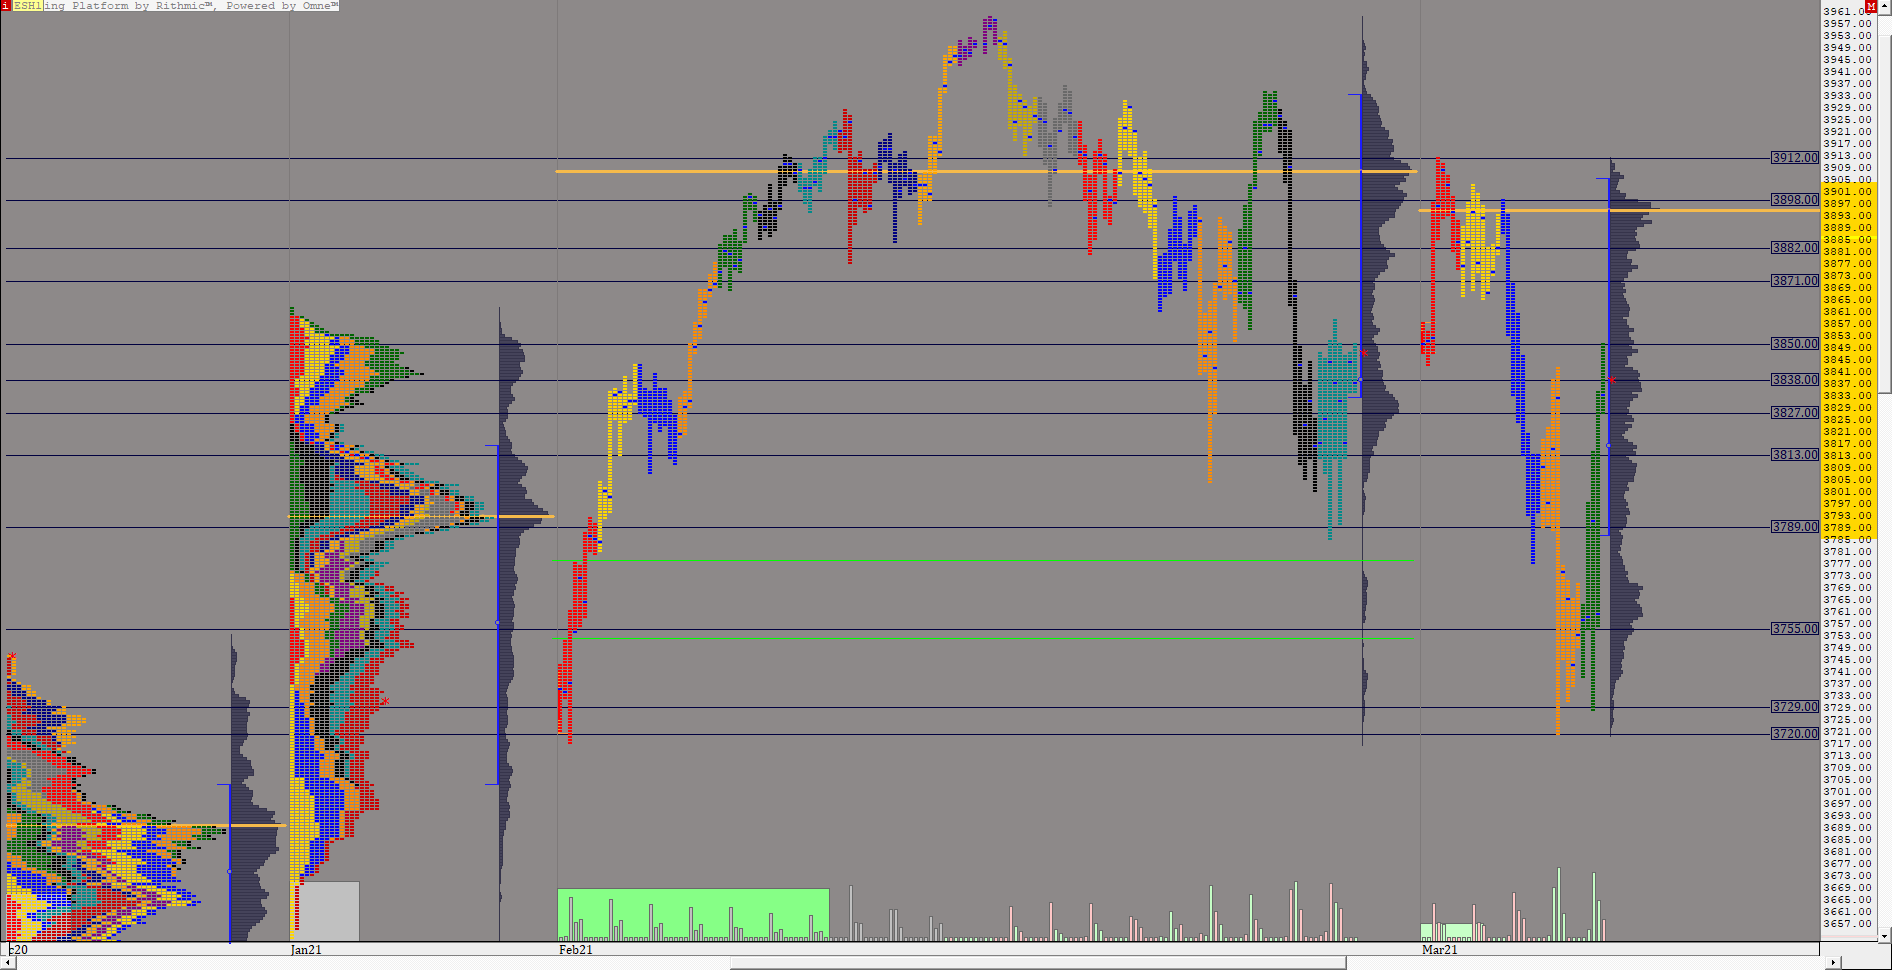
MP ES MONTHLY (ESH1) ES42 [totalcount]
5 years 4 months ago
This chart was uploaded by Investor/RT 14.2.5 showing symbol: ESH1. |
View |
 |
AUDJPY 13MA (AUD.JPY) hayden1059 [totalcount]
5 years 4 months ago
This chart was uploaded by Investor/RT 14.2.5 showing symbol: AUD.JPY. |
View |
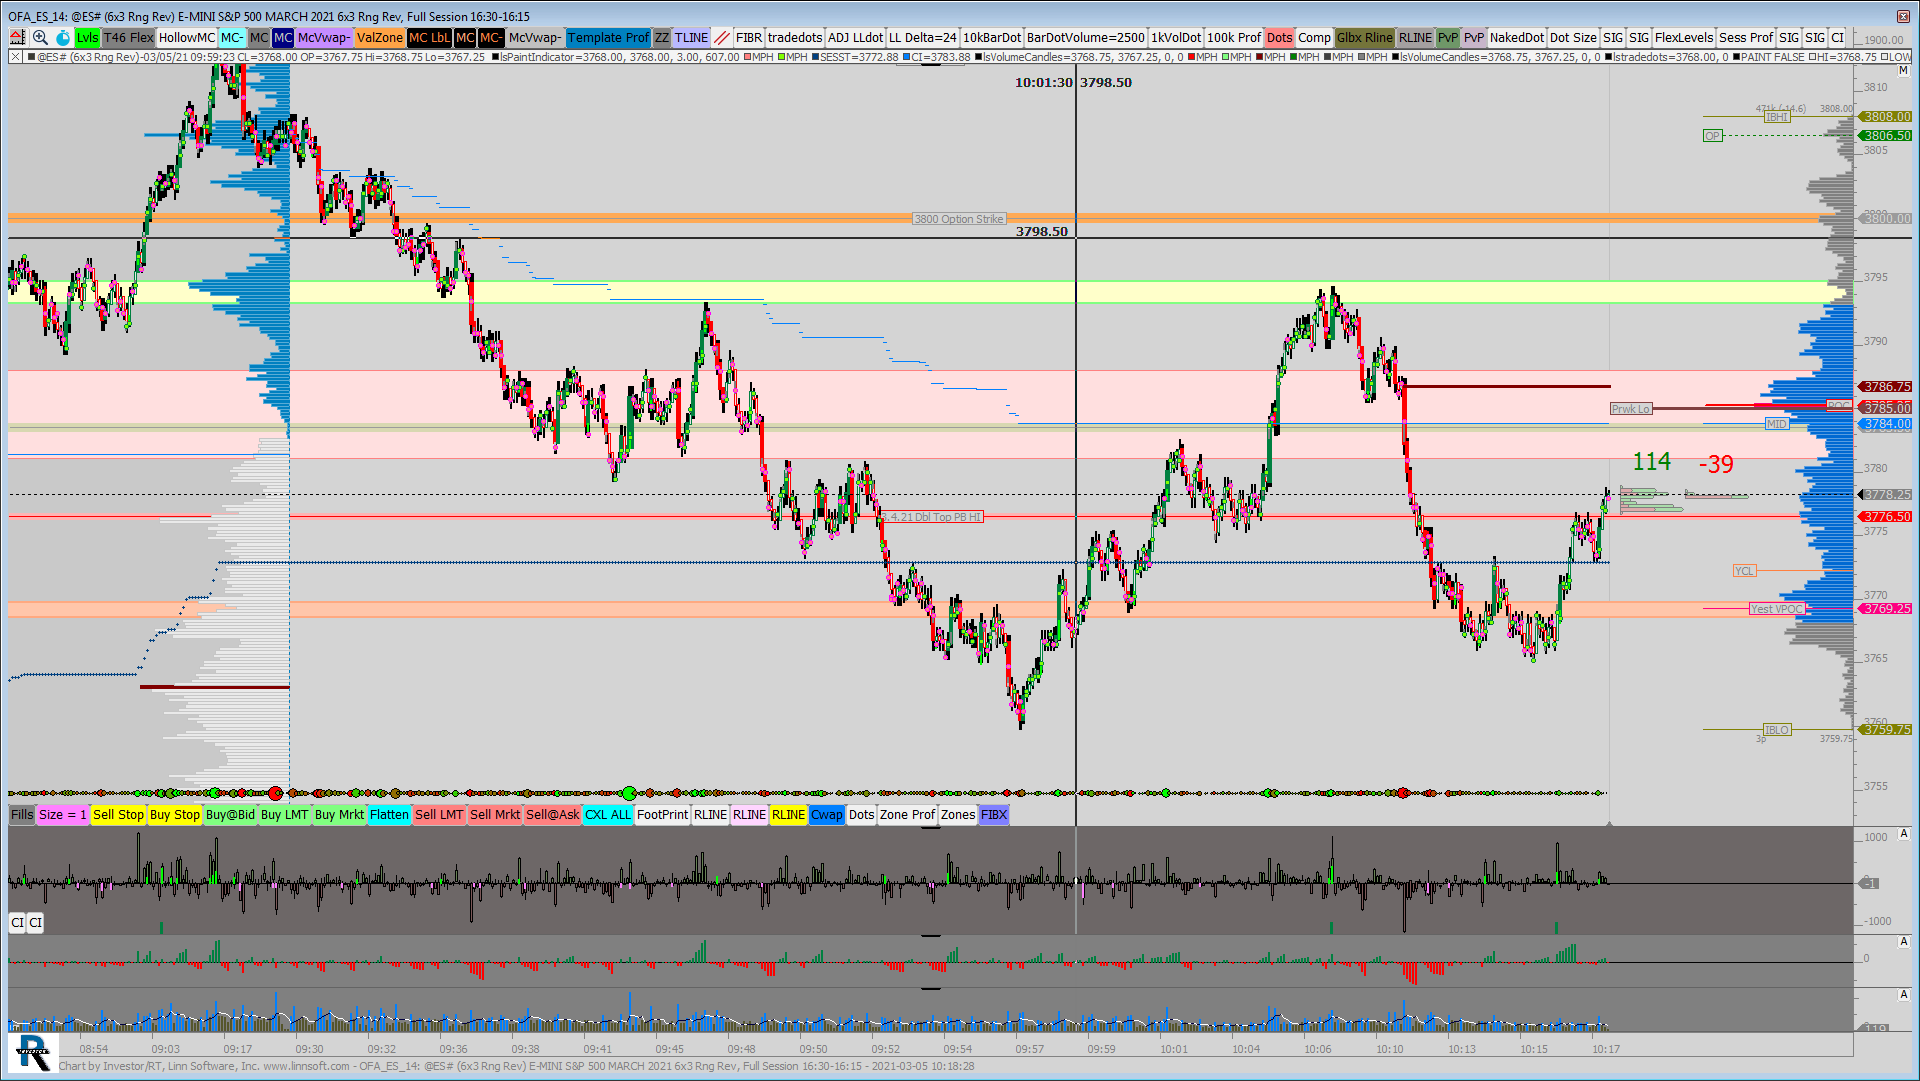 |
OFA ES (@ES#) jayski51369 [totalcount]
5 years 4 months ago
This chart was uploaded by Investor/RT 12.7.6 showing symbol: @ES#. |
View |
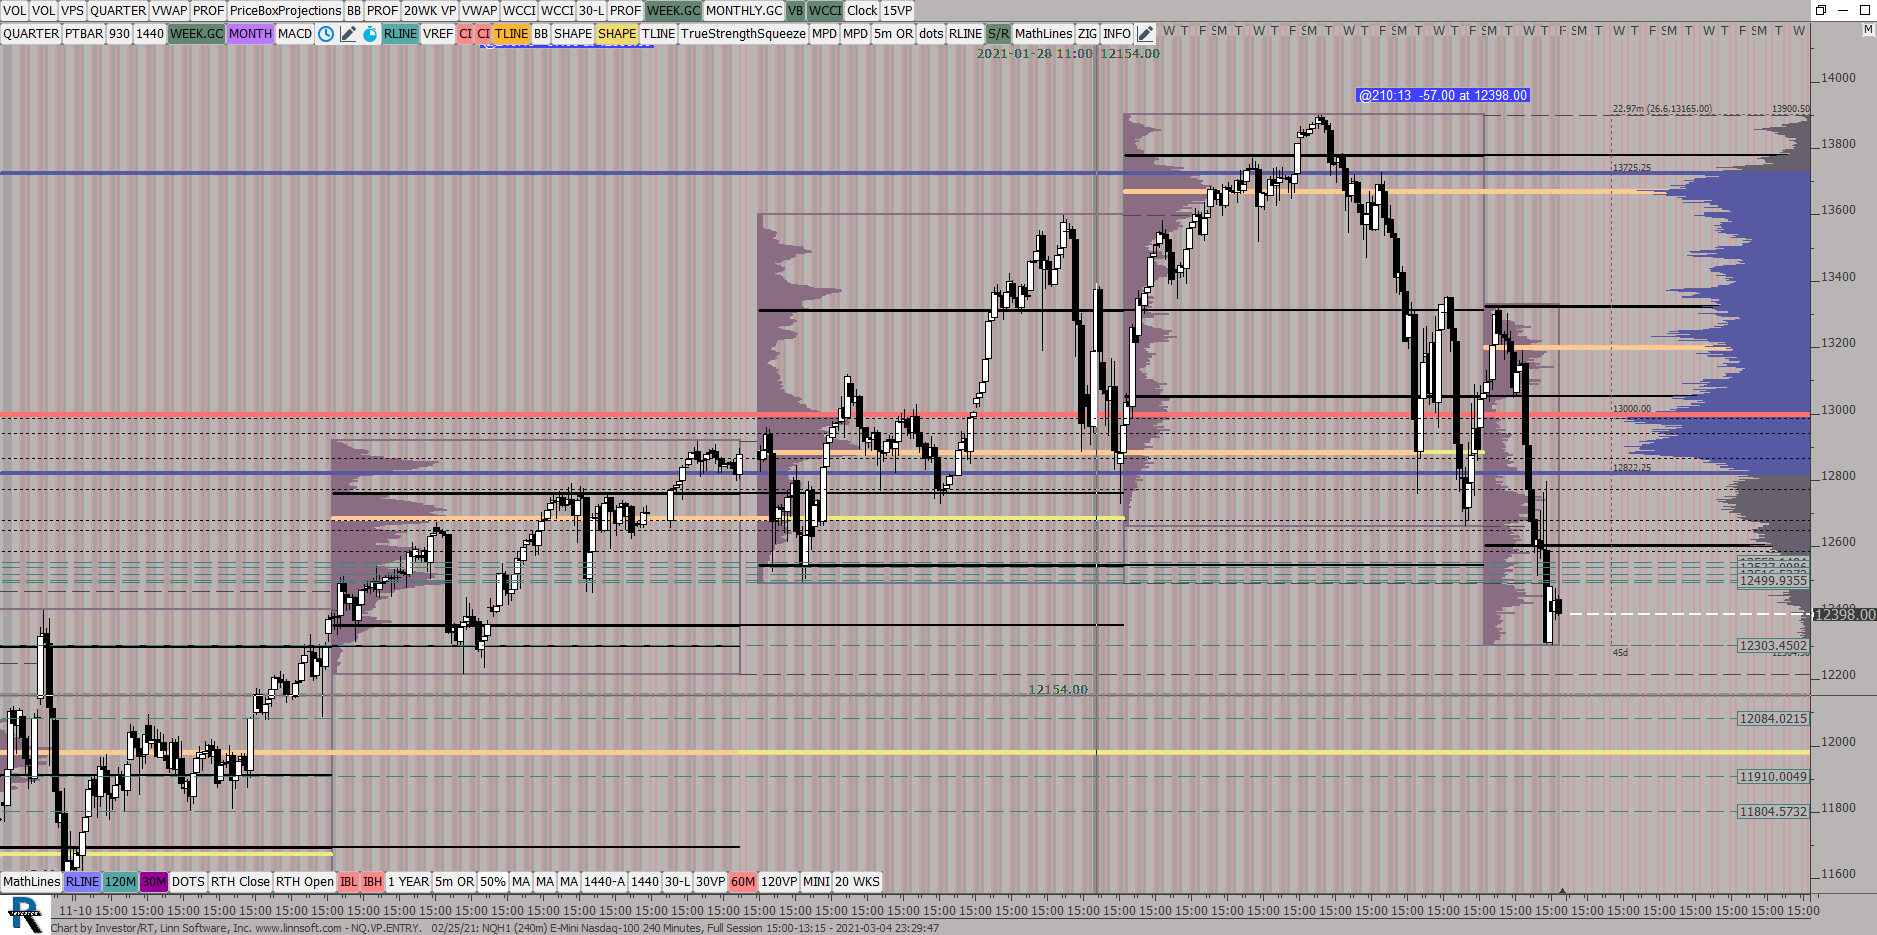 |
NQVPENTRY 02 25 (NQH1) ES42 [totalcount]
5 years 4 months ago
This chart was uploaded by Investor/RT 14.2.5 showing symbol: NQH1. |
View |
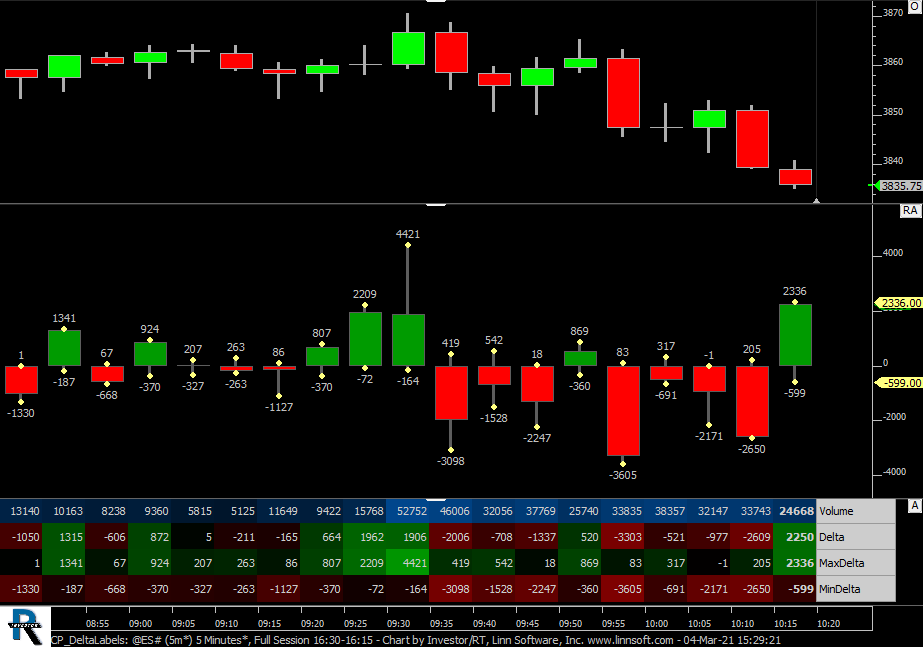 |
CP DeltaLabels (@ES#) cpayne [totalcount]
5 years 4 months ago
Max and Min Delta Labels. This chart was uploaded by Investor/RT 14.2.6 showing symbol: @ES#. |
View |
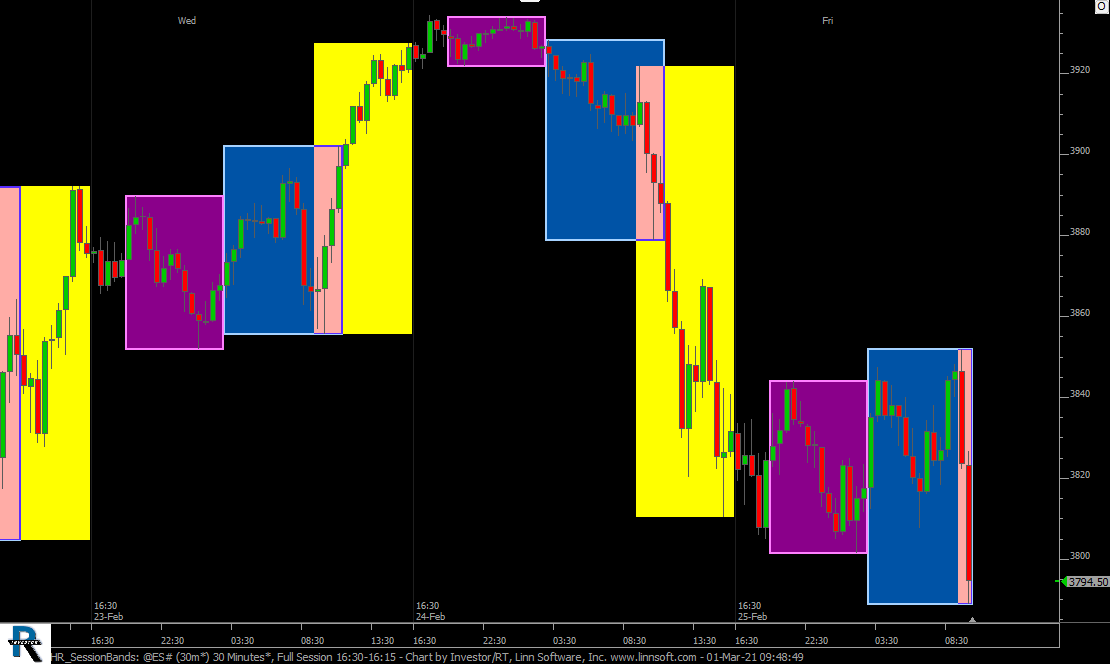 |
HR SessionBands (@ES#) cpayne [totalcount]
5 years 5 months ago
Bands for US, Asia, and Europe Sessoin. This chart was uploaded by Investor/RT 14.2.6 showing symbol: @ES#. |
View |
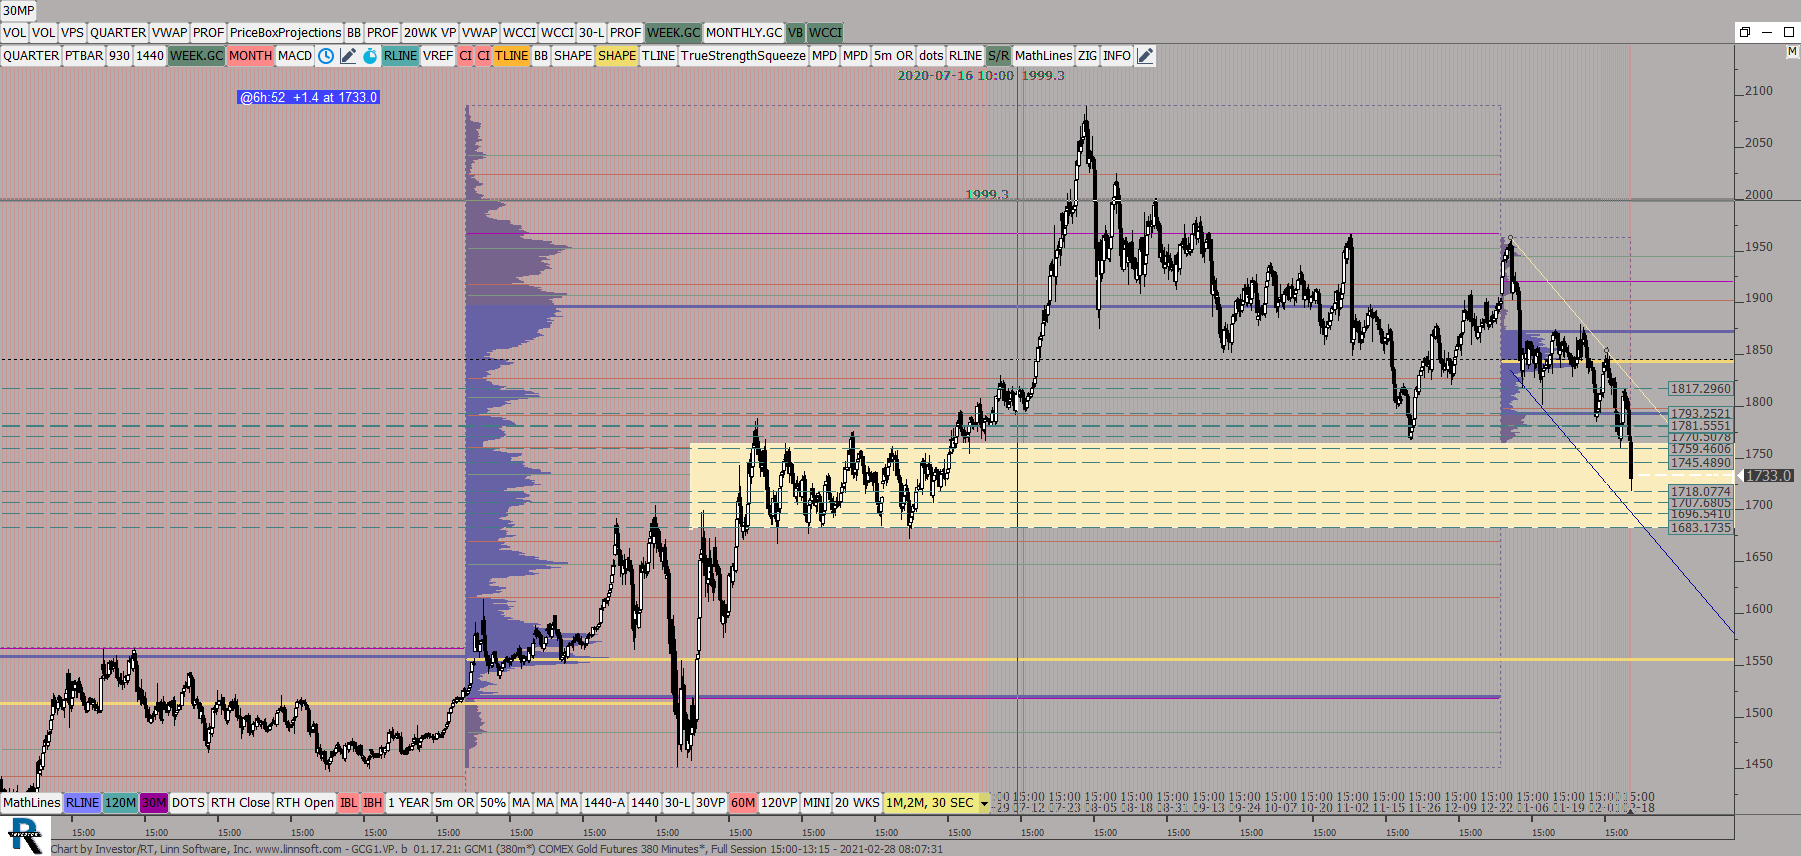 |
GCG1VP b (GCM1) ES42 [totalcount]
5 years 5 months ago
Yearly VP. 380 Min candles. This chart was uploaded by Investor/RT 14.2.5 showing symbol: GCM1. |
View |
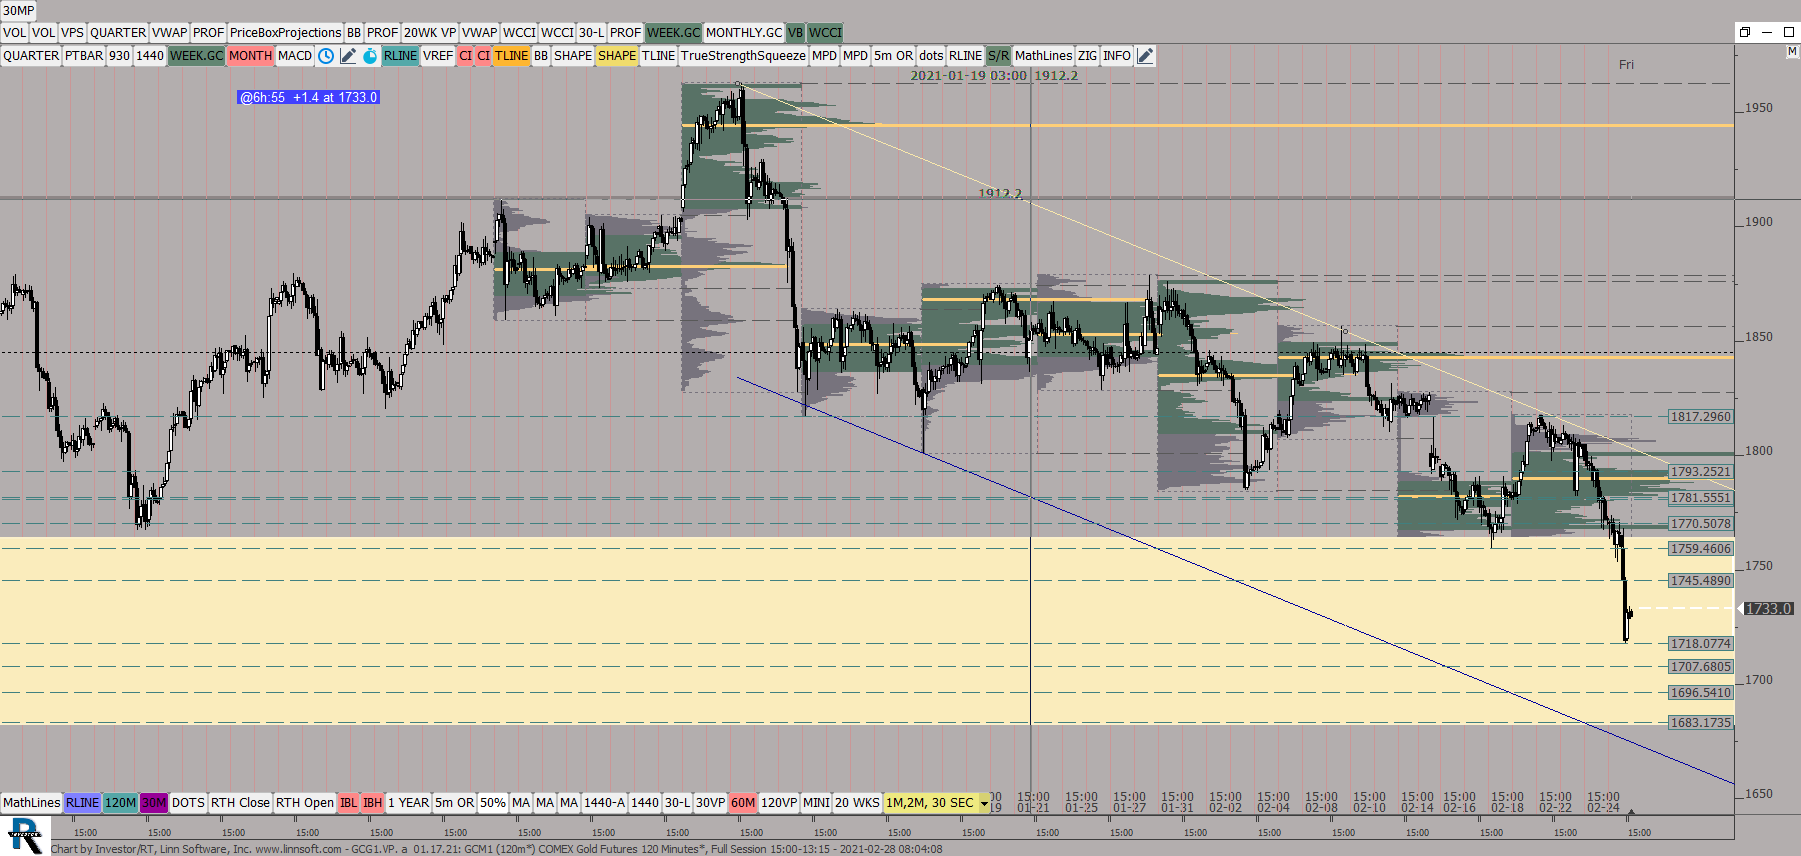 |
GCG1VP a (GCM1) ES42 [totalcount]
5 years 5 months ago
Weekly VP. DAILY candles. This chart was uploaded by Investor/RT 14.2.5 showing symbol: GCM1. |
View |
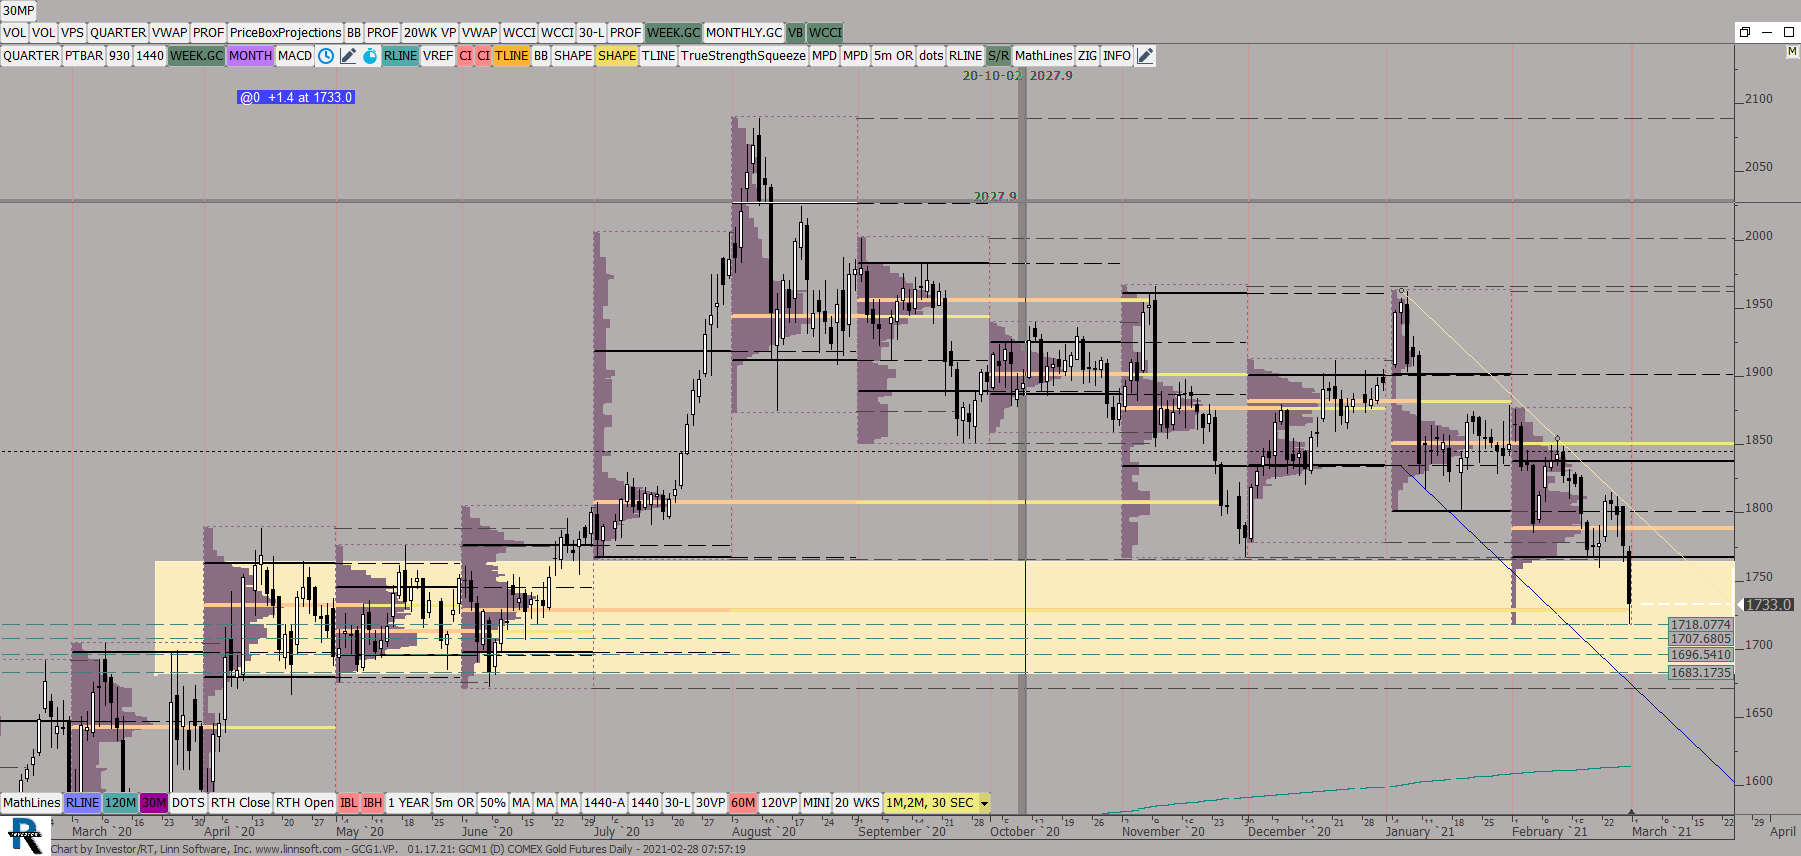 |
GCG1VP (GCM1) ES42 [totalcount]
5 years 5 months ago
Monthly VP. DAILY candles. This chart was uploaded by Investor/RT 14.2.5 showing symbol: GCM1. |
View |
 |
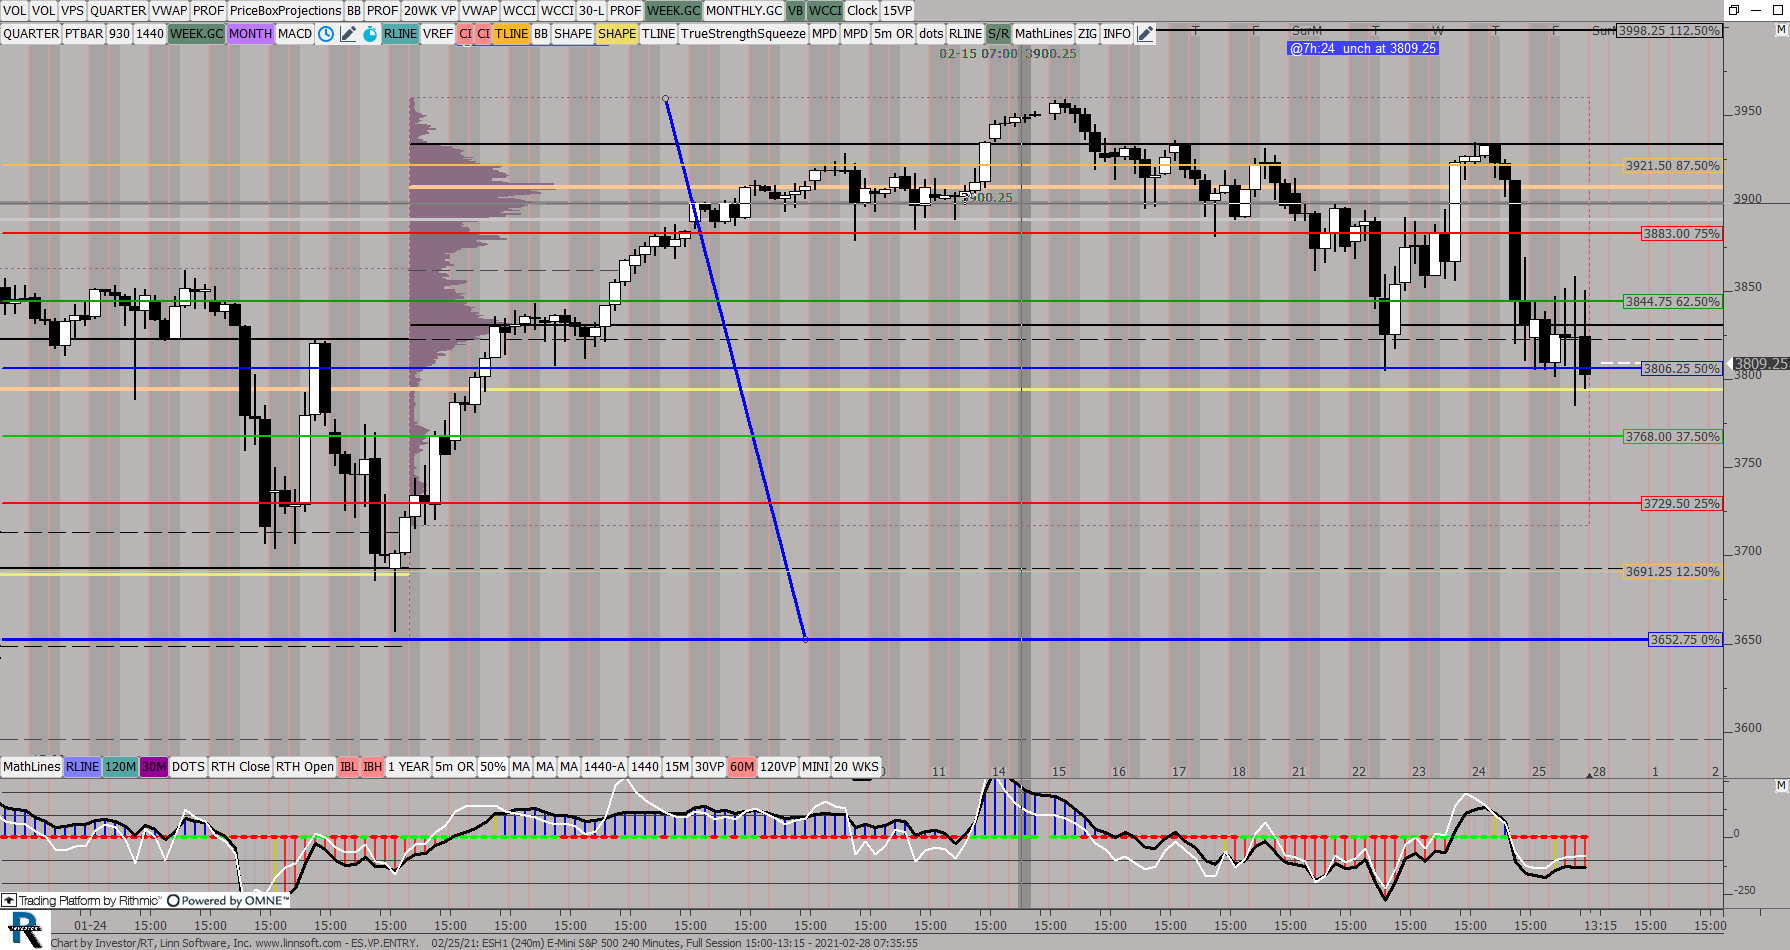
ESVPENTRYa 02 25 (ESH1) ES42 [totalcount]
5 years 5 months ago
Monthly VP. 240Min candles. This chart was uploaded by Investor/RT 14.2.5 showing symbol: ESH1. |
View |
 |
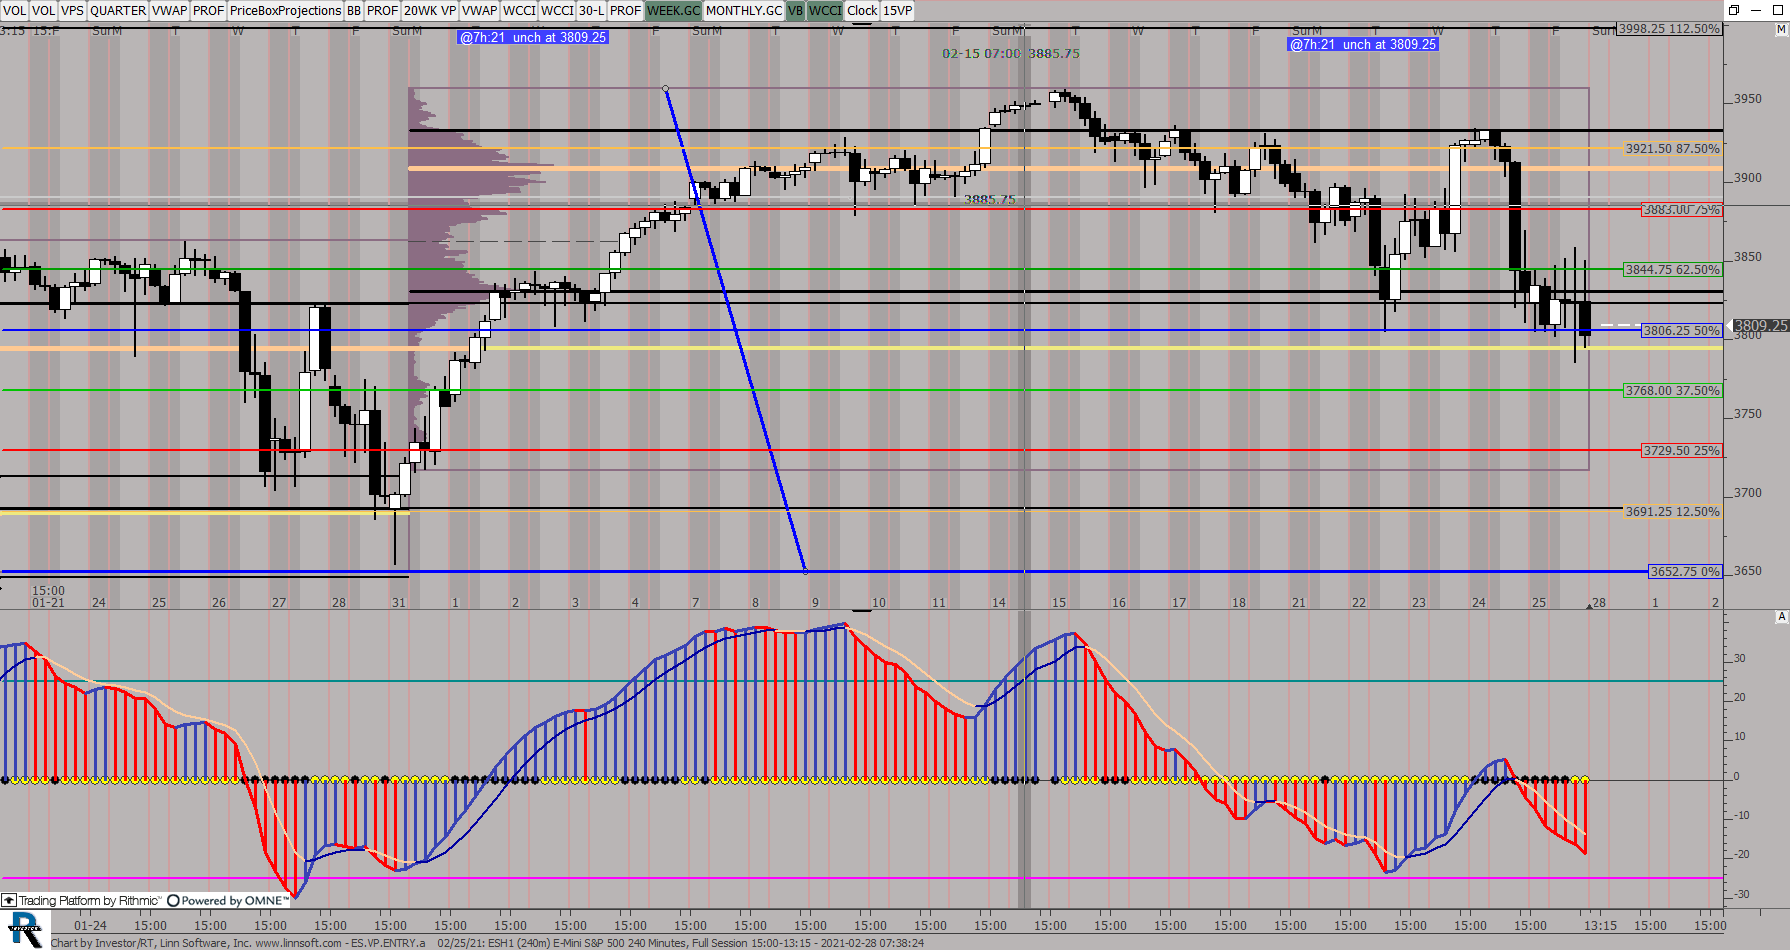
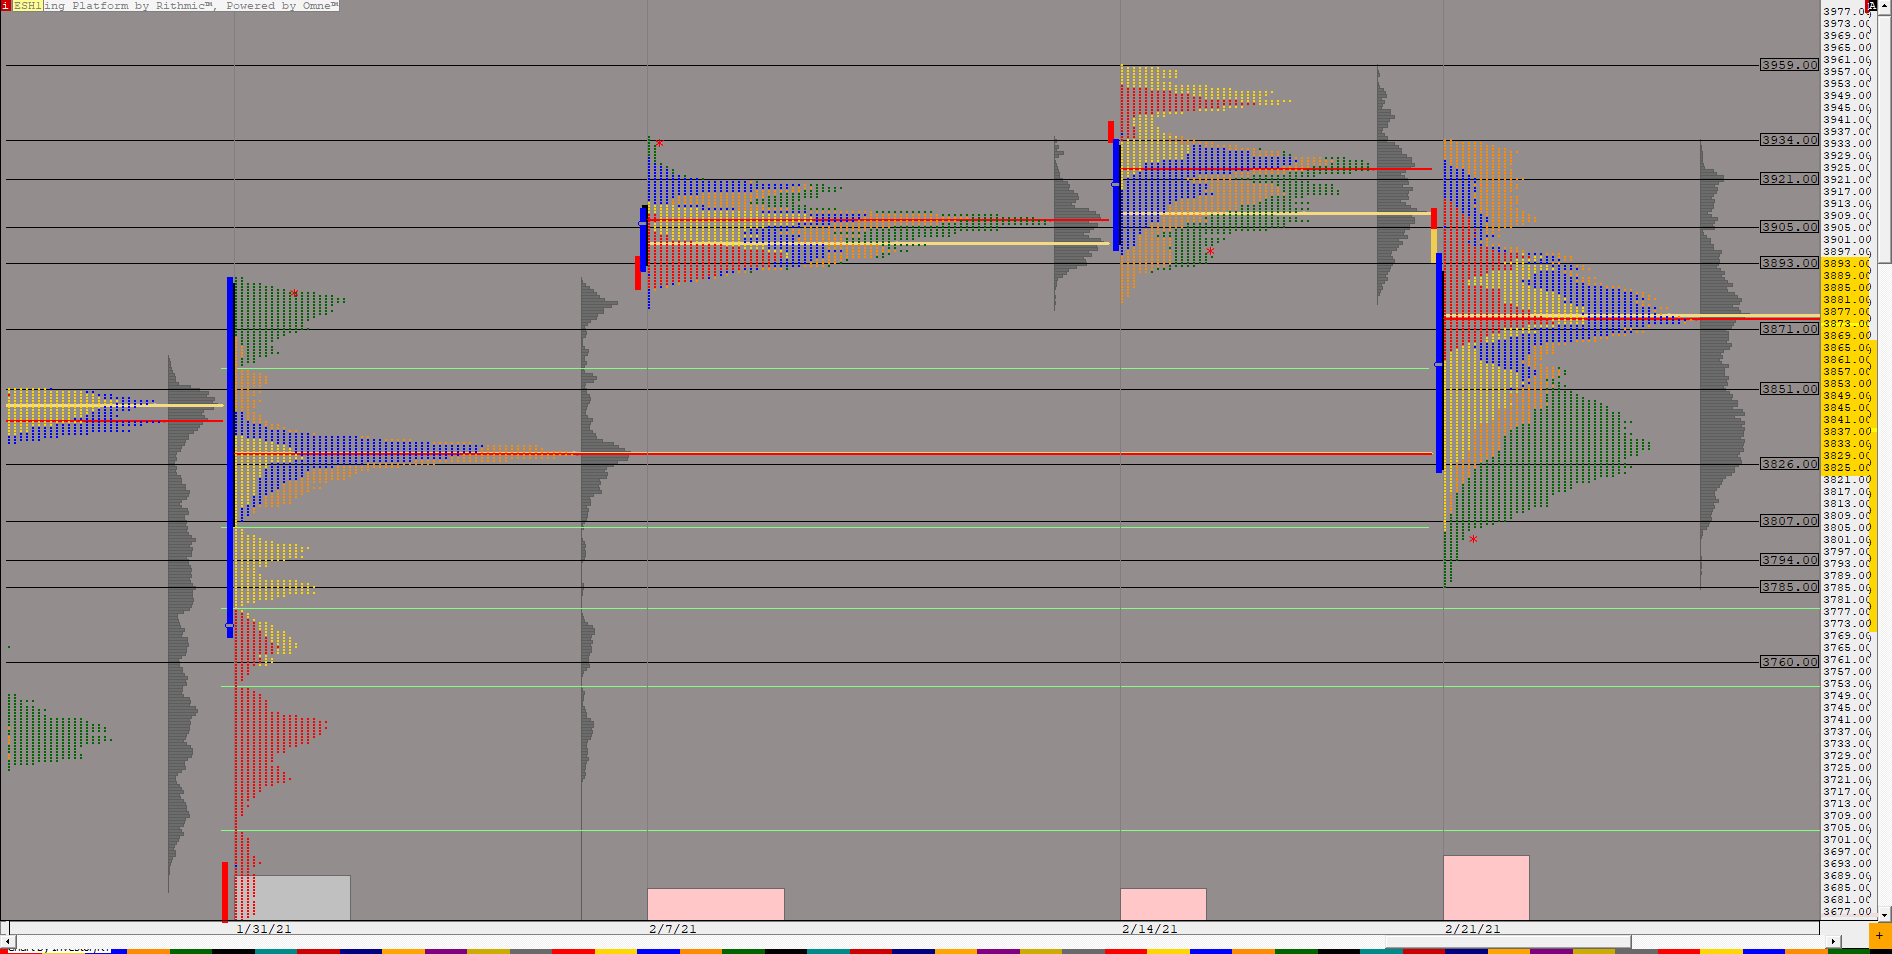
ESVPENTRY 02 25 (ESH1) ES42 [totalcount]
5 years 5 months ago
Monthly VP. 240Min candles. This chart was uploaded by Investor/RT 14.2.5 showing symbol: ESH1. |
View |
 |
TPOWeekly Rainbowc (ESH1) ES42 [totalcount]
5 years 5 months ago
Weekly Profile, 30 min candles. This chart was uploaded by Investor/RT 14.2.5 showing symbol: ESH1. |
View |
 |
TPOWeekly Rainbowb (ESH1) ES42 [totalcount]
5 years 5 months ago
Weekly Profile, 30 min candles. This chart was uploaded by Investor/RT 14.2.5 showing symbol: ESH1. |
View |
 |
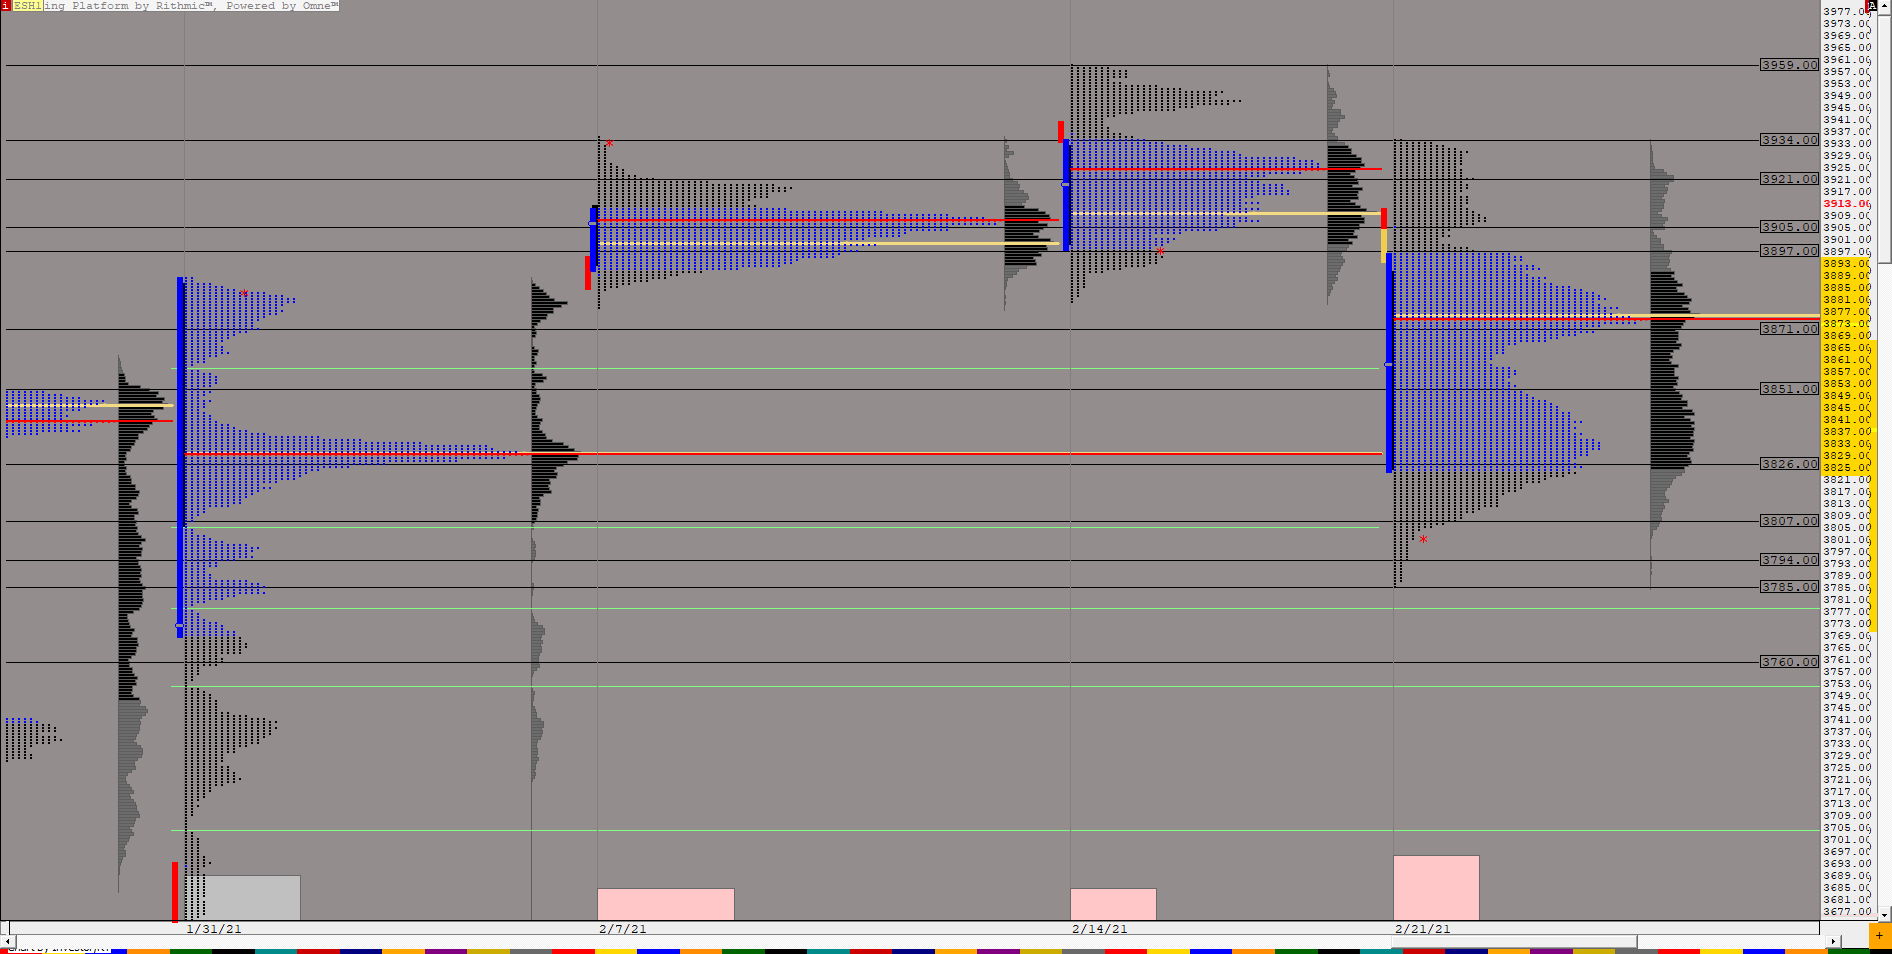
TPOWeekly Rainbow a (ESH1) ES42 [totalcount]
5 years 5 months ago
Weekly Profile, 30 min candles. This chart was uploaded by Investor/RT 14.2.5 showing symbol: ESH1. |
View |
 |
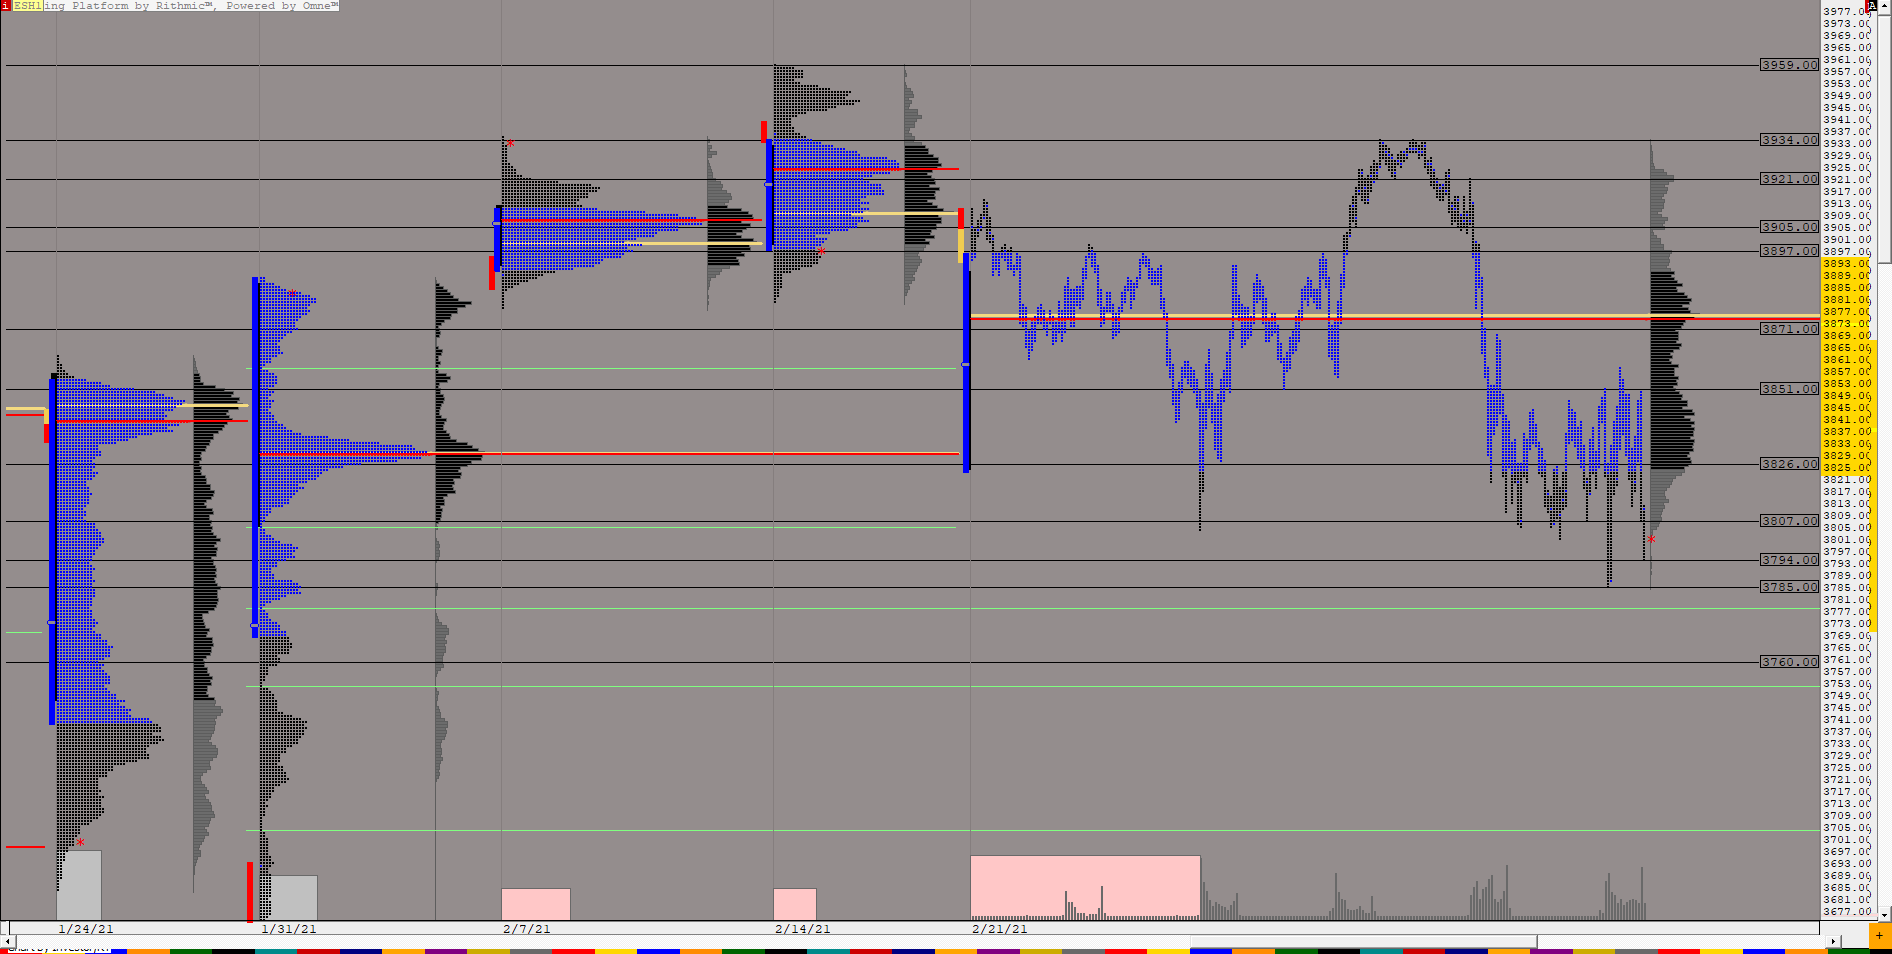
TPOWeekly Rainbow (ESH1) ES42 [totalcount]
5 years 5 months ago
Weekly Profile, 30 min candles. This chart was uploaded by Investor/RT 14.2.5 showing symbol: ESH1. |
View |
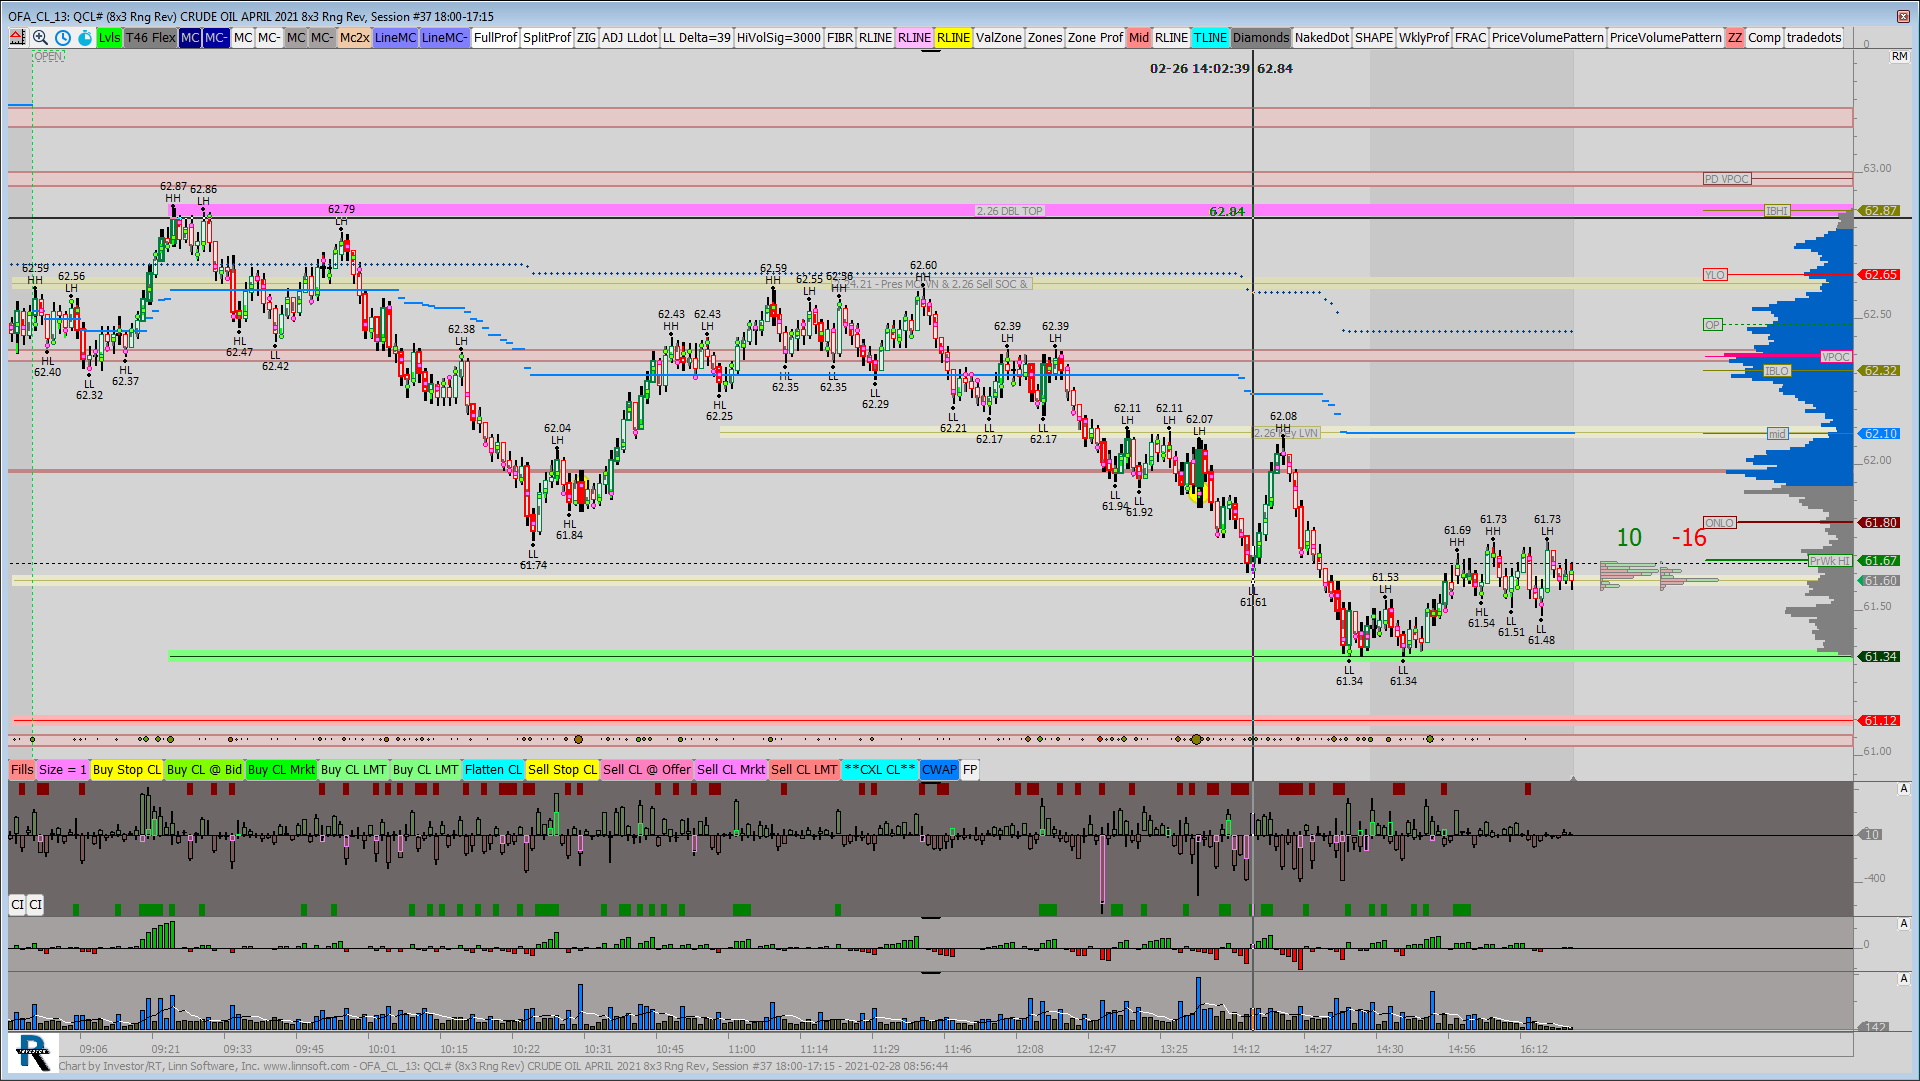 |
OFA CL (QCL#) jayski51369 [totalcount]
5 years 5 months ago
This chart was uploaded by Investor/RT 12.5.9 showing symbol: QCL#. |
View |
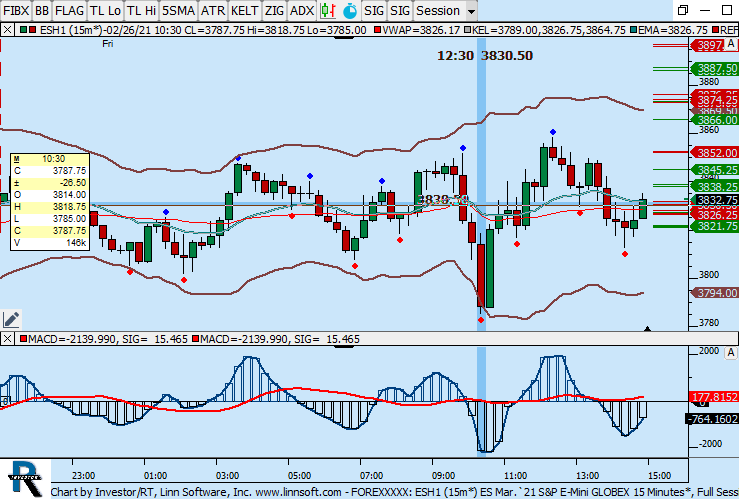 |
FOREXXXXX (ESH1) boris-libman [totalcount]
5 years 5 months ago
This chart was uploaded by Investor/RT 14.2.5 showing symbol: ESH1. |
View |
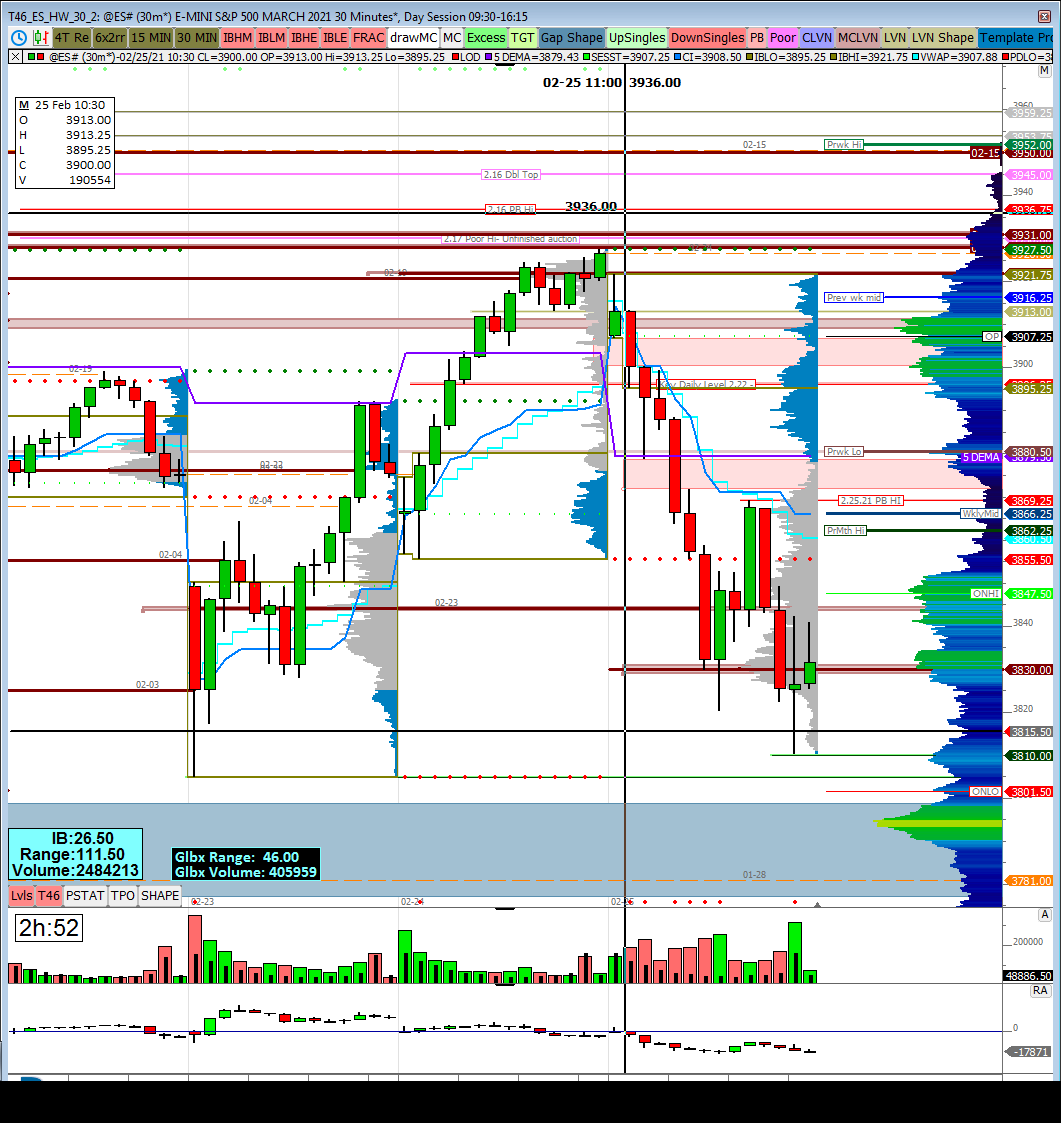 |
T46 ES HW 30 (@ES#) jayski51369 [totalcount]
5 years 5 months ago
This chart was uploaded by Investor/RT 13.7.10 showing symbol: @ES#. |
View |
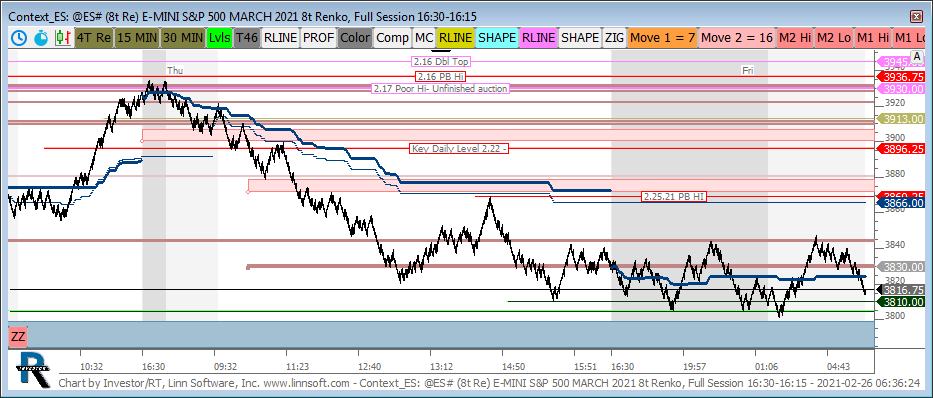 |
Context ES (@ES#) jayski51369 [totalcount]
5 years 5 months ago
This chart was uploaded by Investor/RT 13.6.3 showing symbol: @ES#. |
View |
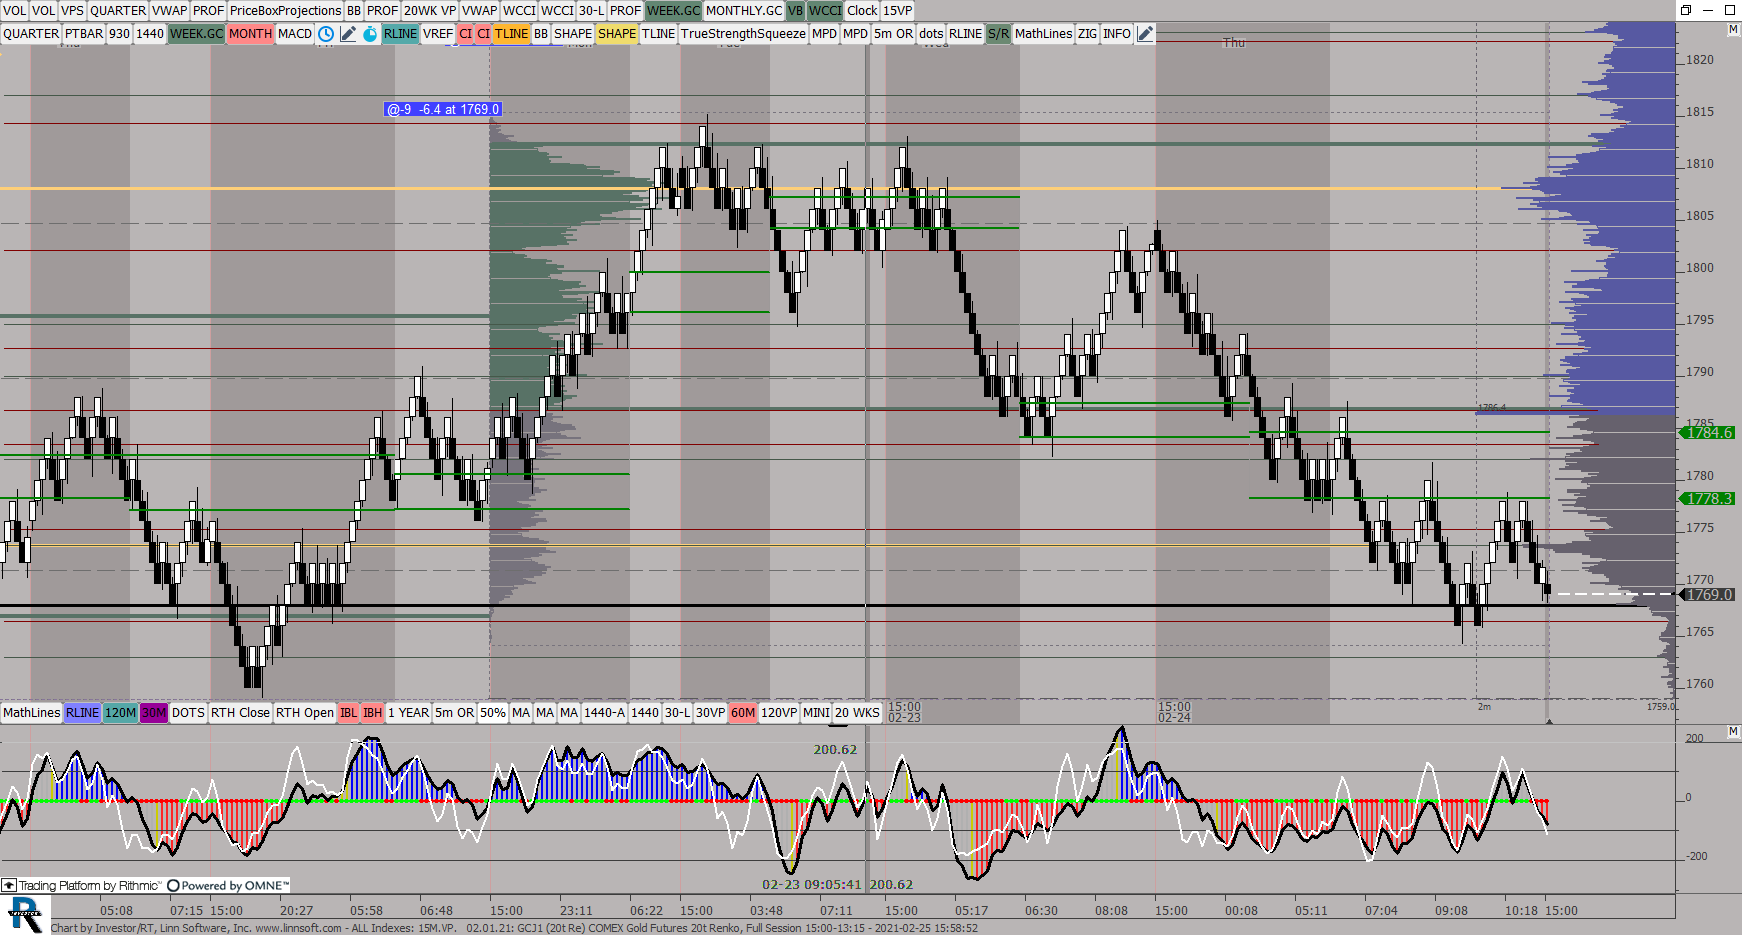 |
ALL Indexes 15MVP (GCJ1) ES42 [totalcount]
5 years 5 months ago
This chart was uploaded by Investor/RT 14.2.5 showing symbol: GCJ1. |
View |
 |
NQ DUPE (NQH1) ES42 [totalcount]
5 years 5 months ago
This chart was uploaded by Investor/RT 14.2.5 showing symbol: NQH1. |
View |
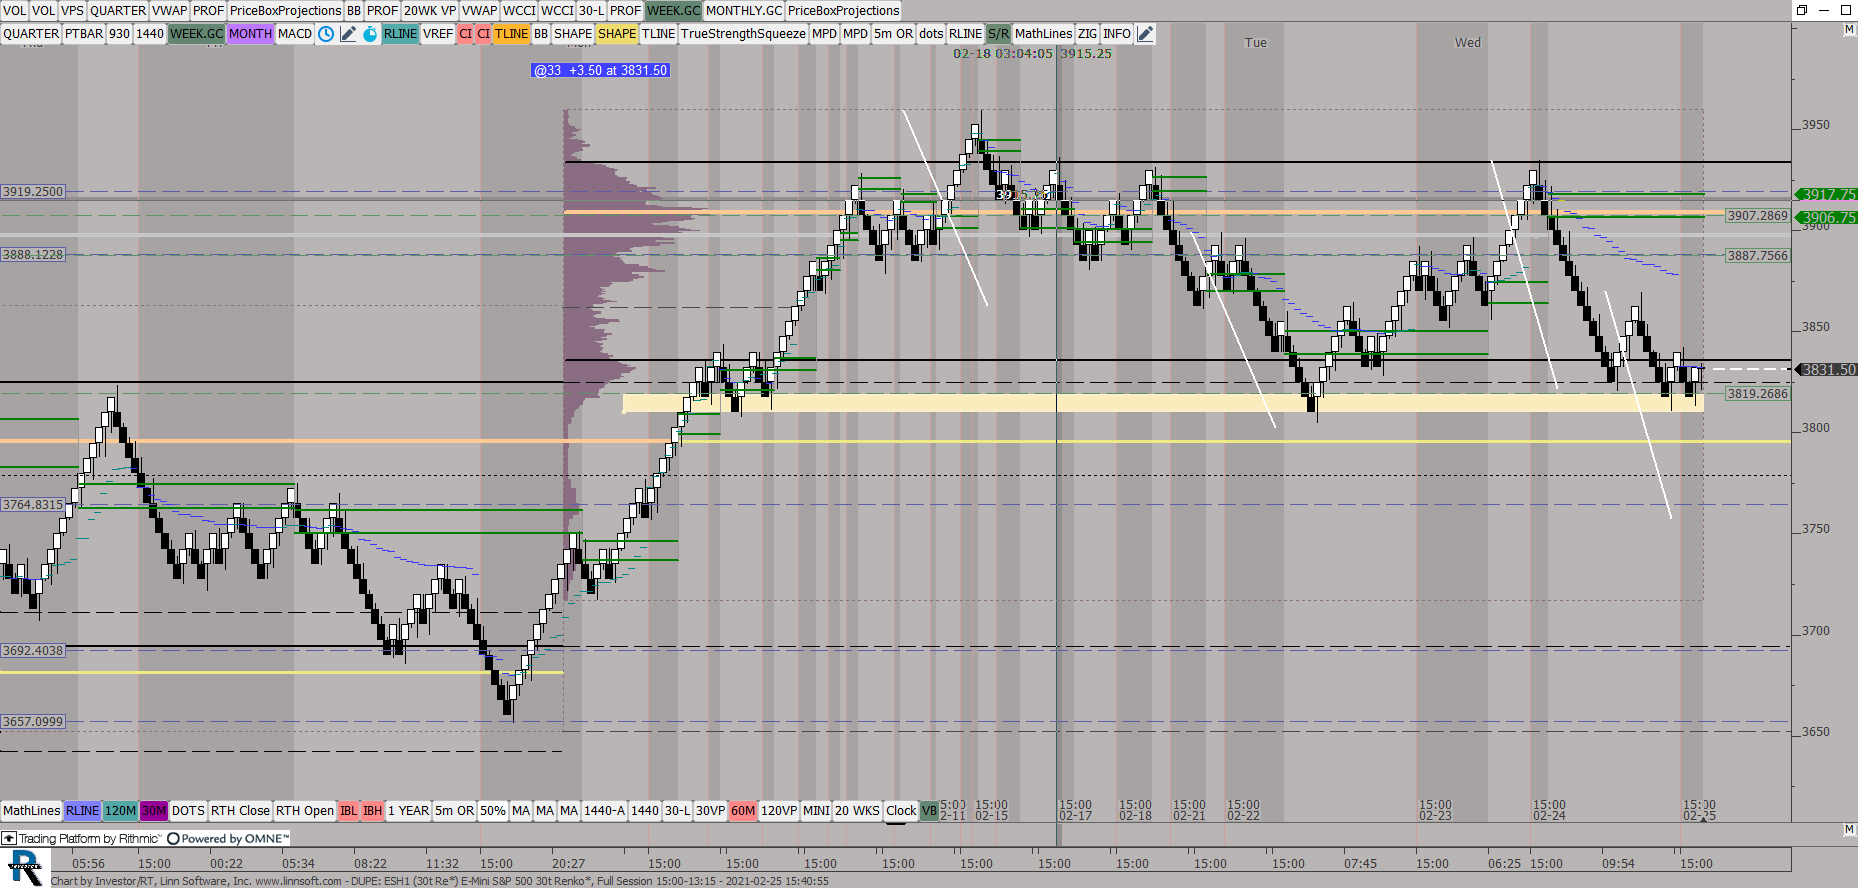 |
DUPE (ESH1) ES42 [totalcount]
5 years 5 months ago
This chart was uploaded by Investor/RT 14.2.5 showing symbol: ESH1. |
View |
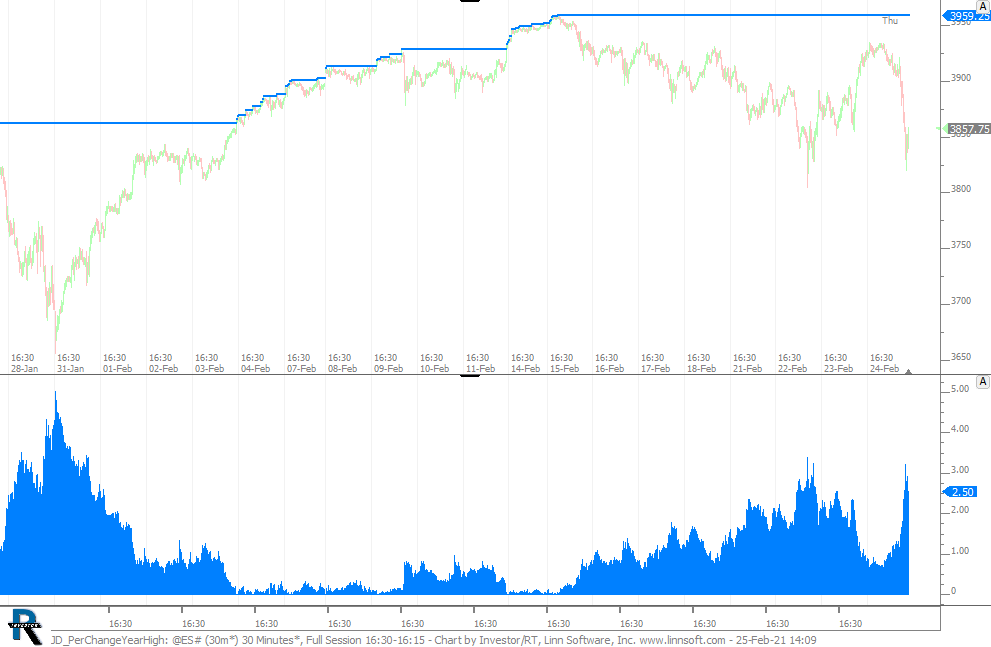 |
JD PerChangeYearHigh (@ES#) cpayne [totalcount]
5 years 5 months ago
Percent Change from Yearly High. This chart was uploaded by Investor/RT 14.2.6 showing symbol: @ES#. |
View |
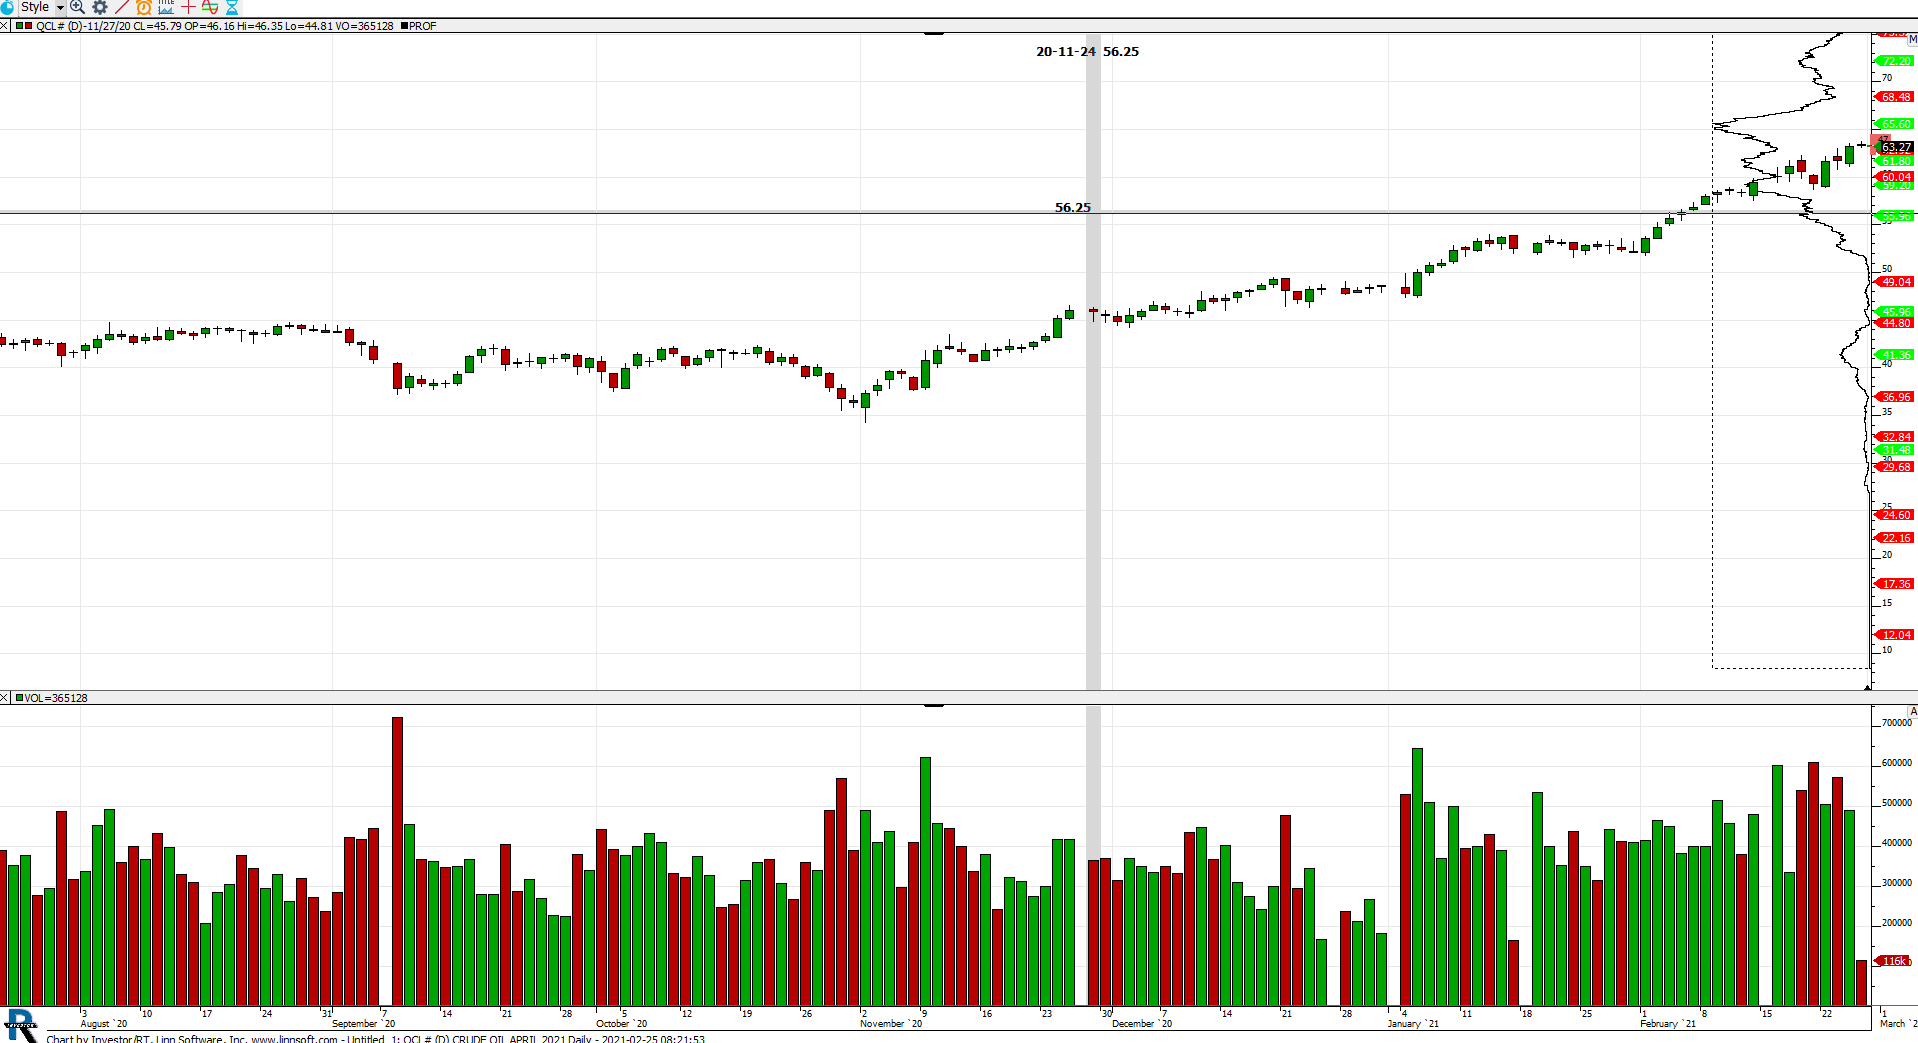 |
Untitled (QCL#) 3 npettinato [totalcount]
5 years 5 months ago
This chart was uploaded by Investor/RT 14.2.5 showing symbol: QCL#. |
View |
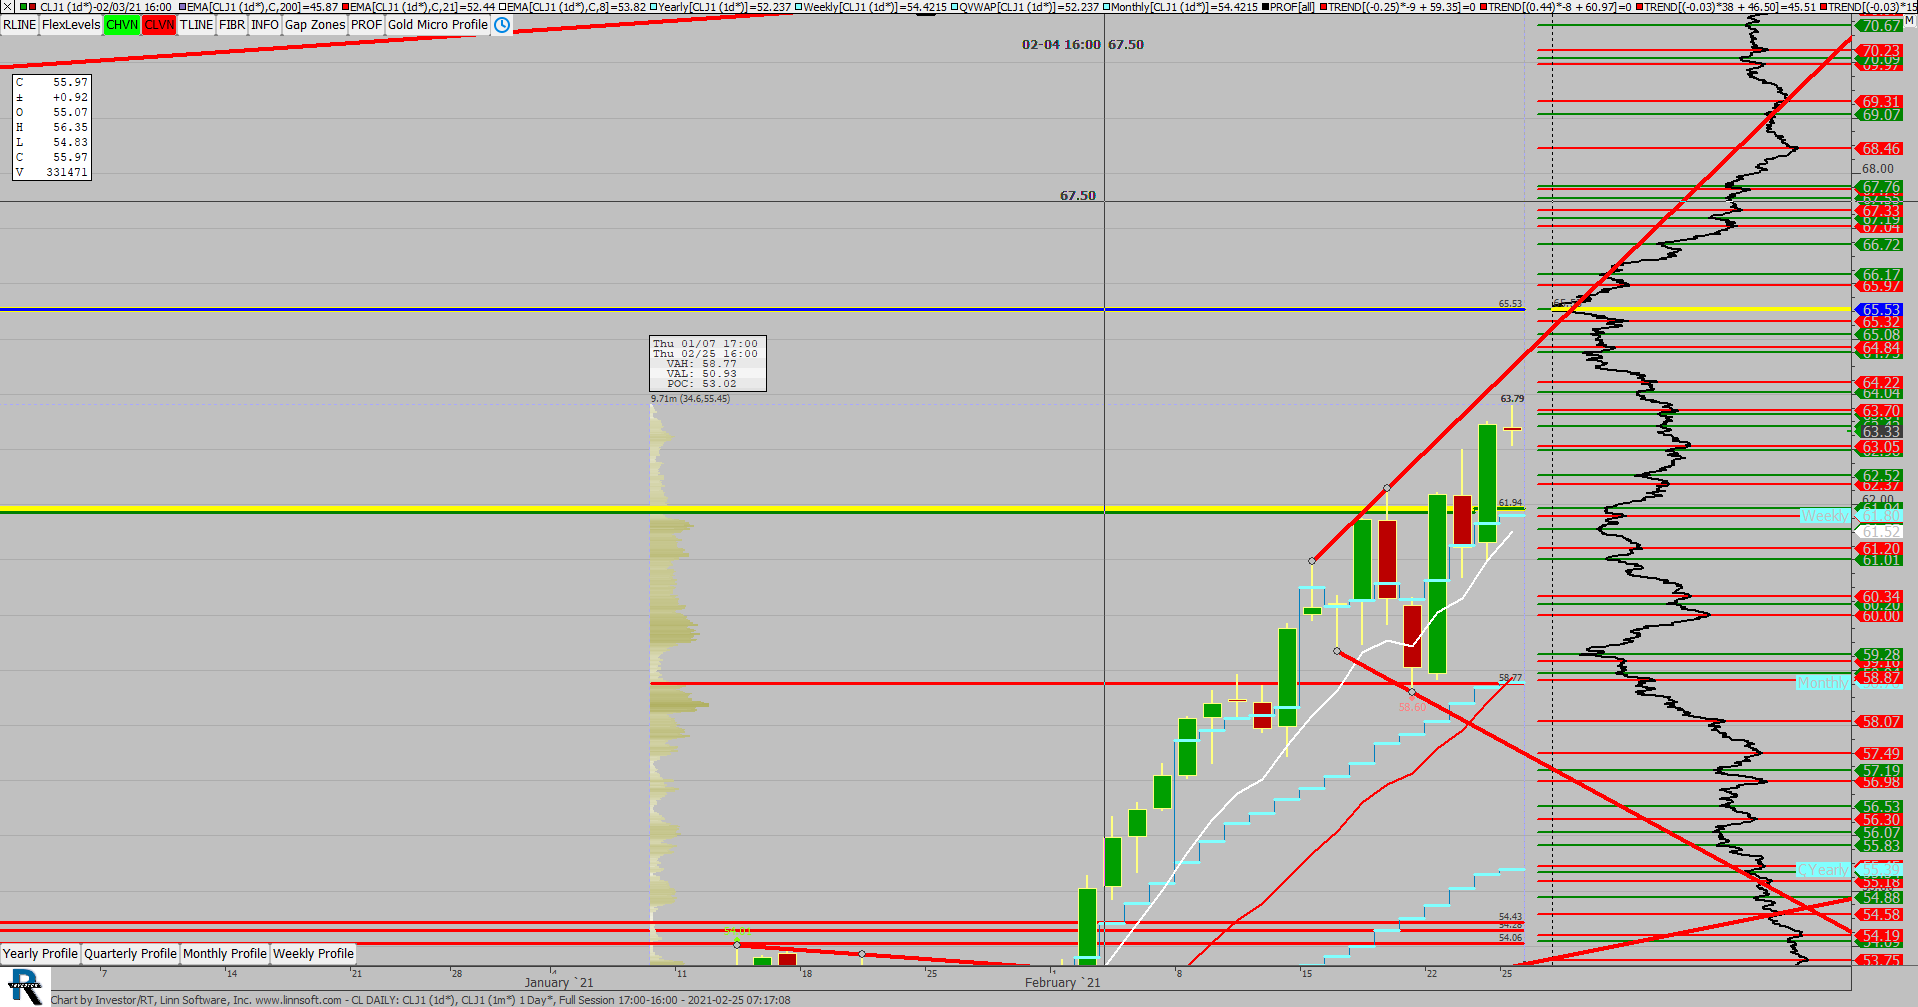 |
CL DAILY (CLJ1) scottz46 [totalcount]
5 years 5 months ago
This chart was uploaded by Investor/RT 14.2.5 showing symbol: CLJ1. |
View |