 |
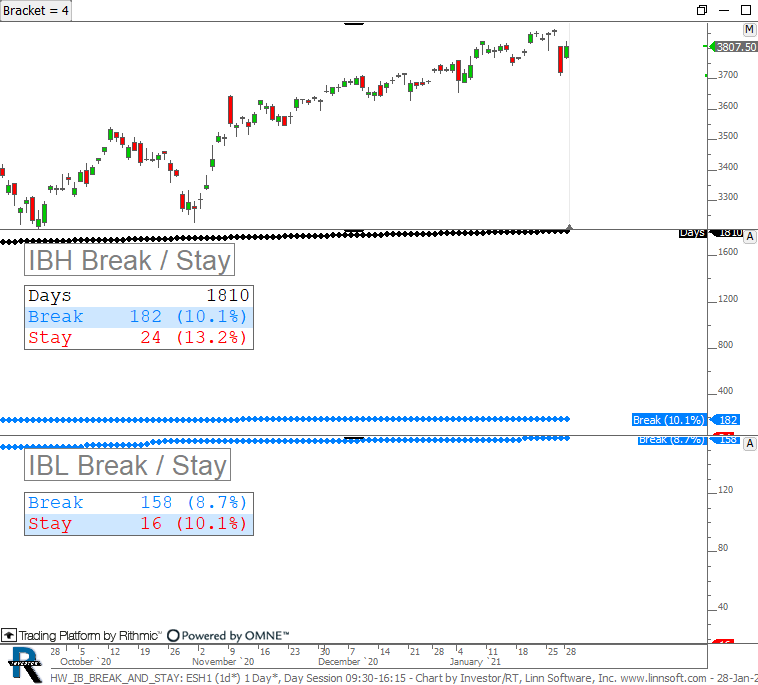
HW IB BREAK AND STAY (ESH1) cpayne [totalcount]
5 years 6 months ago
Chart shows how many days price first broke above the IBH during each bracket and how often it stayed above the IBH for the rest of the brackets. |
View |
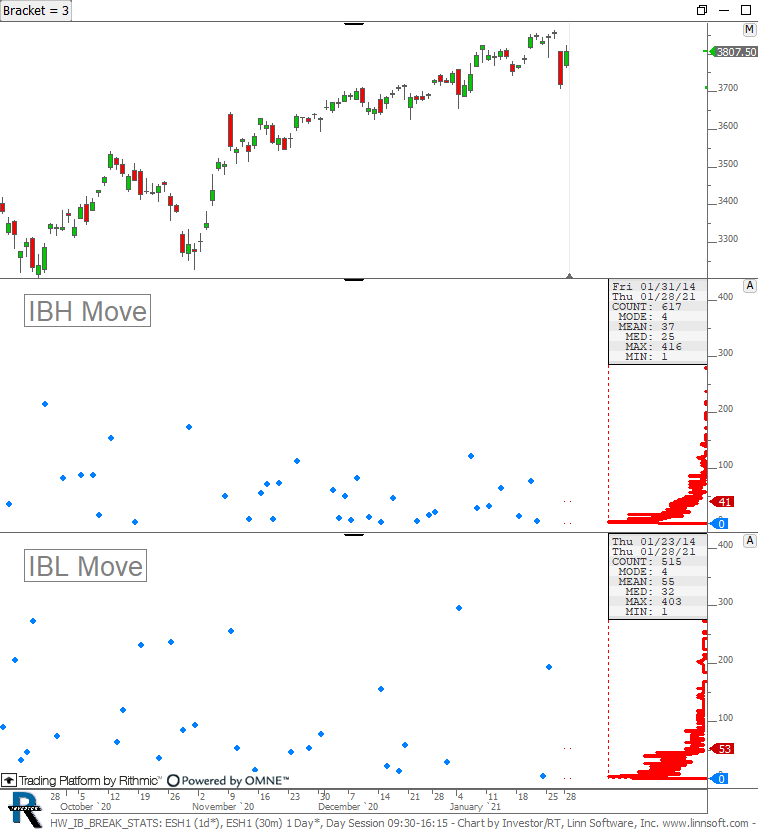 |
HW IB BREAK STATS (ESH1) cpayne [totalcount]
5 years 6 months ago
Chart plots the max moves that occur beyond IBH and IBL when price breaks the IBH and IBL during each bracket. Use button at top to adjust bracket (3 for C, 4 for D, etc). |
View |
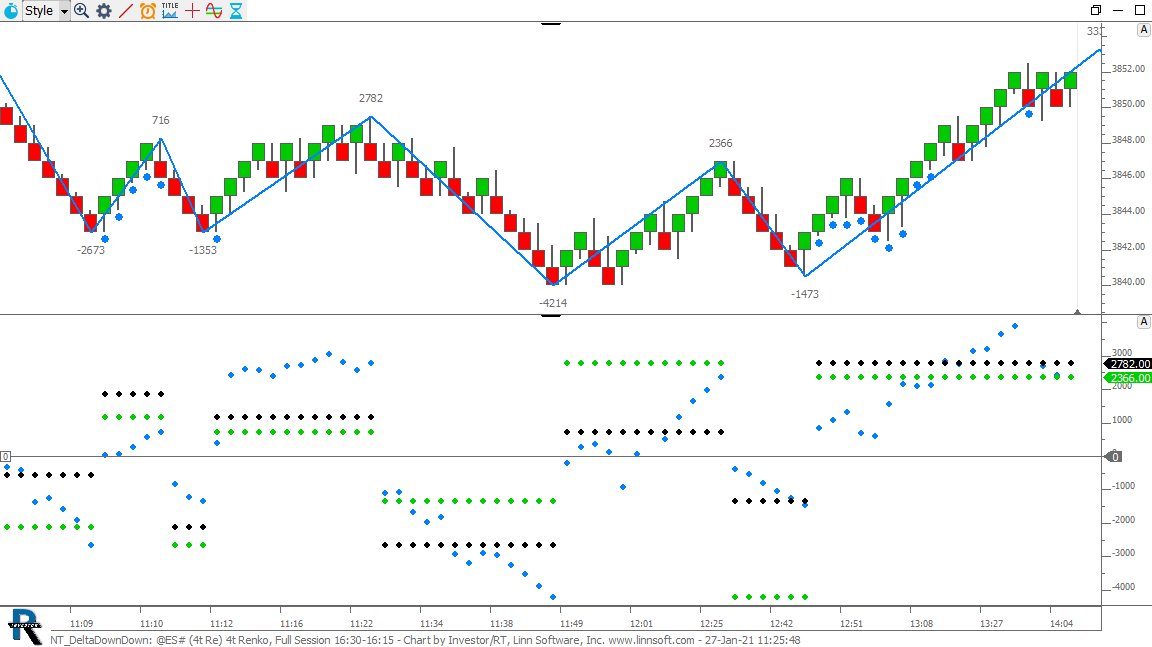 |
NT DeltaDownDown (@ES#) cpayne [totalcount]
5 years 6 months ago
This chart was uploaded by Investor/RT 14.2.6 showing symbol: @ES#. |
View |
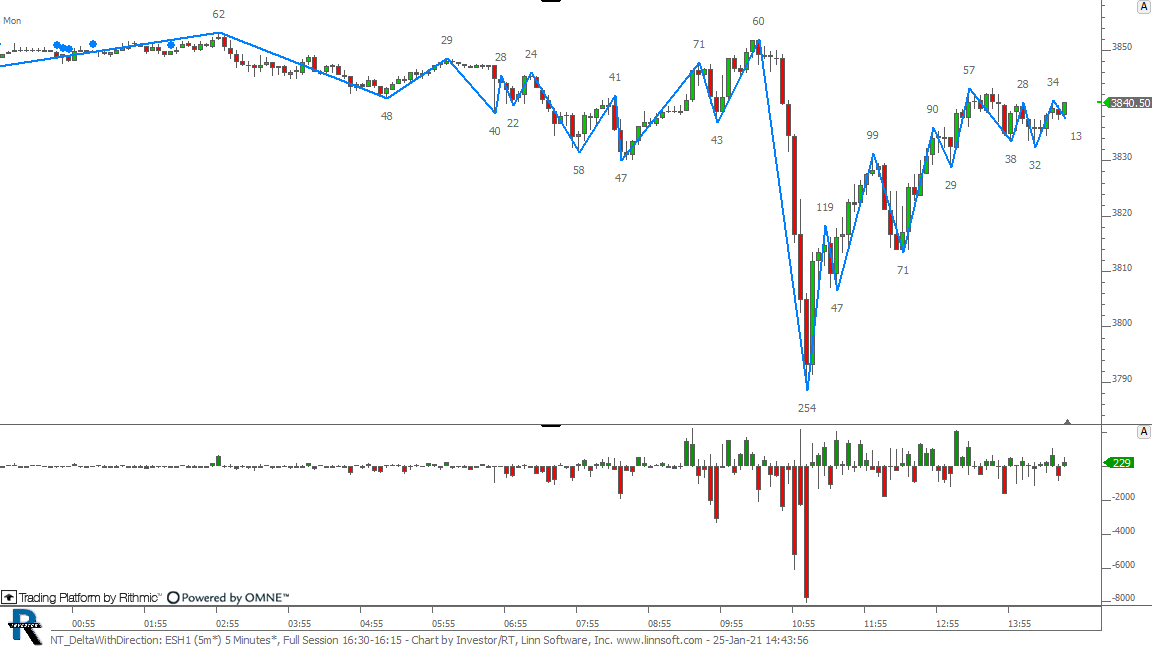 |
NT DeltaWithDirection (ESH1) cpayne [totalcount]
5 years 6 months ago
This chart was uploaded by Investor/RT 14.2.6 showing symbol: ESH1. |
View |
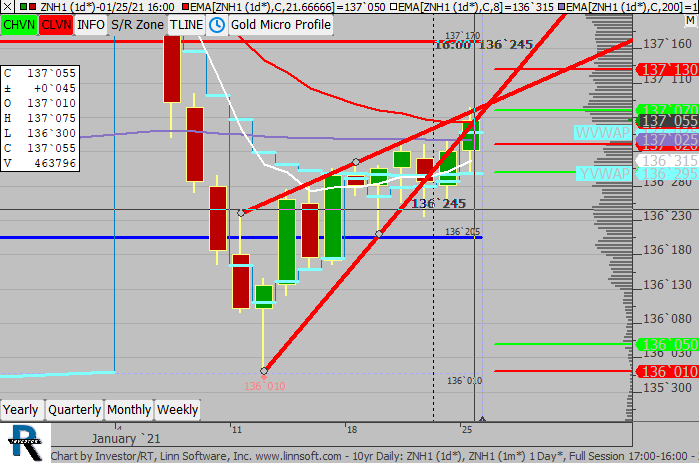 |
10yr Daily (ZNH1) scottz46 [totalcount]
5 years 6 months ago
This chart was uploaded by Investor/RT 14.2.5 showing symbol: ZNH1. |
View |
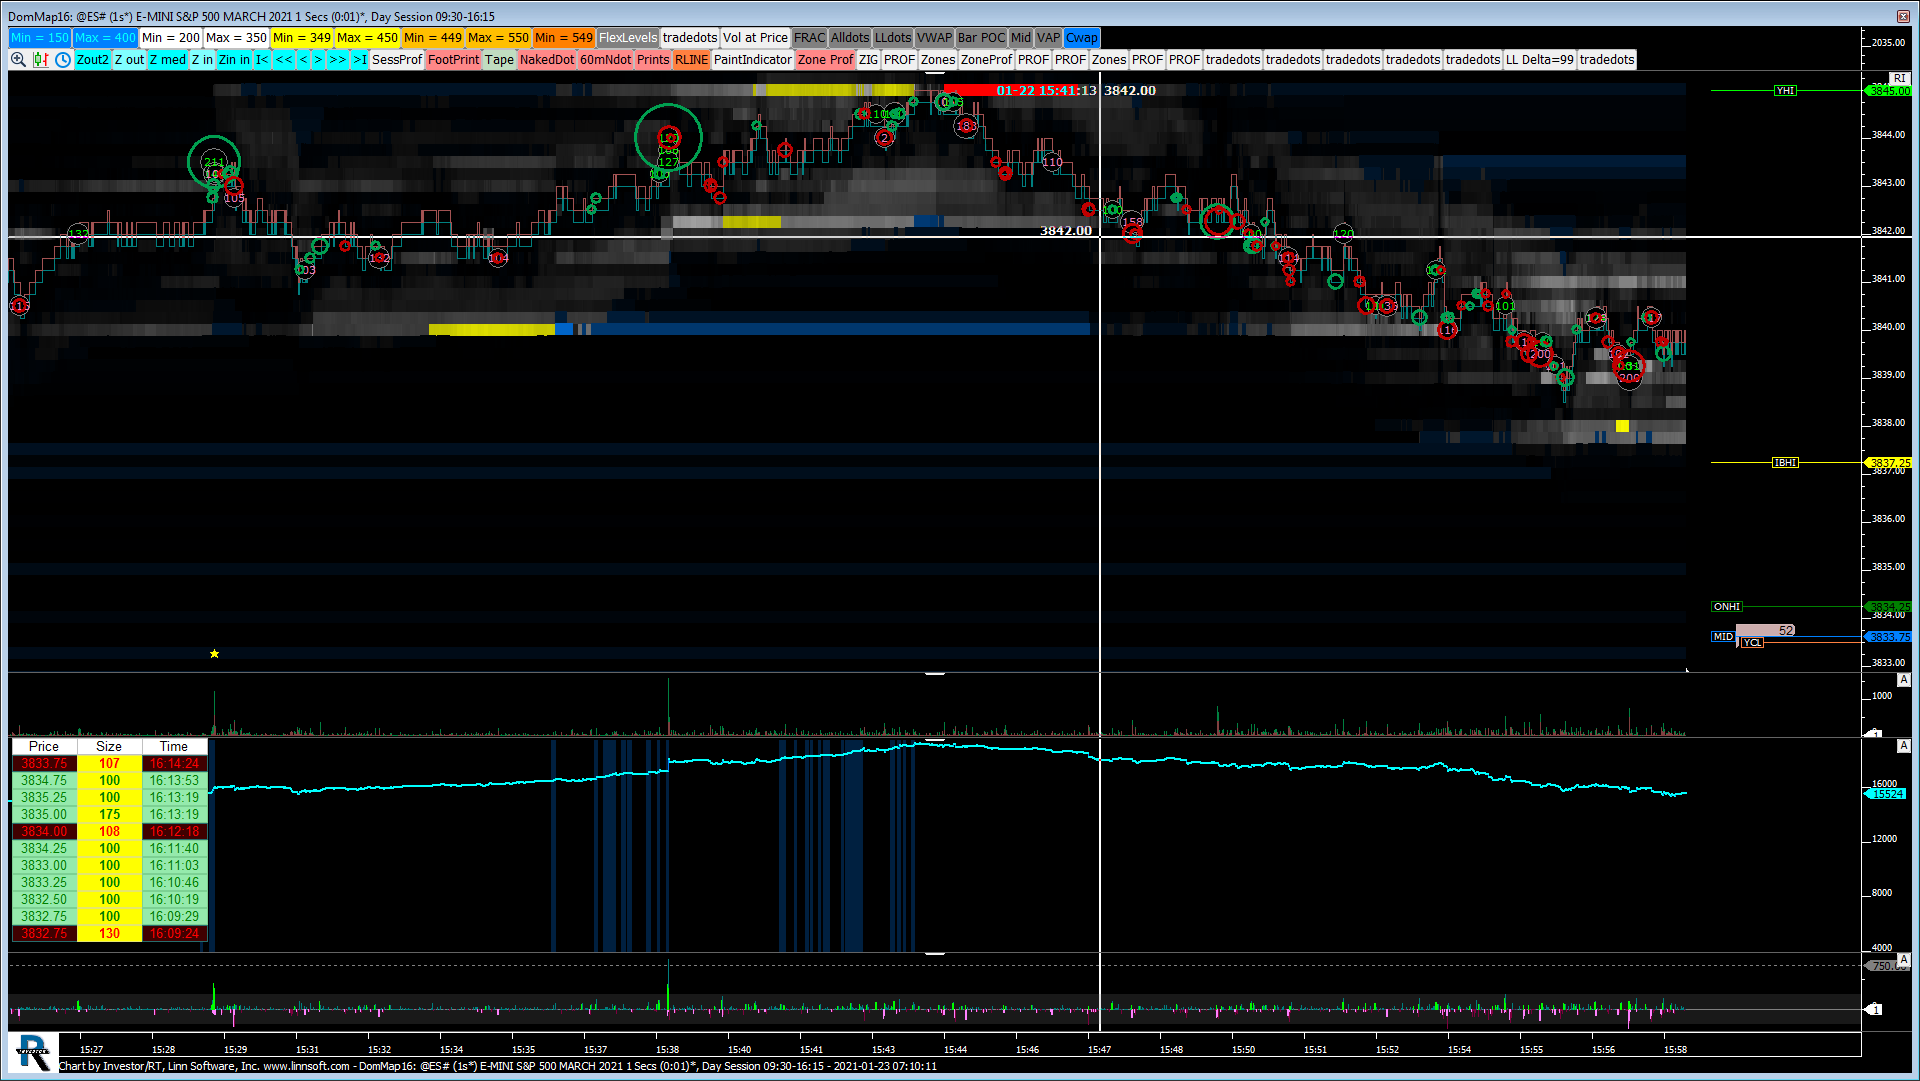 |
DomMap (@ES#) jayski51369 [totalcount]
5 years 6 months ago
This chart was uploaded by Investor/RT 13.2.3 showing symbol: @ES#. |
View |
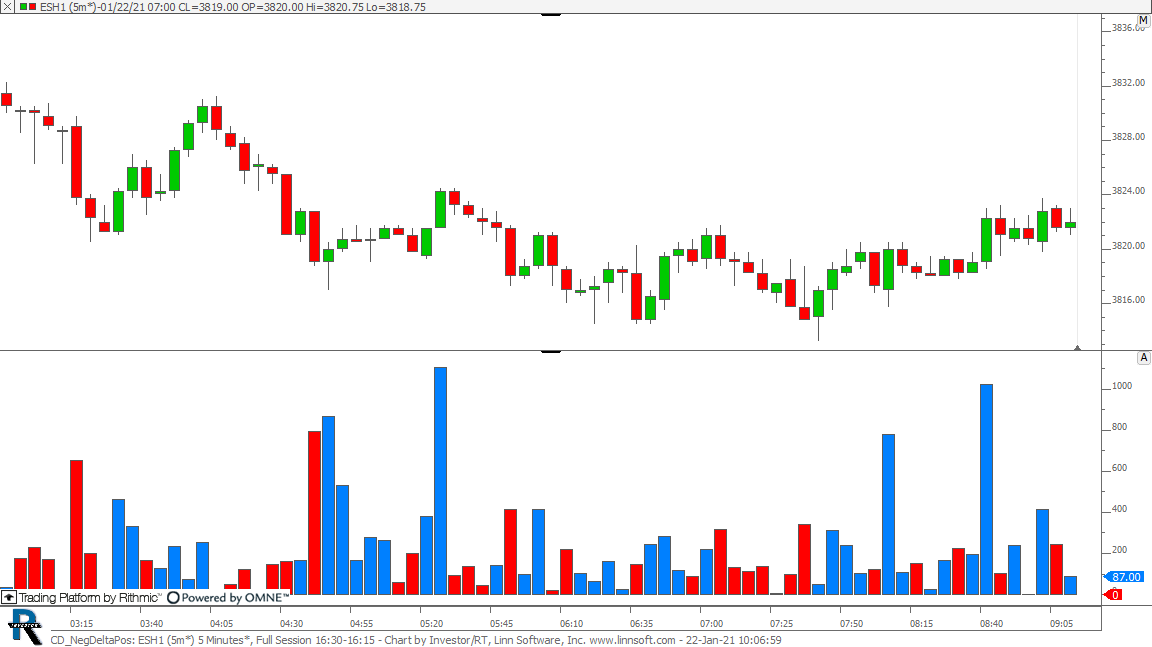 |
CD NegDeltaPos (ESH1) cpayne [totalcount]
5 years 6 months ago
This chart was uploaded by Investor/RT 14.2.6 showing symbol: ESH1. |
View |
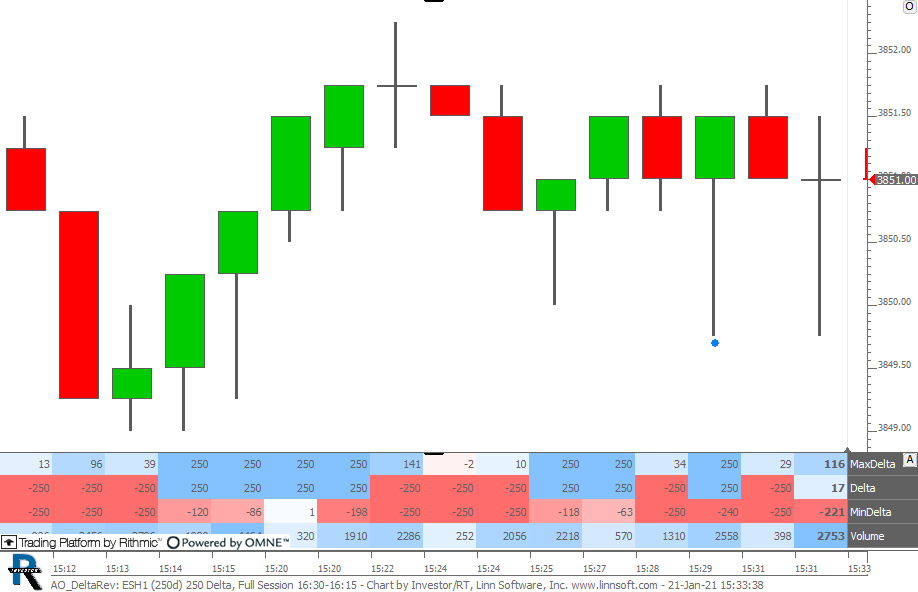 |
AO DeltaRev (ESH1) cpayne [totalcount]
5 years 6 months ago
This chart was uploaded by Investor/RT 14.2.6 showing symbol: ESH1. |
View |
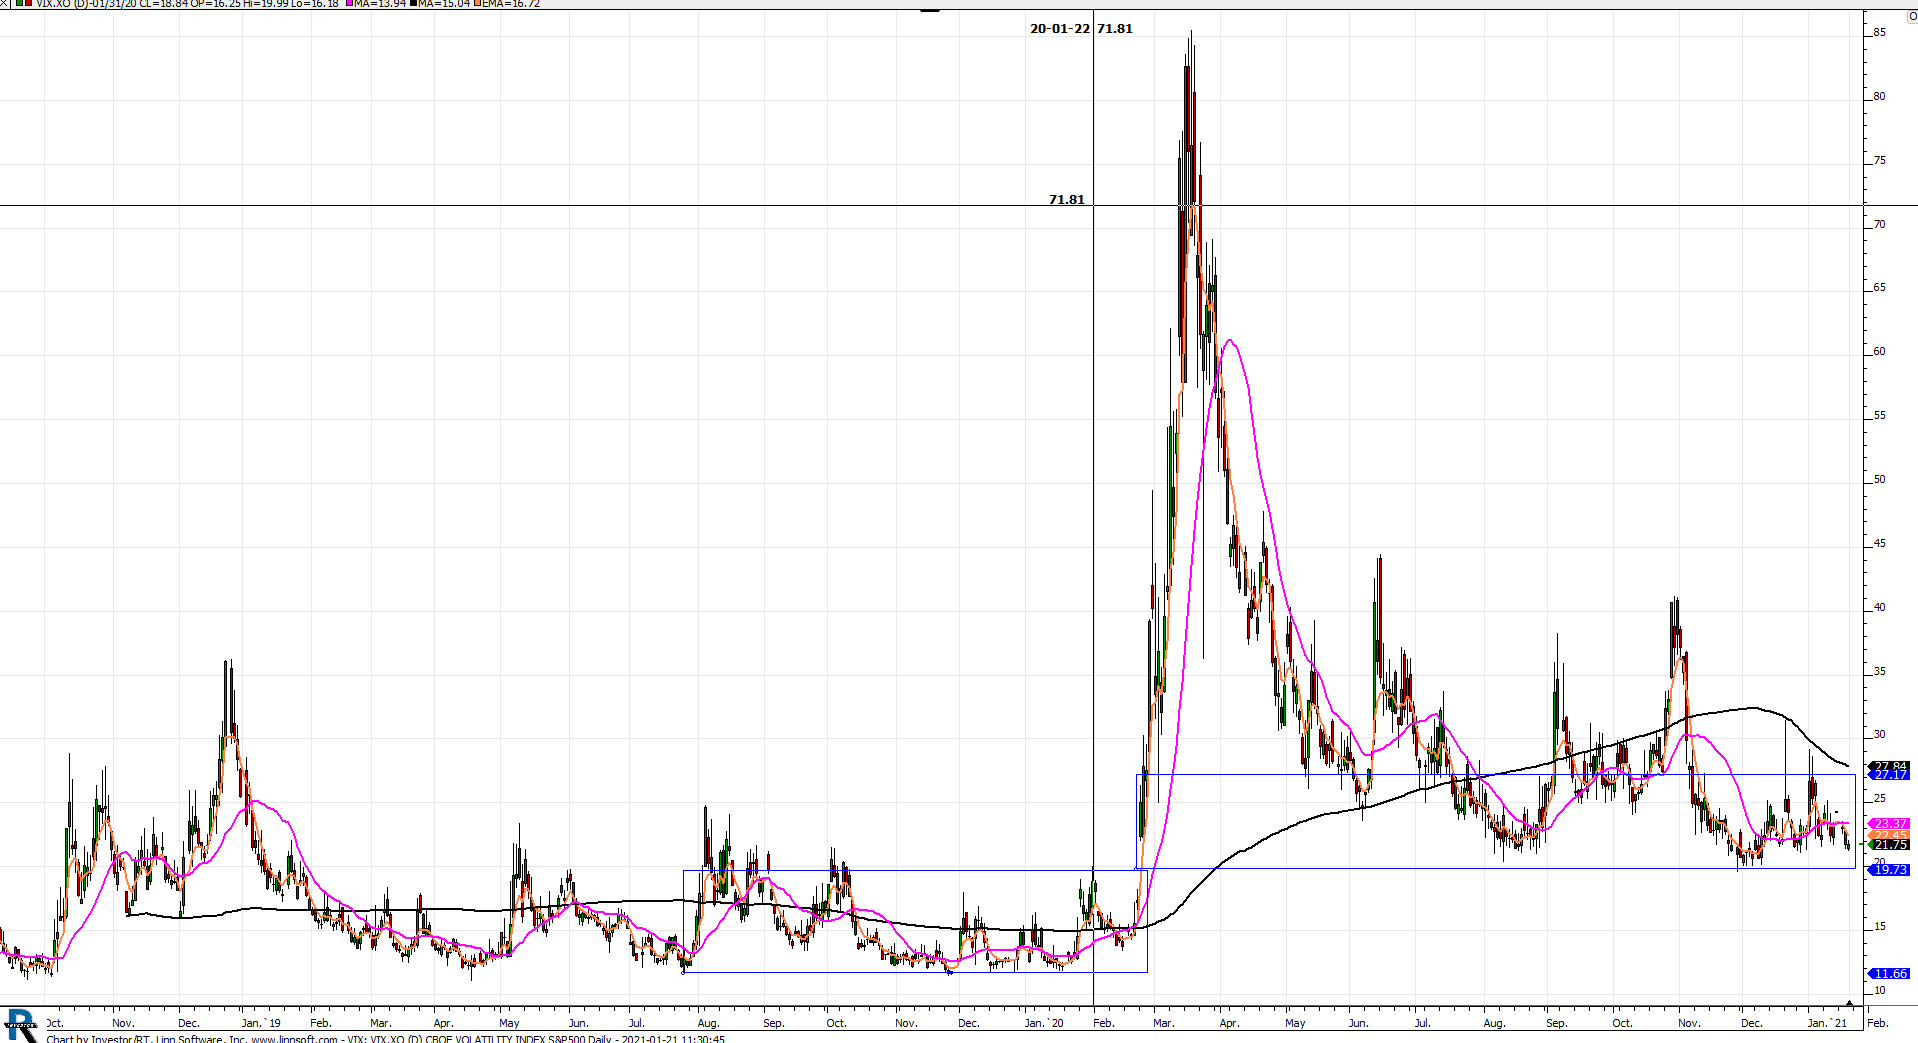 |
VIX (VIX.XO) npettinato [totalcount]
5 years 6 months ago
This chart was uploaded by Investor/RT 14.2.5 showing symbol: VIX.XO. |
View |
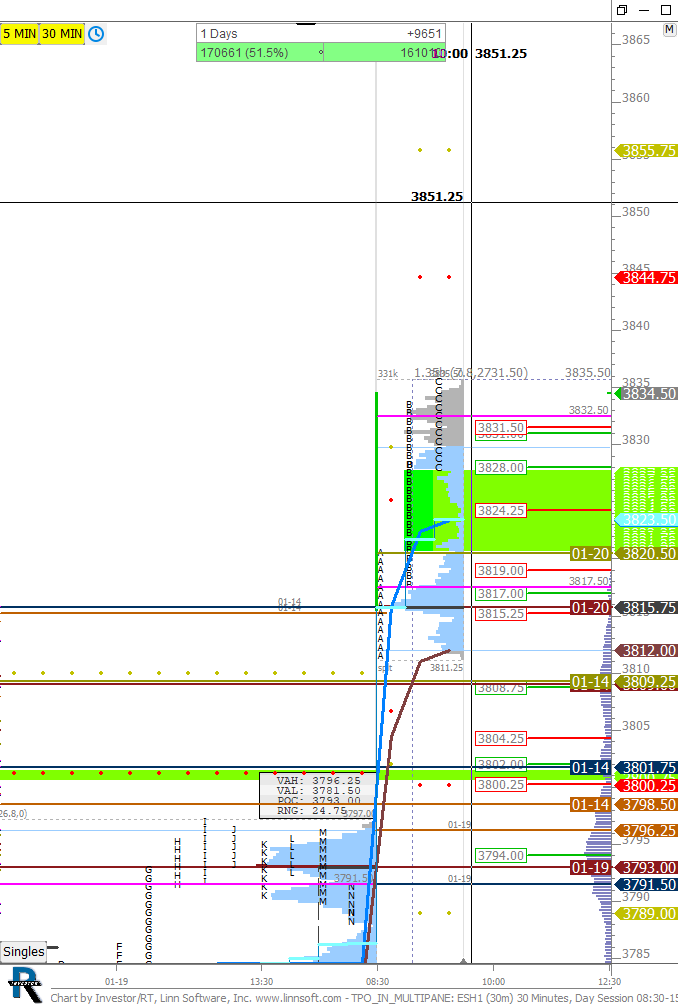 |
TPO IN MULTIPANE (ESH1) scottz46 [totalcount]
5 years 6 months ago
This chart was uploaded by Investor/RT 14.2.5 showing symbol: ESH1. |
View |
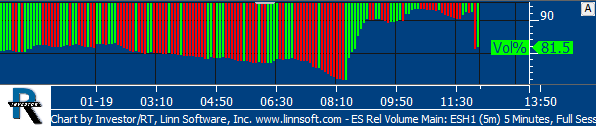 |
ES Rel Volume Main (ESH1) scottz46 [totalcount]
5 years 6 months ago
This chart was uploaded by Investor/RT 14.2.5 showing symbol: ESH1. |
View |
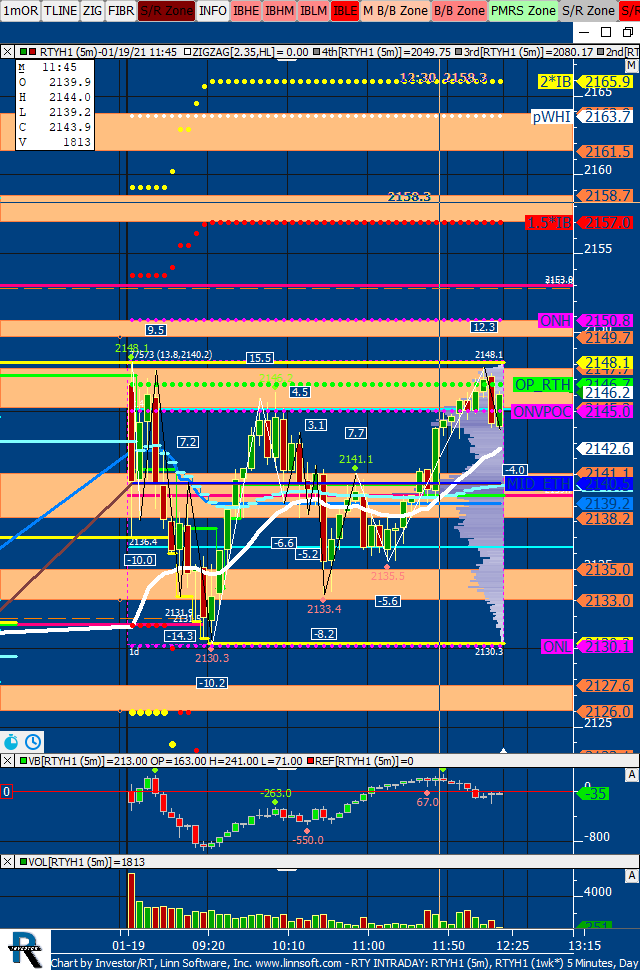 |
RTY INTRADAY (RTYH1) scottz46 [totalcount]
5 years 6 months ago
This chart was uploaded by Investor/RT 14.2.5 showing symbol: RTYH1. |
View |
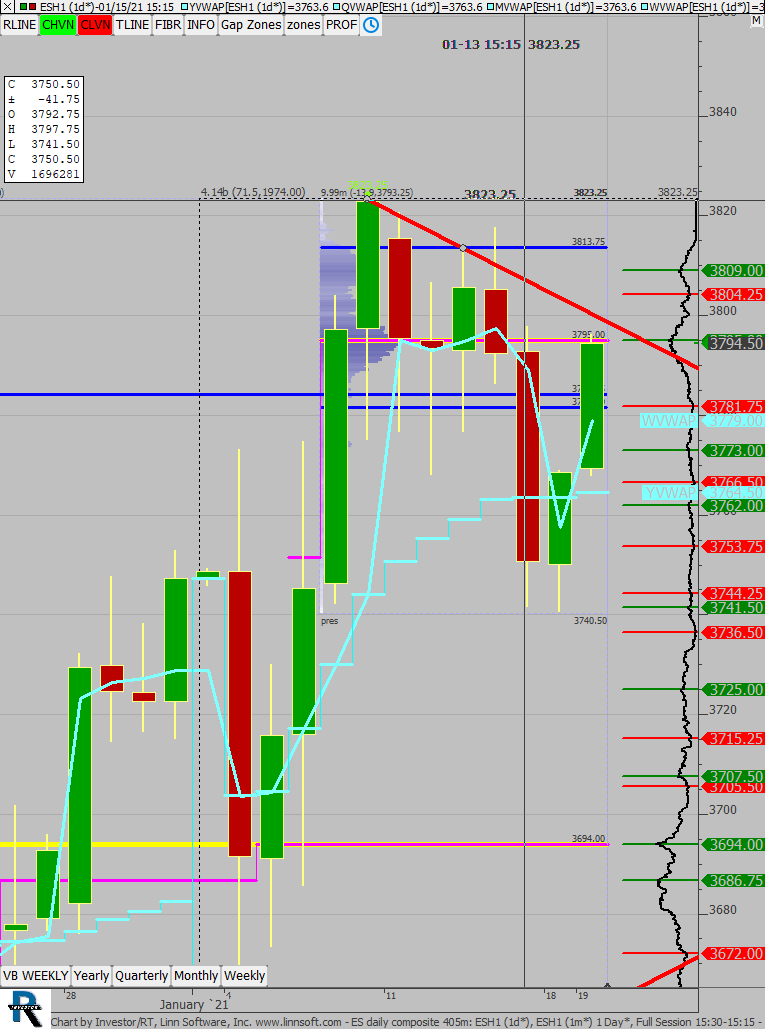 |
ES daily composite 405m (ESH1) scottz46 [totalcount]
5 years 6 months ago
This chart was uploaded by Investor/RT 14.2.5 showing symbol: ESH1. |
View |
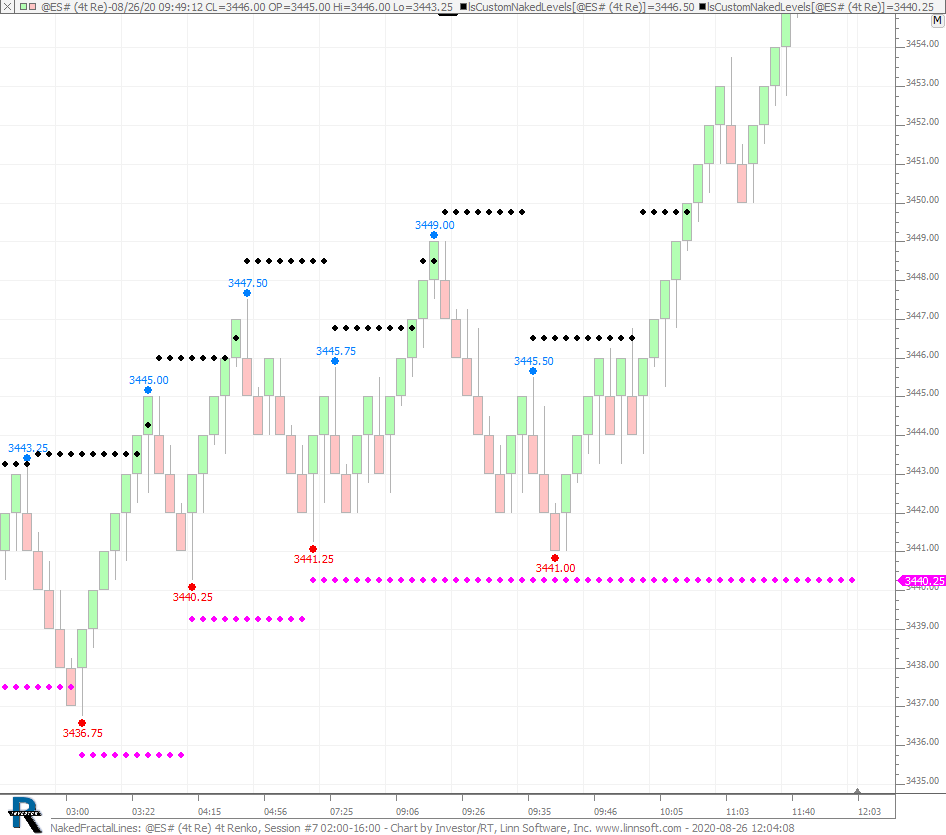 |
NakedFractalLines (@ES#) william-linn [totalcount]
5 years 11 months ago
Sample Chart for CustomNakedLevels RTX Extension. This chart was uploaded by Investor/RT 14.1.5 showing symbol: @ES#. |
View |
 |
ESDAY BARS02b (GCH1) ES42 [totalcount]
5 years 6 months ago
This chart was uploaded by Investor/RT 14.2.5 showing symbol: GCH1. |
View |
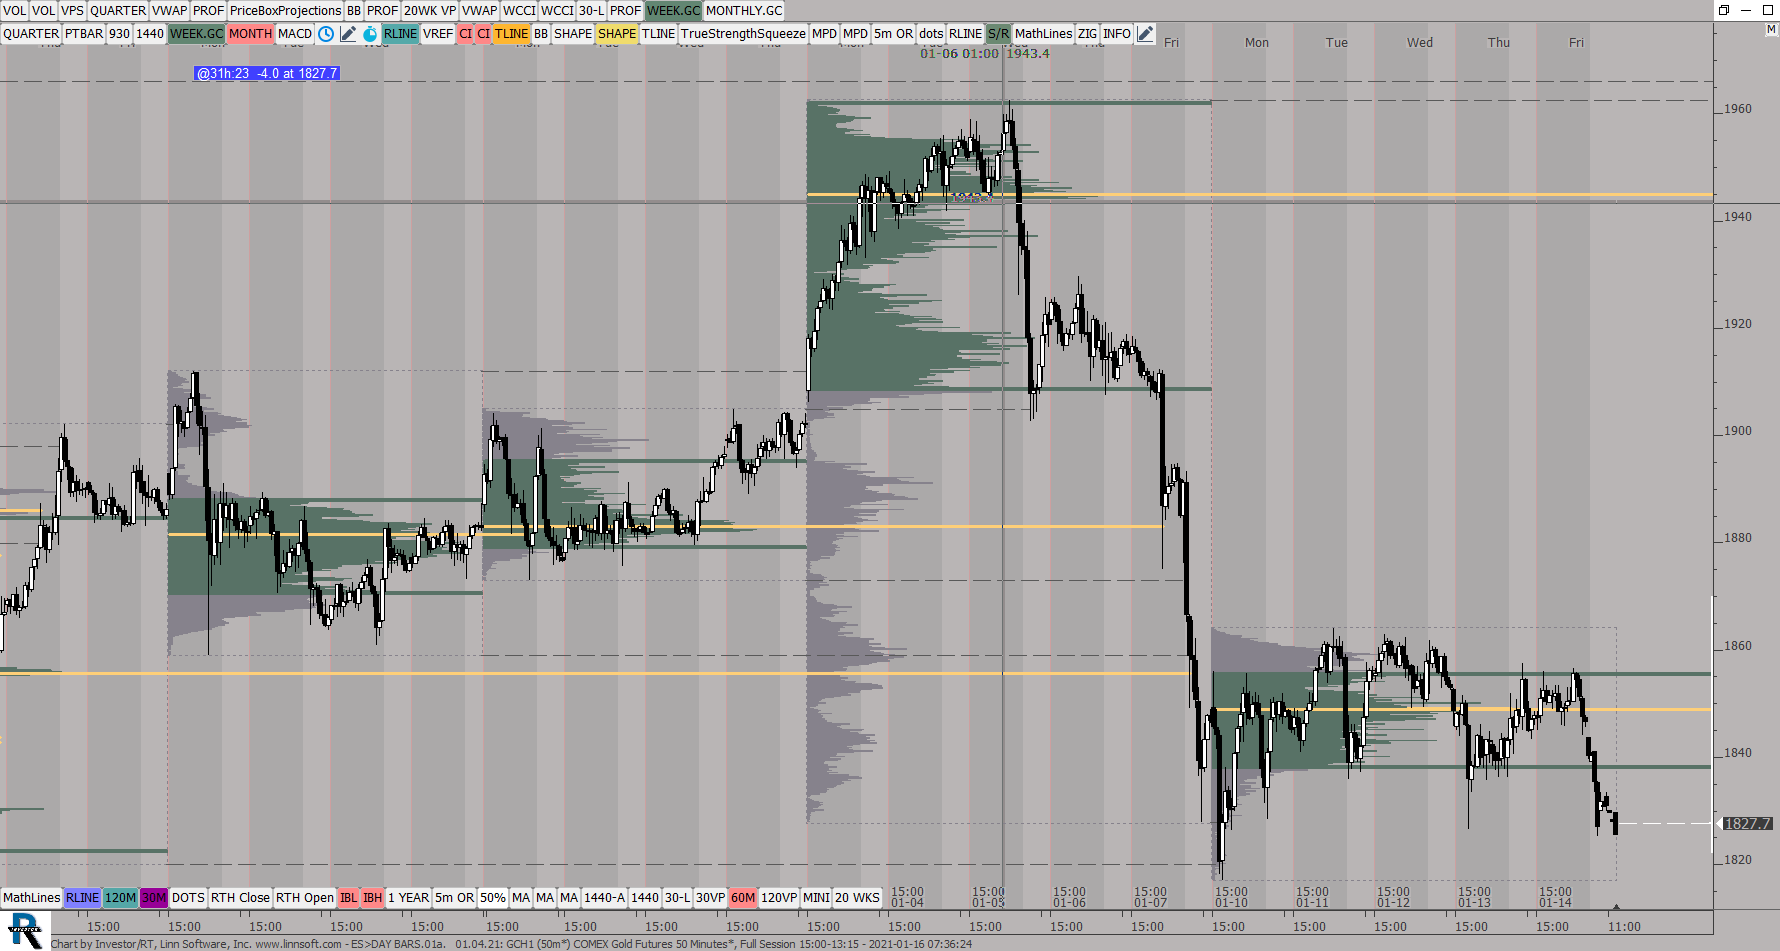 |
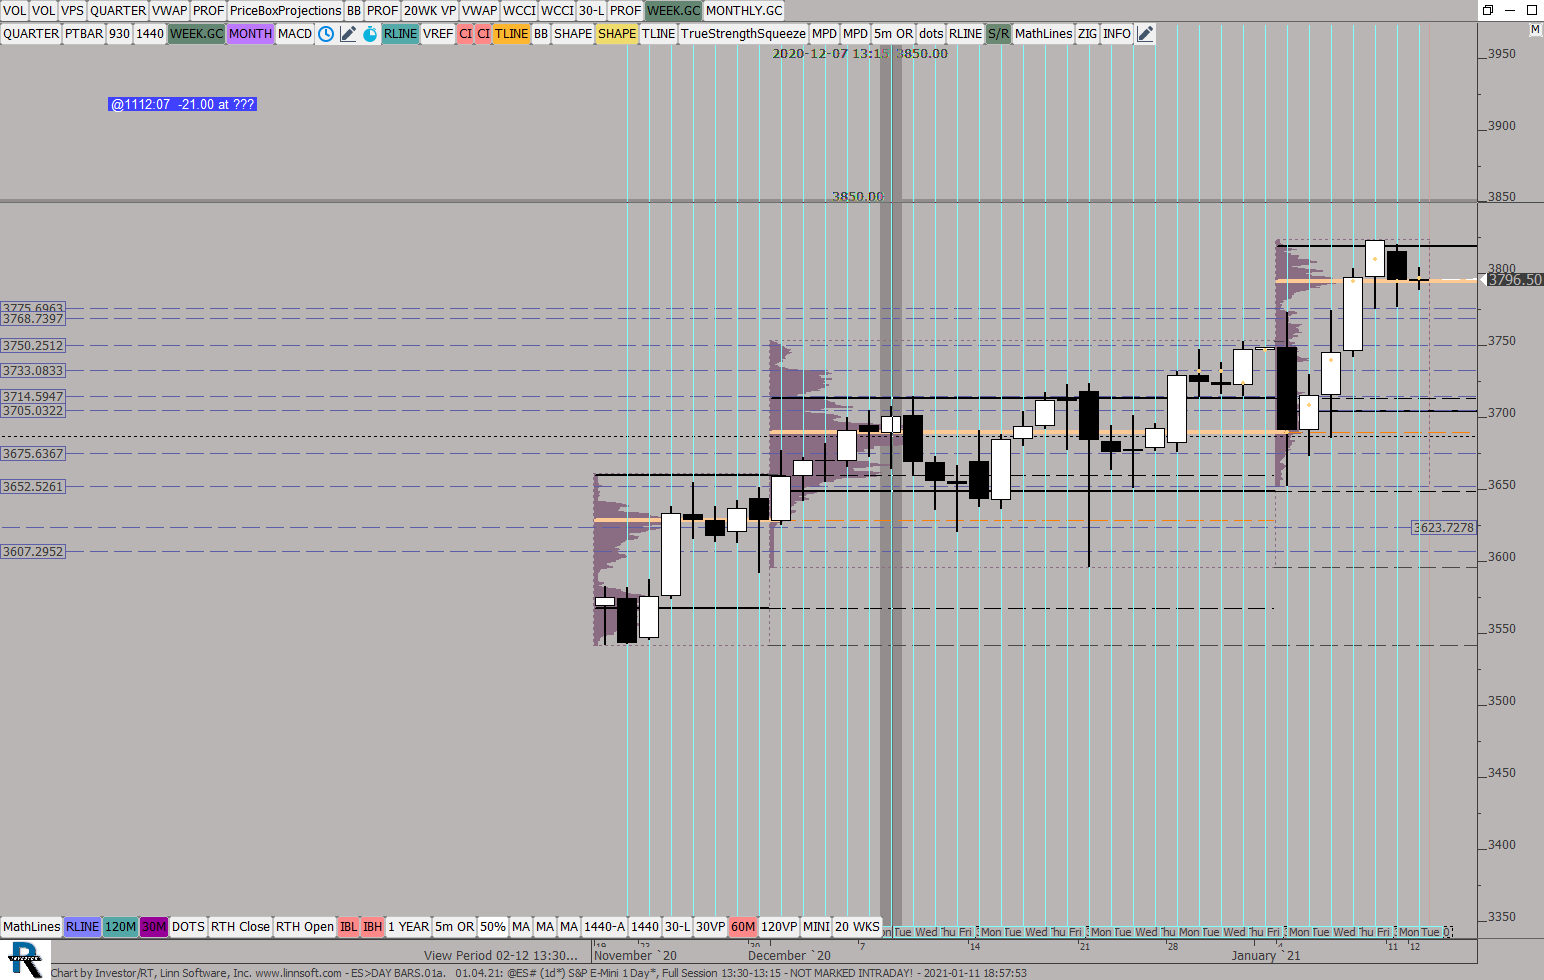
ESDAY BARS01a (GCH1) ES42 [totalcount]
5 years 6 months ago
This chart was uploaded by Investor/RT 14.2.5 showing symbol: GCH1. |
View |
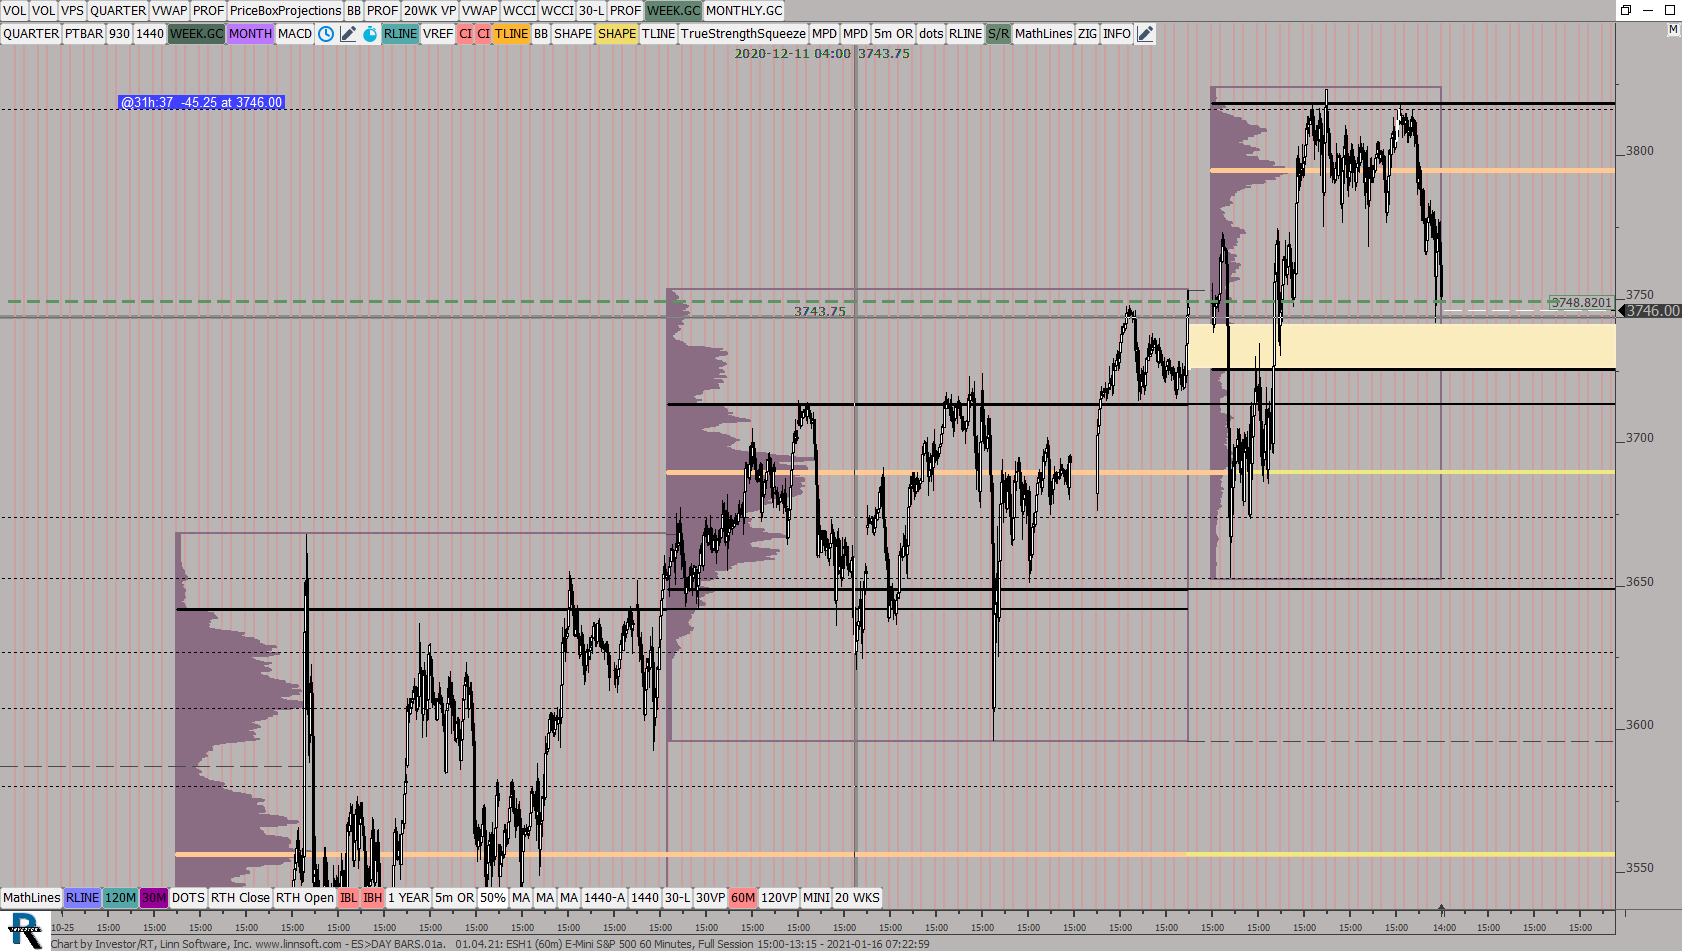 |
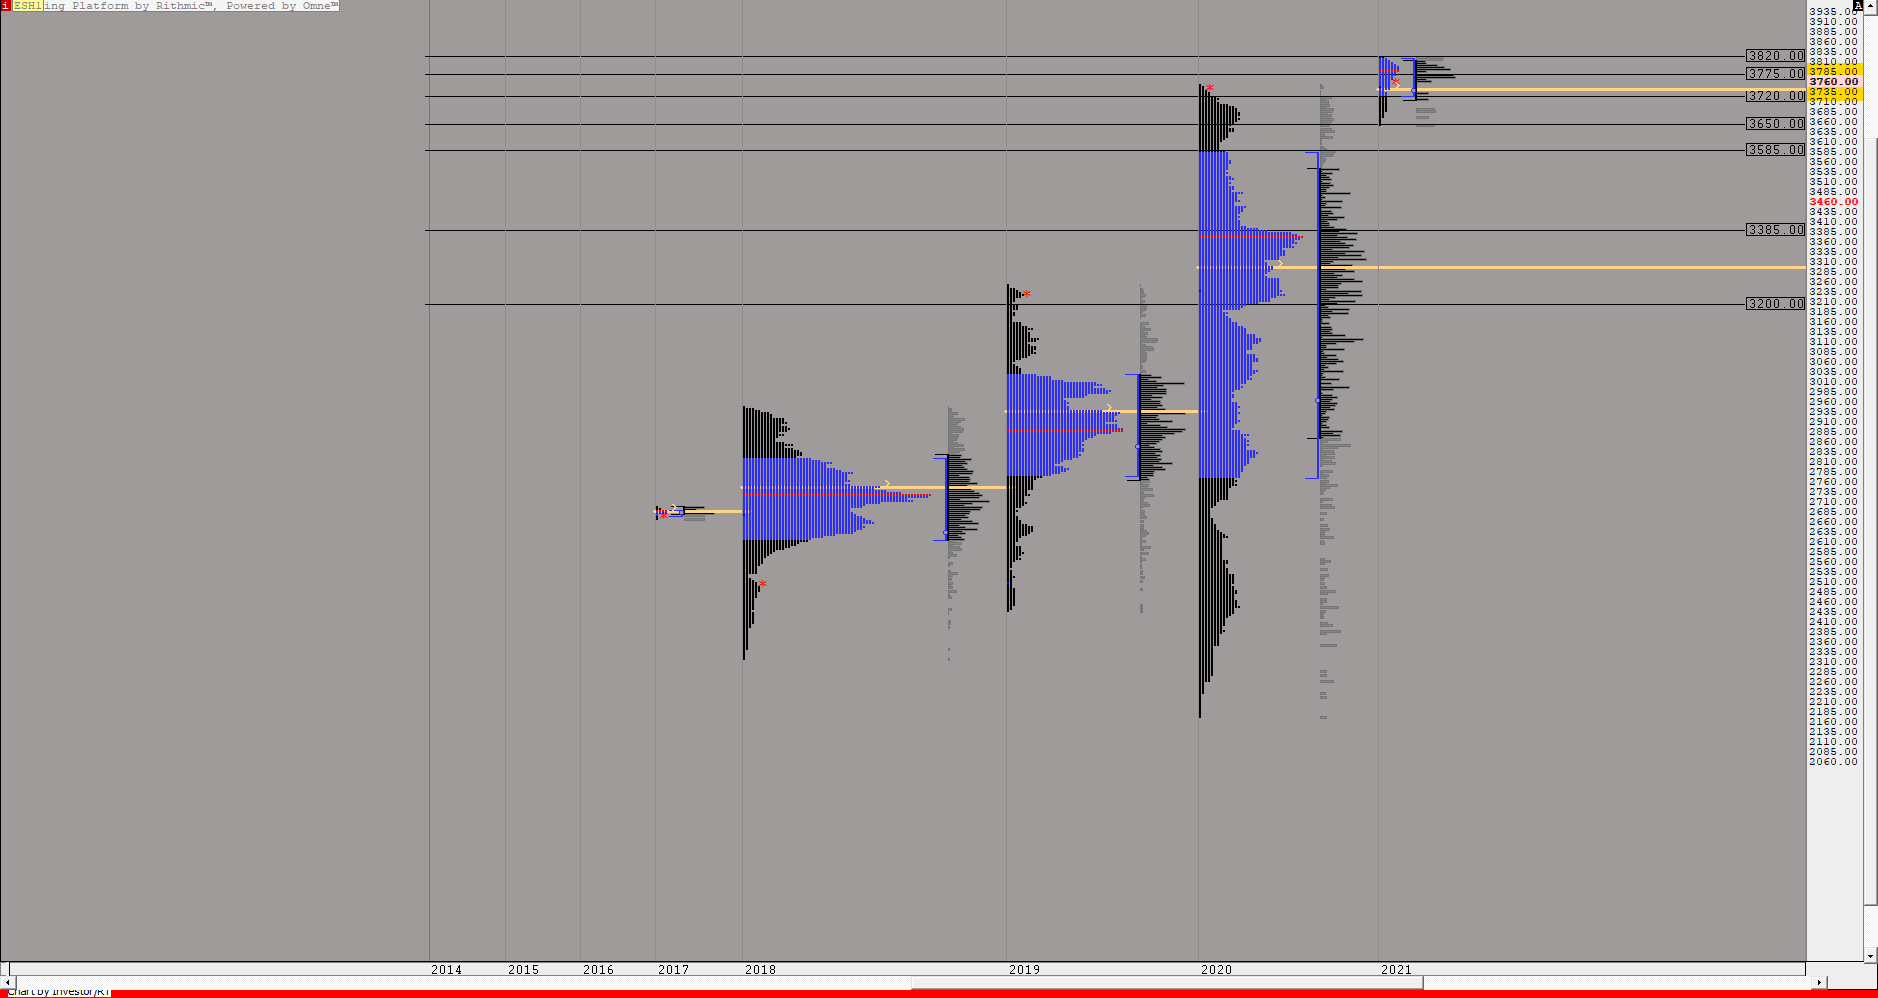
ESDAY BARS01a (ESH1) ES42 [totalcount]
5 years 6 months ago
This chart was uploaded by Investor/RT 14.2.5 showing symbol: ESH1. |
View |
 |
MP YEARLYINDEXES02a (ESH1) ES42 [totalcount]
5 years 6 months ago
This chart was uploaded by Investor/RT 14.2.5 showing symbol: ESH1. |
View |
 |
MP YEARLYINDEXES02 12 29 (ESH1) ES42 [totalcount]
5 years 6 months ago
This chart was uploaded by Investor/RT 14.2.5 showing symbol: ESH1. |
View |
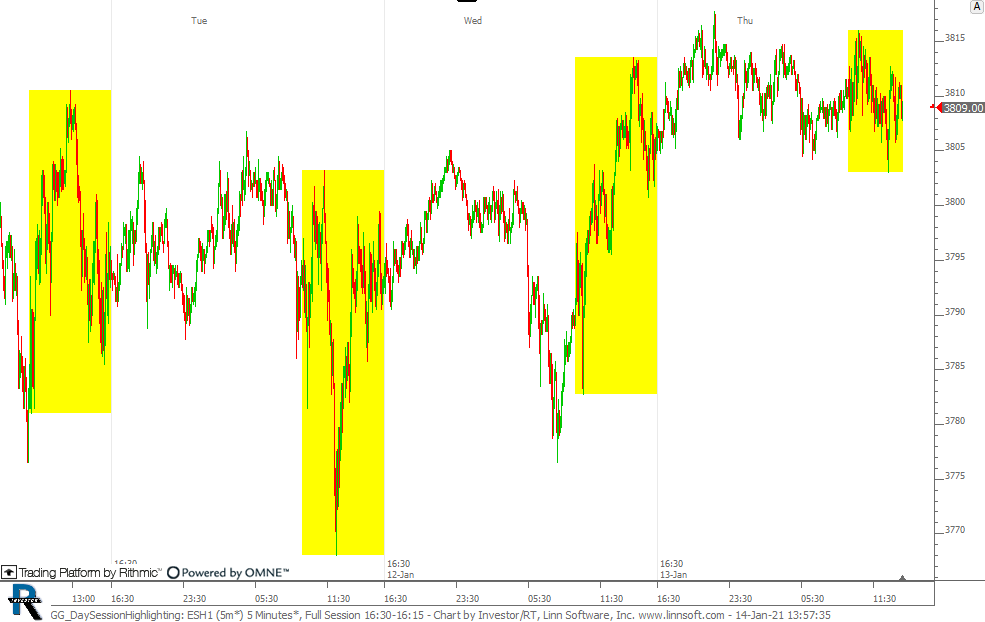 |
GG DaySessionHighlighting (ESH1) cpayne [totalcount]
5 years 6 months ago
Chart highlights the day session range in yellow. This chart was uploaded by Investor/RT 14.2.6 showing symbol: ESH1. |
View |
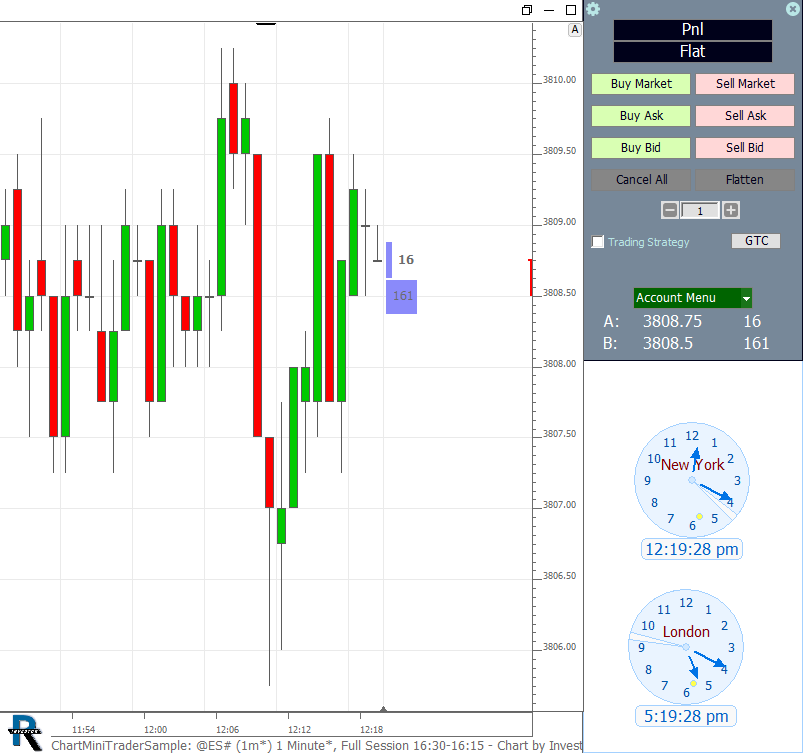 |
ChartMiniTraderSample (@ES#) william-linn [totalcount]
5 years 6 months ago
ChartMiniTrader RTX Sample Chart. This chart was uploaded by Investor/RT 14.2.6 showing symbol: @ES#. |
View |
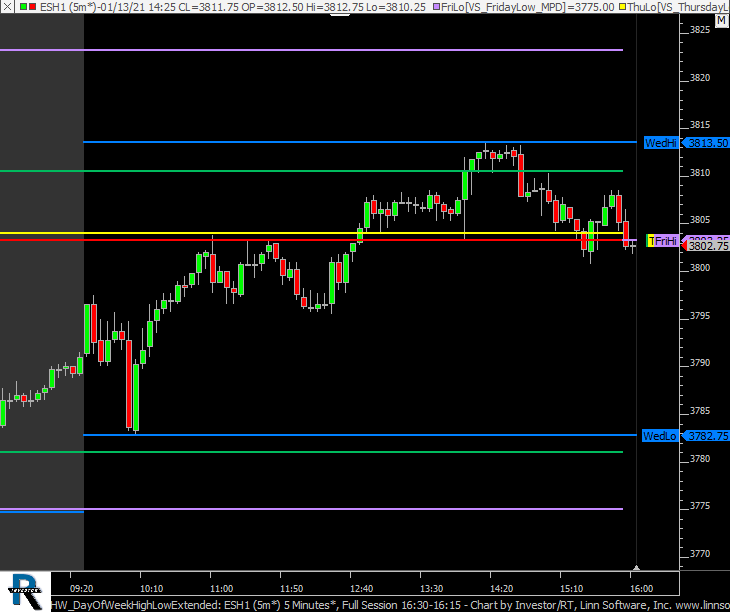 |
HW DayOfWeekHighLowExtended (ESH1) cpayne [totalcount]
5 years 6 months ago
The day session high and low of each day of the week is extended through the week until it resets on same day of week on following week. |
View |
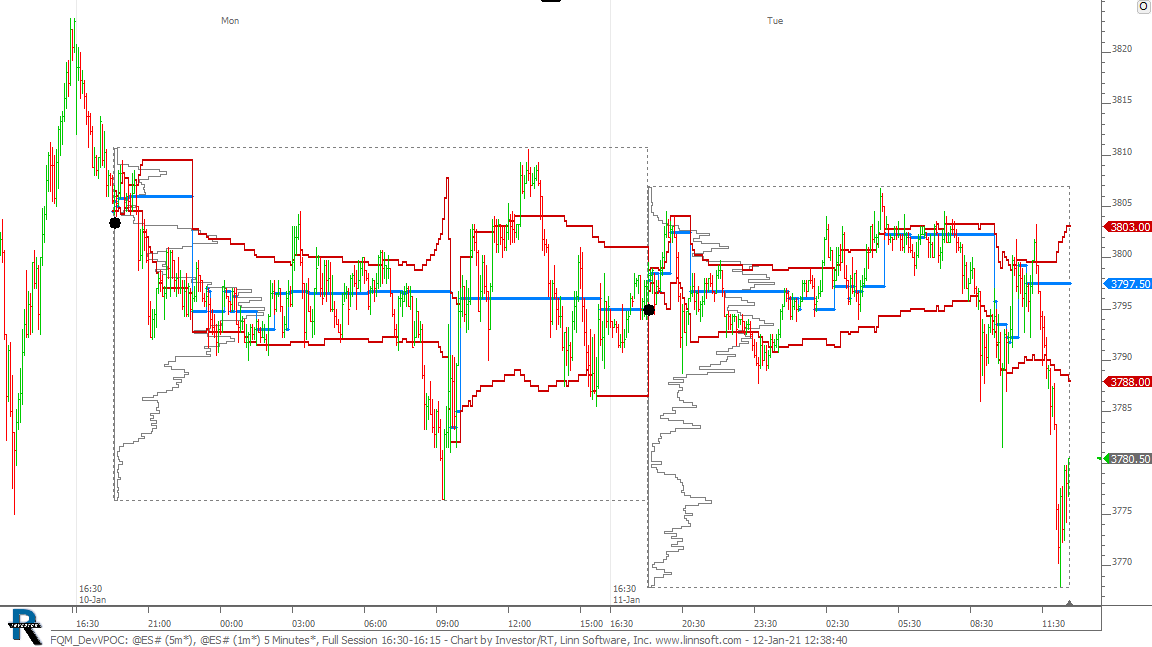 |
FQM DevVPOC (@ES#) cpayne [totalcount]
5 years 6 months ago
This chart was uploaded by Investor/RT 14.2.6 showing symbol: @ES#. |
View |
 |
ESDAY BARS01a (@ES#) ES42 [totalcount]
5 years 6 months ago
This chart was uploaded by Investor/RT 14.2.5 showing symbol: @ES#. |
View |
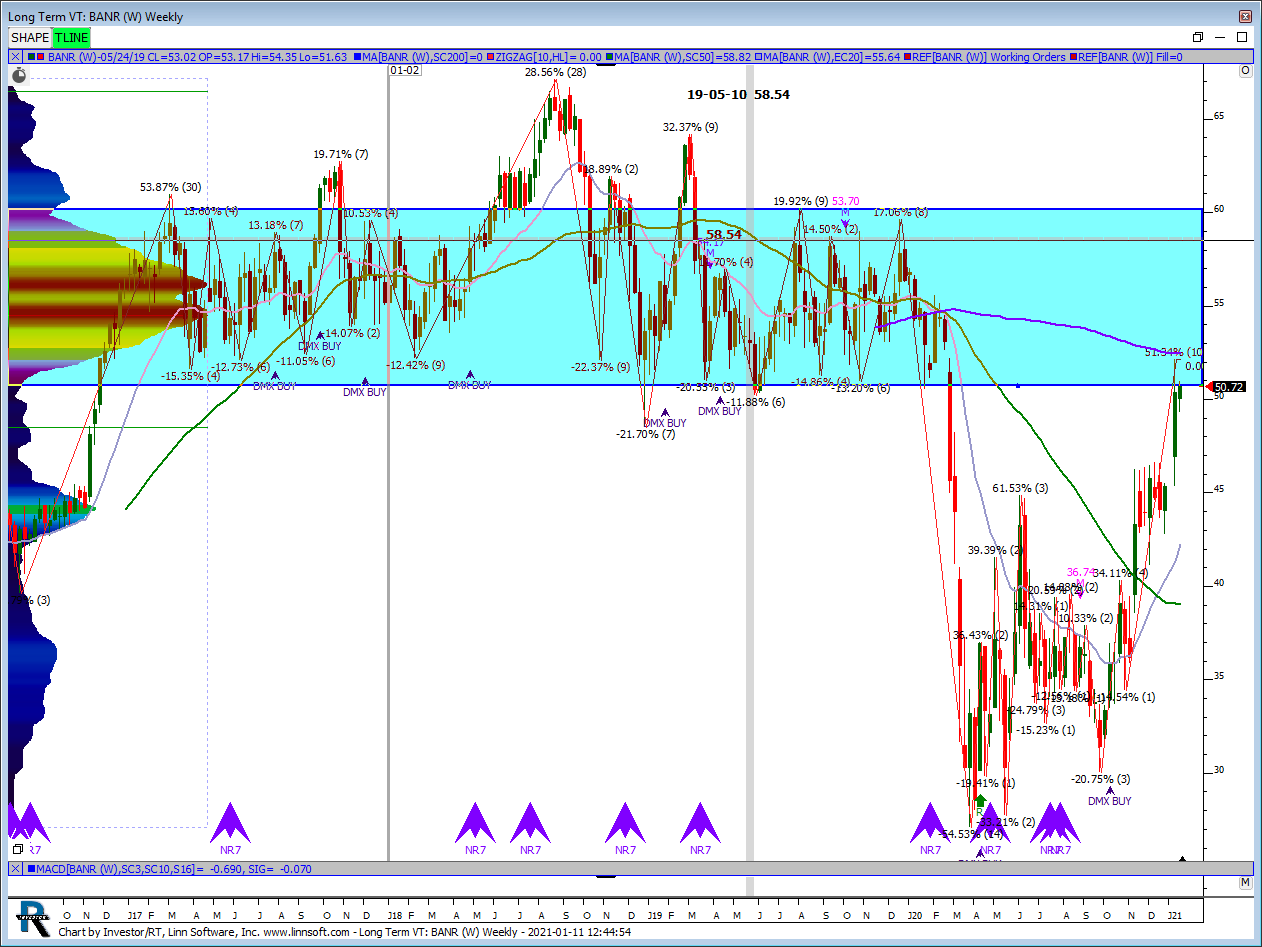 |
Long Term VT (BANR) justin-detray [totalcount]
5 years 6 months ago
BANR. This chart was uploaded by Investor/RT 13.7.10 showing symbol: BANR. |
View |