 |
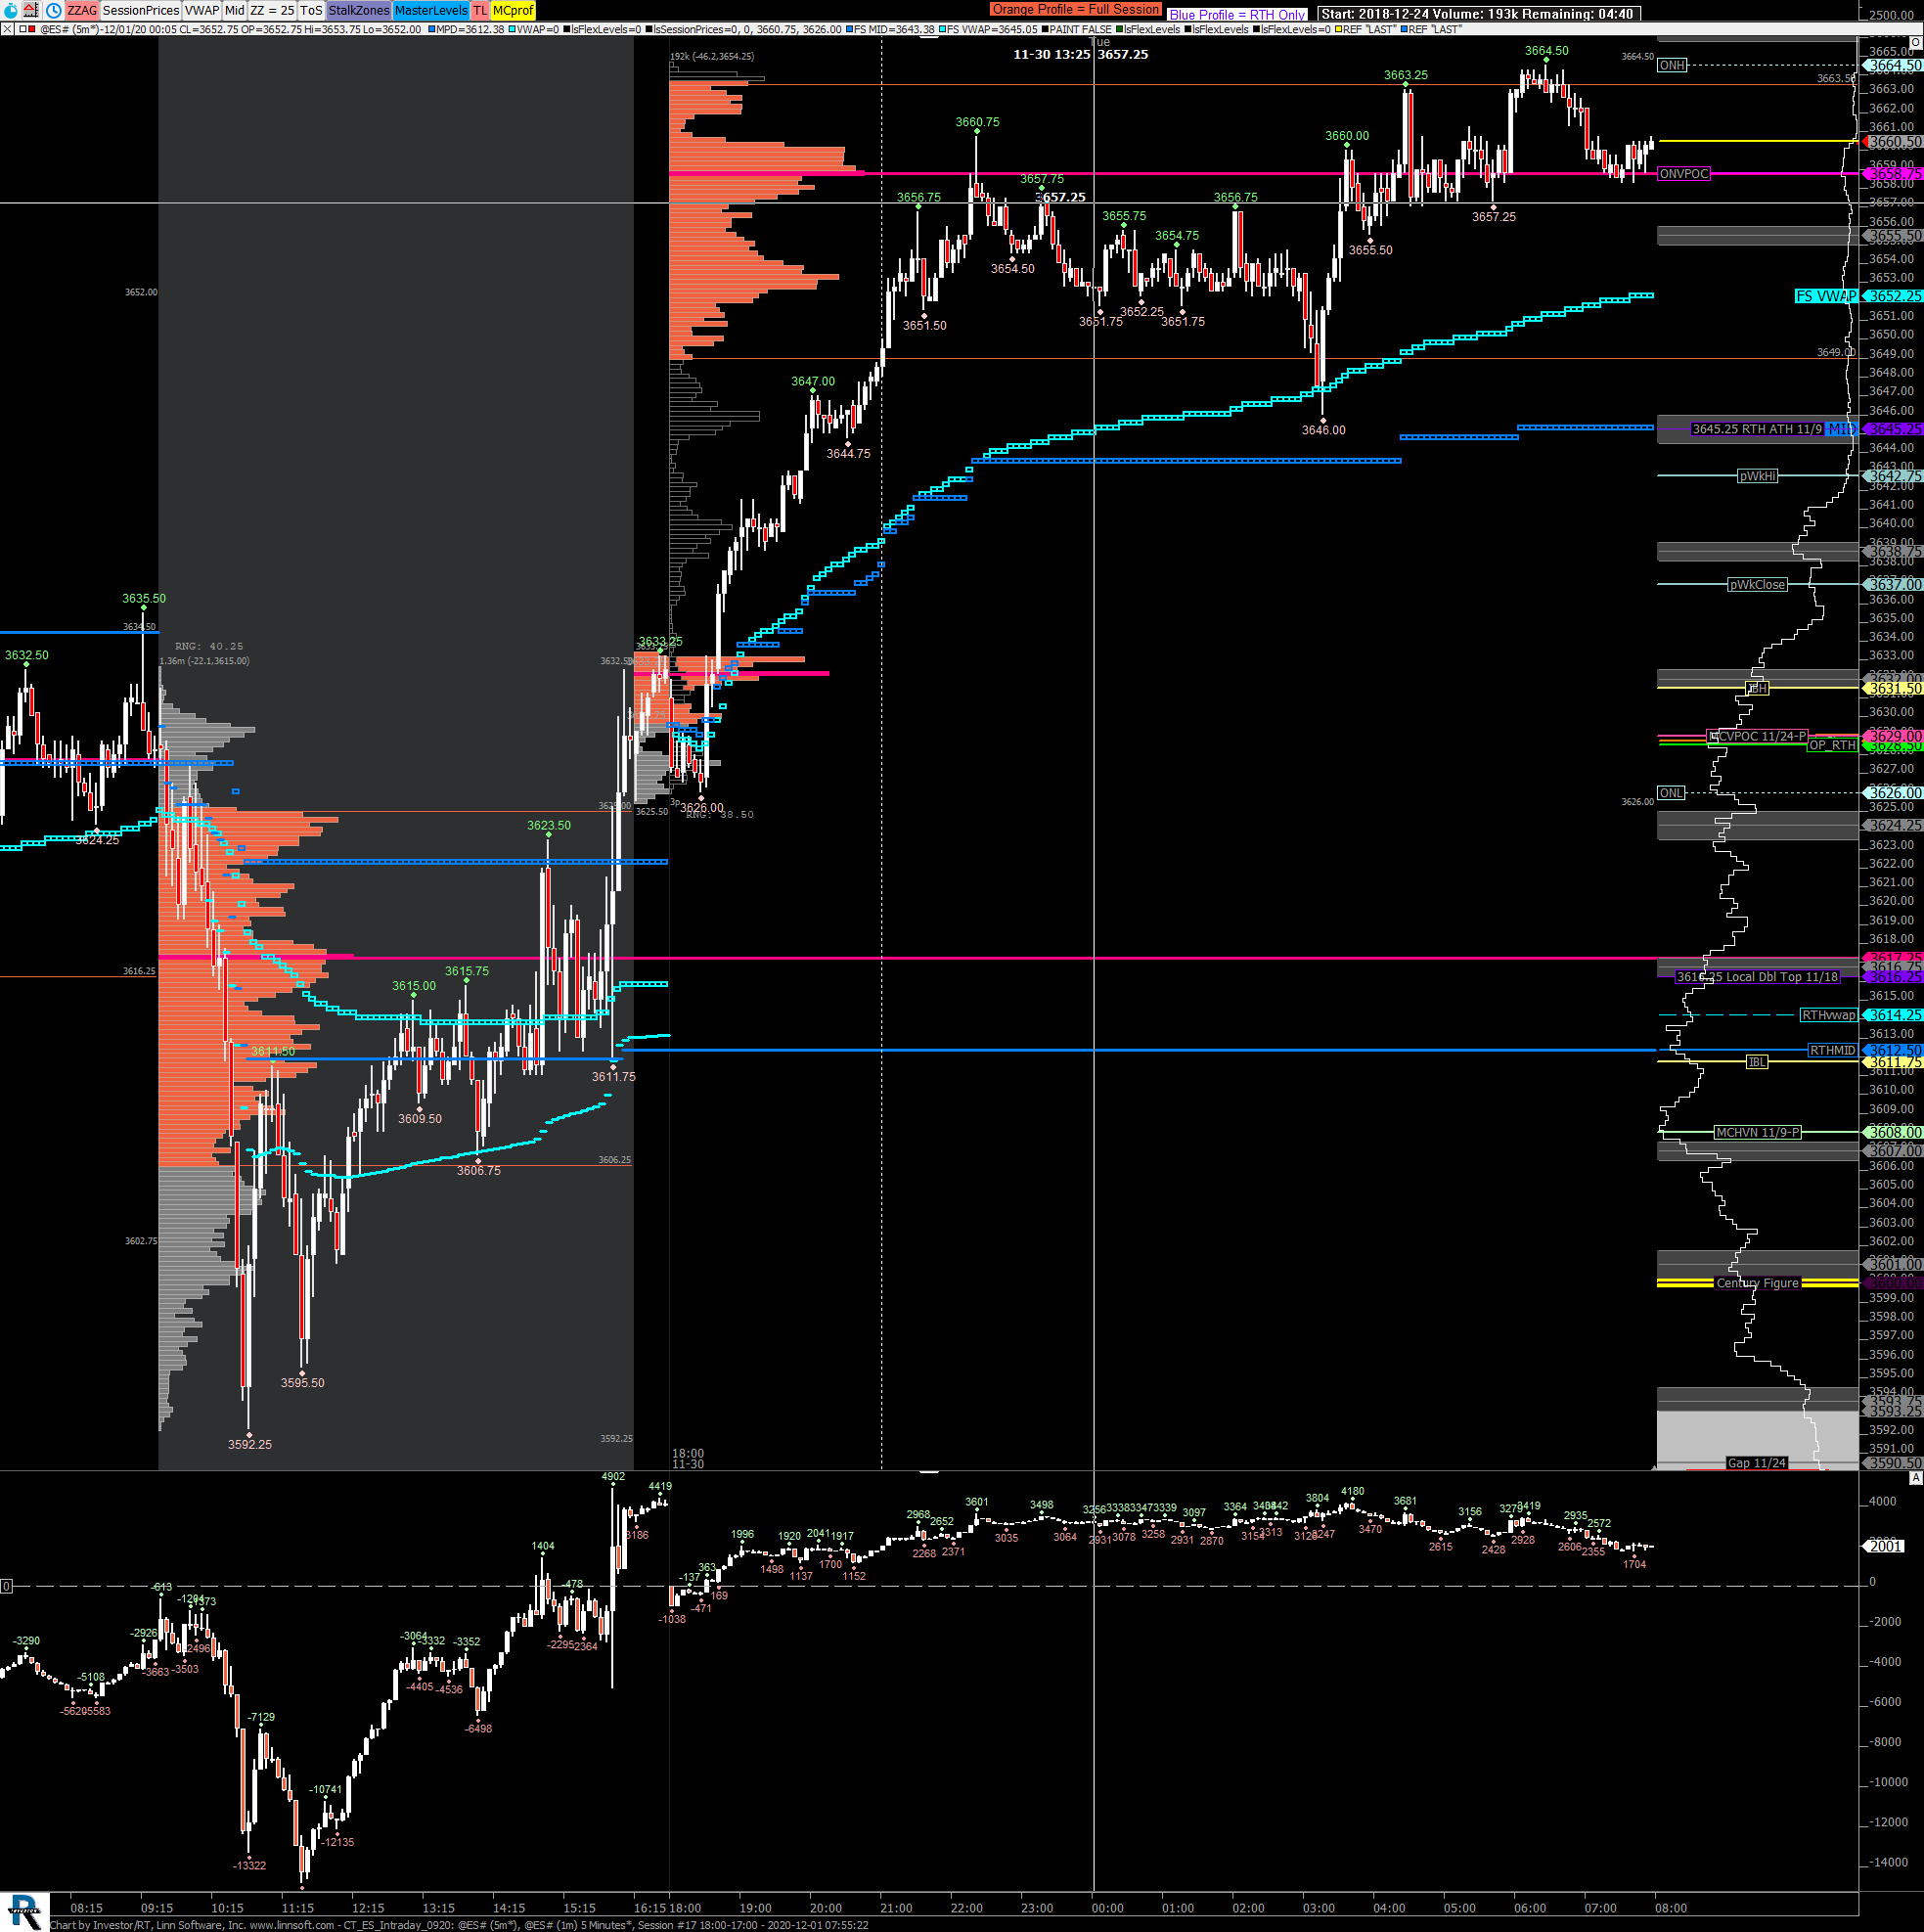
CT ES Intraday 0920 (@ES#) jproetsch [totalcount]
5 years 8 months ago
ES 24 hr Chart with profile. This chart was uploaded by Investor/RT 14.2.4 showing symbol: @ES#. |
View |
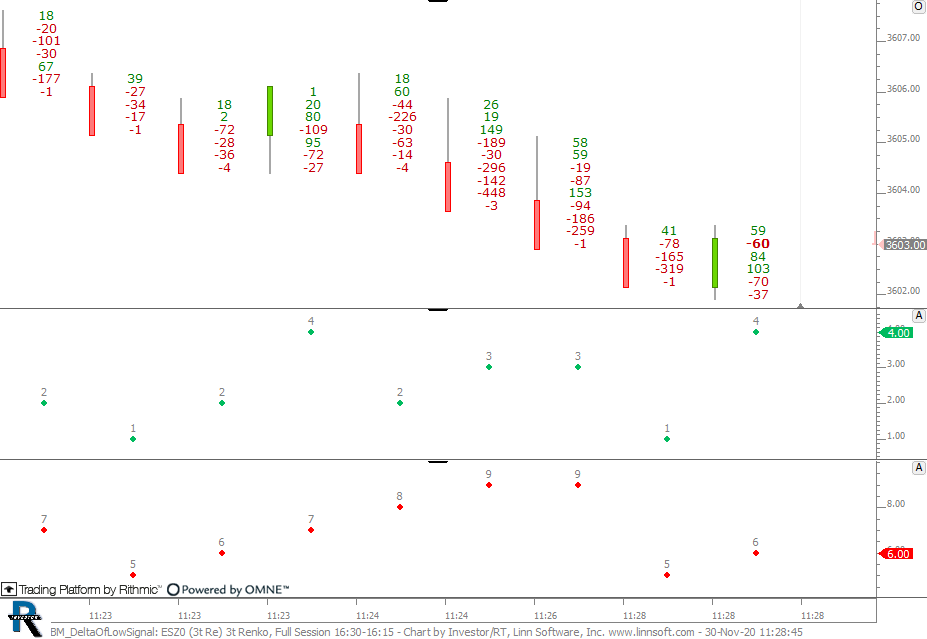 |
BM DeltaOfLowSignal (ESZ0) cpayne [totalcount]
5 years 8 months ago
This chart was uploaded by Investor/RT 14.2.5 showing symbol: ESZ0. |
View |
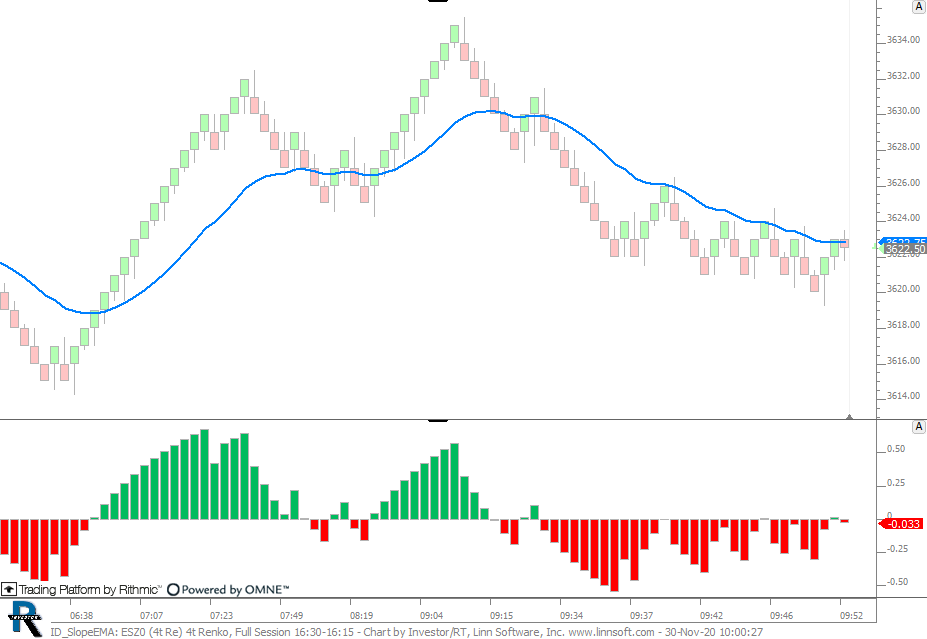 |
ID SlopeEMA (ESZ0) cpayne [totalcount]
5 years 8 months ago
This chart was uploaded by Investor/RT 14.2.5 showing symbol: ESZ0. |
View |
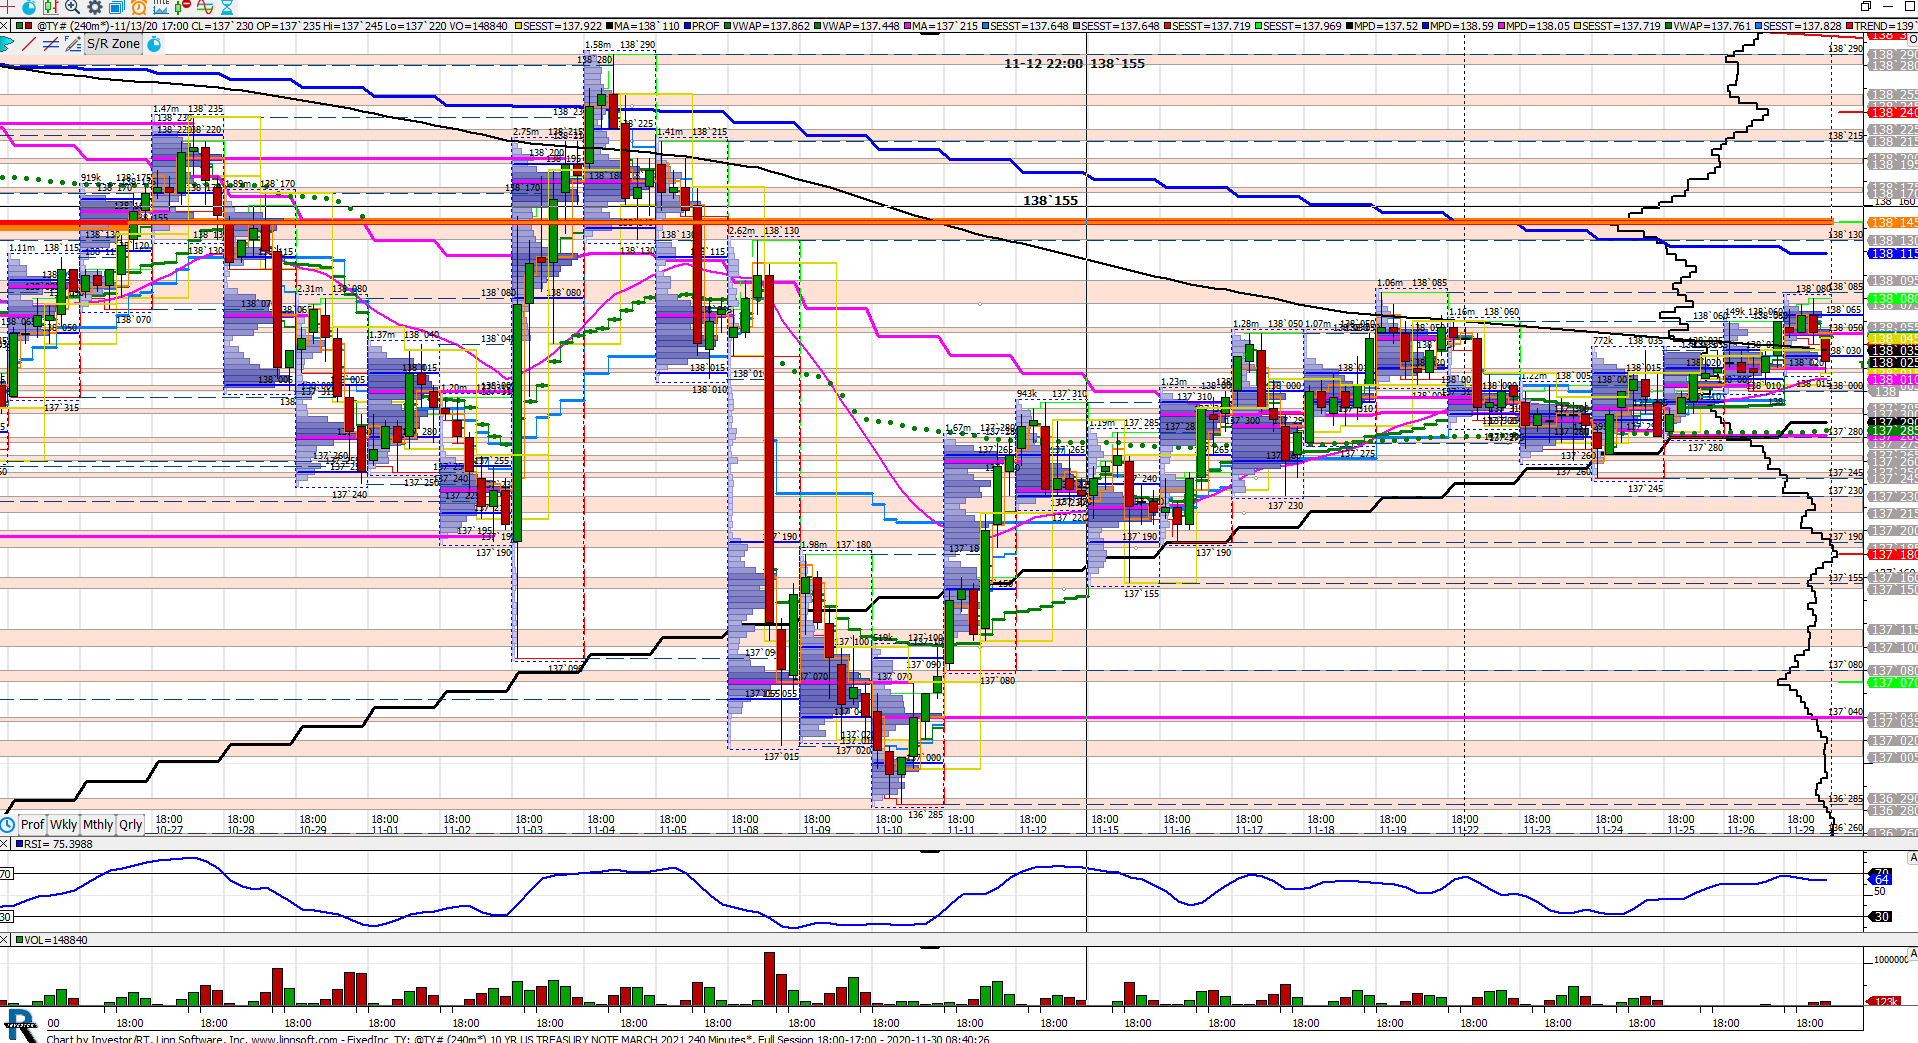 |
FixedInc TY (@TY#) npettinato [totalcount]
5 years 8 months ago
This chart was uploaded by Investor/RT 13.6.15 showing symbol: @TY#. |
View |
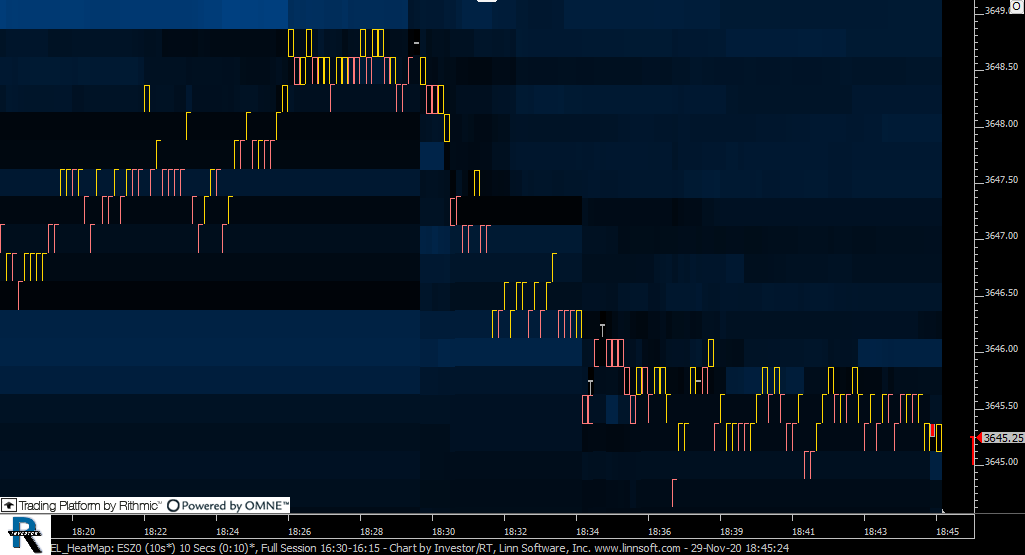 |
EL HeatMap (ESZ0) cpayne [totalcount]
5 years 8 months ago
This chart was uploaded by Investor/RT 14.2.5 showing symbol: ESZ0. |
View |
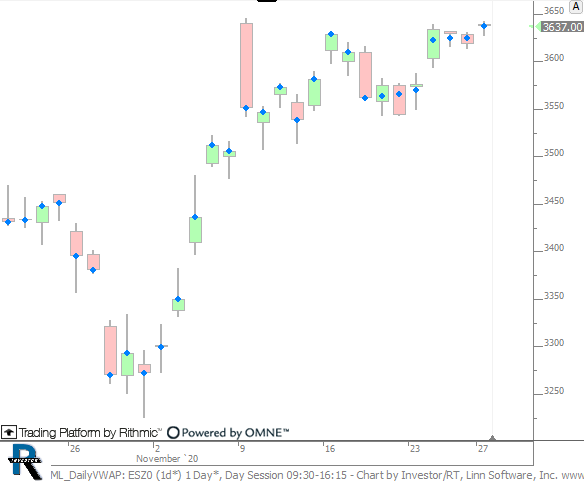 |
ML DailyVWAP (ESZ0) cpayne [totalcount]
5 years 8 months ago
This chart was uploaded by Investor/RT 14.2.5 showing symbol: ESZ0. |
View |
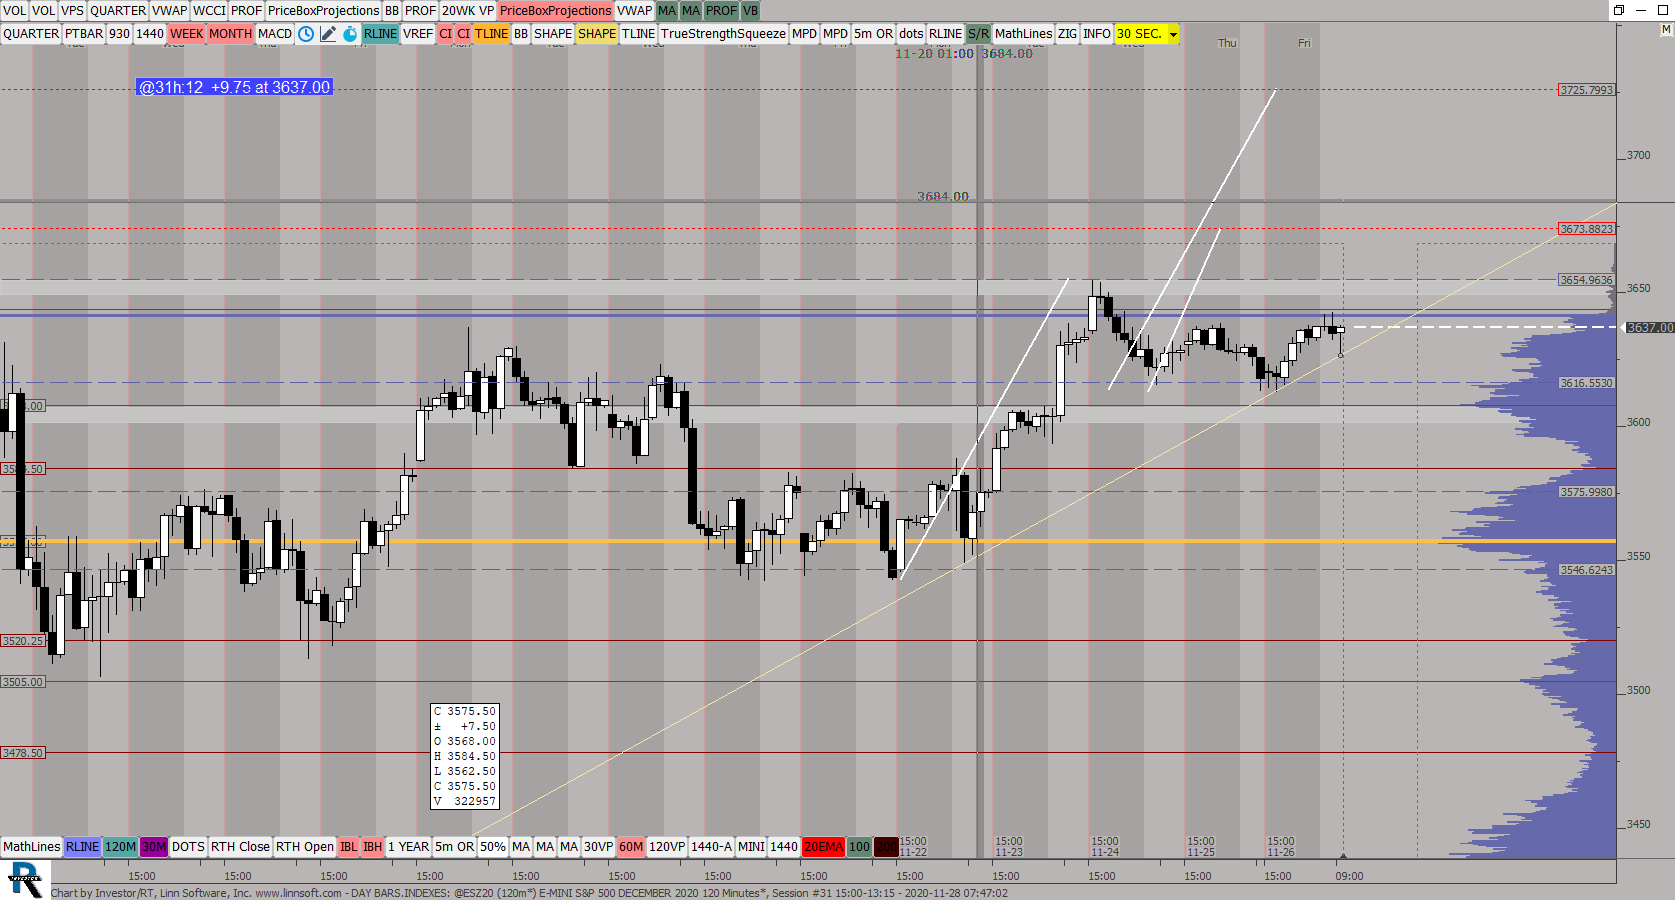 |
DAY BARSINDEXES (@ESZ20) ES42 [totalcount]
5 years 8 months ago
Measured Moves ES. This chart was uploaded by Investor/RT 14.2.4 showing symbol: @ESZ20. |
View |
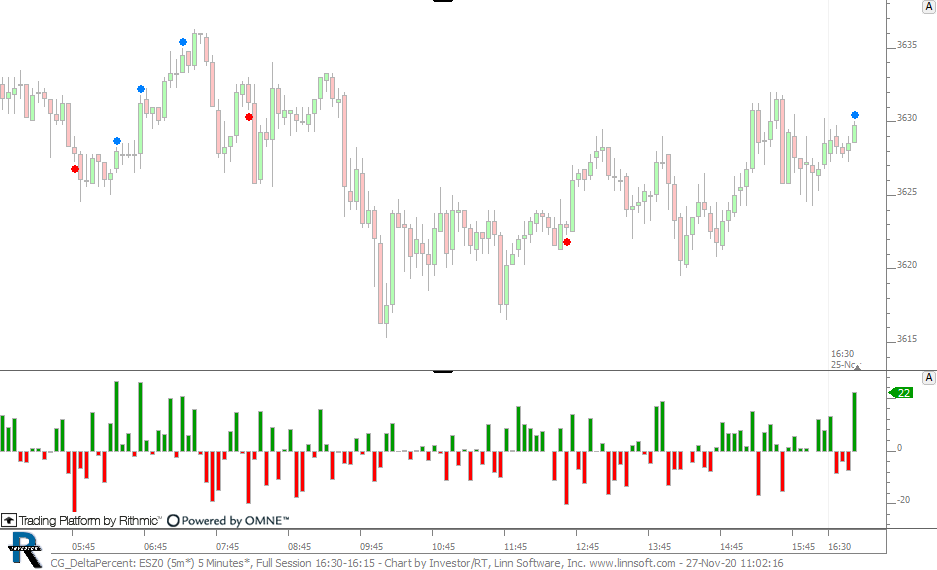 |
CG DeltaPercent (ESZ0) cpayne [totalcount]
5 years 8 months ago
Delta as a percentage of Volume. This chart was uploaded by Investor/RT 14.2.5 showing symbol: ESZ0. |
View |
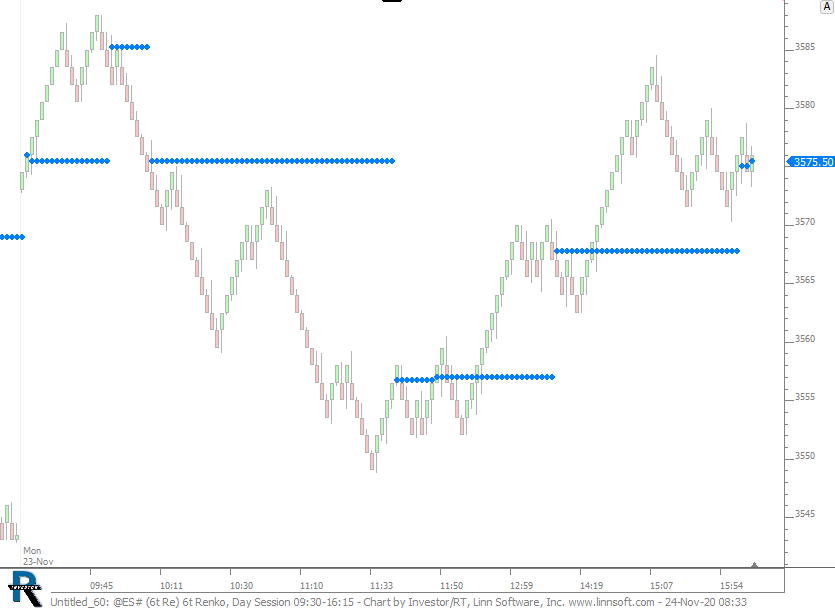 |
Untitled 60 (@ES#) cpayne [totalcount]
5 years 8 months ago
Developing VPOC in RTL. This chart was uploaded by Investor/RT 14.2.5 showing symbol: @ES#. |
View |
 |
DAY BARSINDEXES (@ES#) ES42 [totalcount]
5 years 8 months ago
This chart was uploaded by Investor/RT 14.2.4 showing symbol: @ES#. |
View |
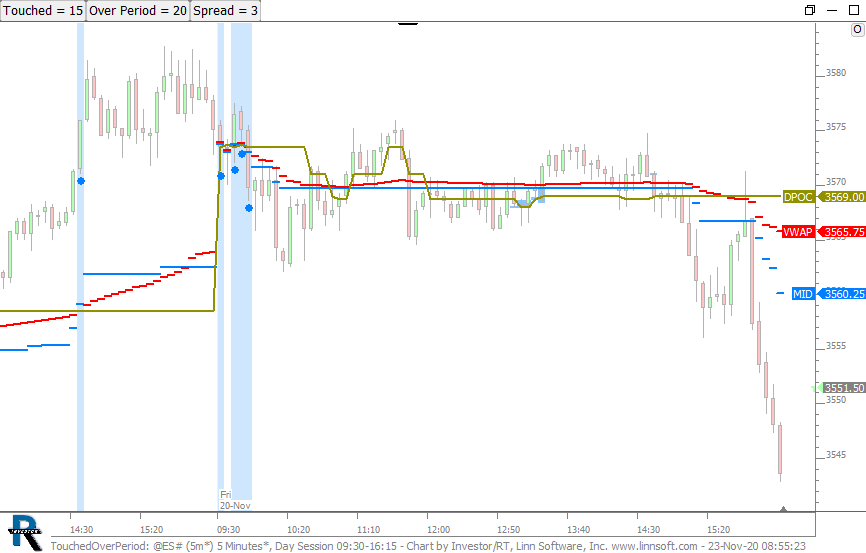 |
TouchedOverPeriod (@ES#) cpayne [totalcount]
5 years 8 months ago
This chart was uploaded by Investor/RT 14.2.5 showing symbol: @ES#. |
View |
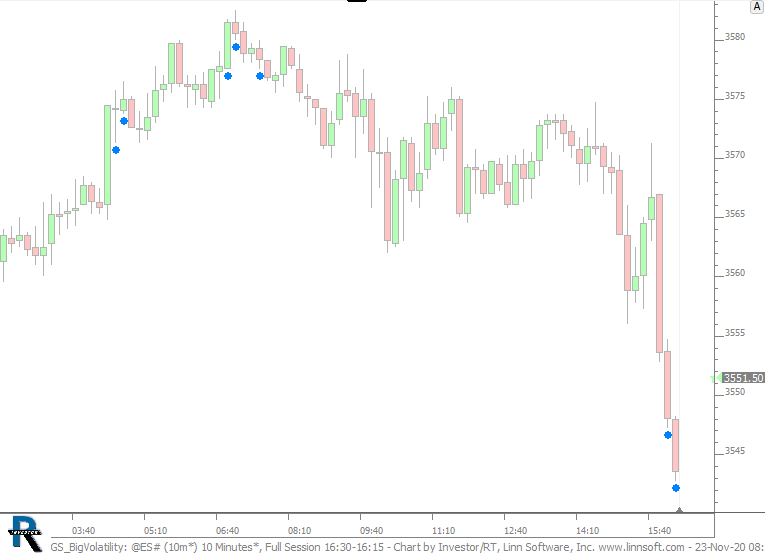 |
GS BigVolatility (@ES#) cpayne [totalcount]
5 years 8 months ago
This chart was uploaded by Investor/RT 14.2.5 showing symbol: @ES#. |
View |
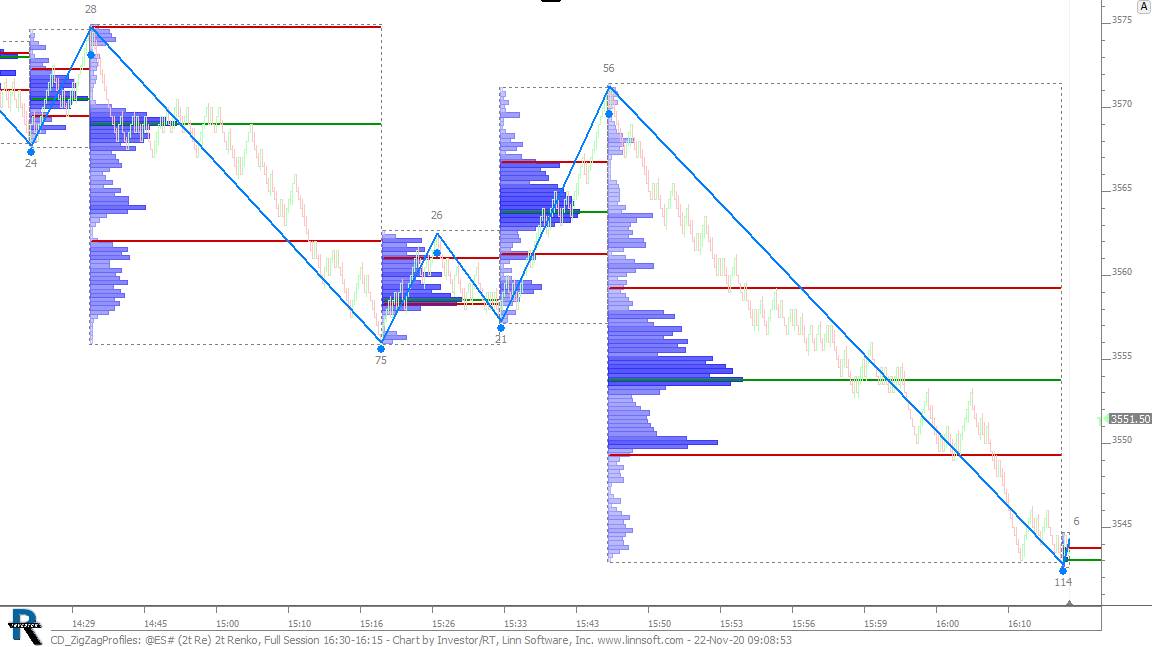 |
CD ZigZagProfiles (@ES#) cpayne [totalcount]
5 years 8 months ago
Zig Zag Profiles. This chart was uploaded by Investor/RT 14.2.5 showing symbol: @ES#. |
View |
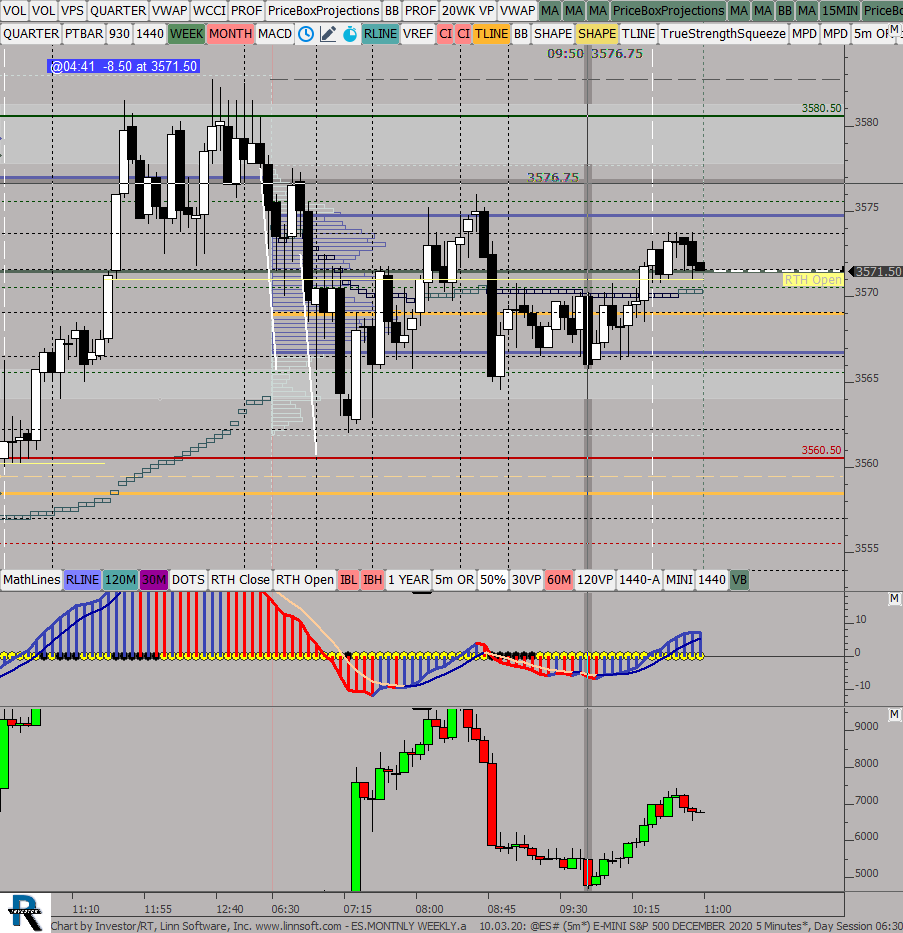 |
ESMONTNLY WEEKLYa (@ES#) ES42 [totalcount]
5 years 8 months ago
This chart was uploaded by Investor/RT 14.2.4 showing symbol: @ES#. |
View |
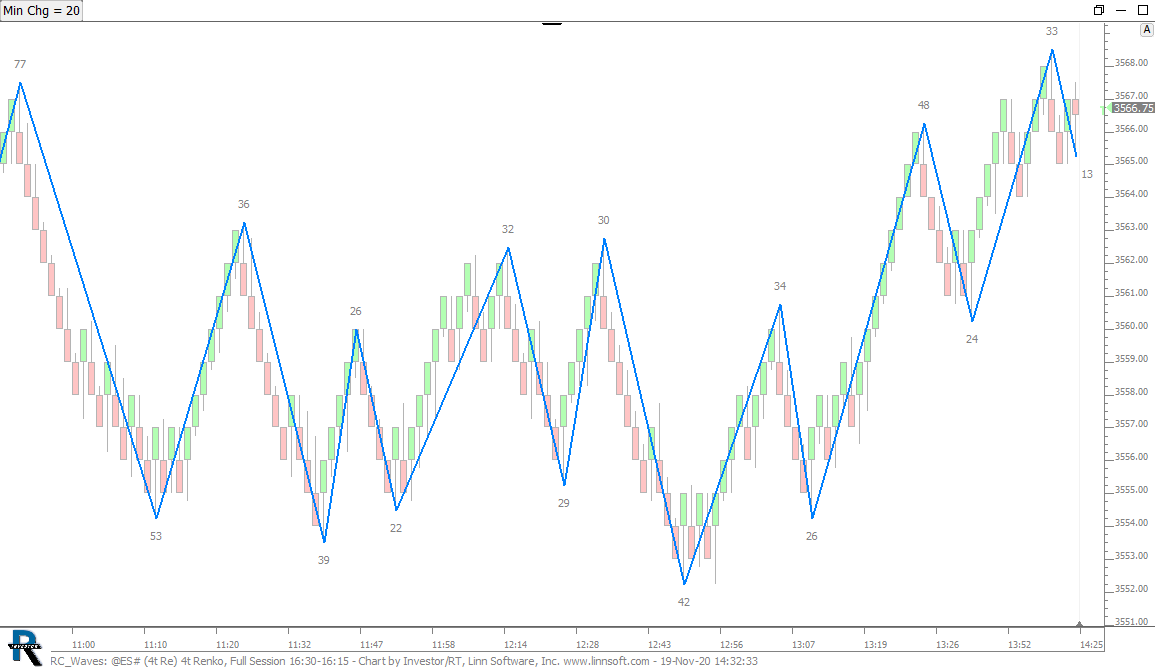 |
RC Waves (@ES#) cpayne [totalcount]
5 years 8 months ago
This chart was uploaded by Investor/RT 14.2.5 showing symbol: @ES#. |
View |
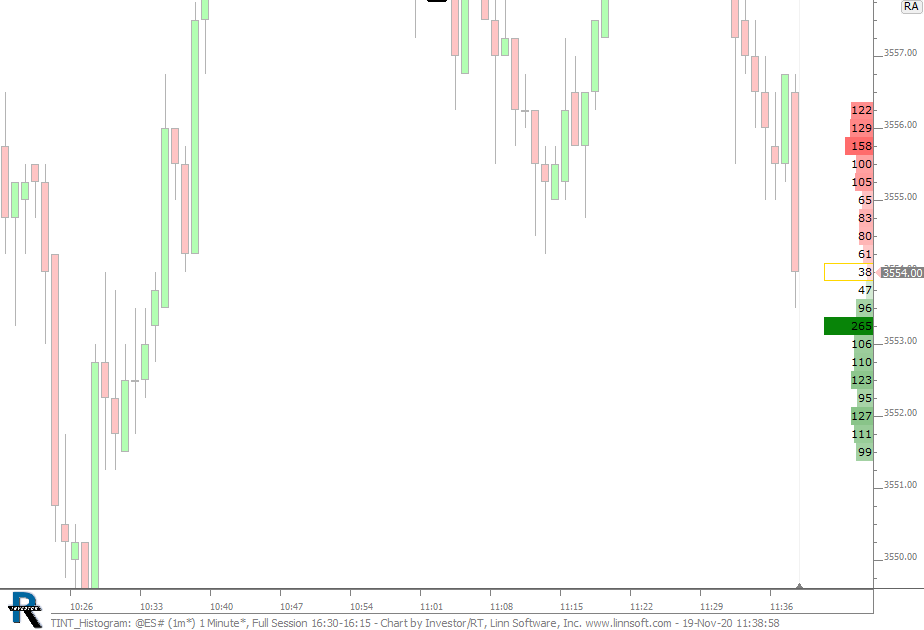 |
TINT Histogram (@ES#) cpayne [totalcount]
5 years 8 months ago
This chart was uploaded by Investor/RT 14.2.5 showing symbol: @ES#. |
View |
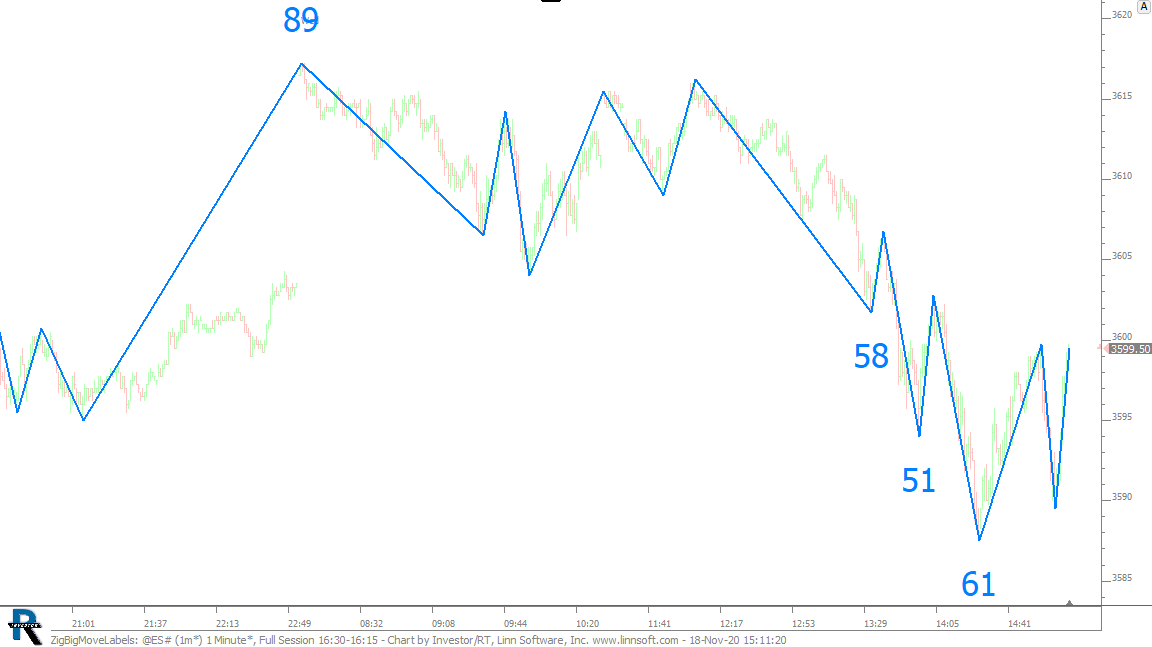 |
ZigBigMoveLabels (@ES#) cpayne [totalcount]
5 years 8 months ago
This chart was uploaded by Investor/RT 14.2.4 showing symbol: @ES#. |
View |
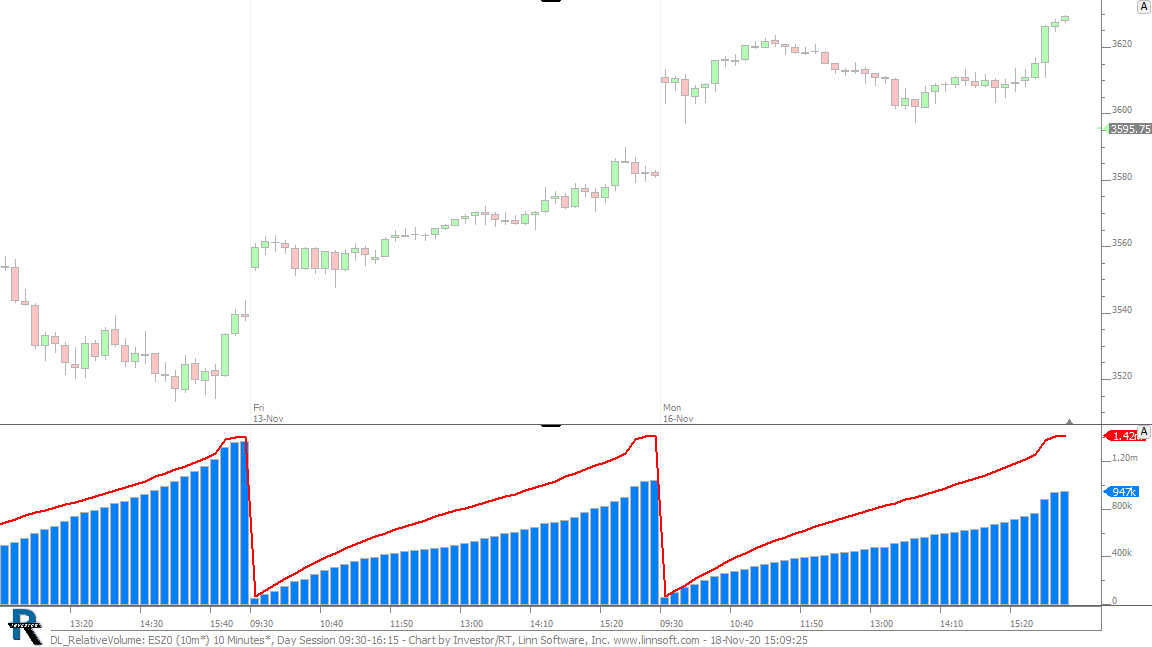 |
DL RelativeVolume (ESZ0) cpayne [totalcount]
5 years 8 months ago
Volume (blue) vs 20 Day Avg Volume (red). This chart was uploaded by Investor/RT 14.2.4 showing symbol: ESZ0. |
View |
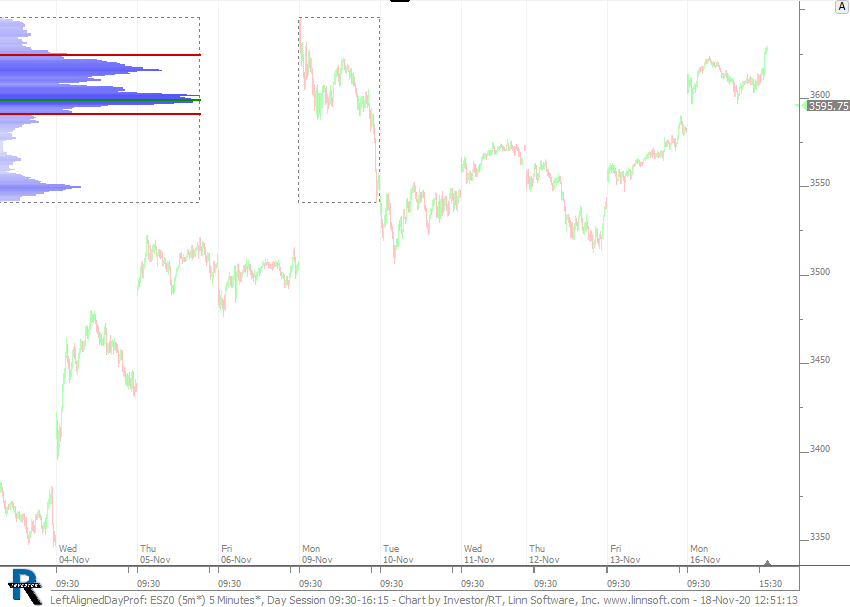 |
LeftAlignedDayProf (ESZ0) cpayne [totalcount]
5 years 8 months ago
This chart was uploaded by Investor/RT 14.2.4 showing symbol: ESZ0. |
View |
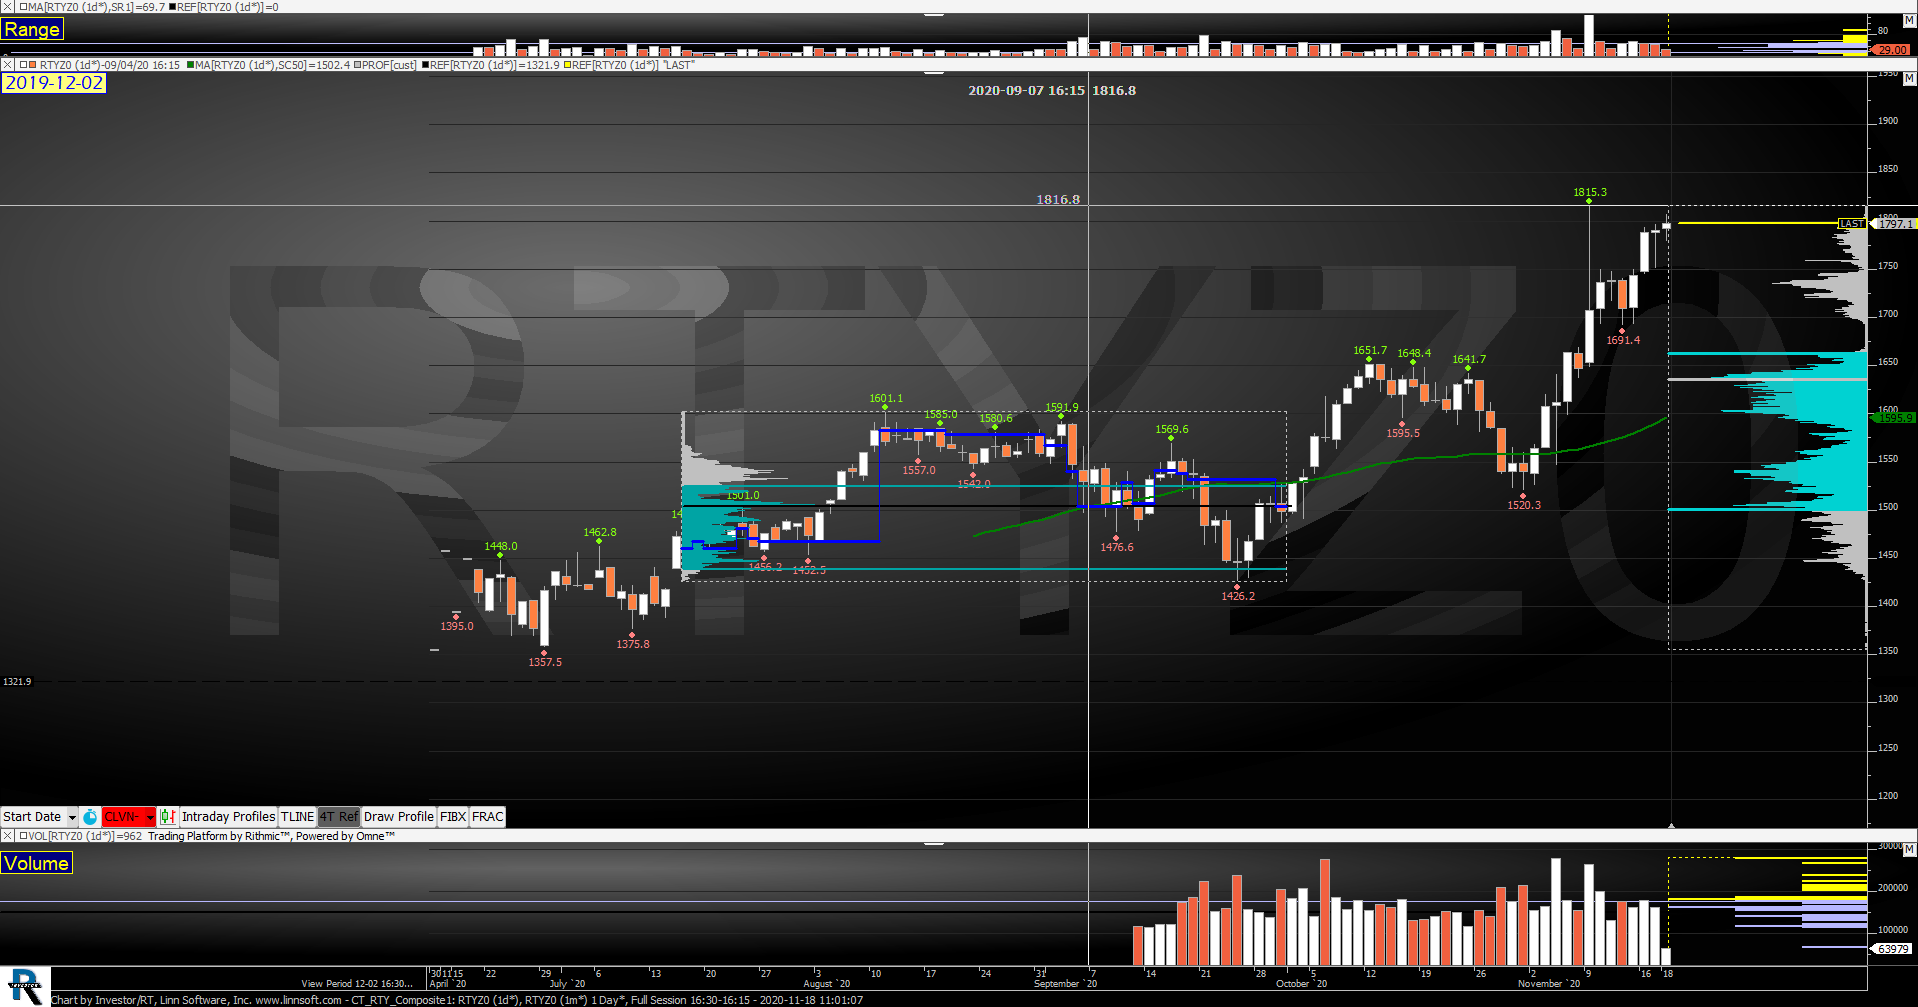 |
CT RTY Composite (RTYZ0) Adam Thivierge [totalcount]
5 years 8 months ago
This chart was uploaded by Investor/RT 14.2.4 showing symbol: RTYZ0. |
View |
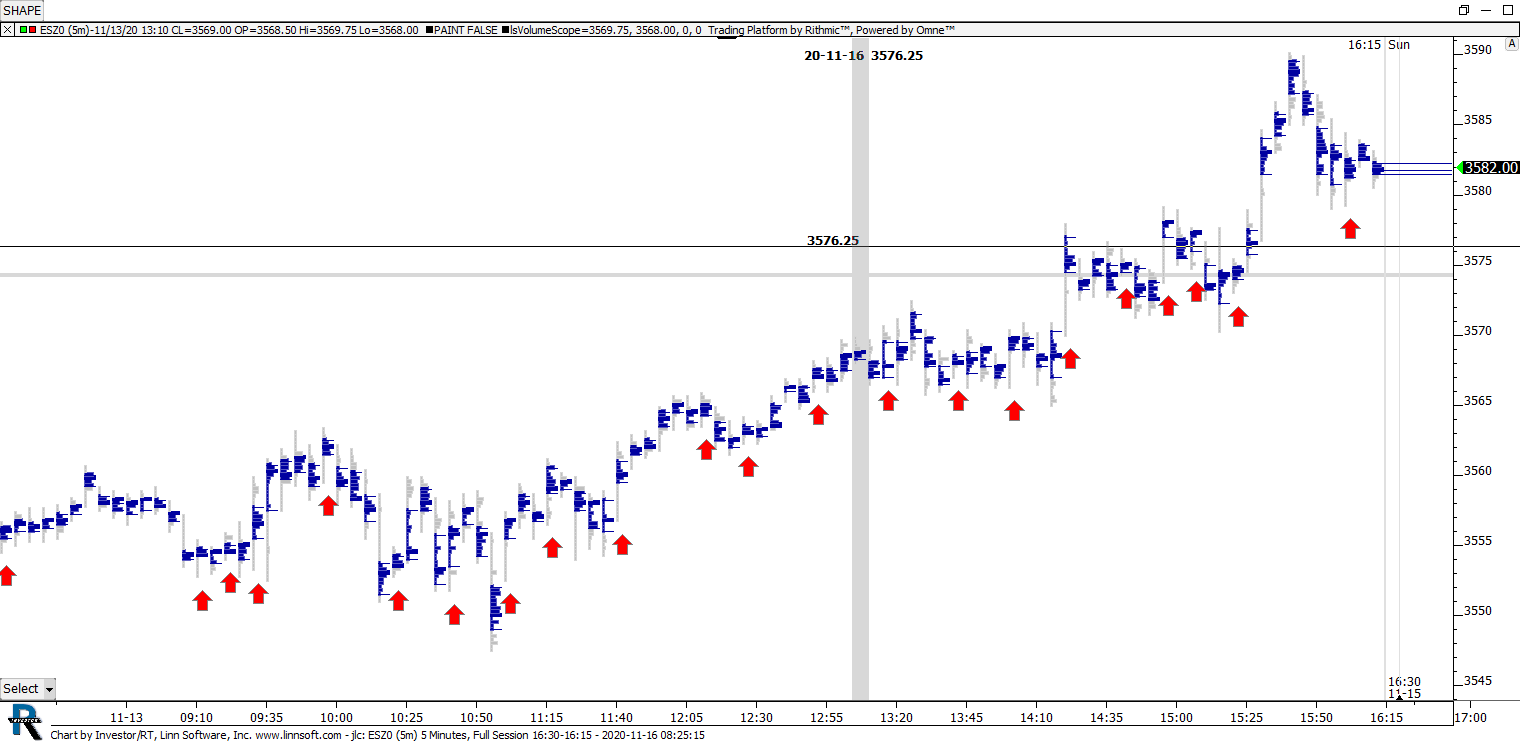 |
jlc (ESZ0) John Croft [totalcount]
5 years 8 months ago
This chart was uploaded by Investor/RT 14.2.4 showing symbol: ESZ0. |
View |
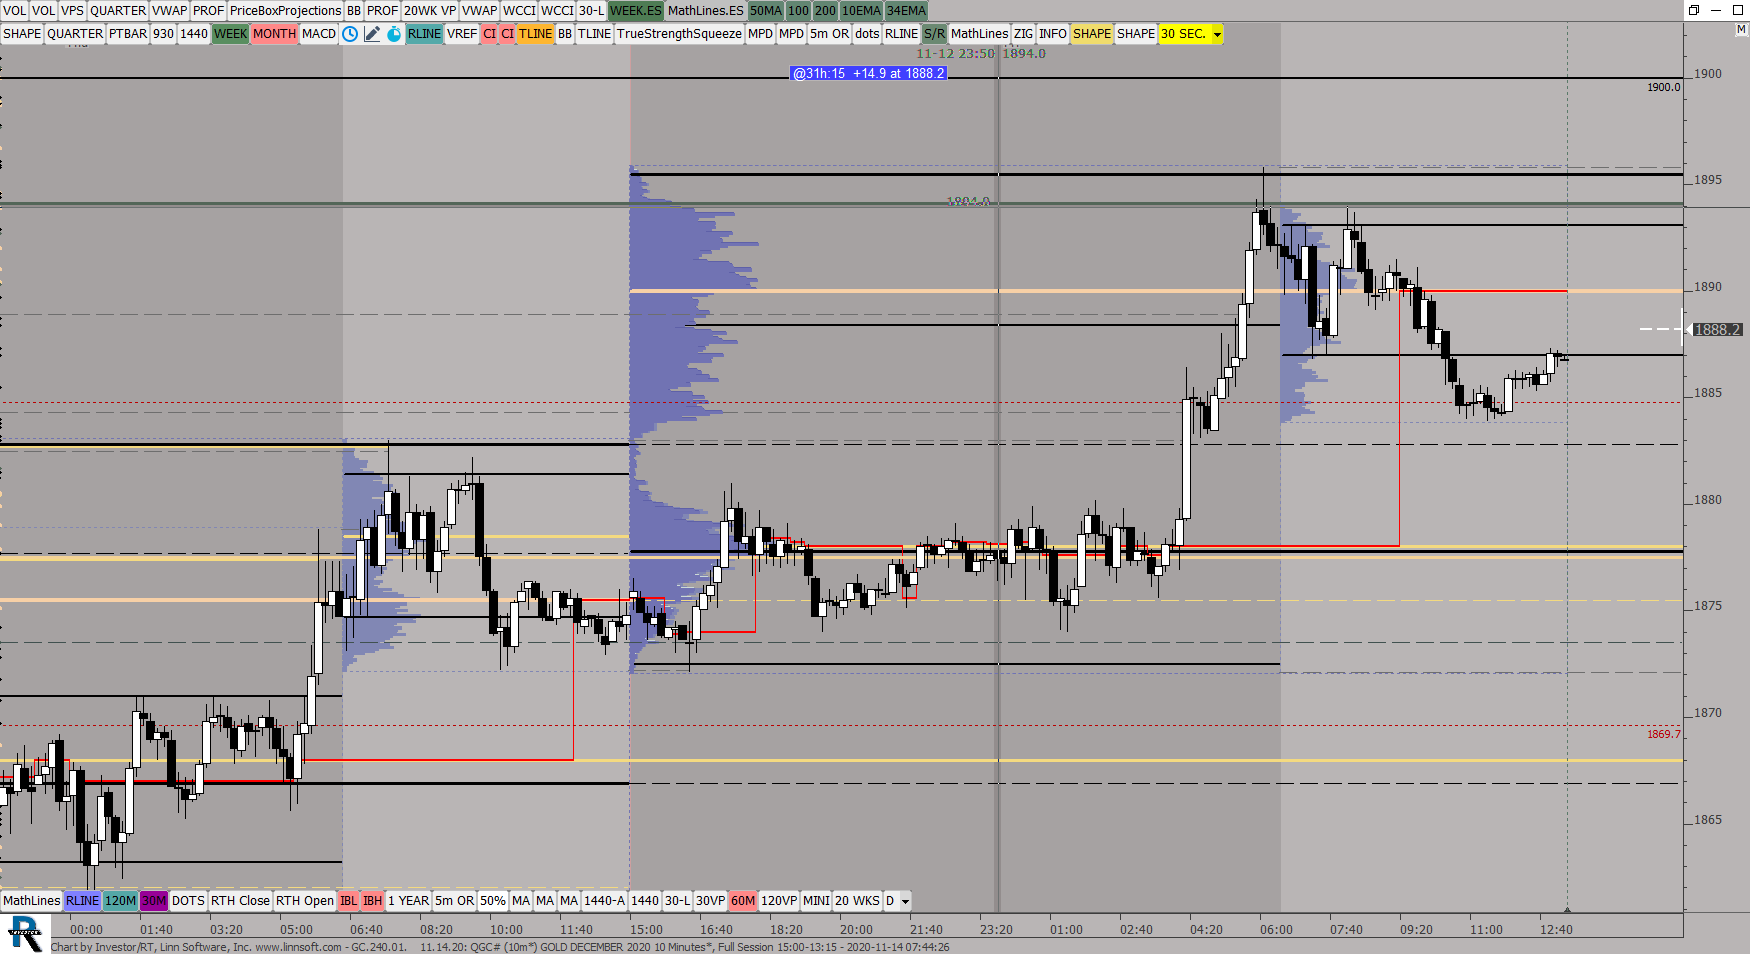 |
GC24001 (QGC#) ES42 [totalcount]
5 years 8 months ago
This chart was uploaded by Investor/RT 14.2.4 showing symbol: QGC#. |
View |
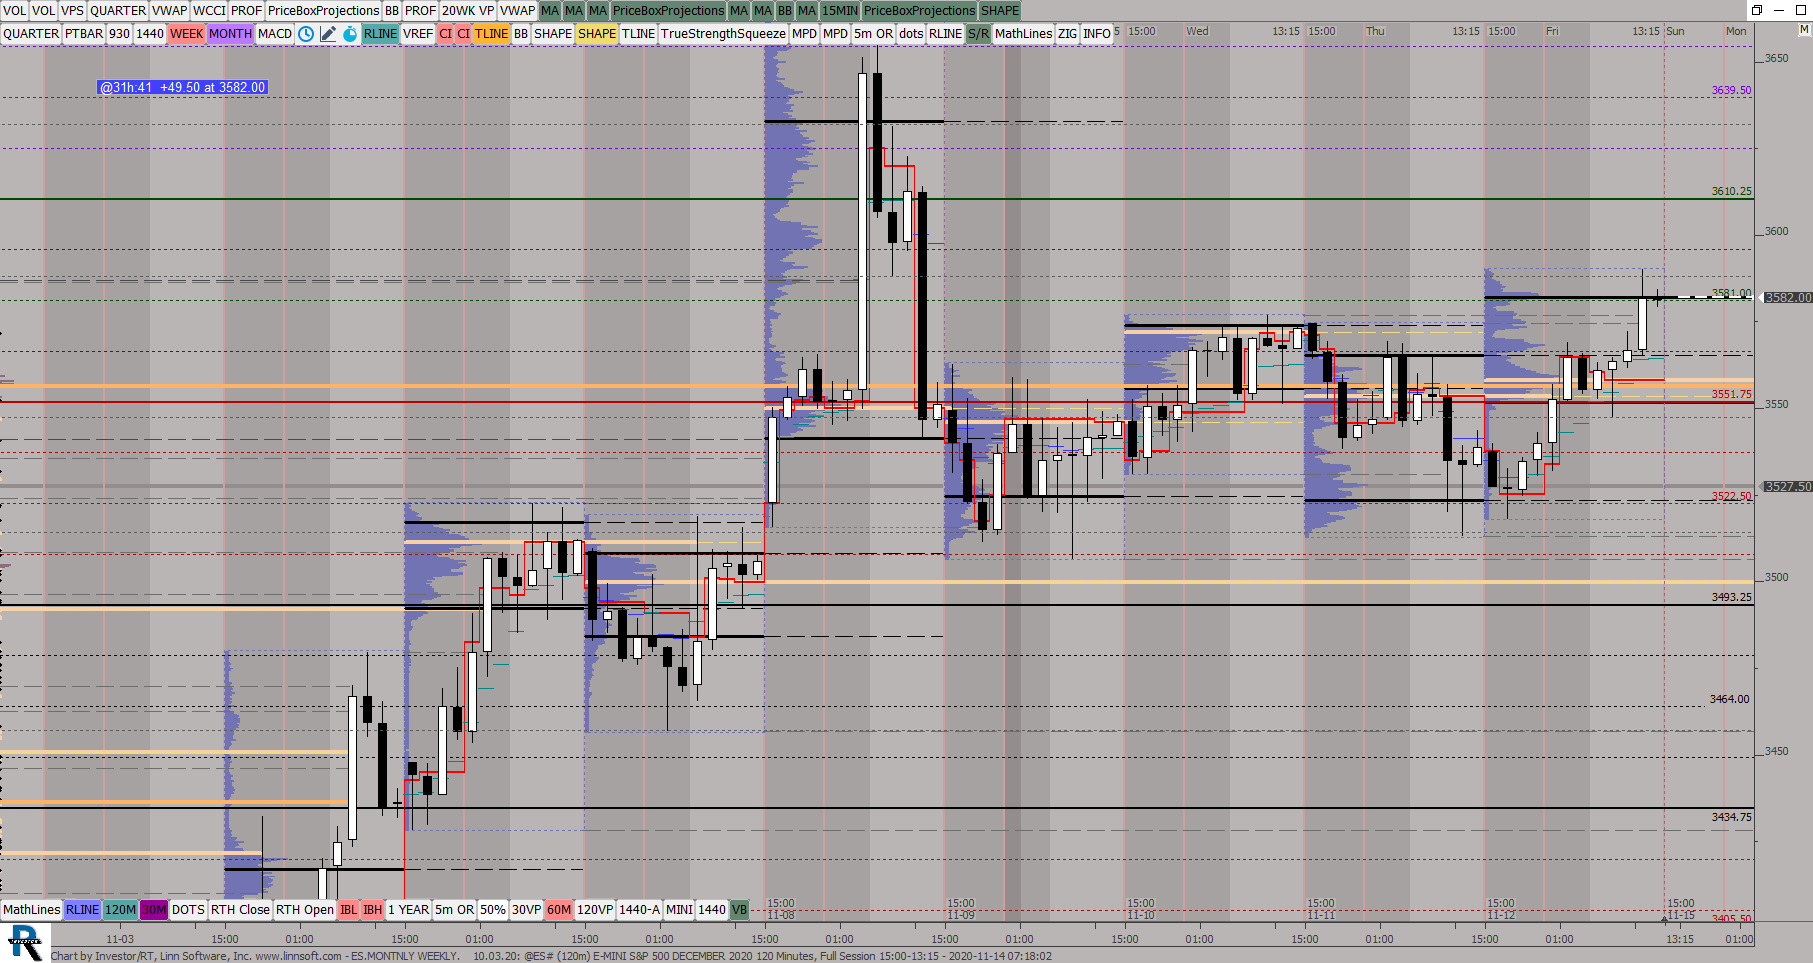 |
ESMONTNLY WEEKLY (@ES#) ES42 [totalcount]
5 years 8 months ago
This chart was uploaded by Investor/RT 14.2.4 showing symbol: @ES#. |
View |
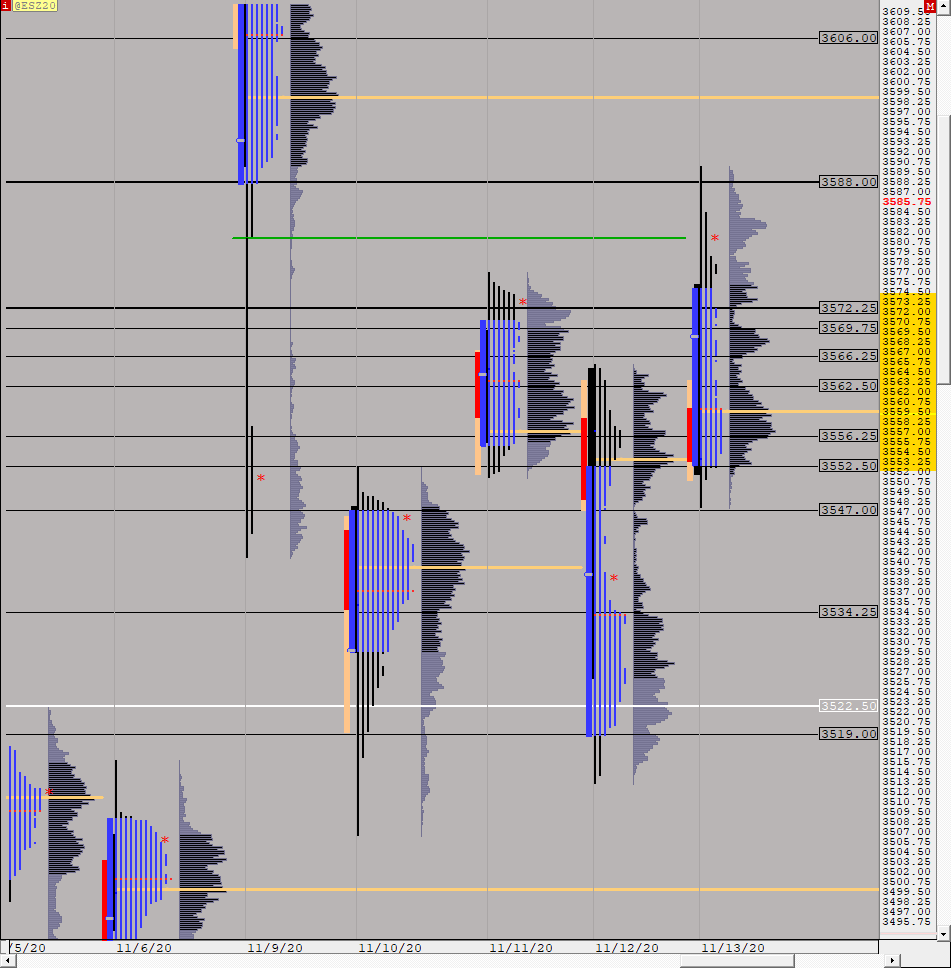 |
ES MP SEPT (@ESZ20) ES42 [totalcount]
5 years 8 months ago
This chart was uploaded by Investor/RT 14.2.4 showing symbol: @ESZ20. |
View |
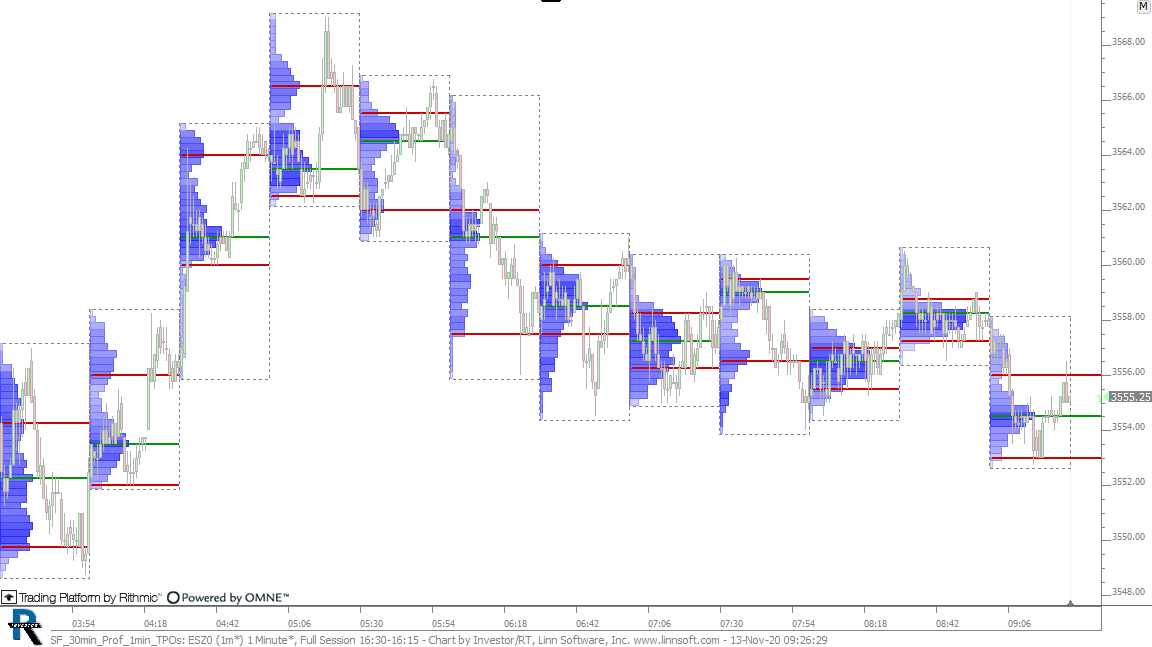 |
SF 30min Prof 1min TPOs (ESZ0) cpayne [totalcount]
5 years 8 months ago
30 Minute Profiles - 1 Min TPOs. This chart was uploaded by Investor/RT 14.2.3 showing symbol: ESZ0. |
View |