 |
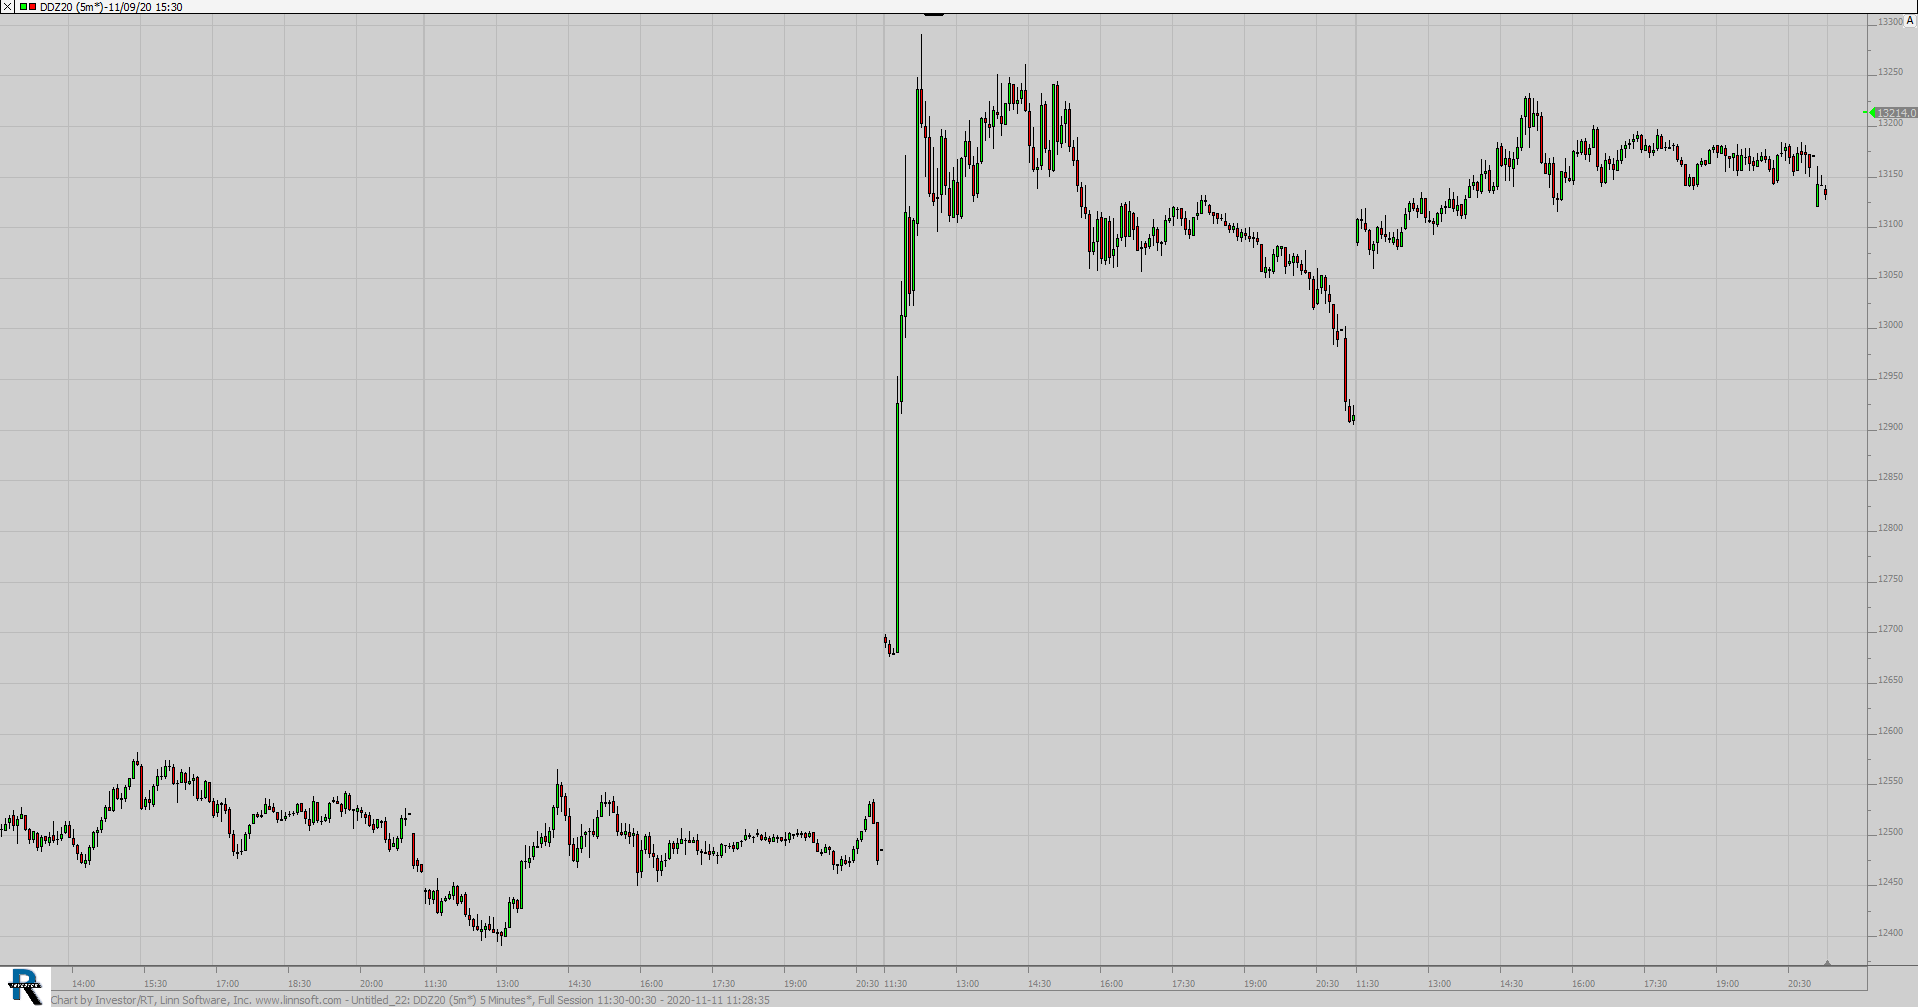
Untitled 22 (DDZ20) Andrew Nicholson [totalcount]
5 years 8 months ago
This chart was uploaded by Investor/RT 14.2.3 showing symbol: DDZ20. |
View |
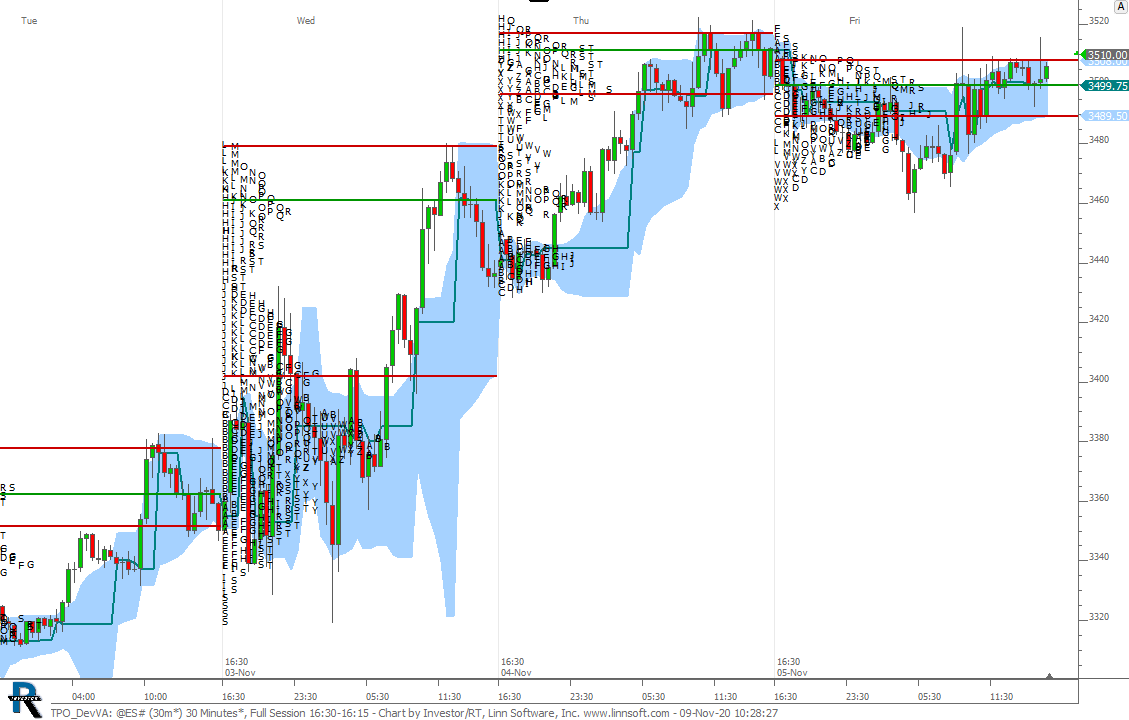 |
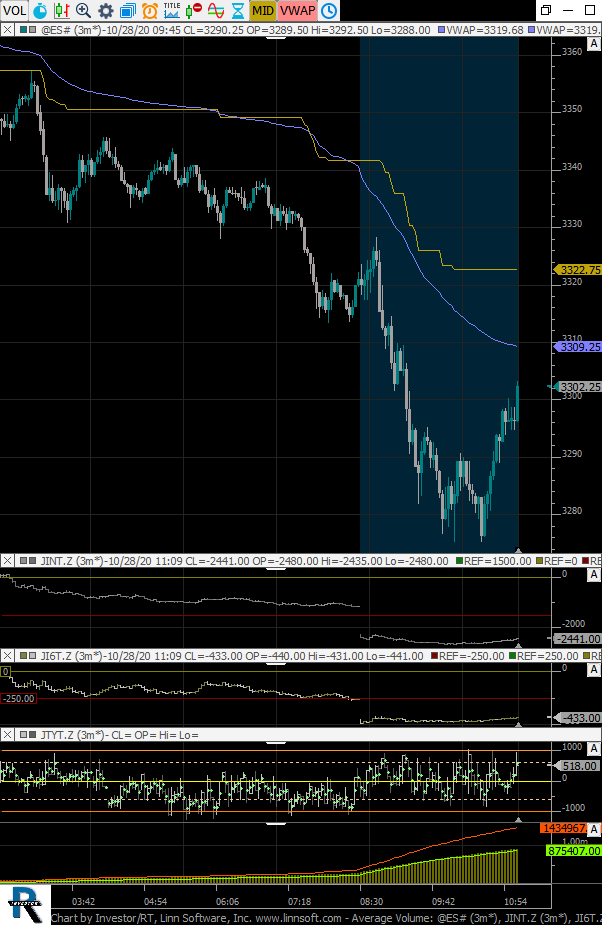
TPO DevVA (@ES#) cpayne [totalcount]
5 years 8 months ago
This chart was uploaded by Investor/RT 14.2.3 showing symbol: @ES#. |
View |
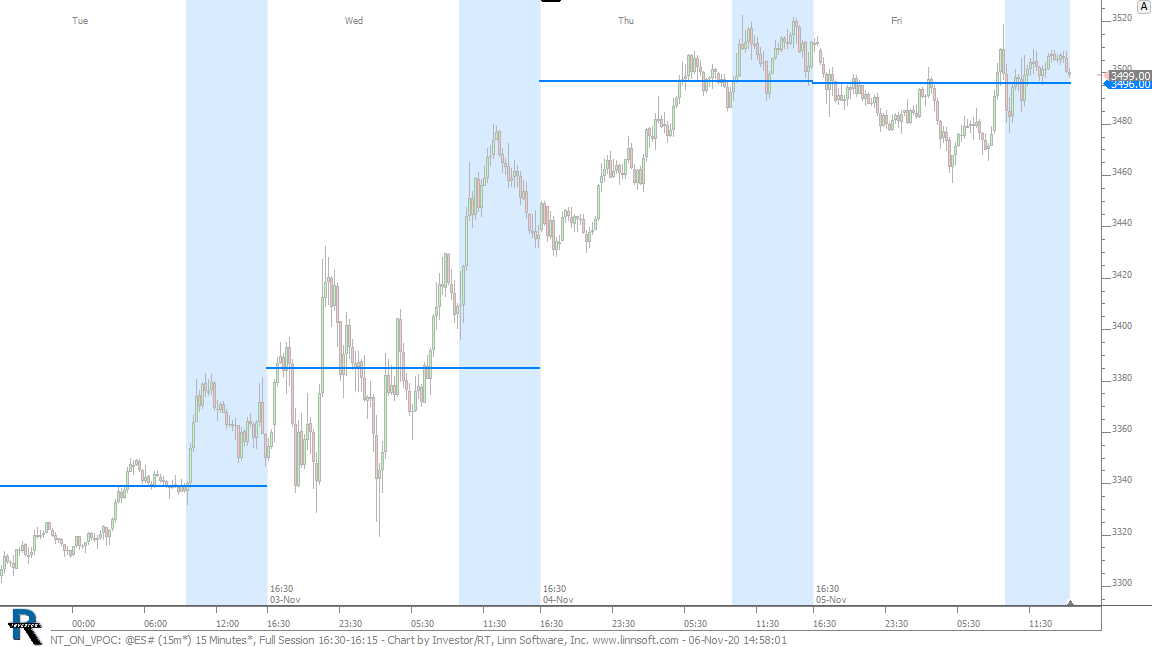 |
NT ON VPOC (@ES#) cpayne [totalcount]
5 years 8 months ago
Overnight VPOC. This chart was uploaded by Investor/RT 14.2.3 showing symbol: @ES#. |
View |
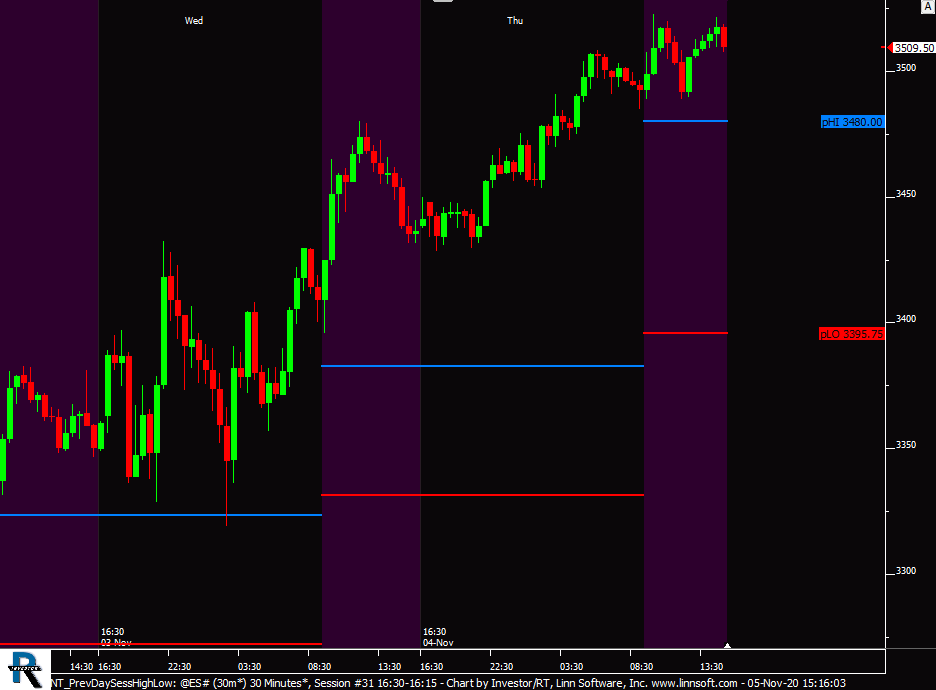 |
NT PrevDaySessHighLow (@ES#) cpayne [totalcount]
5 years 8 months ago
This chart was uploaded by Investor/RT 14.2.3 showing symbol: @ES#. |
View |
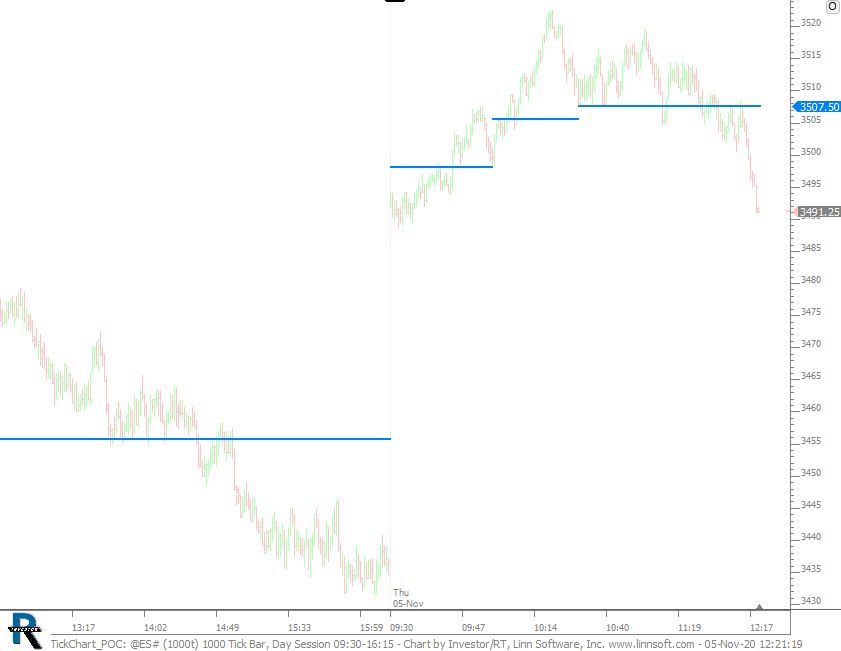 |
TickChart POC (@ES#) cpayne [totalcount]
5 years 8 months ago
Devloping Time-Based POC on Tickbar Chart. This chart was uploaded by Investor/RT 14.2.3 showing symbol: @ES#. |
View |
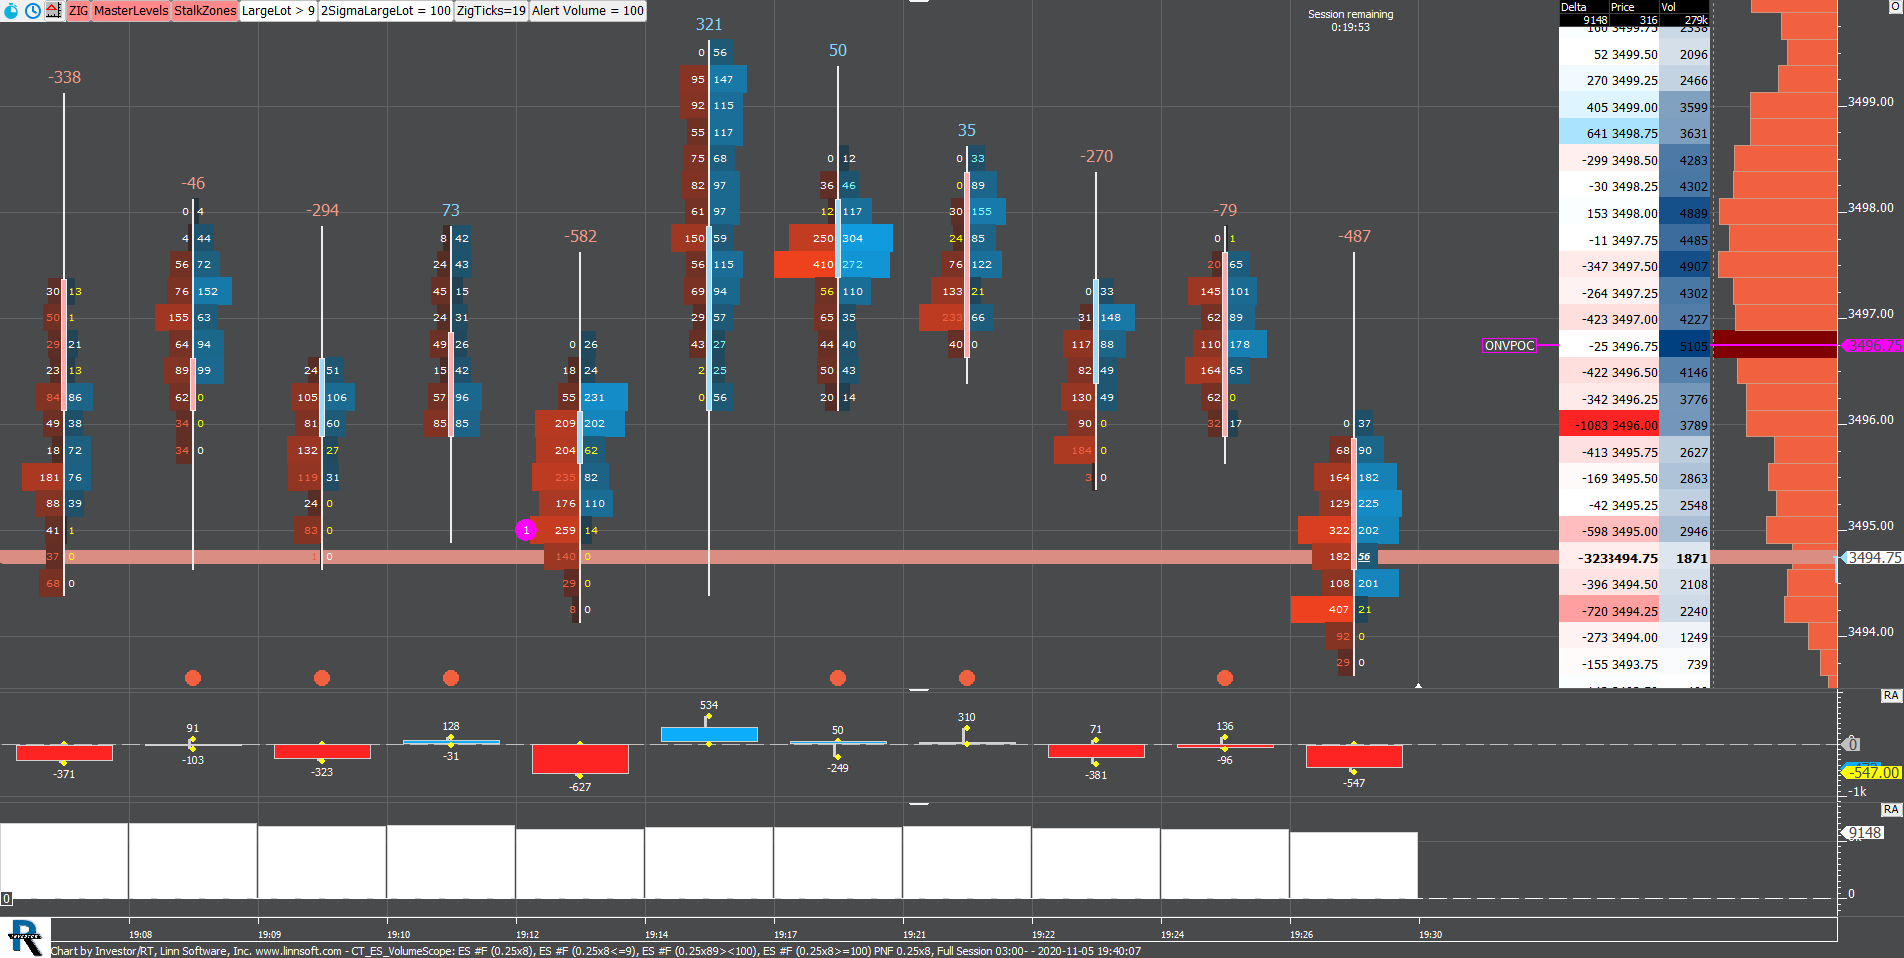 |
CT ES VolumeScope (ES #F) Govind Srinivasan [totalcount]
5 years 8 months ago
Vol Scope_FT71. This chart was uploaded by Investor/RT 14.2.3 showing symbol: ES #F. |
View |
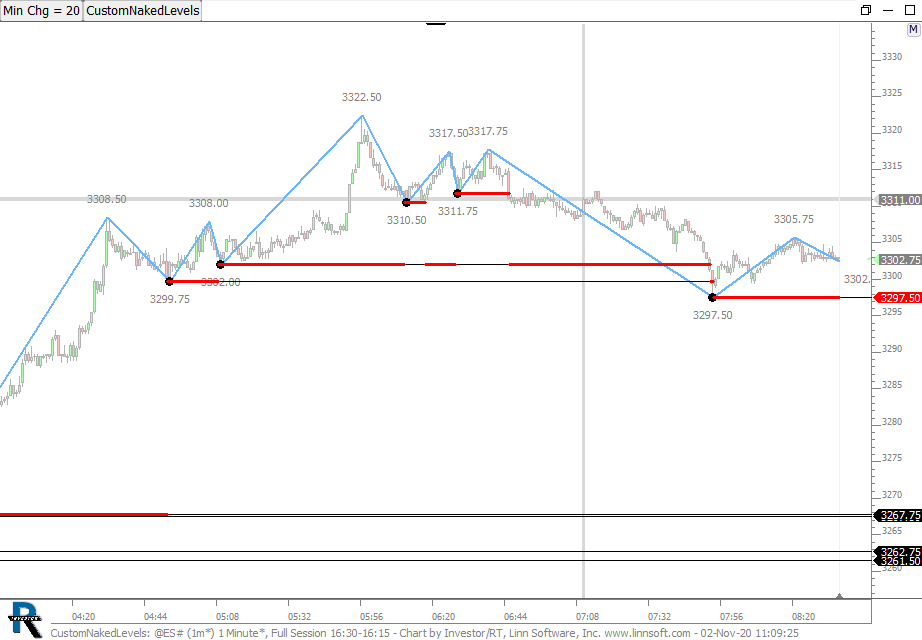 |
CustomNakedLevels (@ES#) cpayne [totalcount]
5 years 9 months ago
This chart was uploaded by Investor/RT 14.2.2 showing symbol: @ES#. |
View |
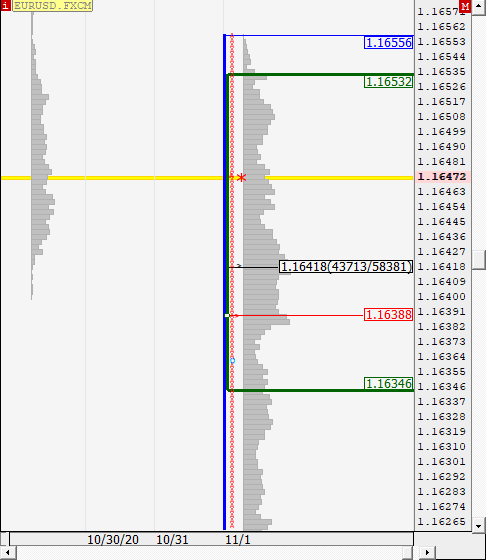 |
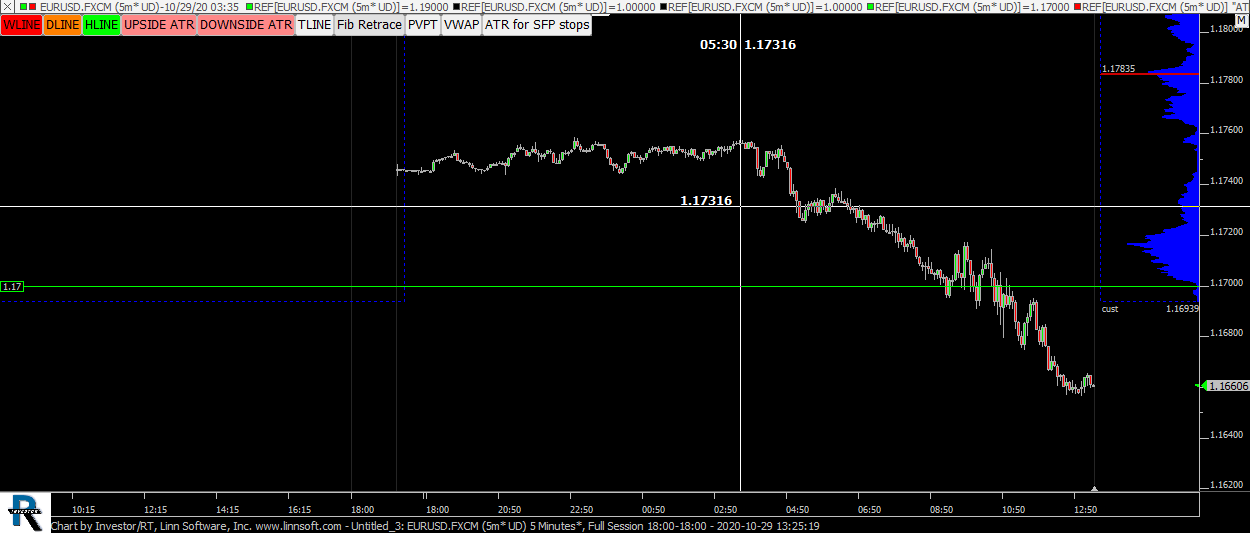
MP (EURUSD.FXCM) Marcelo Garcia Gonzalez [totalcount]
5 years 9 months ago
This chart was uploaded by Investor/RT 14.2.2 showing symbol: EURUSD.FXCM. |
View |
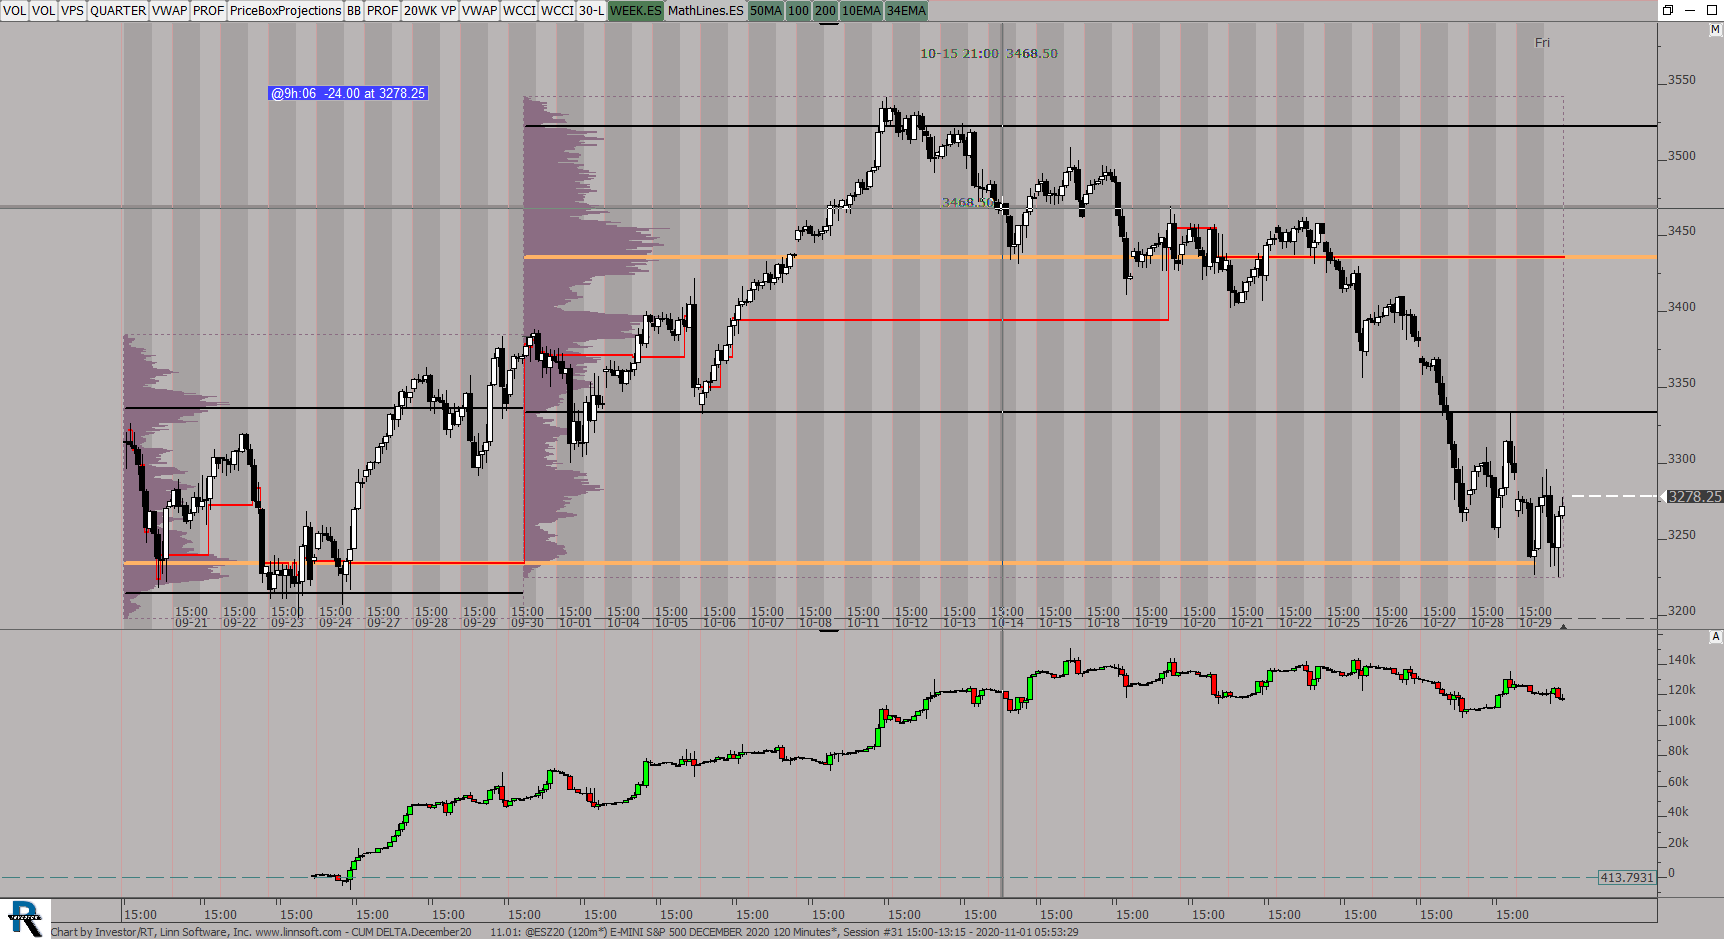 |
CUM DELTADecember20 (@ESZ20) ES42 [totalcount]
5 years 9 months ago
CUM DELTA_DECEMBER to Date 11.01.20. This chart was uploaded by Investor/RT 14.2.1 showing symbol: @ESZ20. |
View |
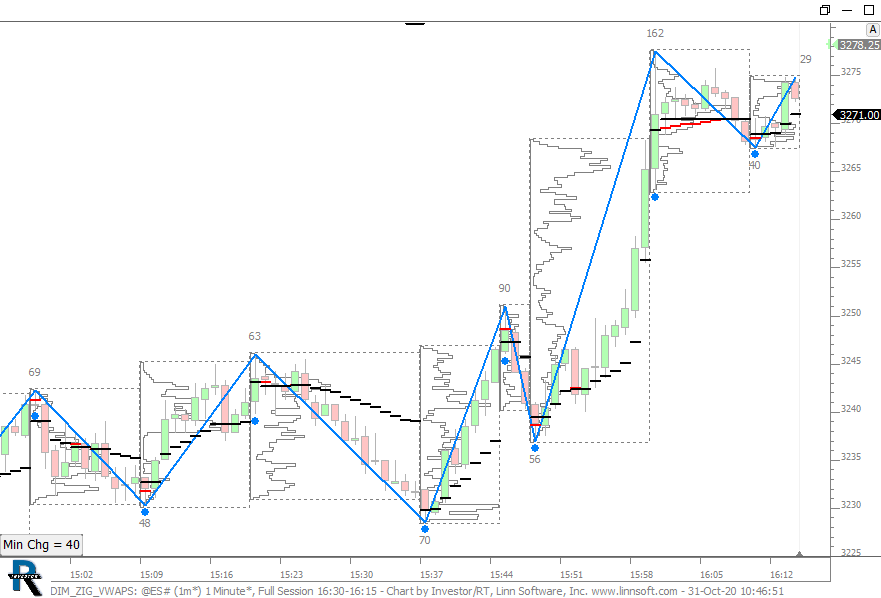 |
DIM ZIG VWAPS (@ES#) cpayne [totalcount]
5 years 9 months ago
This chart was uploaded by Investor/RT 14.2.2 showing symbol: @ES#. |
View |
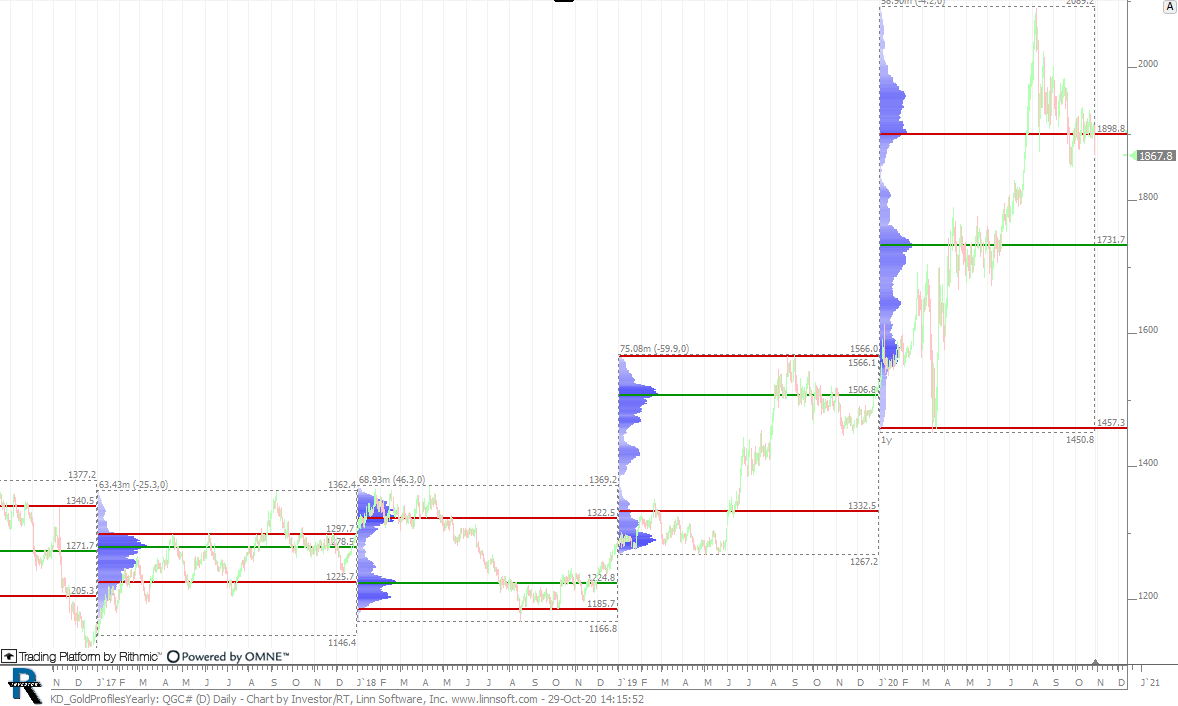 |
KD GoldProfilesYearly (QGC#) cpayne [totalcount]
5 years 9 months ago
This chart was uploaded by Investor/RT 14.2.2 showing symbol: QGC#. |
View |
 |
Untitled 3 (EURUSD.FXCM) Marcelo Garcia Gonzalez [totalcount]
5 years 9 months ago
This chart was uploaded by Investor/RT 14.2.2 showing symbol: EURUSD.FXCM. |
View |
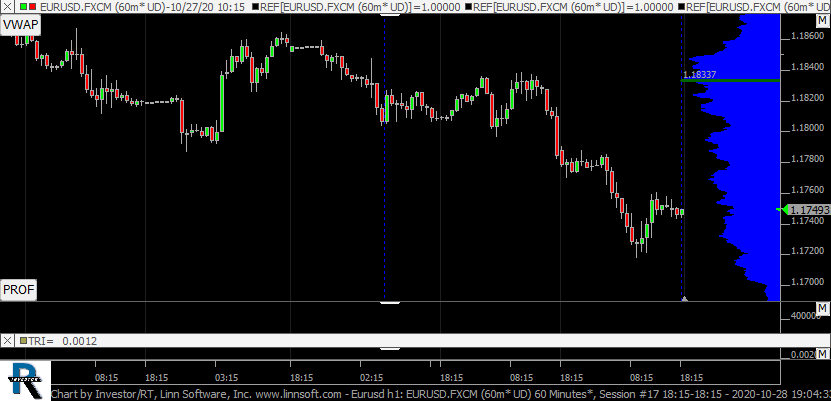 |
Eurusd h1 (EURUSD.FXCM) Marcelo Garcia Gonzalez [totalcount]
5 years 9 months ago
This chart was uploaded by Investor/RT 14.2.2 showing symbol: EURUSD.FXCM. |
View |
 |
YM (@YM#) ditekinc [totalcount]
5 years 9 months ago
This chart was uploaded by Investor/RT 14.2.1 showing symbol: @YM#. |
View |
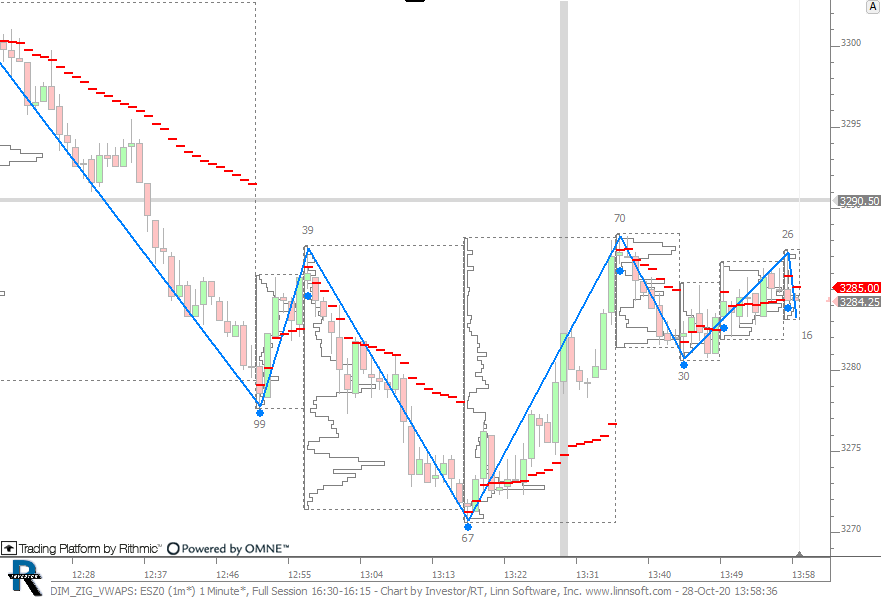 |
DIM ZIG VWAPS (ESZ0) cpayne [totalcount]
5 years 9 months ago
VWAPs of Zig Zag Waves. This chart was uploaded by Investor/RT 14.2.2 showing symbol: ESZ0. |
View |
 |
NQ (@NQ#) ditekinc [totalcount]
5 years 9 months ago
This chart was uploaded by Investor/RT 14.2.1 showing symbol: @NQ#. |
View |
 |
Average Volume (@ES#) ditekinc [totalcount]
5 years 9 months ago
This chart was uploaded by Investor/RT 14.2.1 showing symbol: @ES#. |
View |
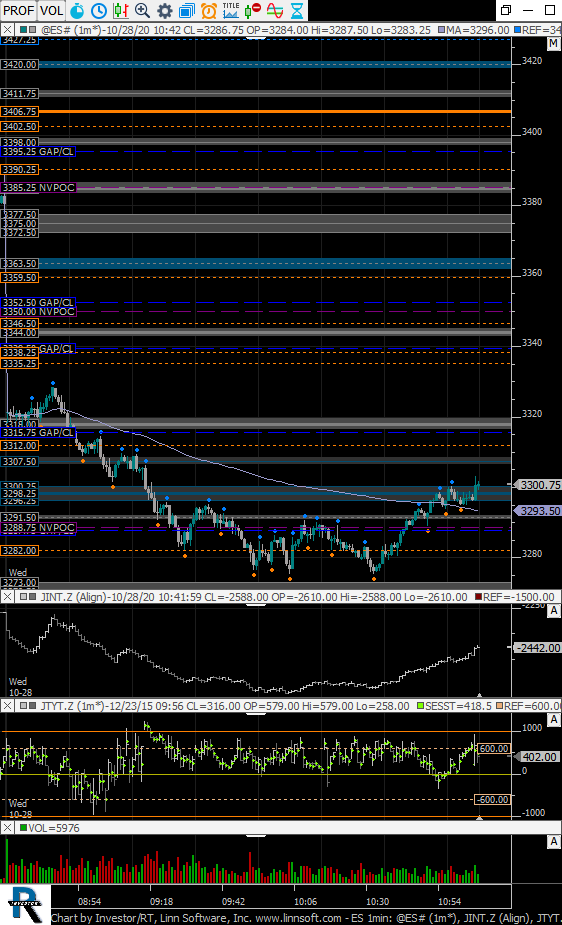 |
ES 1min (@ES#) ditekinc [totalcount]
5 years 9 months ago
This chart was uploaded by Investor/RT 14.2.1 showing symbol: @ES#. |
View |
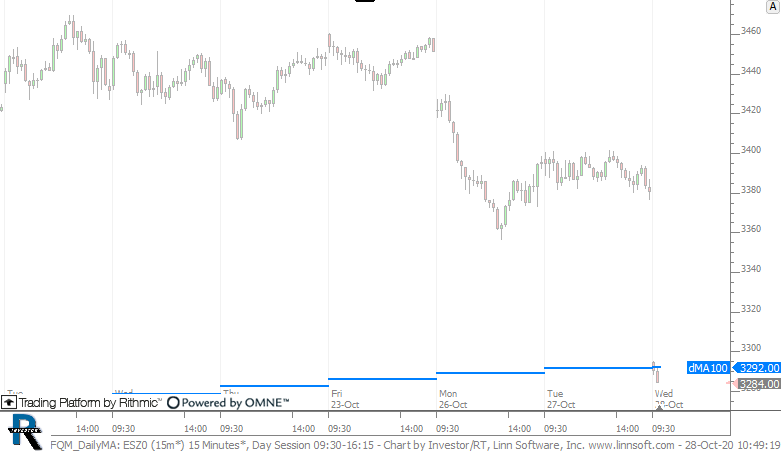 |
FQM DailyMA (ESZ0) cpayne [totalcount]
5 years 9 months ago
This chart was uploaded by Investor/RT 14.2.2 showing symbol: ESZ0. |
View |
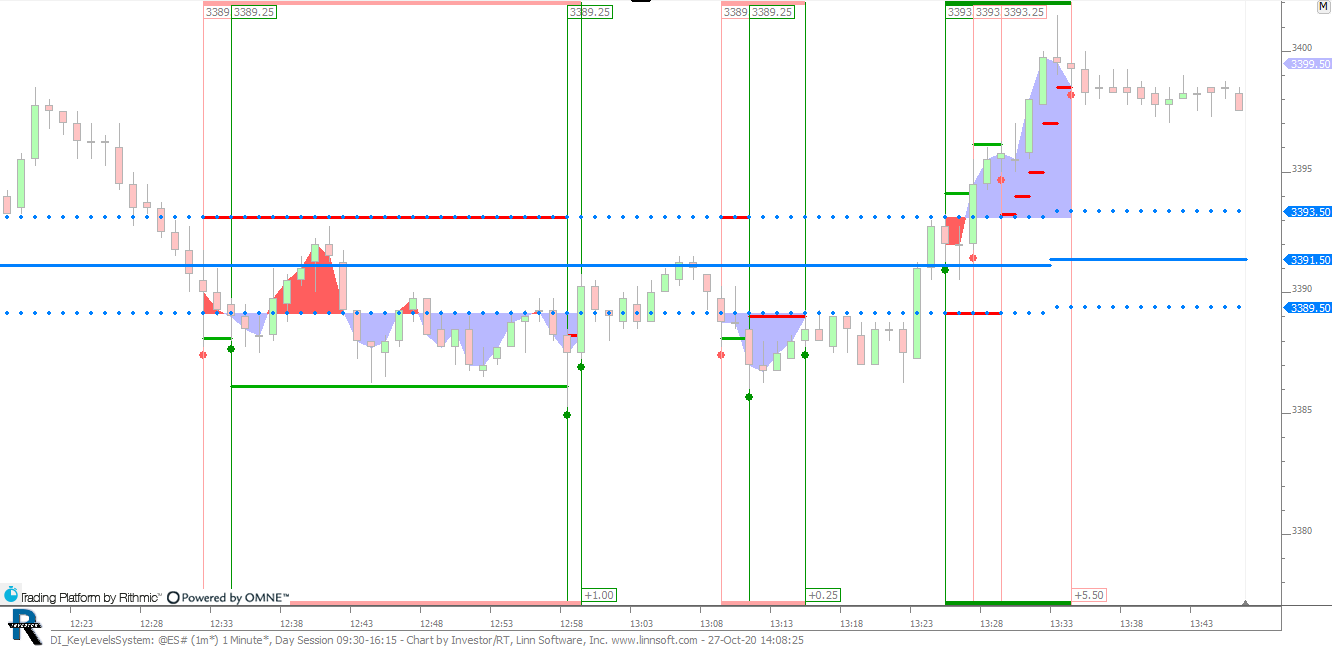 |
DI KeyLevelsSystem (@ES#) cpayne [totalcount]
5 years 9 months ago
Key Level Trading System. This chart was uploaded by Investor/RT 14.2.1 showing symbol: @ES#. |
View |
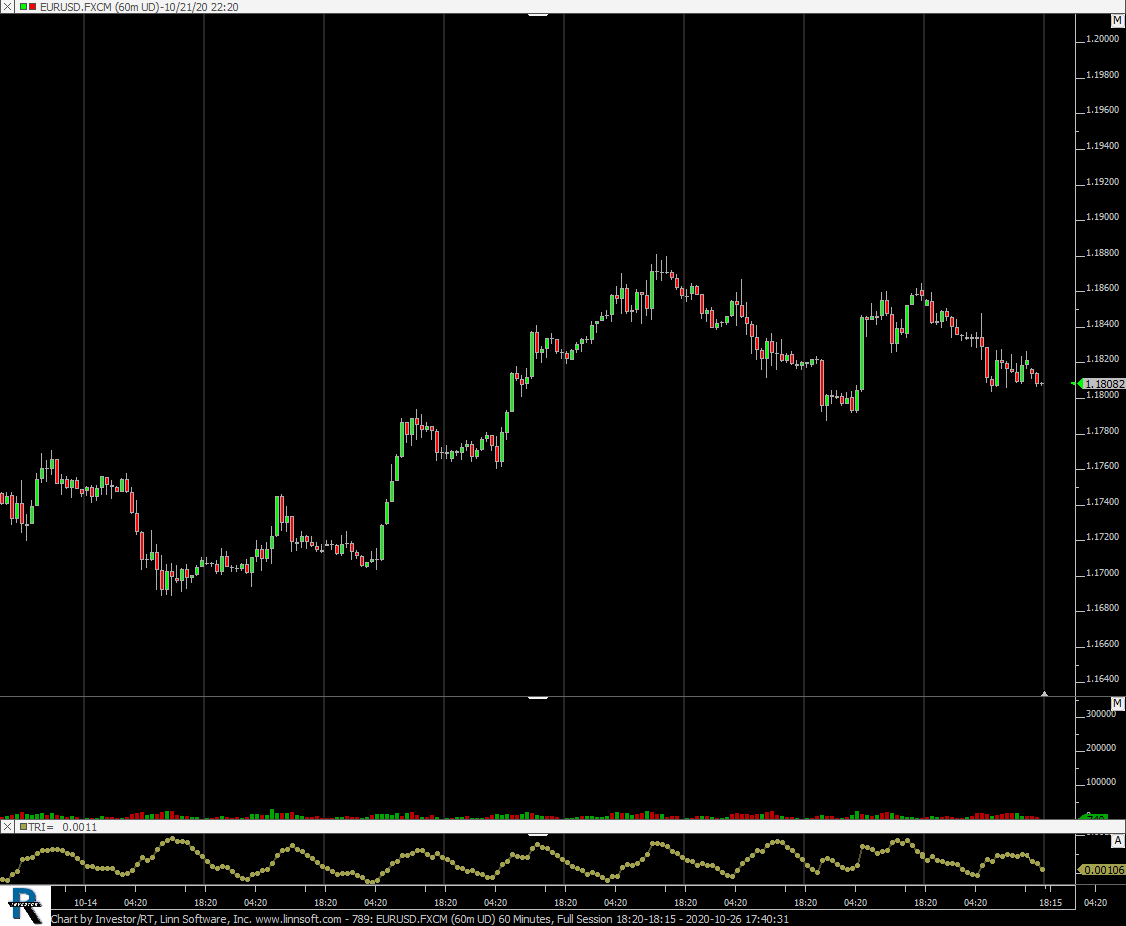 |
789 (EURUSD.FXCM) Marcelo Garcia Gonzalez [totalcount]
5 years 9 months ago
This chart was uploaded by Investor/RT 14.2.2 showing symbol: EURUSD.FXCM. |
View |
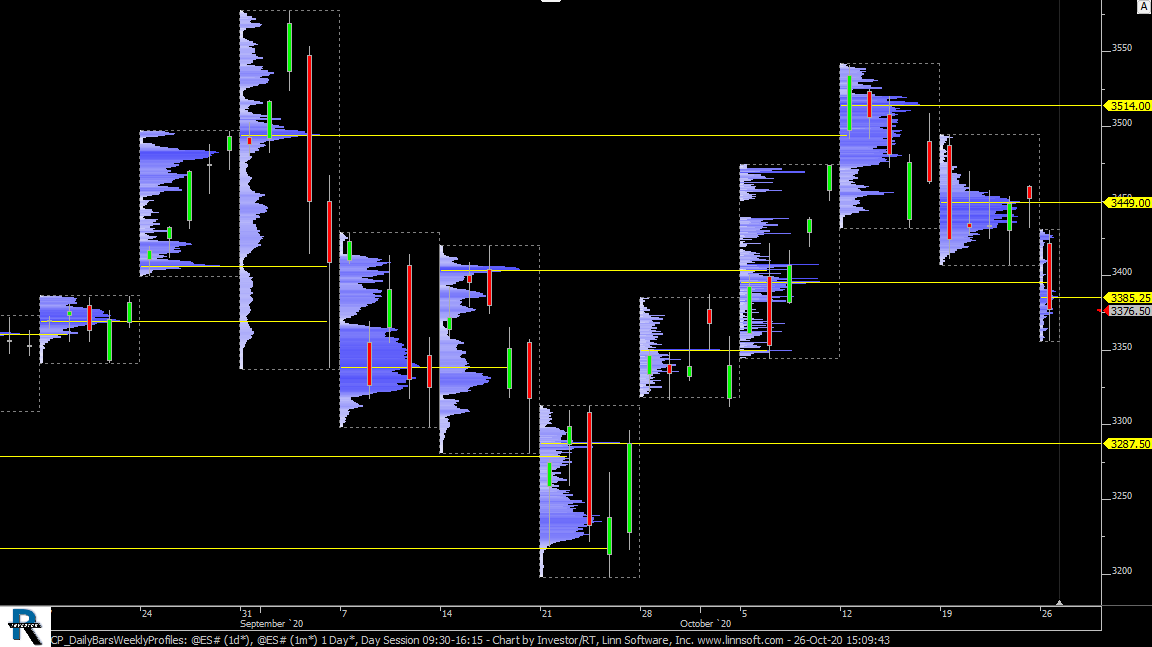 |
CP DailyBarsWeeklyProfiles (@ES#) cpayne [totalcount]
5 years 9 months ago
Daily Bars - Weekly Profiles. This chart was uploaded by Investor/RT 14.2.2 showing symbol: @ES#. |
View |
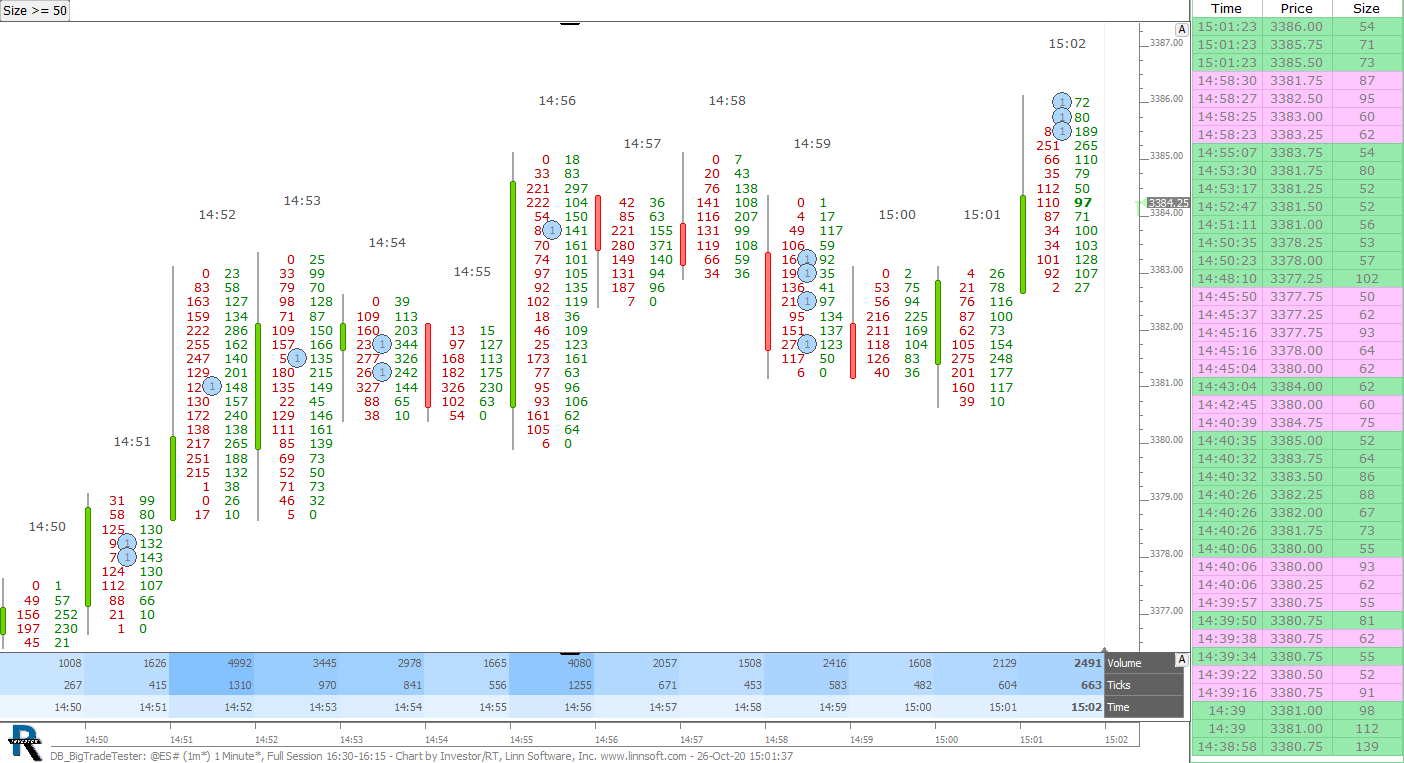 |
DB BigTradeTester (@ES#) cpayne [totalcount]
5 years 9 months ago
This chart was uploaded by Investor/RT 14.2.2 showing symbol: @ES#. |
View |
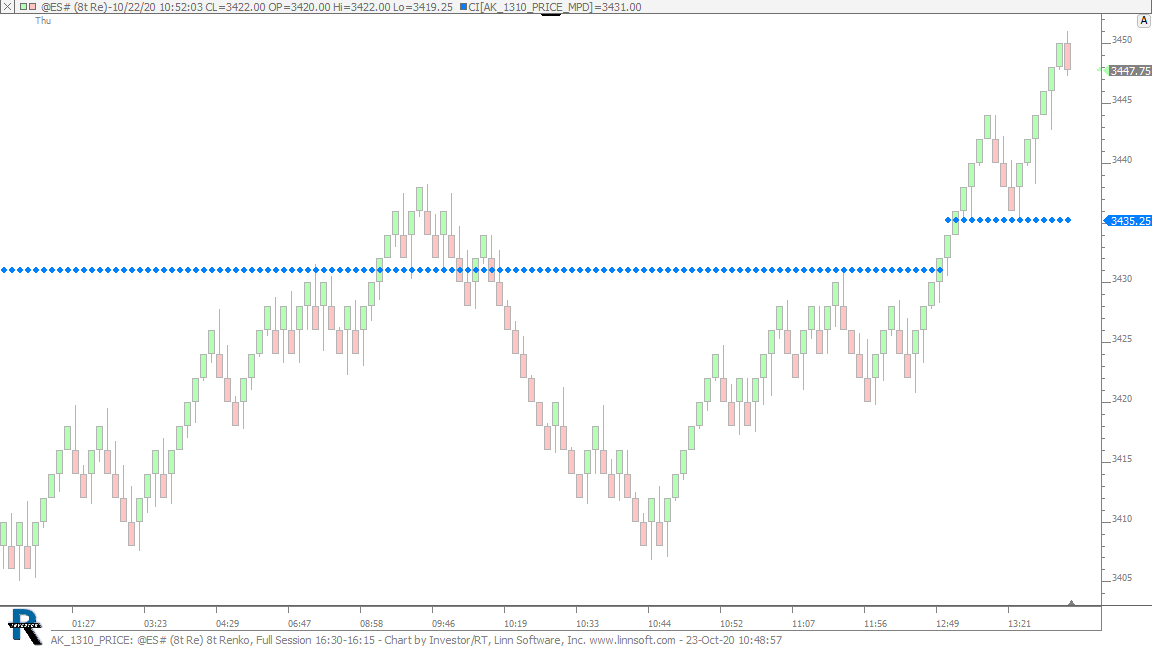 |
AK 1310 PRICE (@ES#) cpayne [totalcount]
5 years 9 months ago
Price at 13:10 on Renko Chart. This chart was uploaded by Investor/RT 14.2.2 showing symbol: @ES#. |
View |
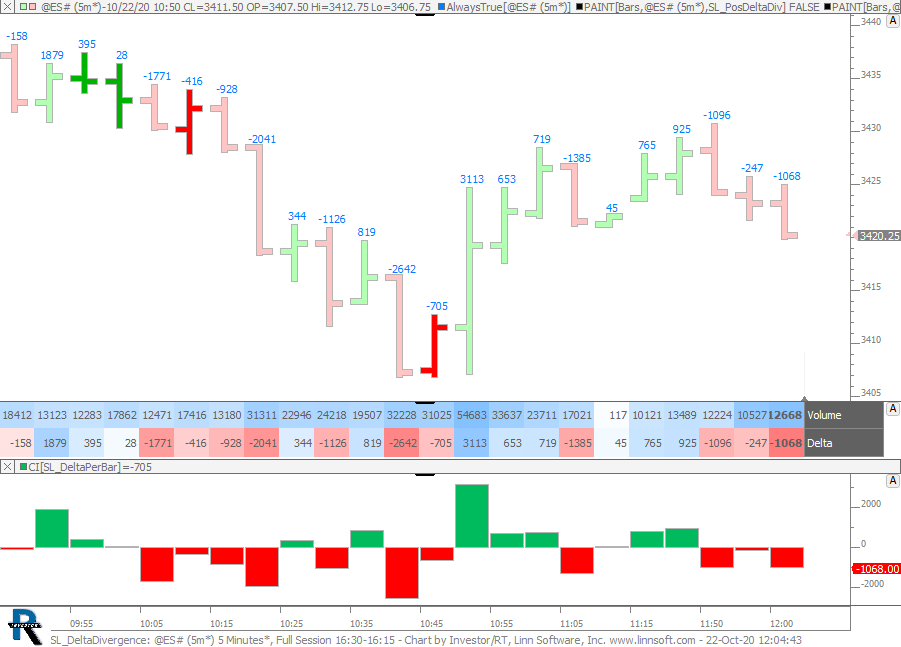 |
SL DeltaDivergence (@ES#) cpayne [totalcount]
5 years 9 months ago
Delta Divergence. This chart was uploaded by Investor/RT 14.2.2 showing symbol: @ES#. |
View |